
Effects of Hypocalcemic Vitamin D Analogs in the Expression of DNA Damage Induced in Minilungs from hESCs: Implications for Lung Fibrosis


Abstract
:1. Introduction
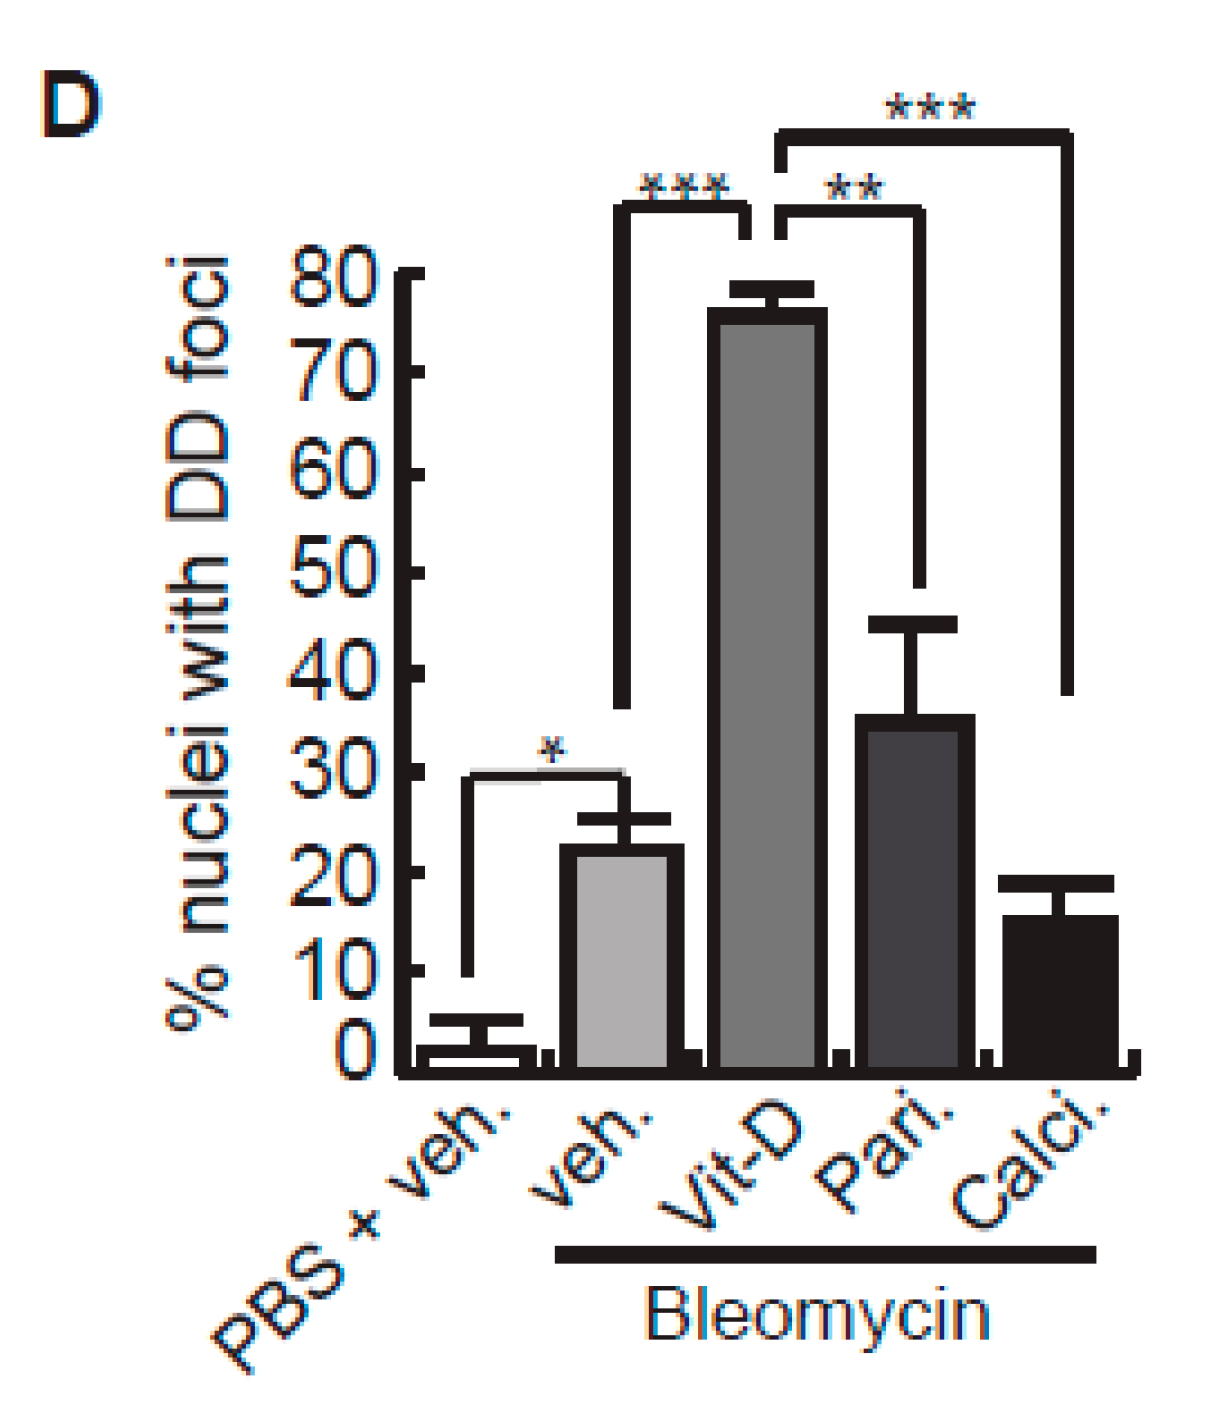
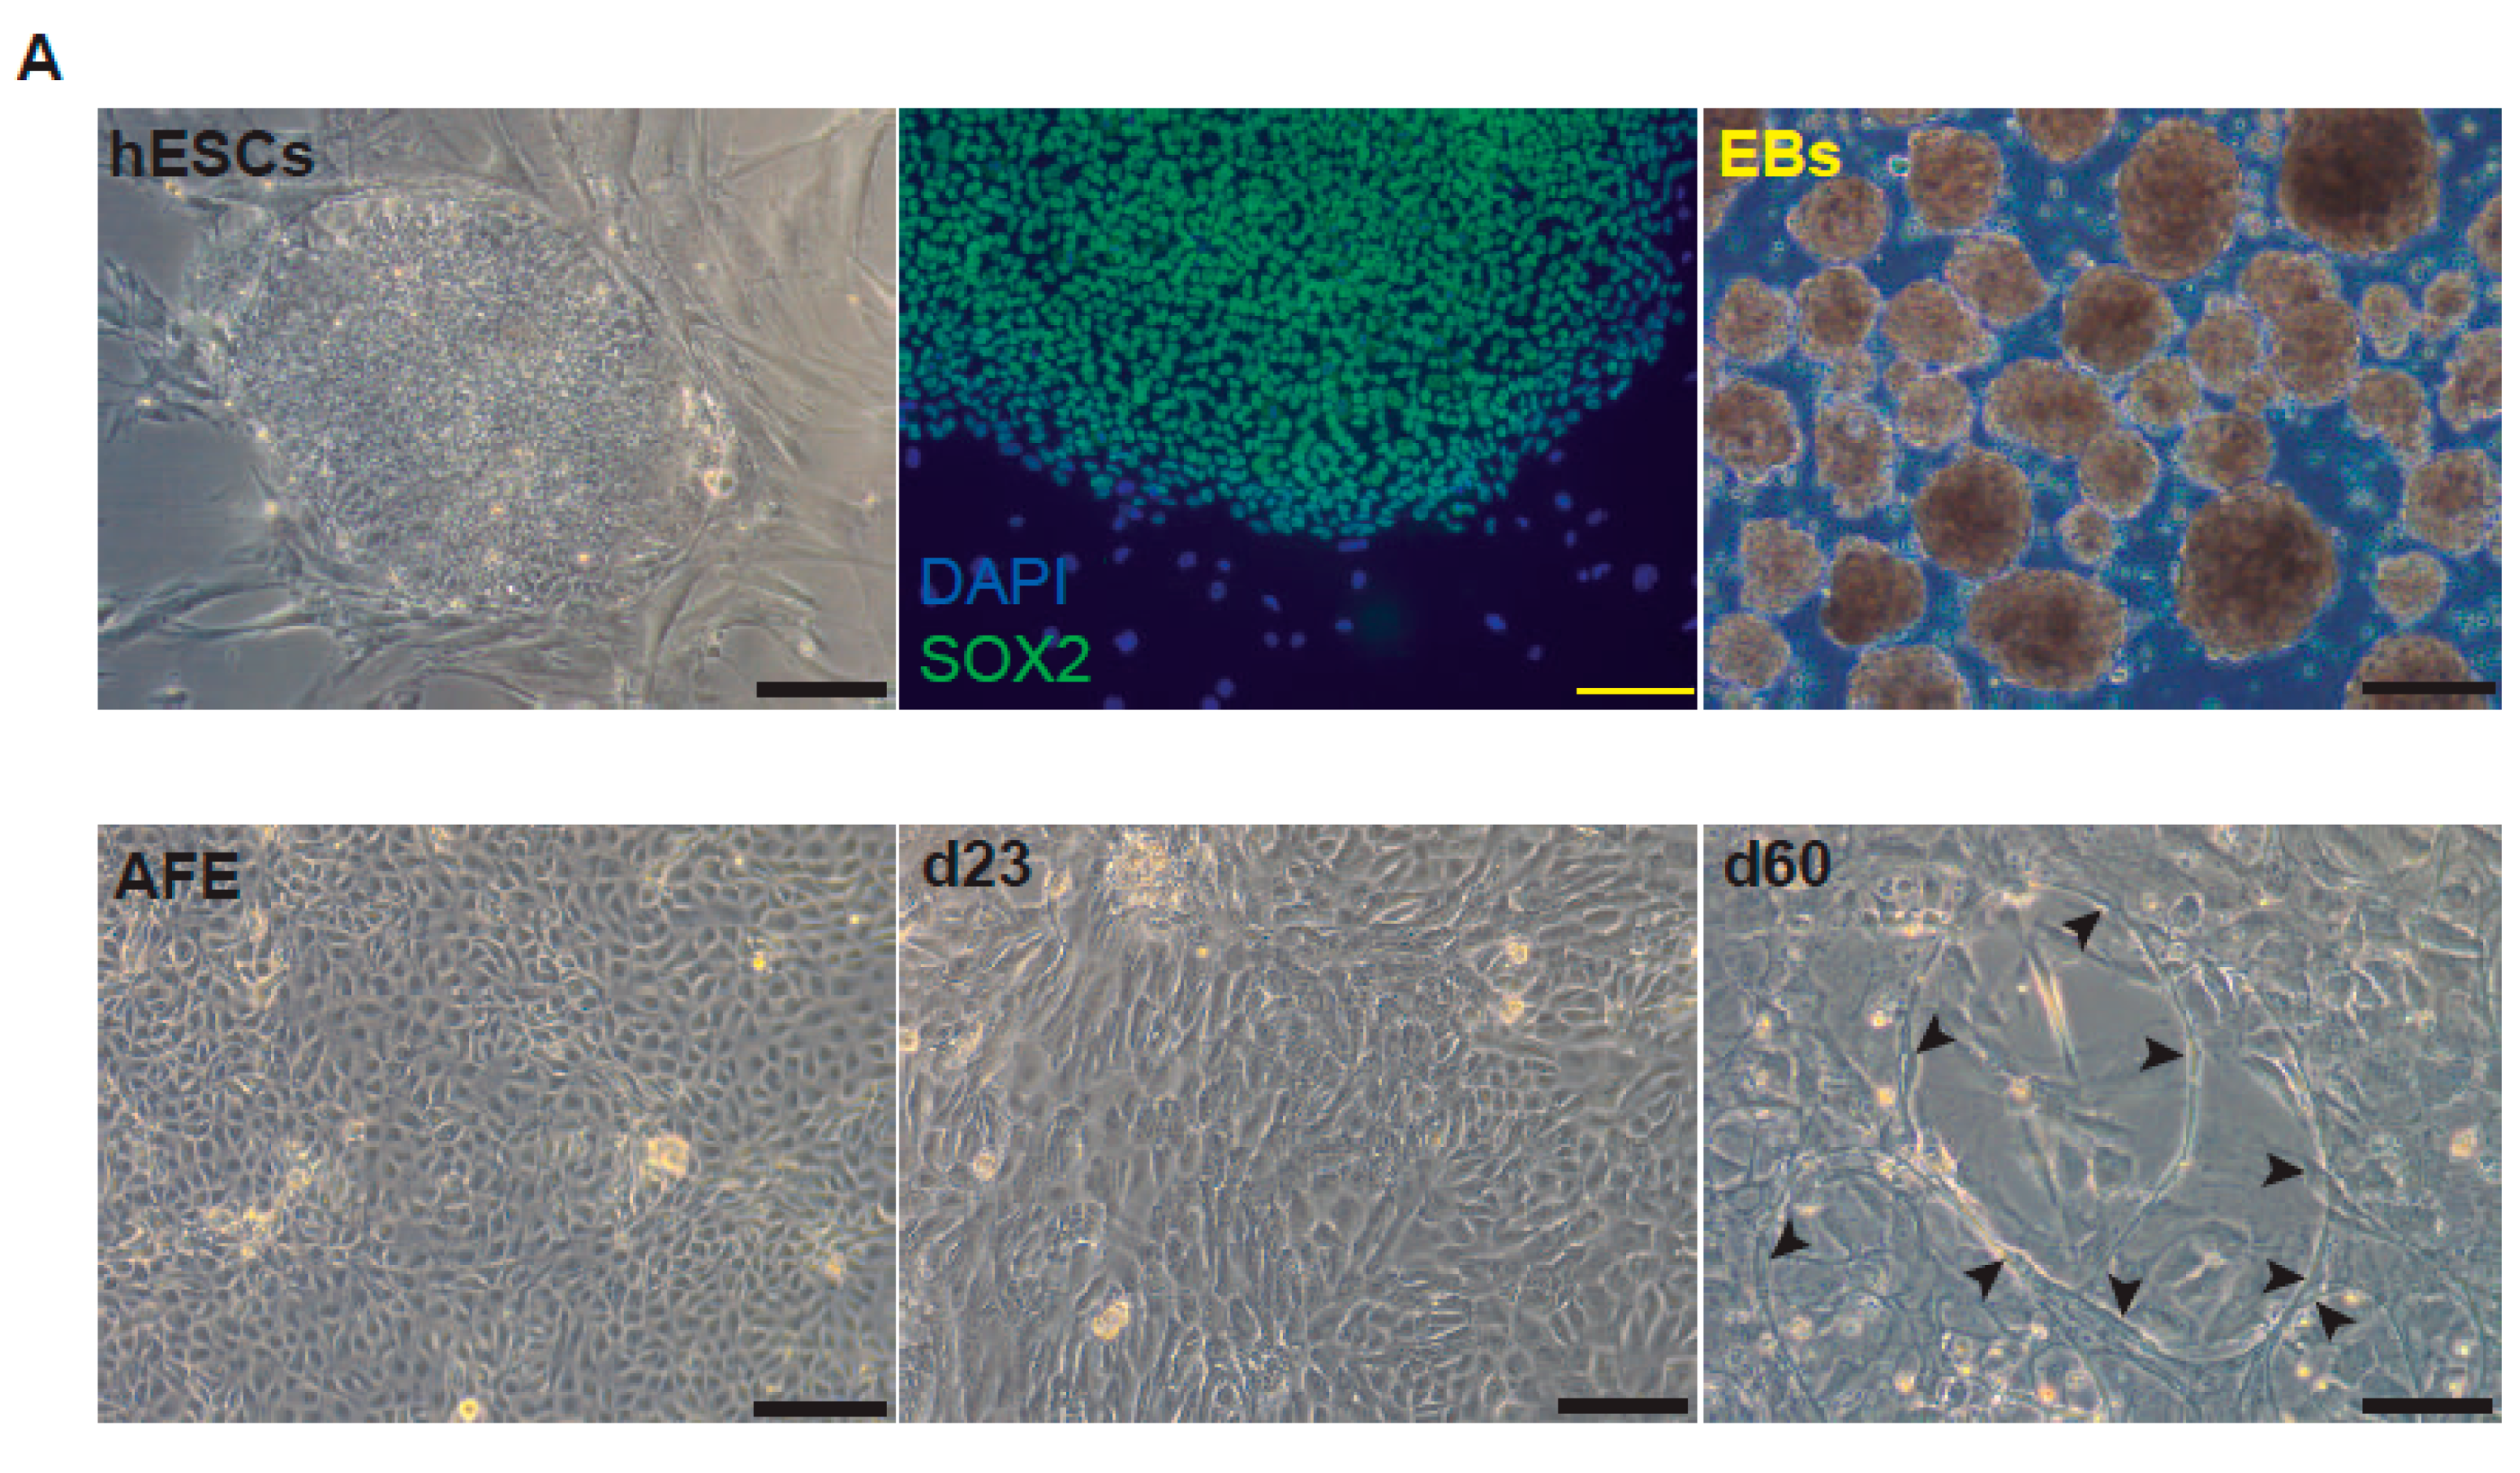
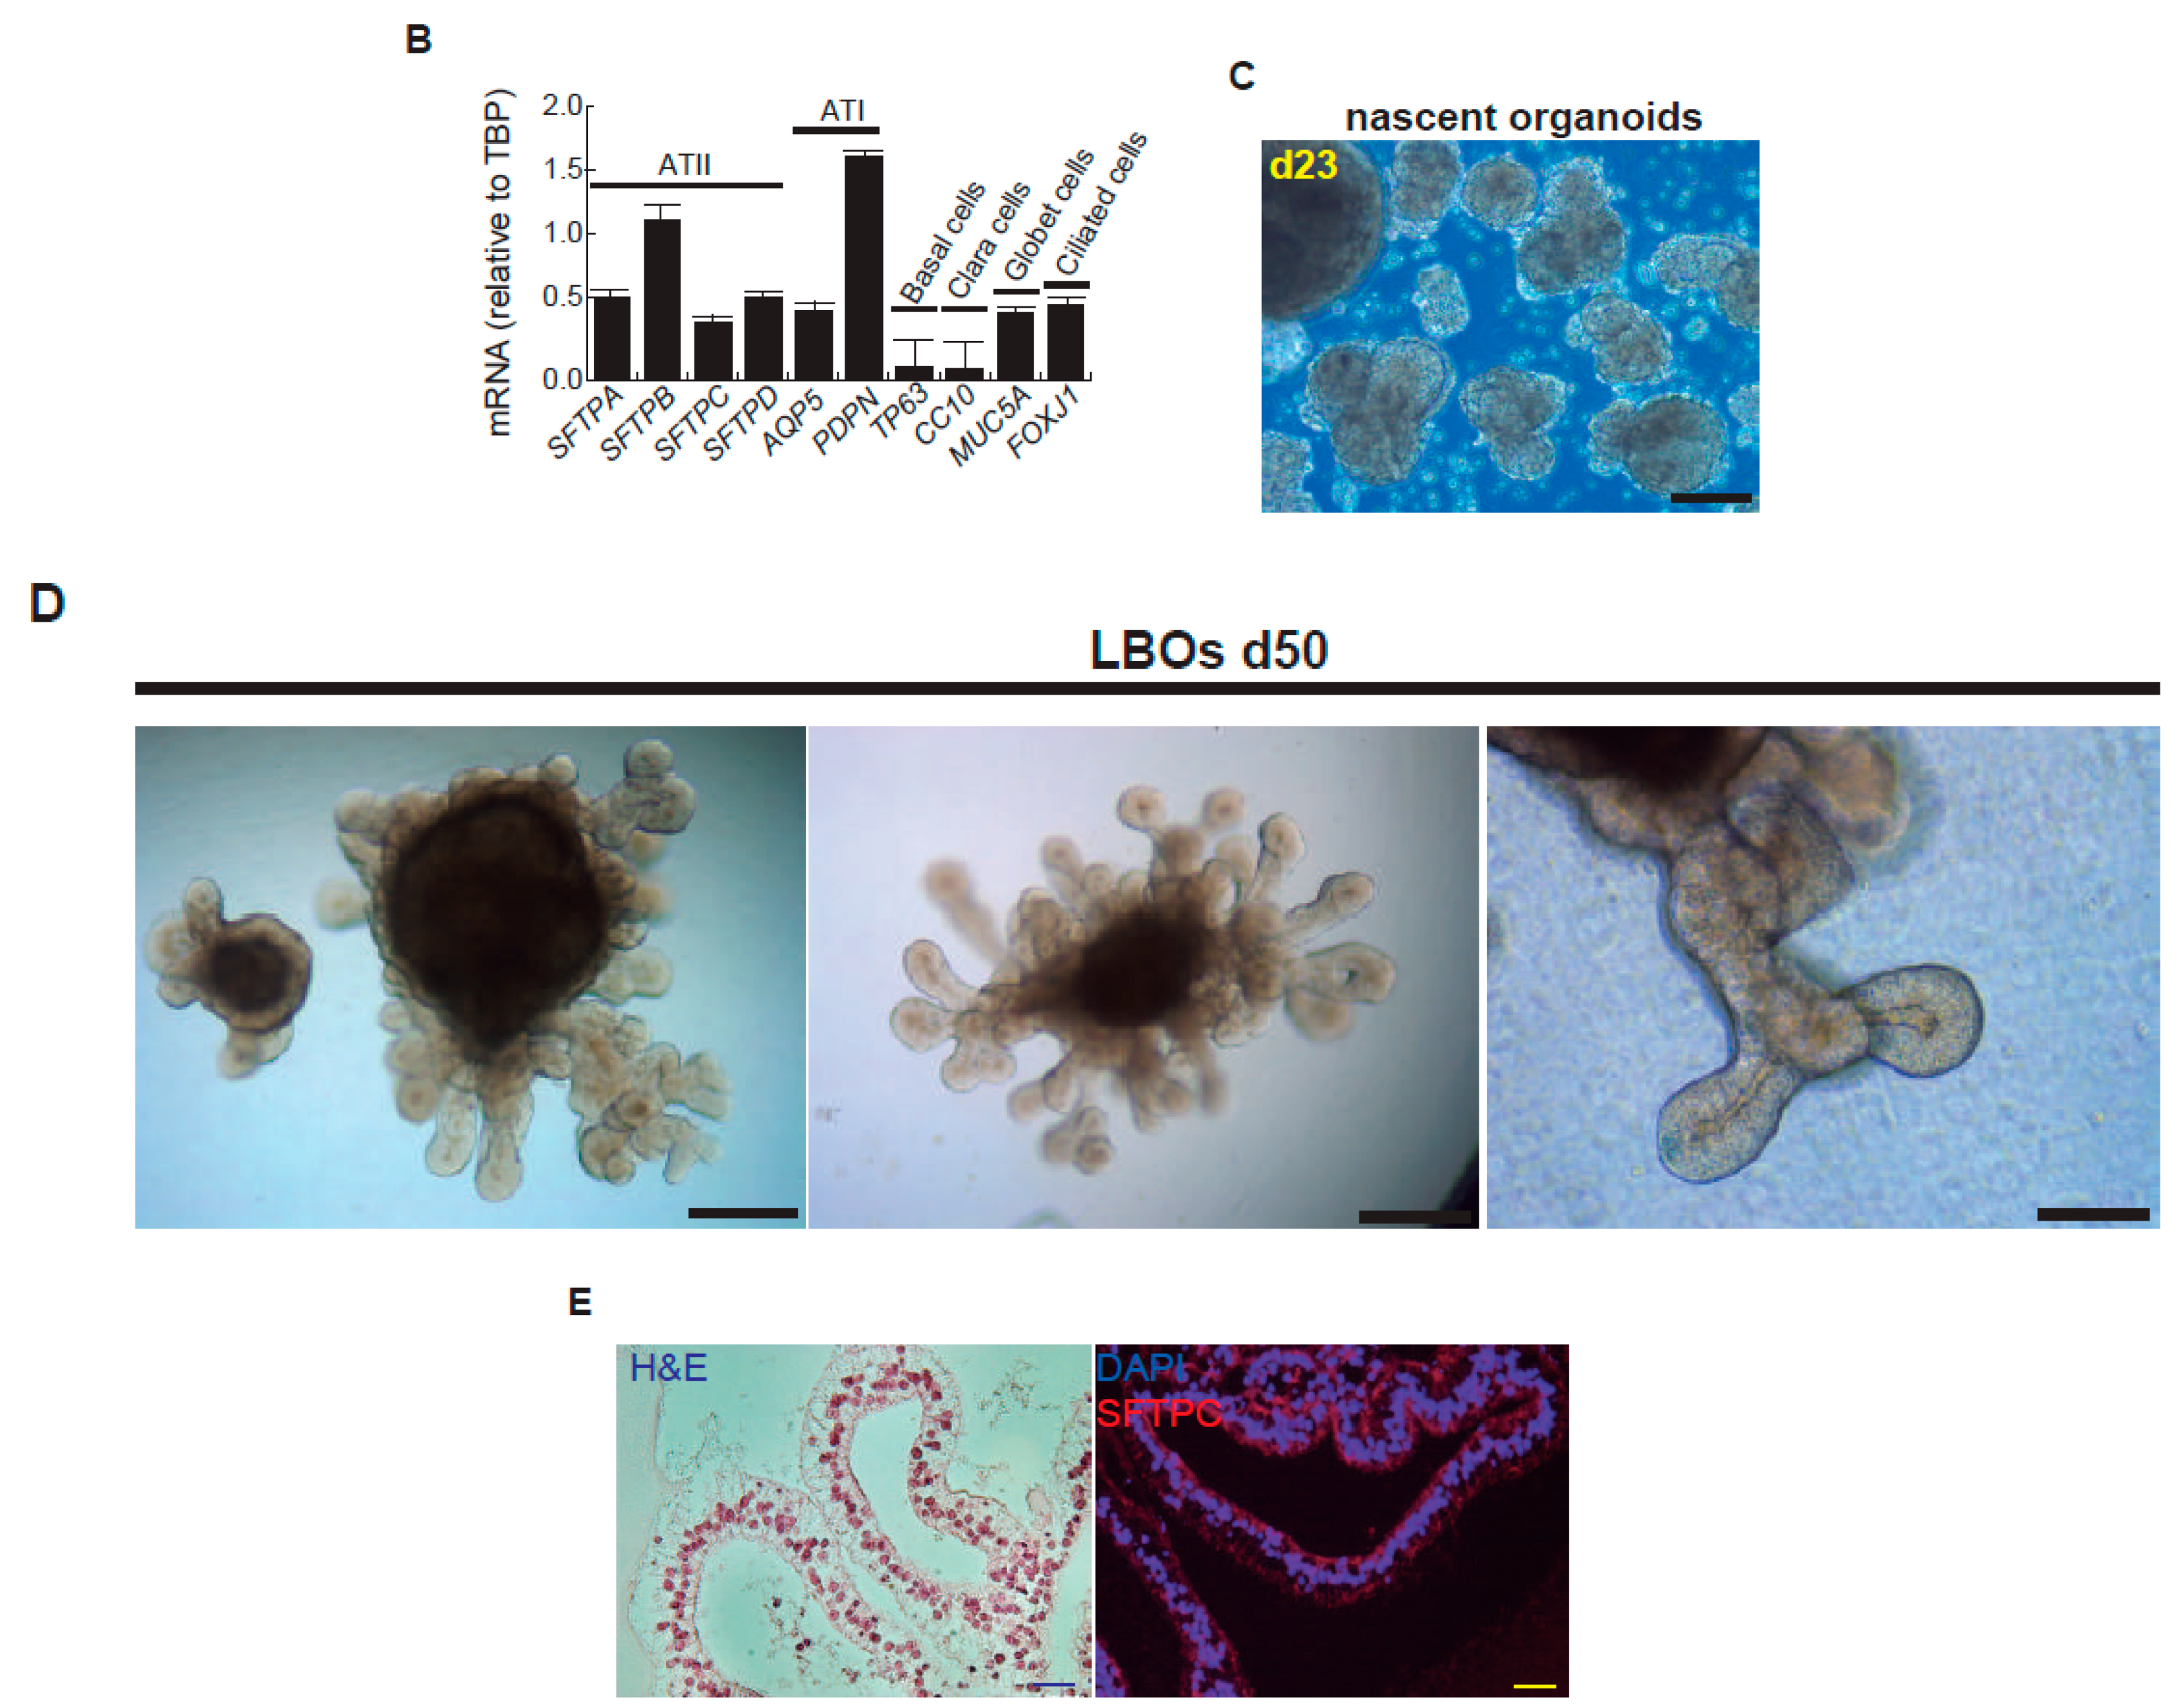
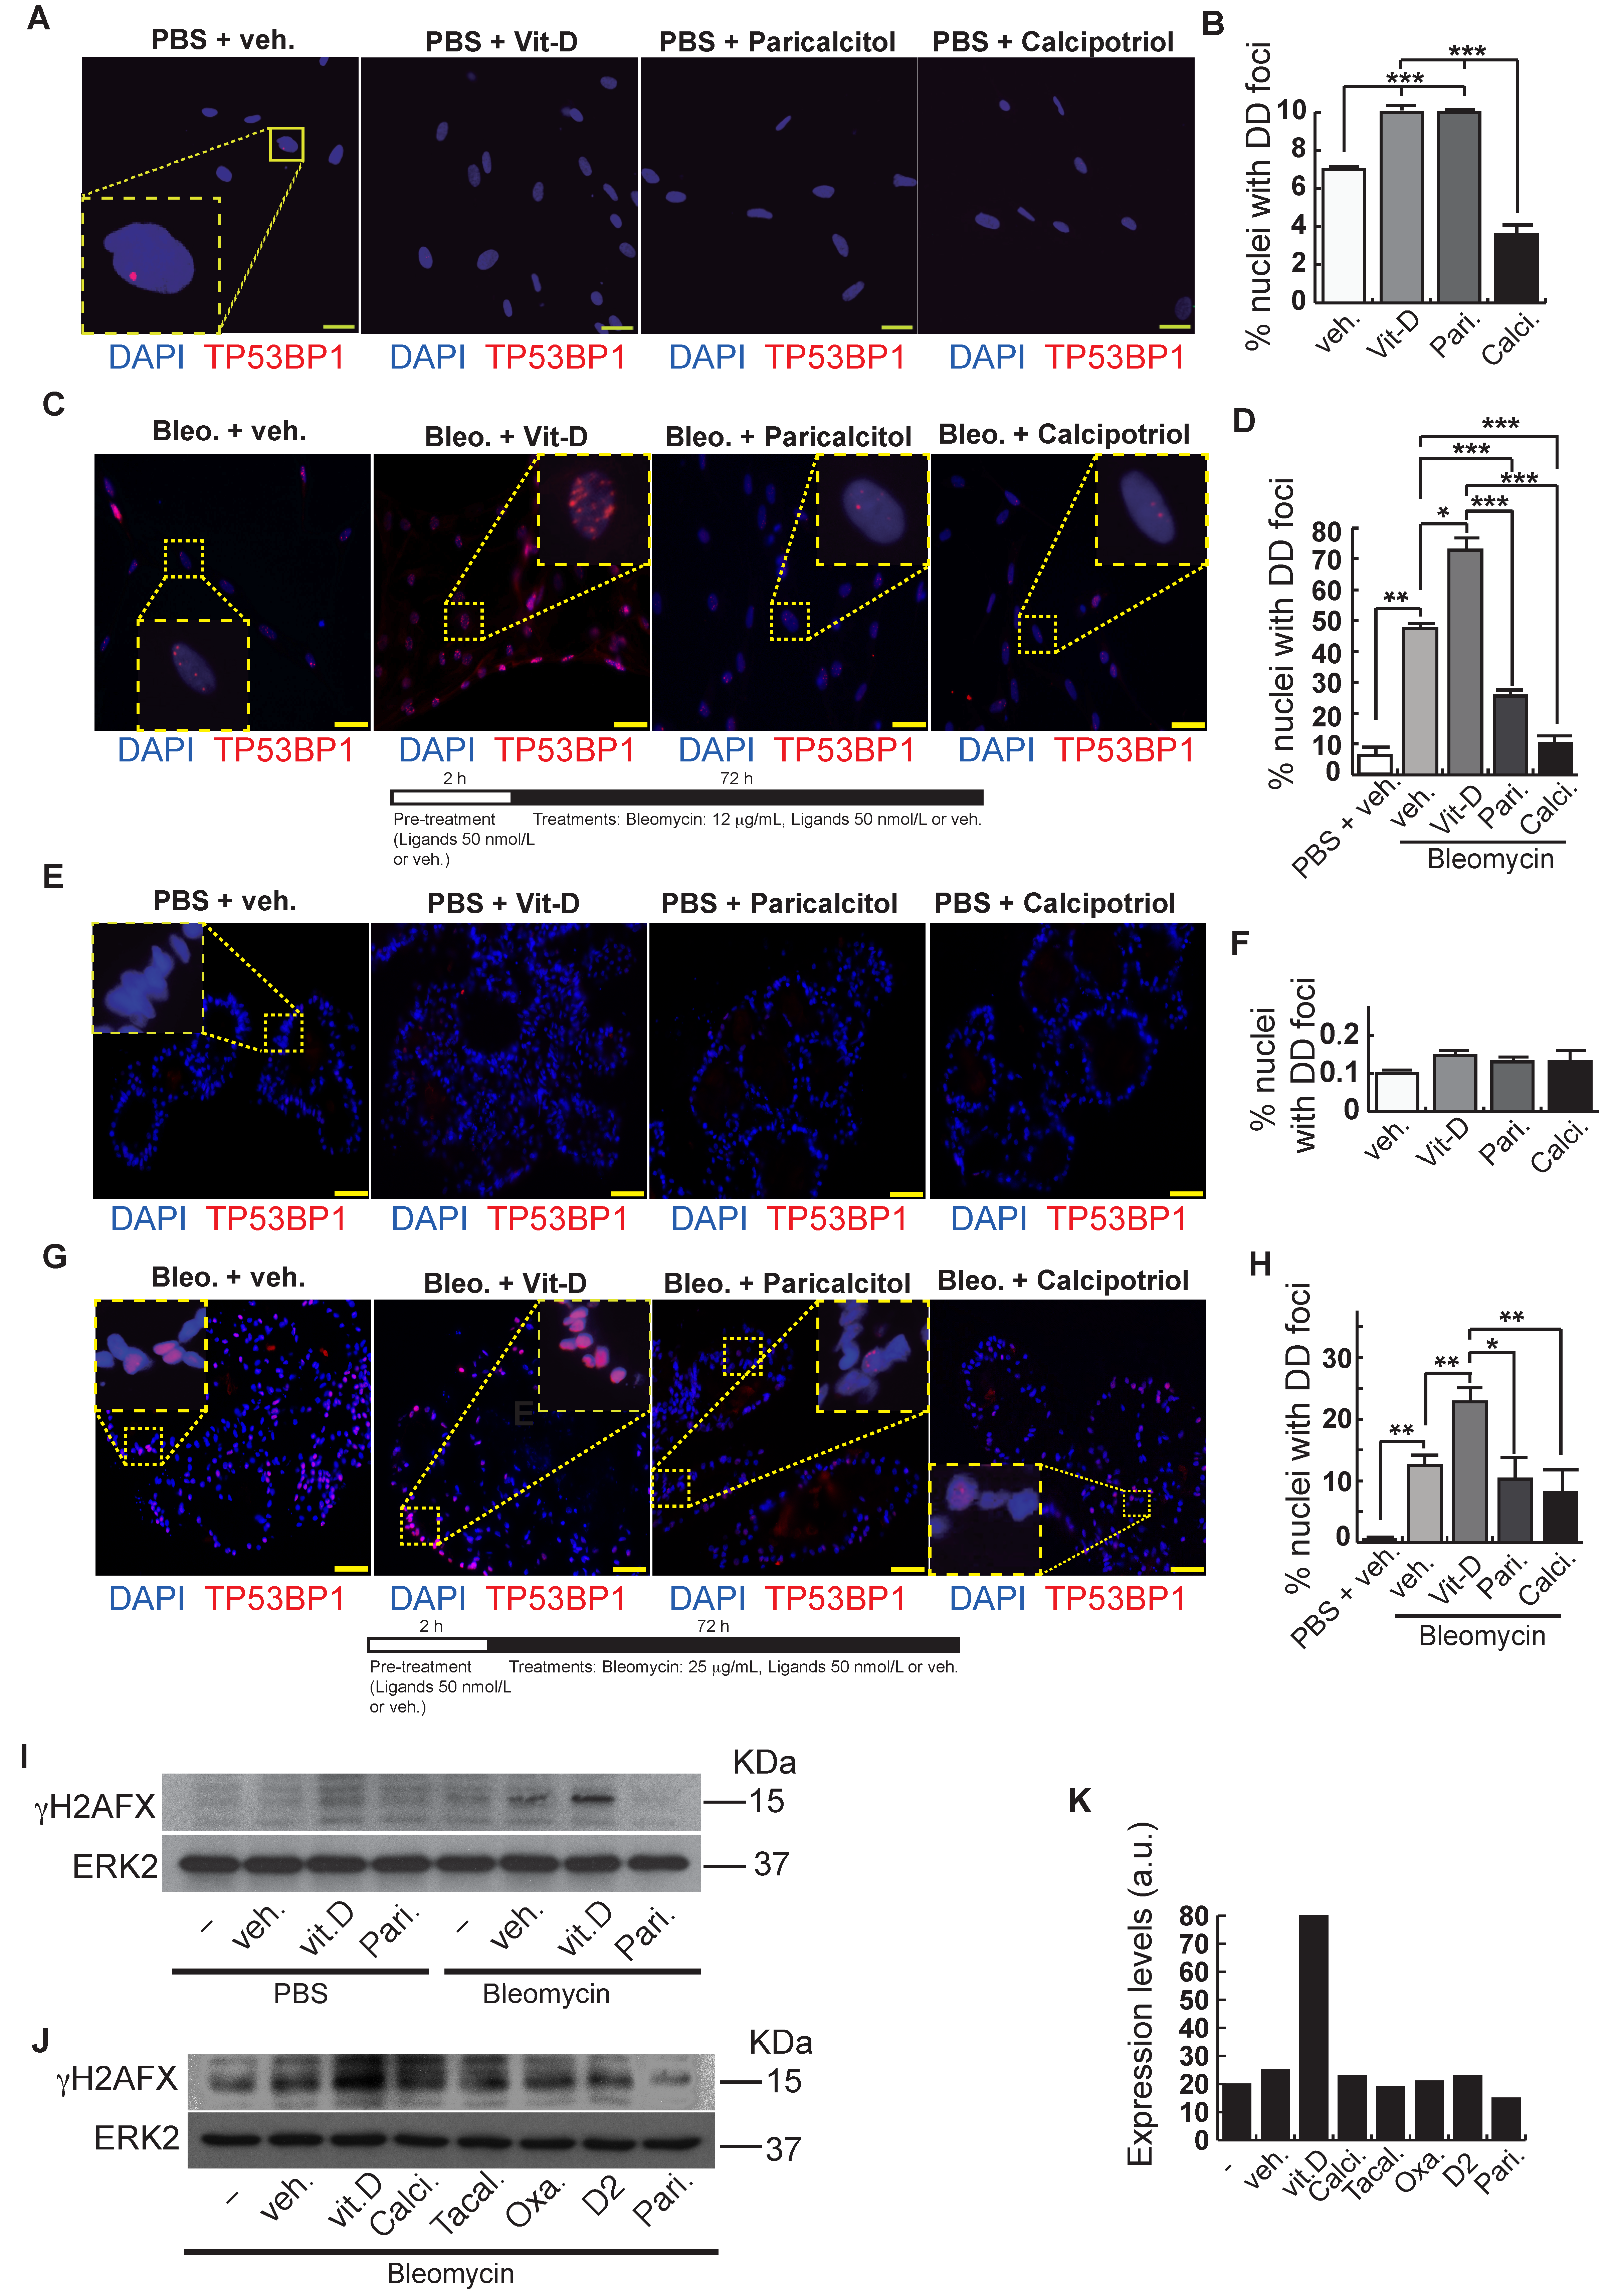
2. Results
3. Discussion
4. Materials and Methods
4.1. Cell Culture
4.2. Maintenance of hESCs
4.3. Primitive Streak Formation and Induction of Definitive Endoderm (DE)
4.4. Induction of Anterior Foregut Endoderm (AFE)
4.5. Lung Progenitors Induction and Expansion
4.6. Lung and Airway Epithelial Cells Maturation
4.7. Formation of Lung Bud Organoids
4.8. Indirect Immunofluorescence of A549 Cells and 2D Minilungs
4.9. Indirect Immunofluorescence of Lung Bud Organoids
4.10. Analysis of Proteins by Western Blot
4.11. Quantitative real-time RT-PCR (RT-qPCR) of minilungs
4.12. Statistical Analysis
5. Conclusions
Supplementary Materials
Author Contributions
Funding
Institutional Review Board Statement
Informed Consent Statement
Data Availability Statement
Acknowledgments
Conflicts of Interest
Abbreviations
| AFE | Anterior foregut endoderm |
| ATI | Alveolar type I cells |
| ATII | Alveolar type II cells |
| BMP4 | Bone Morphogenic Protein 4 |
| BSA | Bovine serum albumin |
| DD | DNA damage |
| DD foci | DNA damage foci |
| DSBs | DNA double-strand breaks |
| EBs | Embryoid bodies |
| FBS | Foetal bovine serum |
| FGF | Fibroblast growth factor |
| FOXJ1 | Forkhead Box J1 |
| H2AFX | H2A histone family member X |
| hbFGF | Human basic fibroblast growth factor |
| hESCs | Human embryonic stem cells |
| hPSCs | Human pluripotent stem cells |
| IBMX | Isobutylmethylxanthine |
| IPF | Idiopathic pulmonary fibrosis |
| KGF | Keratinocyte growth factor |
| LBOs | Lung bud organoids |
| MEFs | Mouse embryonic fibroblasts |
| MUCIN5AC | Mucin 5AC, Oligomeric Mucus/Gel-Forming |
| PBS | Phosphate-buffered saline |
| PDPN | Podoplanin |
| RT-qPCR | Quantitative real-time RT-PCR (reverse transcription polymerase chain reaction) |
| SCGB1A1 | Secretoglobin Family 1A Member 1; CC10 |
| SEM | Standard error of the mean |
| SFD | Serum-free differentiation |
| SFTPA | SurfactantProtein A |
| SFTPB | SurfactantProtein B |
| SFTPC | SurfactantProtein C |
| SFTPD | SurfactantProtein D |
| SOX2 | SRY (sex-determining region Y)-box 2 |
| TBP | TATA box binding protein |
| TP53BP1 | Tumor Protein P53 Binding Protein 1 |
| TP63 | Tumor Protein P63 |
| µm | Micrometer |
References
- King, T.E., Jr.; Pardo, A.M. Idiopathic pulmonary fibrosis. Lancet 2011, 378, 1949–1961. [Google Scholar] [CrossRef]
- Hecker, L.; Logsdon, N.J.; Kurundkar, D.; Kurundkar, A.; Bernard, K.; Hock, T.; Meldrum, E.; Sanders, Y.Y.; Thannickal, V.J. Reversal of persistent fibrosis in aging by targeting Nox4-Nrf2 redox imbalance. Transl. Med. 2014, 6, 231ra47. [Google Scholar] [CrossRef] [PubMed] [Green Version]
- Lv, X.X.; Wang, X.X.; Li, K.; Wang, Z.Y.; Li, Z.; Lv, Q.; Fu, X.M.; Hu, Z.W. Rupatadine protects against pulmonary fibrosis by attenuating PAF-mediated senescence in rodents. PLoS ONE 2013, 8, e68631. [Google Scholar] [CrossRef] [PubMed] [Green Version]
- Shivshankar, P.; Brampton, C.; Miyasato, S.; Kasper, M.; Thannickal, V.J.; Le Saux, C.J. Caveolin-1 deficiency protects from pulmonary fibrosis by modulating epithelial cell senescence in mice. Am. J. Respir. Cell Mol. Biol. 2012, 47, 28–36. [Google Scholar] [CrossRef] [PubMed] [Green Version]
- Ding, N.; Yu, R.T.; Subramaniam, N.; Sherman, M.H.; Wilson, C.; Rao, R.; Leblanc, M.; Coulter, S.; He, M.; Scott, C.; et al. A vitamin D receptor/SMAD genomic circuit gates hepatic fibrotic response. Cell 2013, 153, 601–613. [Google Scholar] [CrossRef] [PubMed] [Green Version]
- Ito, I.; Waku, T.; Aoki, M.; Abe, R.; Nagai, Y.; Watanabe, T.; Nakajima, Y.; Ohkido, I.; Yokoyama, K.; Miyachi, H.; et al. A nonclassical vitamin D receptor pathway suppresses renal fibrosis. J. Clin. Investig. 2013, 123, 4579–4594. [Google Scholar] [CrossRef] [PubMed] [Green Version]
- Meredith, A.; Boroomand, S.; Carthy, J.; Luo, Z.; McManus, B. 1,25 Dihydroxyvitamin D3 Inhibits TGFβ1-Mediated Primary Human Cardiac Myofibroblast Activation. PLoS ONE 2015, 10, e0128655. [Google Scholar] [CrossRef]
- Zhang, Z.; Yu, X.; Fang, X.; Liang, A.; Yu, Z.; Gu, P.; Zeng, Y.; He, J.; Zhu, H.; Li, S.; et al. Preventive effects of vitamin D treatment on bleomycin-induced pulmonary fibrosis. Sci. Rep. 2015, 5, 17638. [Google Scholar] [CrossRef] [Green Version]
- Tan, Z.X.; Chen, Y.H.; Xu, S.; Qin, H.Y.; Zhang, C.; Zhao, H.; Xu, D.X. Calcitriol inhibits bleomycin-induced early pulmonary inflammatory response and epithelial-mesenchymal transition in mice. Toxicol. Lett. 2016, 240, 161–171. [Google Scholar] [CrossRef]
- Guijarro, T.; Magro-Lopez, E.; Manso, J.; Garcia-Martinez, R.; Fernandez-Aceñero, M.J.; Liste, I.; Zambrano, A. Detrimental pro-senescence effects of vitamin D on lung fibrosis. Mol. Med. 2018, 24, 64. [Google Scholar] [CrossRef]
- Wyman, C.; Kanaar, R. DNA double-strand break repair, all’s well that ends well. Rev. Genet. 2006, 40, 363–383. [Google Scholar] [CrossRef] [PubMed]
- Campisi, J.; d’Adda di Fagagna, F. Cellular senescence, When bad things happen to good cells. Nat. Rev. Mol. Cell Biol. 2007, 8, 729–740. [Google Scholar] [CrossRef] [PubMed]
- Aoshiba, K.; Tsuji, T.; Kameyama, S.; Itoh, M.; Semba, S.; Yamaguchi, K.; Nakamura, H. Senescence-associated secretory phenotype in a mouse model of bleomycin-induced lung injury. Exp. Toxicol. Pathol. 2013, 65, 1053–1062. [Google Scholar] [CrossRef] [PubMed]
- Aoshiba, K.; Zhou, F.; Tsuji, T.; Nagai, A. DNA damage as a molecular link in the pathogenesis of COPD in smokers. Eur. Respir. J. 2012, 39, 1368–1376. [Google Scholar] [CrossRef] [Green Version]
- Chilosi, M.; Carloni, A.; Rossi, A.; Poletti, V. Premature lung aging and cellular senescence in the pathogenesis of idiopathic pulmonary fibrosis and COPD/emphysema. Transl. Res. 2013, 162, 156–173. [Google Scholar] [CrossRef] [PubMed]
- Kuwano, K.; Araya, J.; Hara, H.; Minagawa, S.; Takasaka, N.; Ito, S.; Kobayashi, K.; Nakayama, K. Cellular senescence and autophagy in the pathogenesis of chronic obstructive pulmonary disease (COPD) and idiopathic pulmonary fibrosis (IPF). Respir. Investig. 2016, 54, 397–406. [Google Scholar] [CrossRef]
- Chua, F.; Gauldie, J.; Laurent, G.J. Pulmonary fibrosis, Searching for model answers. Am. J. Respir. Cell Mol. Biol. 2005, 33, 9–13. [Google Scholar] [CrossRef]
- Leyssens, C.; Verlinden, L.; Verstuyf, A. The future of vitamin D analogs. Front. Physiol. 2014, 5, 122. [Google Scholar] [CrossRef] [Green Version]
- Slatopolsky, E.; Finch, J.; Brown, A. New vitamin D analogs. Kidney Int. Suppl. 2003, 85, S83–S87. [Google Scholar] [CrossRef] [Green Version]
- Zambrano, A.; García-Carpizo, V.; Gallardo, M.E.; Villamuera, R.; Gómez-Ferrería, M.A.; Pascual, A.; Buisine, N.; Sachs, L.M.; Garesse, R.; Aranda, A. The thyroid hormone receptor β induces DNA damage and premature senescence. J. Cell Biol. 2014, 204, 129–146. [Google Scholar] [CrossRef] [Green Version]
- Rogakou, E.P.; Boon, C.; Redon, C.; Bonner, W.M. Megabase chromatin domains involved in DNA double-strand breaks in vivo. J. Cell Biol. 1999, 146, 905–916. [Google Scholar] [CrossRef] [PubMed] [Green Version]
- Schultz, L.B.; Chehab, N.H.; Malikzay, A.; Halazonetis, T.D. p53 binding protein 1 (53BP1) is an early participant in the cellular response to DNA double-strand breaks. J. Cell Biol. 2000, 151, 1381–1390. [Google Scholar] [CrossRef] [PubMed] [Green Version]
- Abraham, R.T. Checkpoint signalling, Focusing on 53BP1. Nat. Cell Biol. 2002, 12, E277–E279. [Google Scholar] [CrossRef]
- Ward, I.M.; Minn, K.; Jorda, K.G.; Chen, J. Accumulation of checkpoint protein 53BP1 at DNA breaks involves its binding to phosphorylated histone H2AX. J. Biol. Chem. 2003, 278, 19579–19582. [Google Scholar] [CrossRef] [PubMed] [Green Version]
- Magro-Lopez, E.; Guijarro, T.; Martinez, I.; Martin-Vicente, M.; Liste, I.; Zambrano, A. A Two-Dimensional Human Minilung System (Model) for Respiratory Syncytial Virus Infections. Viruses 2017, 9, 379. [Google Scholar] [CrossRef] [Green Version]
- Magro-Lopez, E.; Palmer, C.; Manso, J.; Liste, I.; Zambrano, A. Effects of lung and airway epithelial maturation cocktail on the structure of lung bud organoids. Stem Cell Res. Ther. 2018, 9, 186. [Google Scholar] [CrossRef] [Green Version]
- Huang, S.X.; Green, M.D.; de Carvalho, A.T.; Mumau, M.; Chen, Y.W.; D′Souza, S.L.; Snoeck, H.W. The in vitro generation of lung and airway progenitor cells from human pluripotent stem cells. Nat. Protoc. 2015, 10, 413–425. [Google Scholar] [CrossRef] [Green Version]
- Huang, S.X.; Islam, M.N.; O’Neill, J.; Hu, Z.; Yang, Y.G.; Chen, Y.W.; Mumau, M.; Green, M.D.; Vunjak-Novakovic, G.; Bhattacharya, J.; et al. Efficient generation of lung and airway epithelial cells from human pluripotent stem cells. Nat. Biotechnol. 2014, 32, 84–91. [Google Scholar] [CrossRef] [Green Version]
- Chen, Y.W.; Huang, S.X.; de Carvalho, A.L.R.T.; Ho, S.H.; Islam, M.N.; Volpi, S.; Notarangelo, L.D.; Ciancanelli, M.; Casanova, J.L.; Bhattacharya, J.; et al. A three-dimensional model of human lung development and disease from pluripotent stem cells. Nat. Cell Biol. 2017, 19, 542–549. [Google Scholar] [CrossRef]
- Martínez, I.; García-Carpizo, V.; Guijarro, T.; García-Gomez, A.; Navarro, D.; Aranda, A.; Zambrano, A. Induction of DNA double-strand breaks and cellular senescence by human respiratory syncytial virus. Virulence 2016, 7, 427–442. [Google Scholar] [CrossRef] [Green Version]
- Finklea, J.D.; Grossmann, R.E.; Tangpricha, V. Vitamin D and chronic lung disease, A review of molecular mechanisms and clinical studies. Adv. Nutr. 2011, 2, 244–253. [Google Scholar] [CrossRef] [PubMed]
- Tebben, P.J.; Singh, R.J.; Kumar, R. Vitamin D-Mediated Hypercalcemia, Mechanisms, Diagnosis, and Treatment. Endocr. Rev. 2016, 37, 521–547. [Google Scholar] [CrossRef] [PubMed]
- Planté-Bordeneuve, T.; Berardis, S.; Bastin, P.; Gruson, D.; Henri, L.; Gohy, S. Vitamin D intoxication in patients with cystic fibrosis, Report of a single-center cohort. Sci. Rep. 2021, 11, 7719. [Google Scholar] [CrossRef] [PubMed]
- Tzilas, V.; Bouros, E.; Barbayianni, I.; Karampitsakos, T.; Kourtidou, S.; Ntassiou, M.; Ninou, I.; Aidinis, V.; Bouros, D.; Tzouvelekis, A. Vitamin D prevents experimental lung fibrosis and predicts survival in patients with idiopathic pulmonary fibrosis. Pulm. Pharmacol. Ther. 2019, 55, 17–24. [Google Scholar] [CrossRef] [PubMed]
- Chang, J.; Nie, H.; Ge, X.; Du, J.; Liu, W.; Li, X.; Sun, Y.; Wei, X.; Xun, Z.; Li, Y.C. Vitamin D suppresses bleomycin-induced pulmonary fibrosis by targeting the local renin-angiotensin system in the lung. Sci. Rep. 2021, 11, 16525. [Google Scholar] [CrossRef]
- Elwakeel, E.E.; Mohamed, A.Z.; Shaalan, W.M. Therapeutic effects of mesenchymal stem cells and vitamin D on Bleomycin triggered lung damage in male adult albino rats. Ultrastruct. Pathol. 2022, 1–14. [Google Scholar] [CrossRef]
- Tan, X.; Li, Y.; Liu, Y. Paricalcitol attenuates renal interstitial fibrosis in obstructive nephropathy. J. Am. Soc. Nephrol. 2006, 17, 3382–3393. [Google Scholar] [CrossRef] [Green Version]
- Green, D.M.; Leonard, A.R.; Paranjape, S.M.; Rosenstein, B.J.; Zeitlin, P.L.; Mogayzel, P.J., Jr. Transient effectiveness of vitamin D2 therapy in pediatric cystic fibrosis patients. J. Cyst. Fibros. 2010, 9, 143–149. [Google Scholar] [CrossRef] [Green Version]
- Inoue, K.; Matsui, I.; Hamano, T.; Fujii, N.; Shimomura, A.; Nakano, C.; Kusunoki, Y.; Takabatake, Y.; Hirata, M.; Nishiyama, A.; et al. Maxacalcitol ameliorates tubulointerstitial fibrosis in obstructed kidneys by recruiting PPM1A/VDR complex to pSmad3. Lab Investig. 2012, 92, 1686–1697. [Google Scholar] [CrossRef] [Green Version]
- Meems, L.M.; Cannon, M.V.; Mahmud, H.; Voors, A.A.; van Gilst, W.H.; Silljé, H.H.; Ruifrok, W.P.; de Boer, R.A. The vitamin D receptor activator paricalcitol prevents fibrosis and diastolic dysfunction in a murine model of pressure overload. J. Steroid Biochem. Mol. Biol. 2012, 132, 282–289. [Google Scholar] [CrossRef]
- Hirose, M.; Nishino, T.; Obata, Y.; Nakazawa, M.; Nakazawa, Y.; Furusu, A.; Abe, K.; Miyazaki, M.; Koji, T.; Kohno, S. 22-Oxacalcitriol prevents progression of peritoneal fibrosis in a mouse model. Perit. Dial. Int. 2013, 33, 132–142. [Google Scholar] [CrossRef] [PubMed] [Green Version]
- González-Mateo, G.T.; Fernández-Míllara, V.; Bellón, T.; Liappas, G.; Ruiz-Ortega, M.; López-Cabrera, M.; Selgas, R.; Aroeira, L.S. Paricalcitol reduces peritoneal fibrosis in mice through the activation of regulatory T cells and reduction in IL-17 production. PLoS ONE 2014, 9, e108477. [Google Scholar]
- Lai, C.C.; Liu, C.P.; Cheng, P.W.; Lu, P.J.; Hsiao, M.; Lu, W.H.; Sun, G.C.; Liou, J.C.; Tseng, C.J. Paricalcitol Attenuates Cardiac Fibrosis and Expression of Endothelial Cell Transition Markers in Isoproterenol-Induced Cardiomyopathic Rats. Crit. Care Med. 2016, 44, e866–e874. [Google Scholar] [CrossRef] [PubMed]
- Lee, A.S.; Jung, Y.J.; Thanh, T.N.; Lee, S.; Kim, W.; Kang, K.P.; Park, S.K. Paricalcitol attenuates lipopolysaccharide-induced myocardial inflammation by regulating the NF-κB signaling pathway. Int. J. Mol. Med. 2016, 37, 1023–1029. [Google Scholar] [CrossRef] [Green Version]
- Wahsh, E.; Abu-Elsaad, N.; El-Karef, A.; Ibrahim, T. The vitamin D receptor agonist, calcipotriol, modulates fibrogenic pathways mitigating liver fibrosis in-vivo, An experimental study. Eur. J. Pharmacol. 2016, 789, 362–369. [Google Scholar] [CrossRef]
- Gözel, N.; Duran, F.; Yildirim, A.; Yolbaş, S.; Önalan, E.; Özercan, İ.H.; Koca, S.S. Paricalcitol Inhibits Wnt/β-Catenin Signaling Pathway and Ameliorates Dermal Fibrosis in Bleomycin Induced Scleroderma Model. Arch. Rheumatol. 2017, 33, 288–294. [Google Scholar] [CrossRef] [PubMed] [Green Version]
- Wang, X.; Wang, G.; Qu, J.; Yuan, Z.; Pan, R.; Li, K. Calcipotriol Inhibits NLRP3 Signal Through YAP1 Activation to Alleviate Cholestatic Liver Injury and Fibrosis. Front. Pharmacol. 2020, 11, 200. [Google Scholar] [CrossRef] [PubMed]
- Martínez-Arias, L.; Panizo, S.; Alonso-Montes, C.; Martín-Vírgala, J.; Martín-Carro, B.; Fernández-Villabrille, S.; García Gil-Albert, C.; Palomo-Antequera, C.; Fernández-Martín, J.L.; Ruiz-Torres, M.P.; et al. Effects of calcitriol and paricalcitol on renal fibrosis in CKD. Nephrol. Dial. Transplant. 2021, 36, 793–803. [Google Scholar] [CrossRef] [PubMed]
- Gong, J.; Gong, H.; Liu, Y.; Tao, X.; Zhang, H. Calcipotriol attenuates liver fibrosis through the inhibition of vitamin D receptor-mediated NF-κB signaling pathway. Bioengineered 2022, 13, 2658–2672. [Google Scholar] [CrossRef]


Publisher’s Note: MDPI stays neutral with regard to jurisdictional claims in published maps and institutional affiliations. |
© 2022 by the authors. Licensee MDPI, Basel, Switzerland. This article is an open access article distributed under the terms and conditions of the Creative Commons Attribution (CC BY) license (https://creativecommons.org/licenses/by/4.0/).
Share and Cite
Magro-Lopez, E.; Chamorro-Herrero, I.; Zambrano, A. Effects of Hypocalcemic Vitamin D Analogs in the Expression of DNA Damage Induced in Minilungs from hESCs: Implications for Lung Fibrosis. Int. J. Mol. Sci. 2022, 23, 4921. https://doi.org/10.3390/ijms23094921
Magro-Lopez E, Chamorro-Herrero I, Zambrano A. Effects of Hypocalcemic Vitamin D Analogs in the Expression of DNA Damage Induced in Minilungs from hESCs: Implications for Lung Fibrosis. International Journal of Molecular Sciences. 2022; 23(9):4921. https://doi.org/10.3390/ijms23094921
Chicago/Turabian StyleMagro-Lopez, Esmeralda, Irene Chamorro-Herrero, and Alberto Zambrano. 2022. "Effects of Hypocalcemic Vitamin D Analogs in the Expression of DNA Damage Induced in Minilungs from hESCs: Implications for Lung Fibrosis" International Journal of Molecular Sciences 23, no. 9: 4921. https://doi.org/10.3390/ijms23094921