
A Predictive Pharmacokinetic Model for Immune Cell-Mediated Uptake and Retention of Nanoparticles in Tumors

 , ,
, ,
Abstract
:1. Introduction
2. Results
2.1. , and from In Vivo PK and BD Data
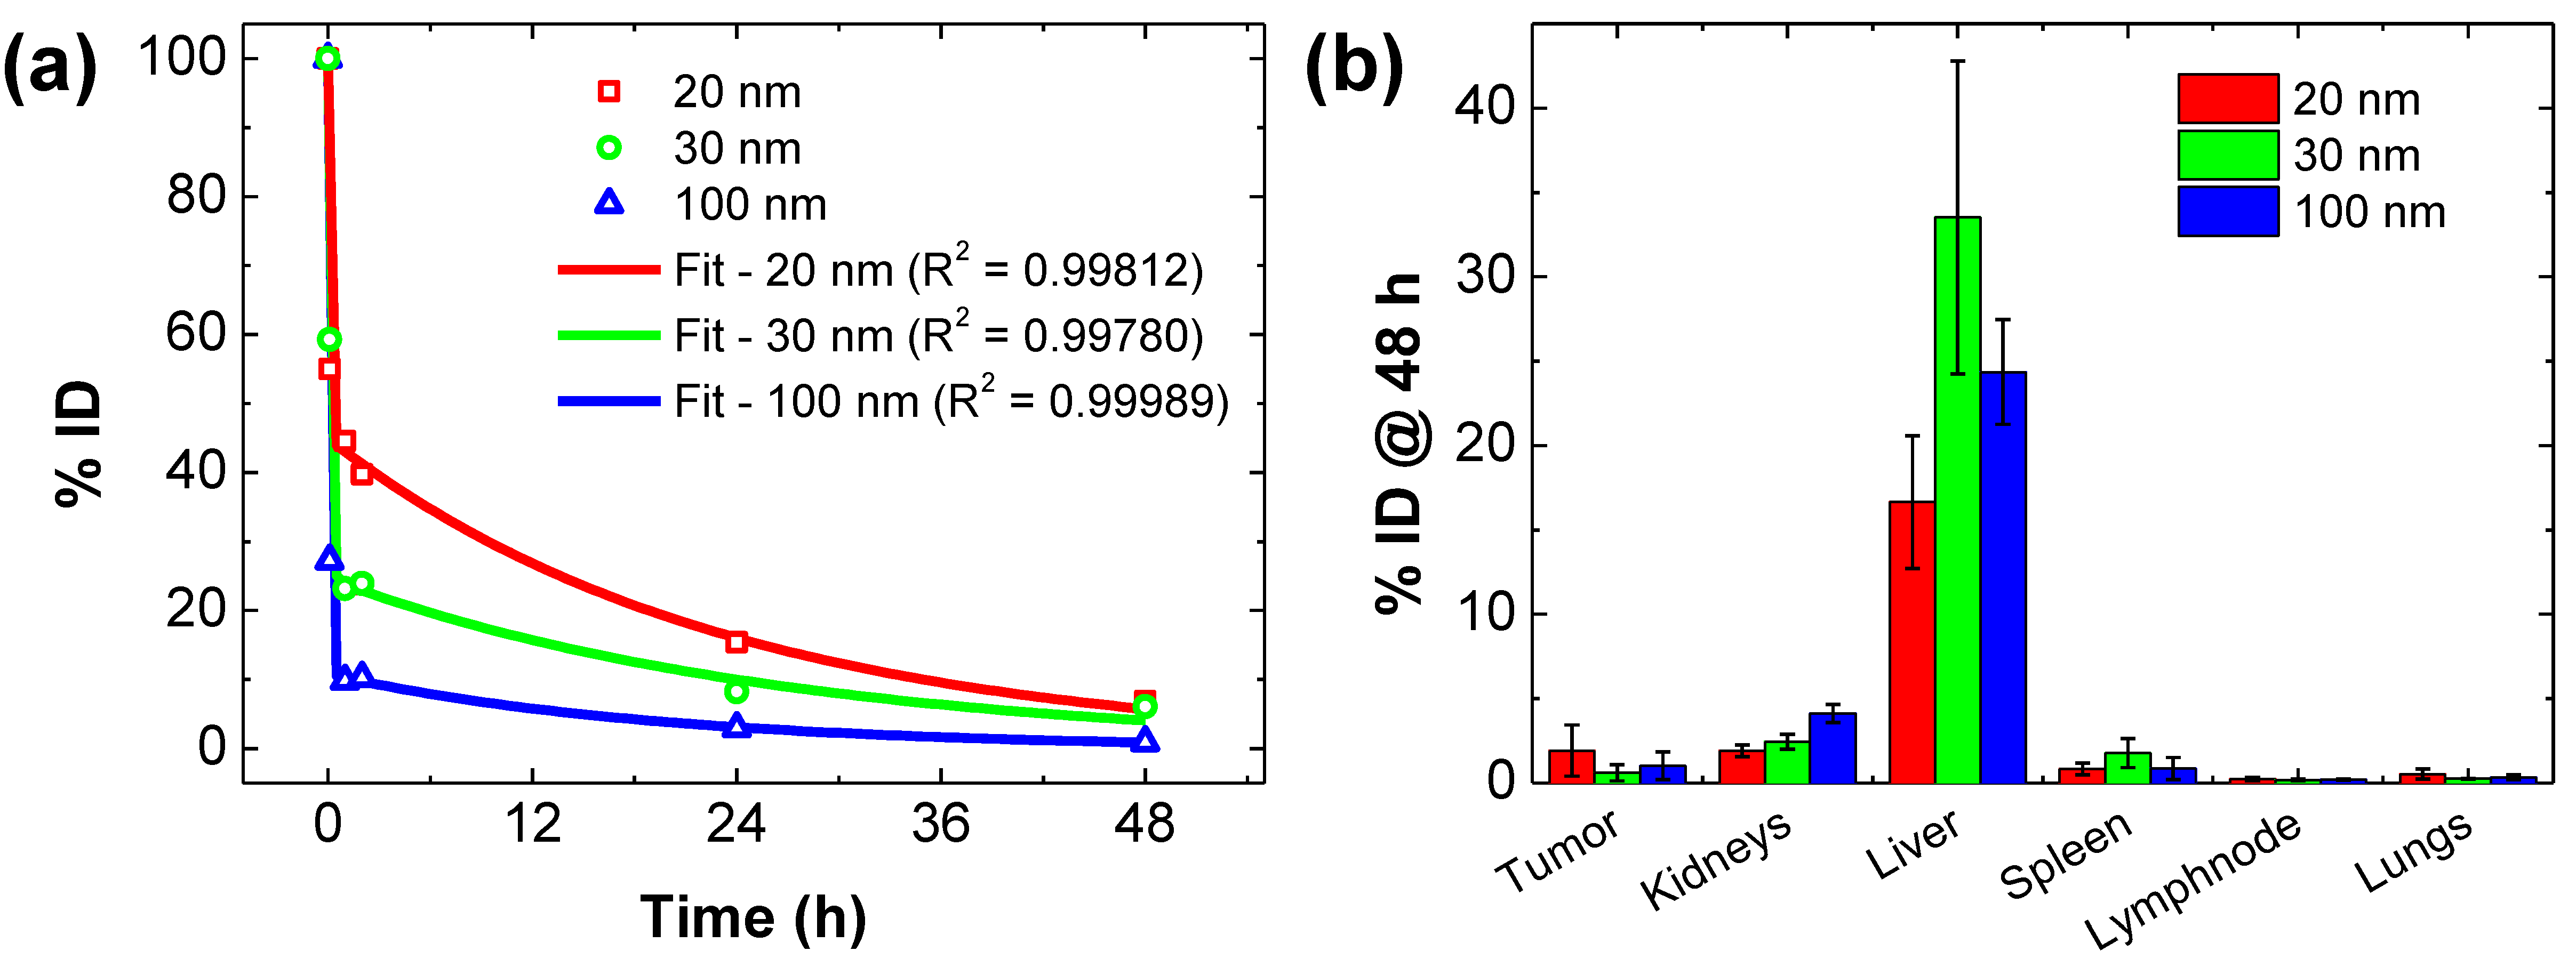
2.2. and from In Vivo BD Data
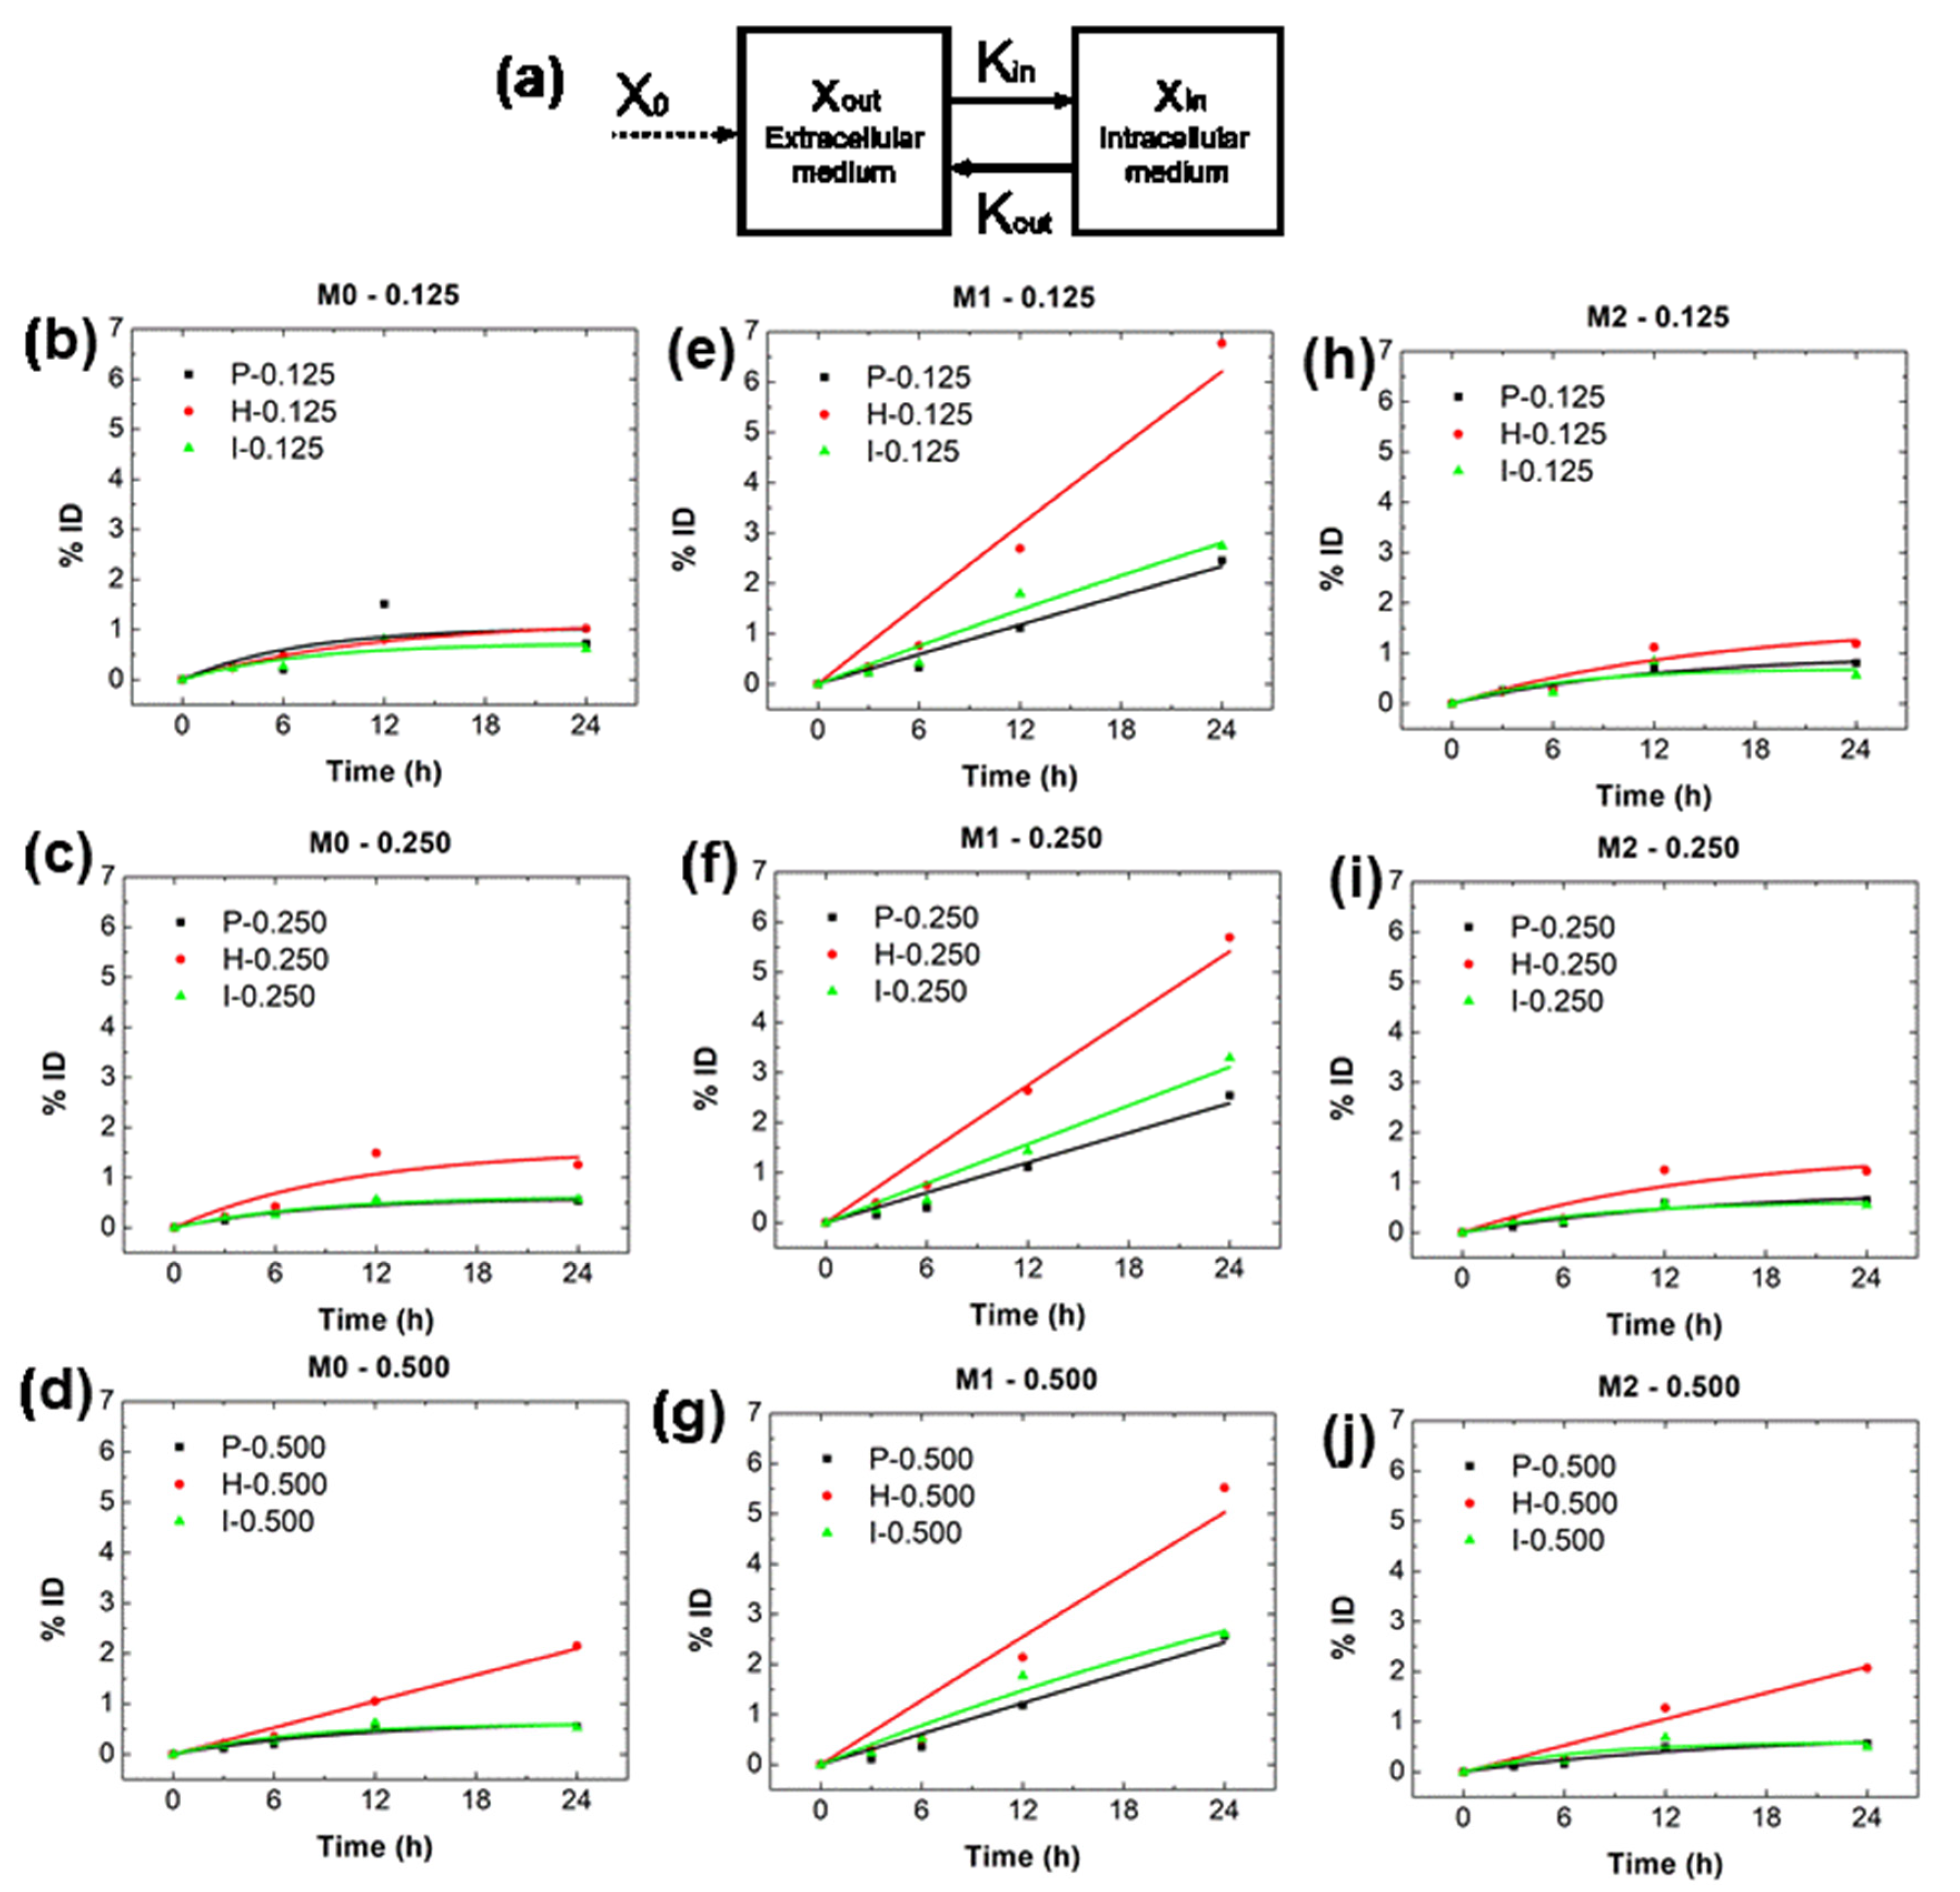
2.3. and from In Vitro Data
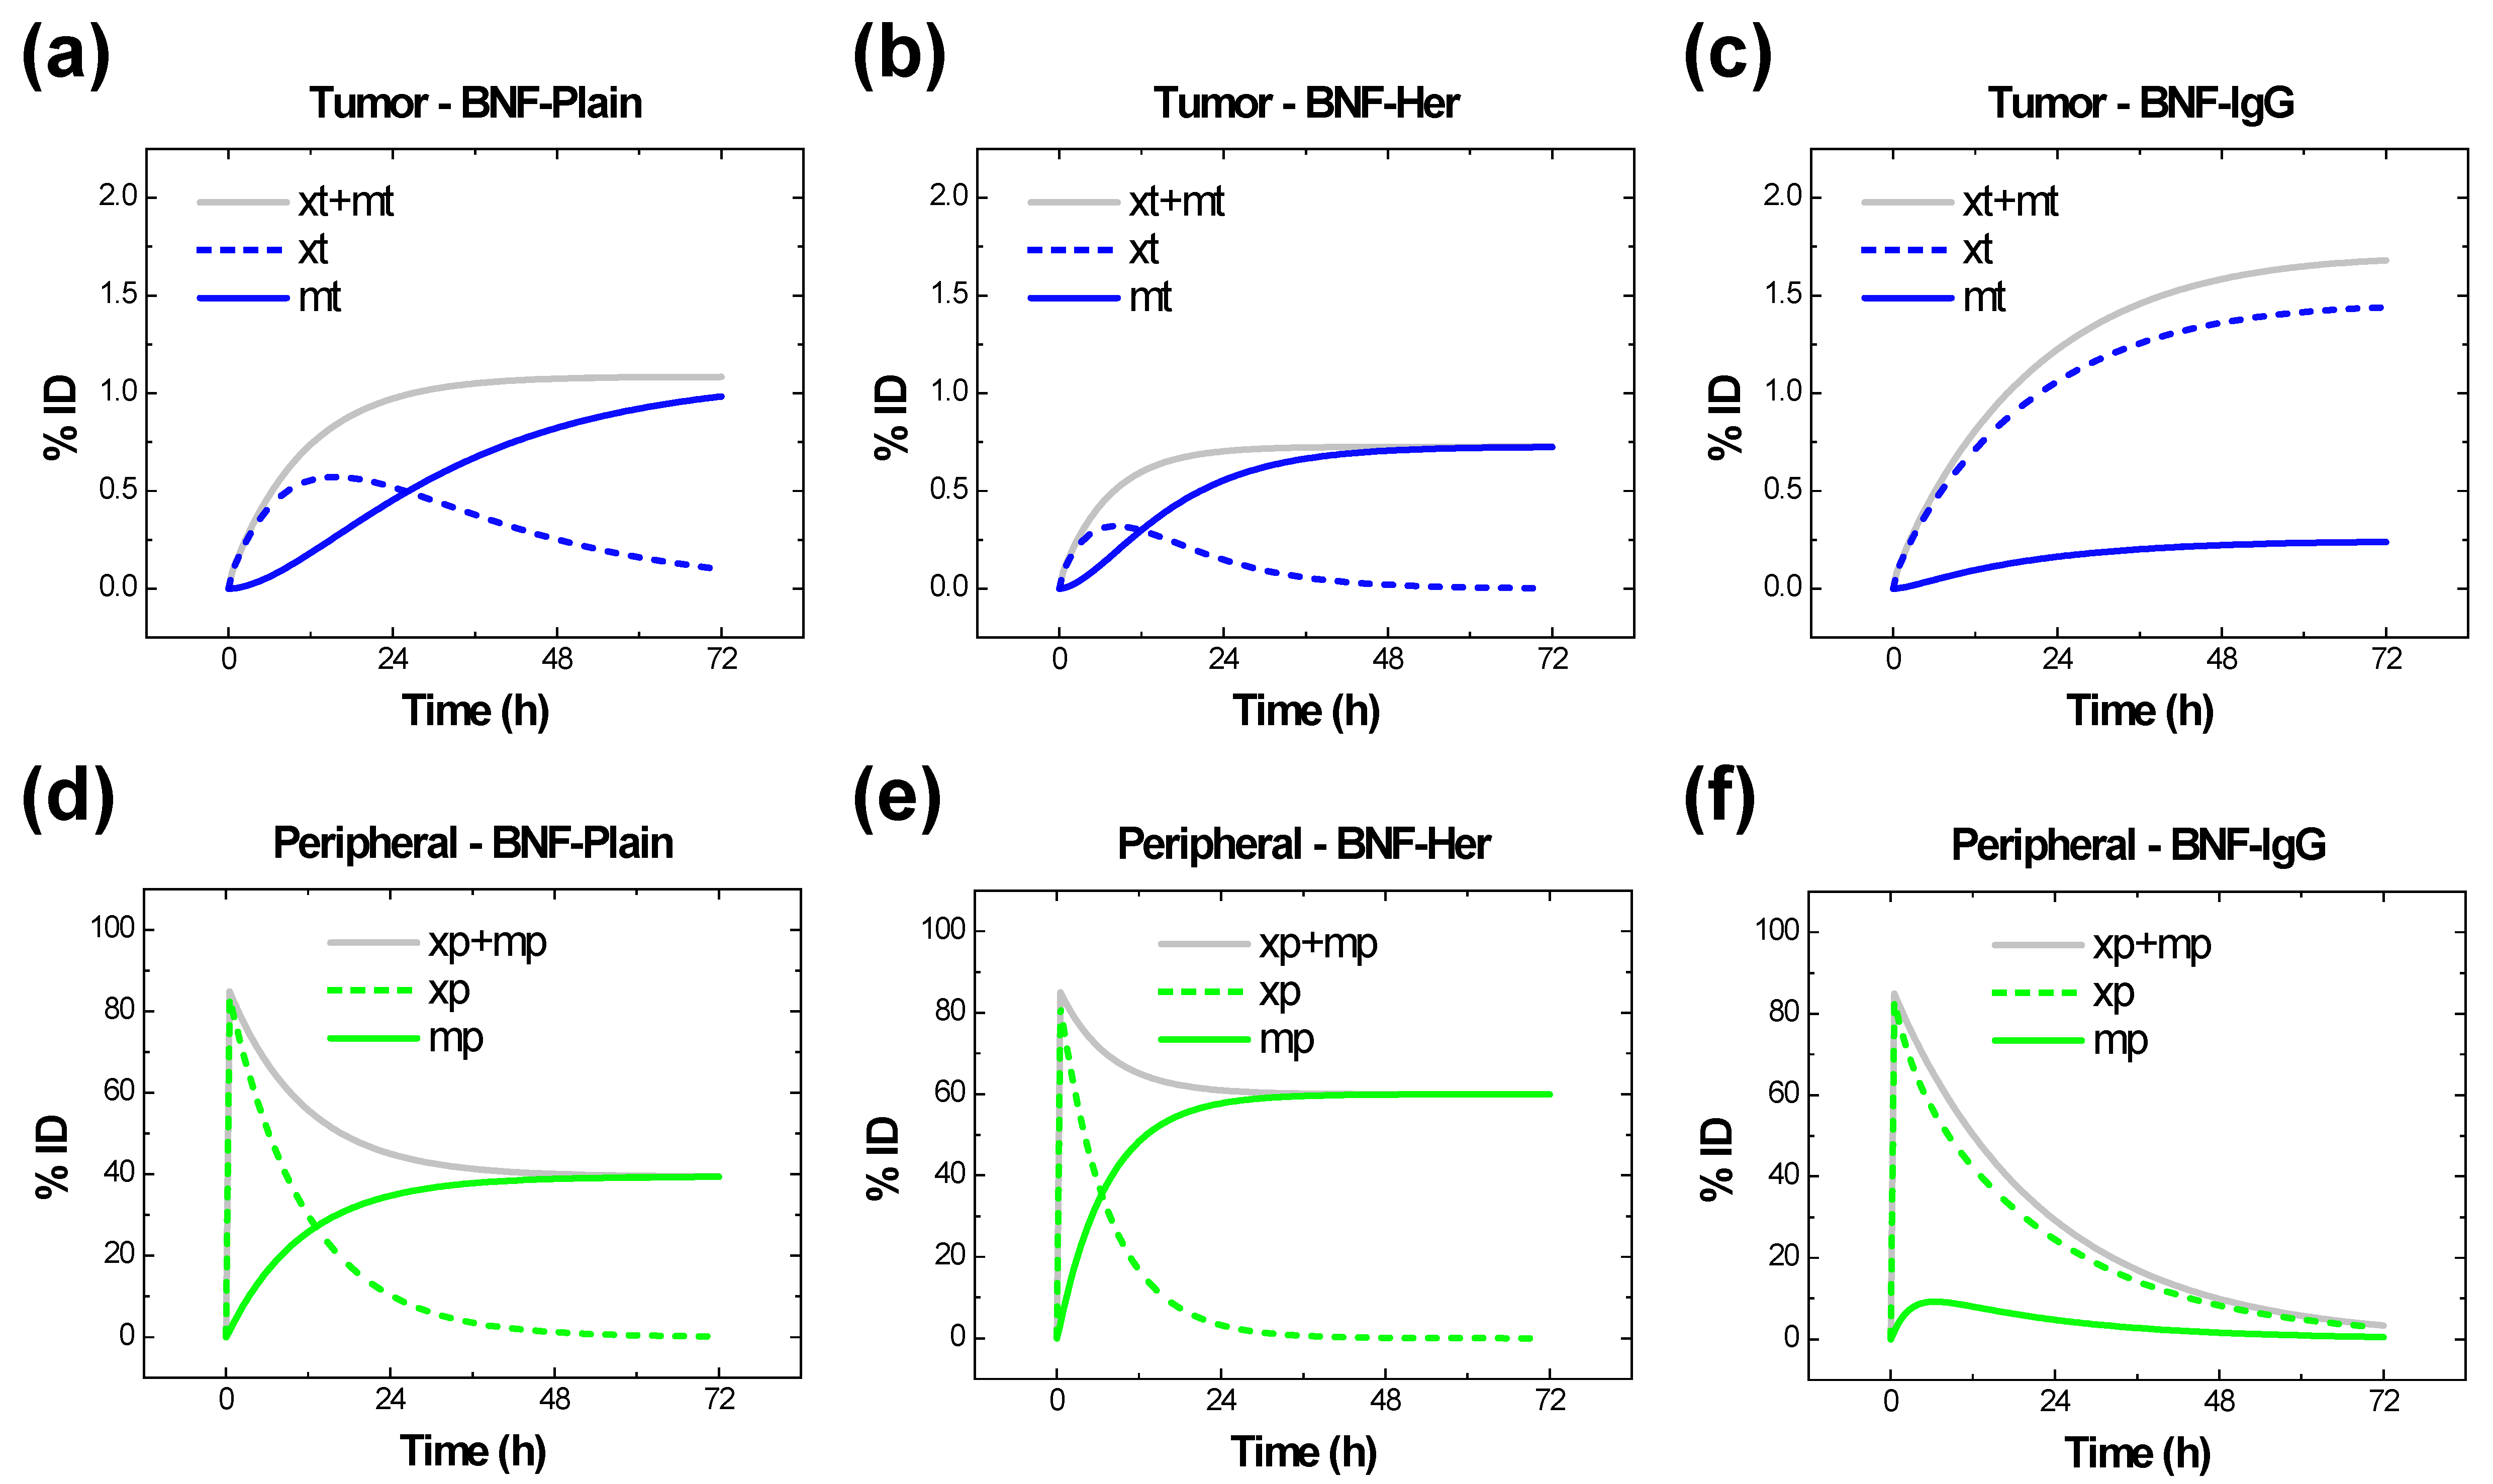
2.4. Results for , , and from Simulations
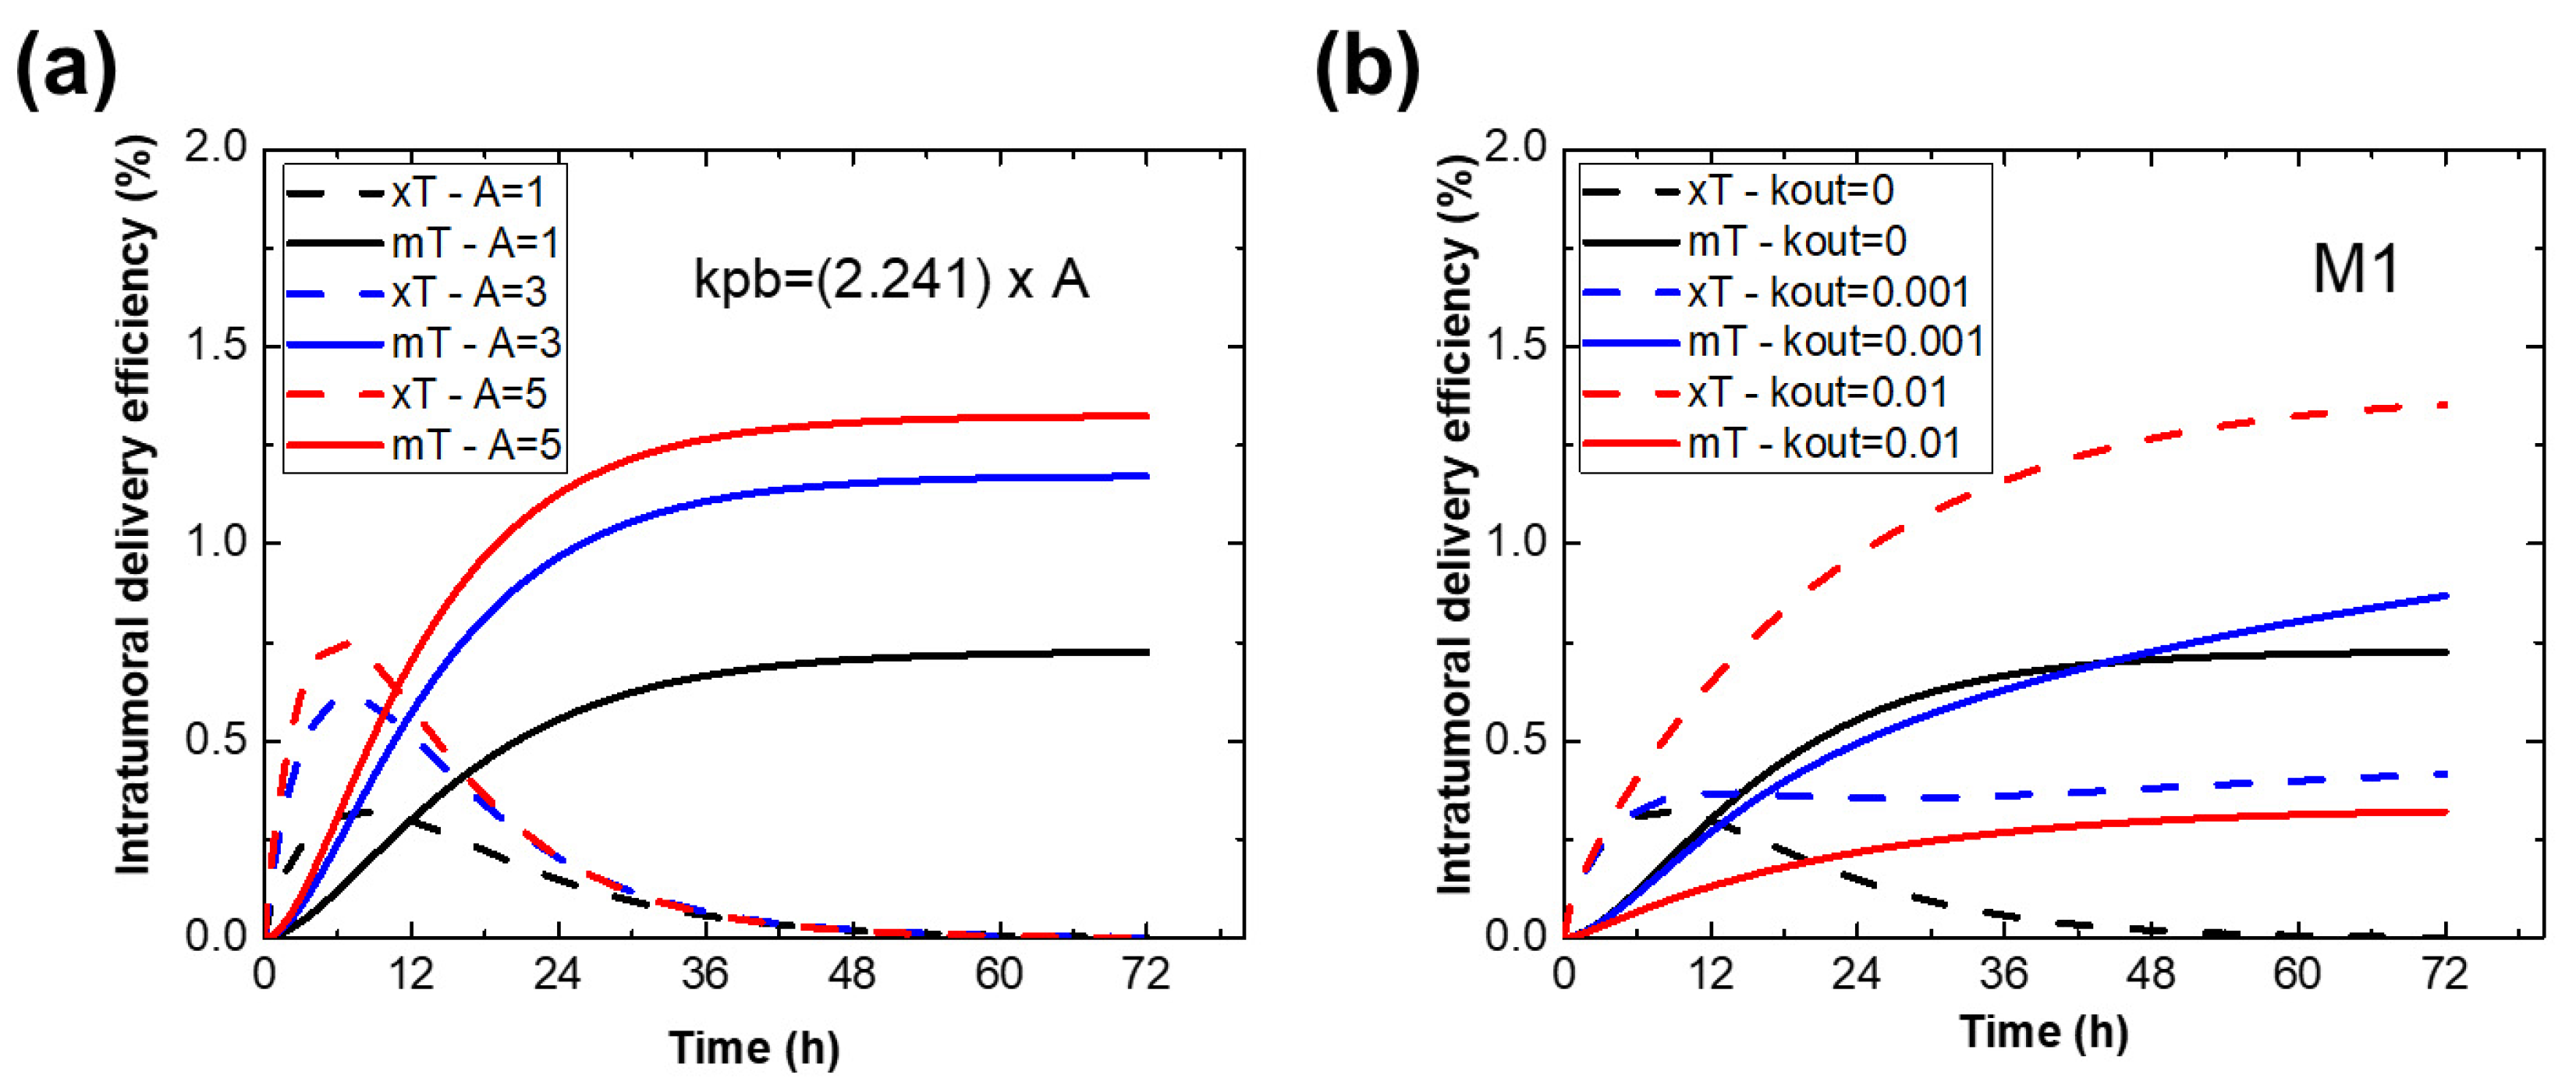
2.5. Effect of Parameters on the Immune Cell-Mediated Compartment Model
3. Discussion
4. Materials and Methods
4.1. BNF Nanoparticles
4.2. Macrophage Culturing and Polarization
4.3. In Vitro Nanoparticle Uptake Experiments
4.4. Intracellular Iron Quantification
4.5. Development of The Pharmacokinetic (PK) Model
4.5.1. Estimating , and from In Vivo PK and BD Data with the 2-Compartment Model
4.5.2. Estimating and from In Vivo BD Data
4.5.3. Estimating and from In Vitro Data
4.6. Simulations, Fitting and Statistical Analysis of Data
5. Conclusions
Supplementary Materials
Author Contributions
Funding
Institutional Review Board Statement
Informed Consent Statement
Data Availability Statement
Conflicts of Interest
References
- Cole, A.J.; Yang, V.C.; David, A.E. Cancer Theranostics: The Rise of Targeted Magnetic Nanoparticles. Trends Biotechnol. 2011, 29, 323–332. [Google Scholar] [CrossRef] [PubMed] [Green Version]
- Wilhelm, S.; Tavares, A.J.; Dai, Q.; Ohta, S.; Audet, J.; Dvorak, H.F.; Chan, W.C.W. Analysis of Nanoparticle Delivery to Tumours. Nat. Rev. Mater. 2016, 1, 16014. [Google Scholar] [CrossRef]
- Soetaert, F.; Korangath, P.; Serantes, D.; Fiering, S.; Ivkov, R. Cancer Therapy with Iron Oxide Nanoparticles: Agents of Thermal and Immune Therapies. Adv. Drug Deliv. Rev. 2020, 163–164, 65–83. [Google Scholar] [CrossRef] [PubMed]
- van der Meel, R.; Lammers, T.; Hennink, W.E. Cancer Nanomedicines: Oversold or Underappreciated? Expert Opin. Drug Deliv. 2017, 14, 1–5. [Google Scholar] [CrossRef] [PubMed] [Green Version]
- Ulmschneider, M.B.; Searson, P.C. Mathematical Models of the Steps Involved in the Systemic Delivery of a Chemotherapeutic to a Solid Tumor: From Circulation to Survival. J. Control. Release 2015, 212, 78–84. [Google Scholar] [CrossRef] [PubMed] [Green Version]
- Hitzman, C.J.; Wattenberg, L.W.; Wiedmann, T.S. Pharmacokinetics of 5-Fluorouracil in the Hamster Following Inhalation Delivery of Lipid-Coated Nanoparticles. J. Pharm. Sci. 2006, 95, 1196–1211. [Google Scholar] [CrossRef]
- Zhang, H.; Zhang, F.; Yan, S. Preparation, in Vitro Release, and Pharmacokinetics in Rabbits of Lyophilized Injection of Sorafenib Solid Lipid Nanoparticles. Int. J. Nanomed. 2012, 7, 2901. [Google Scholar] [CrossRef] [Green Version]
- Schluep, T.; Hwang, J.; Hildebrandt, I.J.; Czernin, J.; Choi, C.H.J.; Alabi, C.A.; Mack, B.C.; Davis, M.E. Pharmacokinetics and Tumor Dynamics of the Nanoparticle IT-101 from PET Imaging and Tumor Histological Measurements. Proc. Natl. Acad. Sci. USA 2009, 106, 11394–11399. [Google Scholar] [CrossRef] [Green Version]
- Bachler, G.; von Goetz, N.; Hungerbühler, K. A Physiologically Based Pharmacokinetic Model for Ionic Silver and Silver Nanoparticles. Int. J. Nanomed. 2013, 8, 3365. [Google Scholar] [CrossRef] [Green Version]
- Gibaldi, M.; Perrier, D. Pharmacokinetics (Drugs and the Pharmaceutical Sciences, Volume 15), 2nd ed.; Informa Healthcare: London, UK, 1982. [Google Scholar]
- Wong, A.D.; Ye, M.; Ulmschneider, M.B.; Searson, P.C. Quantitative Analysis of the Enhanced Permeation and Retention (EPR) Effect. PLoS ONE 2015, 10, e0123461. [Google Scholar] [CrossRef]
- Barenholz, Y. Doxil®—The First FDA-Approved Nano-Drug: Lessons Learned; Elsevier: Amsterdam, The Netherlands, 2012; Volume 160, pp. 117–134. [Google Scholar]
- Thurber, G.M.; Dane Wittrup, K. A Mechanistic Compartmental Model for Total Antibody Uptake in Tumors. J. Theor. Biol. 2012, 314, 57–68. [Google Scholar] [CrossRef] [Green Version]
- Schmidt, M.M.; Wittrup, K.D. A Modeling Analysis of the Effects of Molecular Size and Binding Affinity on Tumor Targeting. Mol. Cancer Ther. 2009, 8, 2861–2871. [Google Scholar] [CrossRef] [Green Version]
- Sousa-Junior, A.A.; Mendanha, S.A.; Carrião, M.S.; Capistrano, G.; Próspero, A.G.; Soares, G.A.; Cintra, E.R.; Santos, S.F.O.O.; Zufelato, N.; Alonso, A.; et al. Predictive Model for Delivery Efficiency: Erythrocyte Membrane-Camouflaged Magnetofluorescent Nanocarriers Study. Mol. Pharm. 2020, 17, 837–851. [Google Scholar] [CrossRef]
- Chauhan, V.P.; Martin, J.D.; Liu, H.; Lacorre, D.A.; Jain, S.R.; Kozin, S.V.; Stylianopoulos, T.; Mousa, A.S.; Han, X.; Adstamongkonkul, P.; et al. Angiotensin Inhibition Enhances Drug Delivery and Potentiates Chemotherapy by Decompressing Tumour Blood Vessels. Nat. Commun. 2013, 4, 2516. [Google Scholar] [CrossRef] [Green Version]
- Korangath, P.; Barnett, J.D.; Sharma, A.; Henderson, E.T.; Stewart, J.; Yu, S.H.; Kandala, S.K.; Yang, C.T.; Caserto, J.S.; Hedayati, M.; et al. Nanoparticle Interactions with Immune Cells Dominate Tumor Retention and Induce T Cell–Mediated Tumor Suppression in Models of Breast Cancer. Sci. Adv. 2020, 6, eaay1601. [Google Scholar] [CrossRef] [Green Version]
- Kingston, B.R.; Lin, Z.P.; Ouyang, B.; MacMillan, P.; Ngai, J.; Syed, A.M.; Sindhwani, S.; Chan, W.C.W. Specific Endothelial Cells Govern Nanoparticle Entry into Solid Tumors. ACS Nano 2021, 15, 14080–14094. [Google Scholar] [CrossRef]
- Wu, J.L.Y.; Stordy, B.P.; Nguyen, L.N.M.; Deutschman, C.P.; Chan, W.C.W. A Proposed Mathematical Description of in Vivo Nanoparticle Delivery. Adv. Drug Deliv. Rev. 2022, 189, 114520. [Google Scholar] [CrossRef]
- Natarajan, A.; Gruettner, C.; Ivkov, R.; Denardo, G.L.; Mirick, G.; Yuan, A.; Foreman, A.; DeNardo, S.J. NanoFerrite Particle Based Radioimmunonanoparticles: Binding Affinity and in Vivo Pharmacokinetics. Bioconjug. Chem. 2008, 19, 1211–1218. [Google Scholar] [CrossRef] [Green Version]
- Lunov, O.; Zablotskii, V.; Syrovets, T.; Röcker, C.; Tron, K.; Nienhaus, G.U.; Simmet, T. Modeling Receptor-Mediated Endocytosis of Polymer-Functionalized Iron Oxide Nanoparticles by Human Macrophages. Biomaterials 2011, 32, 547–555. [Google Scholar] [CrossRef]
- Gao, H.; Shi, W.; Freund, L.B. Mechanics of Receptor-Mediated Endocytosis. Proc. Natl. Acad. Sci. USA 2005, 102, 9469–9474. [Google Scholar] [CrossRef]
- Decuzzi, P.; Ferrari, M. The Role of Specific and Non-Specific Interactions in Receptor-Mediated Endocytosis of Nanoparticles. Biomaterials 2007, 28, 2915–2922. [Google Scholar] [CrossRef] [PubMed]
- Prospero, A.G.; Buranello, L.P.; Fernandes, C.A.; dos Santos, L.D.; Soares, G.; Rossini, B.C.; Zufelato, N.; Bakuzis, A.F.; de Mattos Fontes, M.R.; de Arruda Miranda, J.R. Corona Protein Impacts on Alternating Current Biosusceptometry Signal and Circulation Times of Differently Coated MnFe 2 O 4 Nanoparticles. Nanomedicine 2021, 16, 2189–2206. [Google Scholar] [CrossRef] [PubMed]
- Healy, S.; Bakuzis, A.F.; Goodwill, P.W.; Attaluri, A.; Bulte, J.W.M.; Ivkov, R. Clinical Magnetic Hyperthermia Requires Integrated Magnetic Particle Imaging. WIREs Nanomed. Nanobiotechnol. 2022, 1–20. [Google Scholar] [CrossRef] [PubMed]
- Ouyang, B.; Poon, W.; Zhang, Y.N.; Lin, Z.P.; Kingston, B.R.; Tavares, A.J.; Zhang, Y.; Chen, J.; Valic, M.S.; Syed, A.M.; et al. The Dose Threshold for Nanoparticle Tumour Delivery. Nat. Mater. 2020, 19, 1362–1371. [Google Scholar] [CrossRef]
- Russell, D.G.; Huang, L.; VanderVen, B.C. Immunometabolism at the Interface between Macrophages and Pathogens. Nat. Rev. Immunol. 2019, 19, 291–304. [Google Scholar] [CrossRef]
- Soares, G.A.; Prospero, A.G.; Calabresi, M.F.; Rodrigues, D.S.; Simoes, L.G.; Quini, C.C.; Matos, R.R.; Pinto, L.A.; Sousa-Junior, A.A.; Bakuzis, A.F.; et al. Multichannel AC Biosusceptometry System to Map Biodistribution and Assess the Pharmacokinetic Profile of Magnetic Nanoparticles by Imaging. IEEE Trans. Nanobiosci. 2019, 18, 456–462. [Google Scholar] [CrossRef]
- Hedayati, M.; Abubaker-Sharif, B.; Khattab, M.; Razavi, A.; Mohammed, I.; Nejad, A.; Wabler, M.; Zhou, H.; Mihalic, J.; Gruettner, C.; et al. An Optimised Spectrophotometric Assay for Convenient and Accurate Quantitation of Intracellular Iron from Iron Oxide Nanoparticles. Int. J. Hyperth. 2018, 34, 373–381. [Google Scholar] [CrossRef]


| Diameter [nm] | |||||
|---|---|---|---|---|---|
| 20 | 20.169 ± 1.999 | 0.043 ± 0.003 | 9.085 ± 1.039 | 0.095 ± 0.016 | 11.032 ± 2.253 |
| 30 | 09.304 ± 0.641 | 0.038 ± 0.006 | 2.325 ± 0.238 | 0.151 ± 0.031 | 06.866 ± 0.685 |
| 100 | 20.273 ± 0.348 | 0.052 ± 0.005 | 2.241 ± 0.094 | 0.471 ± 0.050 | 17.613 ± 0.364 |
| BNF-Plain | |||||
|---|---|---|---|---|---|
| 0.125 | 0.250 | 0.500 | Average * | ||
| M0 | 0.00146 ± 0.00150 | 0.00070 ± 0.00012 | 0.00061 ± 0.00022 | 0.00092 ± 0.00051 | |
| 0.13862 ± 0.20191 | 0.11676 ± 0.03122 | 0.09149 ± 0.05568 | 0.11562 ± 0.07059 | ||
| M1 | 0.00099 ± 0.00023 | 0.00101 ± 0.00029 | 0.00103 ± 0.00027 | 0.00101 ± 0.00015 | |
| 0.00000 ± 0.02115 | 0.00000 ± 0.02621 | 0.00000 ± 0.02408 | 0.00000 ± 0.01380 | ||
| M2 | 0.00079 ± 0.00021 | 0.00057 ± 0.00018 | 0.00048 ± 0.00014 | 0.00061 ± 0.00010 | |
| 0.08162 ± 0.03797 | 0.06572 ± 0.04289 | 0.06319 ± 0.03955 | 0.07018 ± 0.02320 | ||
| BNF-Her | |||||
|---|---|---|---|---|---|
| 0.125 | 0.250 | 0.500 | Average * | ||
| M0 | 0.00103 ± 0.00007 | 0.00150 ± 0.00075 | 0.00088 ± 0.00014 | 0.00114 ± 0.00025 | |
| 0.08675 ± 0.01000 | 0.09434 ± 0.07842 | 0.00000 ± 0.01436 | 0.06036 ± 0.02678 | ||
| M1 | 0.00267 ± 0.00091 | 0.00232 ± 0.00058 | 0.00215 ± 0.00080 | 0.00238 ± 0.00045 | |
| 0.00000 ± 0.03106 | 0.00000 ± 0.02281 | 0.00000 ± 0.03412 | 0.00000 ± 0.01716 | ||
| M2 | 0.00103 ± 0.00040 | 0.00114 ± 0.00052 | 0.00088 ± 0.00026 | 0.00102 ± 0.00024 | |
| 0.06352 ± 0.05048 | 0.06970 ± 0.06238 | 0.00000 ± 0.02754 | 0.04441 ± 0.02828 | ||
| BNF-IgG | |||||
|---|---|---|---|---|---|
| 0.125 | 0.250 | 0.500 | Average * | ||
| M0 | 0.00100 ± 0.00050 | 0.00075 ± 0.00018 | 0.00083 ± 0.00029 | 0.00086 ± 0.00020 | |
| 0.13548 ± 0.09770 | 0.11884 ± 0.04218 | 0.13587 ± 0.06790 | 0.13006 ± 0.04208 | ||
| M1 | 0.00129 ± 0.00038 | 0.00131 ± 0.00033 | 0.00137 ± 0.00036 | 0.00132 ± 0.00021 | |
| 0.00682 ± 0.02855 | 0.00000 ± 0.02288 | 0.01692 ± 0.02647 | 0.00791 ± 0.01505 | ||
| M2 | 0.00102 ± 0.00064 | 0.00074 ± 0.00024 | 0.00086 ± 0.00045 | 0.00087 ± 0.00027 | |
| 0.14503 ± 0.12777 | 0.11689 ± 0.05677 | 0.14133 ± 0.10473 | 0.13442 ± 0.05823 | ||
| Nanoparticle | Lot Number | Mean Hydrodynamic Diameter [nm] | Polydispersity Index (PDI) | Zeta Potential [mV] | Protein Concentration [µg/mg] |
|---|---|---|---|---|---|
| BNF-Plain | 0901810 | 102.3 | 0.115 | −3.4 ± 7.0 | N/A |
| BNF-HER | 1261810 | 140.9 | 0.117 | −6.6 ± 3.6 | 32.6 |
| BNF-IgG | 0981810 | 130.0 | 0.109 | −5.1 ± 6.6 | 35.5 |
Publisher’s Note: MDPI stays neutral with regard to jurisdictional claims in published maps and institutional affiliations. |
© 2022 by the authors. Licensee MDPI, Basel, Switzerland. This article is an open access article distributed under the terms and conditions of the Creative Commons Attribution (CC BY) license (https://creativecommons.org/licenses/by/4.0/).
Share and Cite
Sousa-Junior, A.; Yang, C.-T.; Korangath, P.; Ivkov, R.; Bakuzis, A. A Predictive Pharmacokinetic Model for Immune Cell-Mediated Uptake and Retention of Nanoparticles in Tumors. Int. J. Mol. Sci. 2022, 23, 15664. https://doi.org/10.3390/ijms232415664
Sousa-Junior A, Yang C-T, Korangath P, Ivkov R, Bakuzis A. A Predictive Pharmacokinetic Model for Immune Cell-Mediated Uptake and Retention of Nanoparticles in Tumors. International Journal of Molecular Sciences. 2022; 23(24):15664. https://doi.org/10.3390/ijms232415664
Chicago/Turabian StyleSousa-Junior, Ailton, Chun-Ting Yang, Preethi Korangath, Robert Ivkov, and Andris Bakuzis. 2022. "A Predictive Pharmacokinetic Model for Immune Cell-Mediated Uptake and Retention of Nanoparticles in Tumors" International Journal of Molecular Sciences 23, no. 24: 15664. https://doi.org/10.3390/ijms232415664