
Nontoxic and Naturally Occurring Active Compounds as Potential Inhibitors of Biological Targets in Liriomyza trifolii

 ,
,  , ,
, ,  , , ,
, , ,  , ,
, , 
Abstract
:1. Introduction
2. Results and Discussion
2.1. Database Search, Structural Modeling, and Model Validation
2.2. Structural Modeling, In Silico Characterization, and Model Validation
2.3. Binding Site Prediction and Protein-Ligand Interaction
2.4. Molecular Docking and Binding Free Energy Calculation
2.5. Binding Pose Analysis
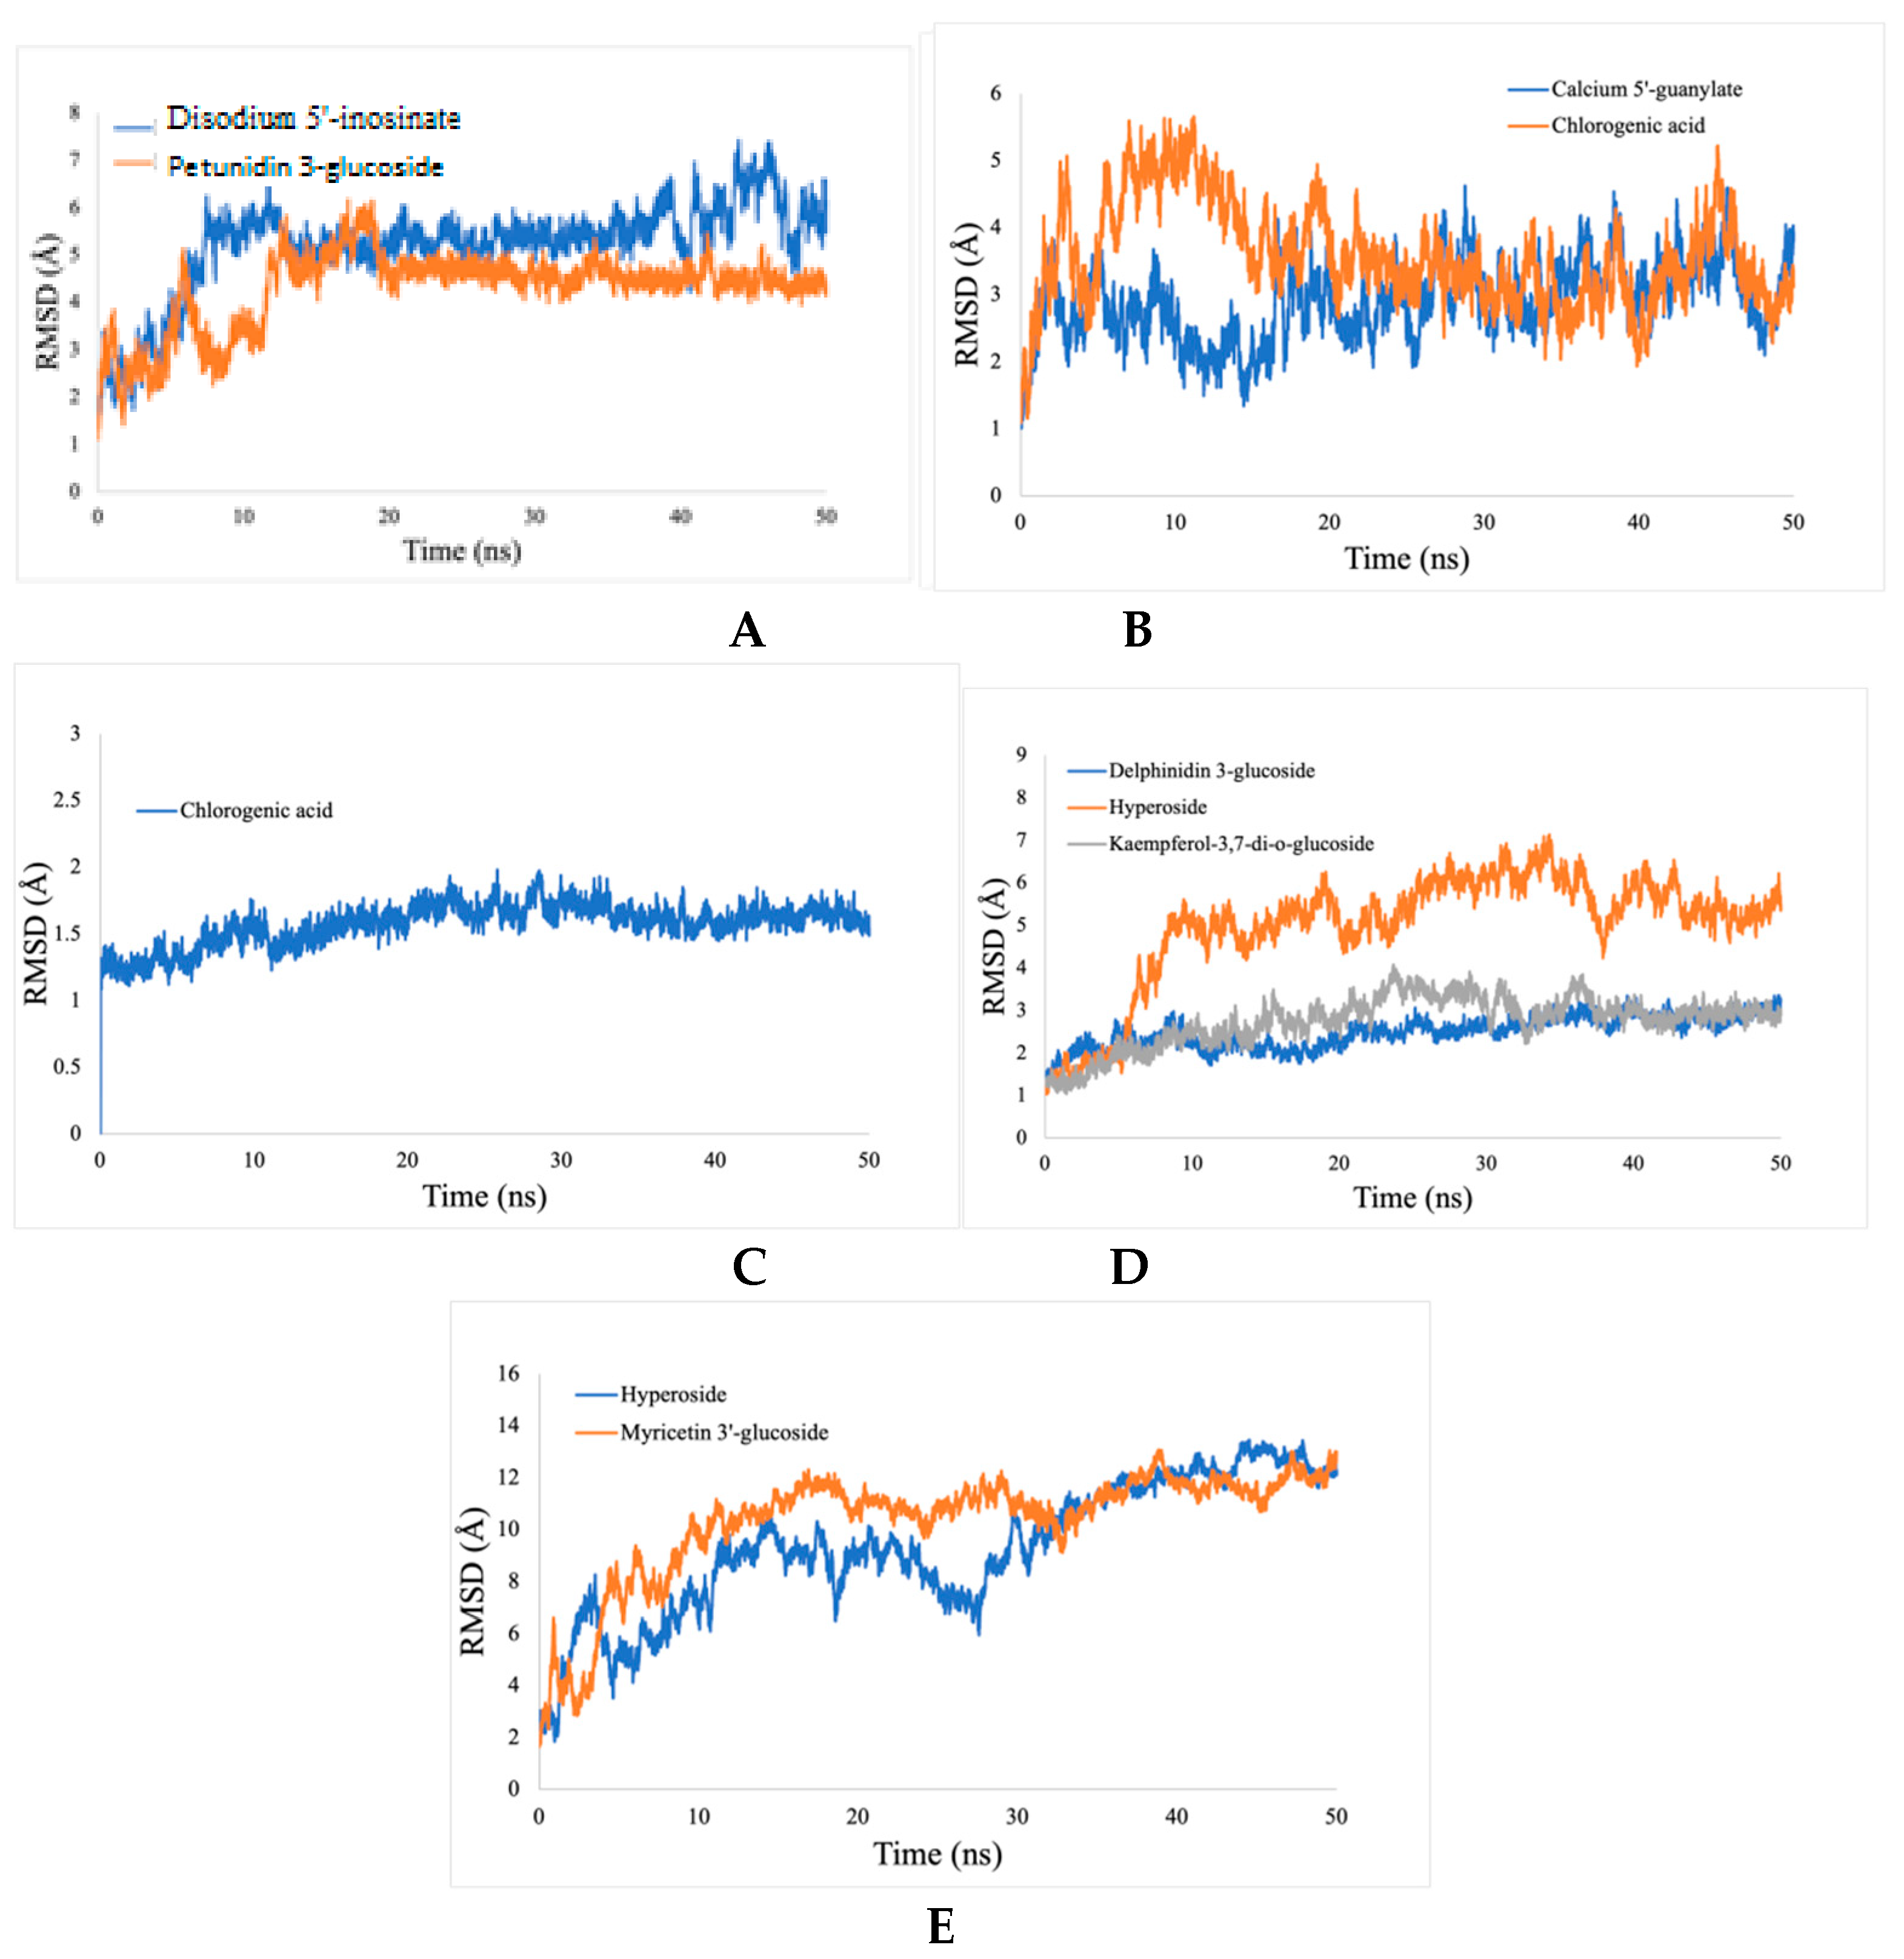
2.5.1. Root Mean Square Deviation (RMSD) Analysis
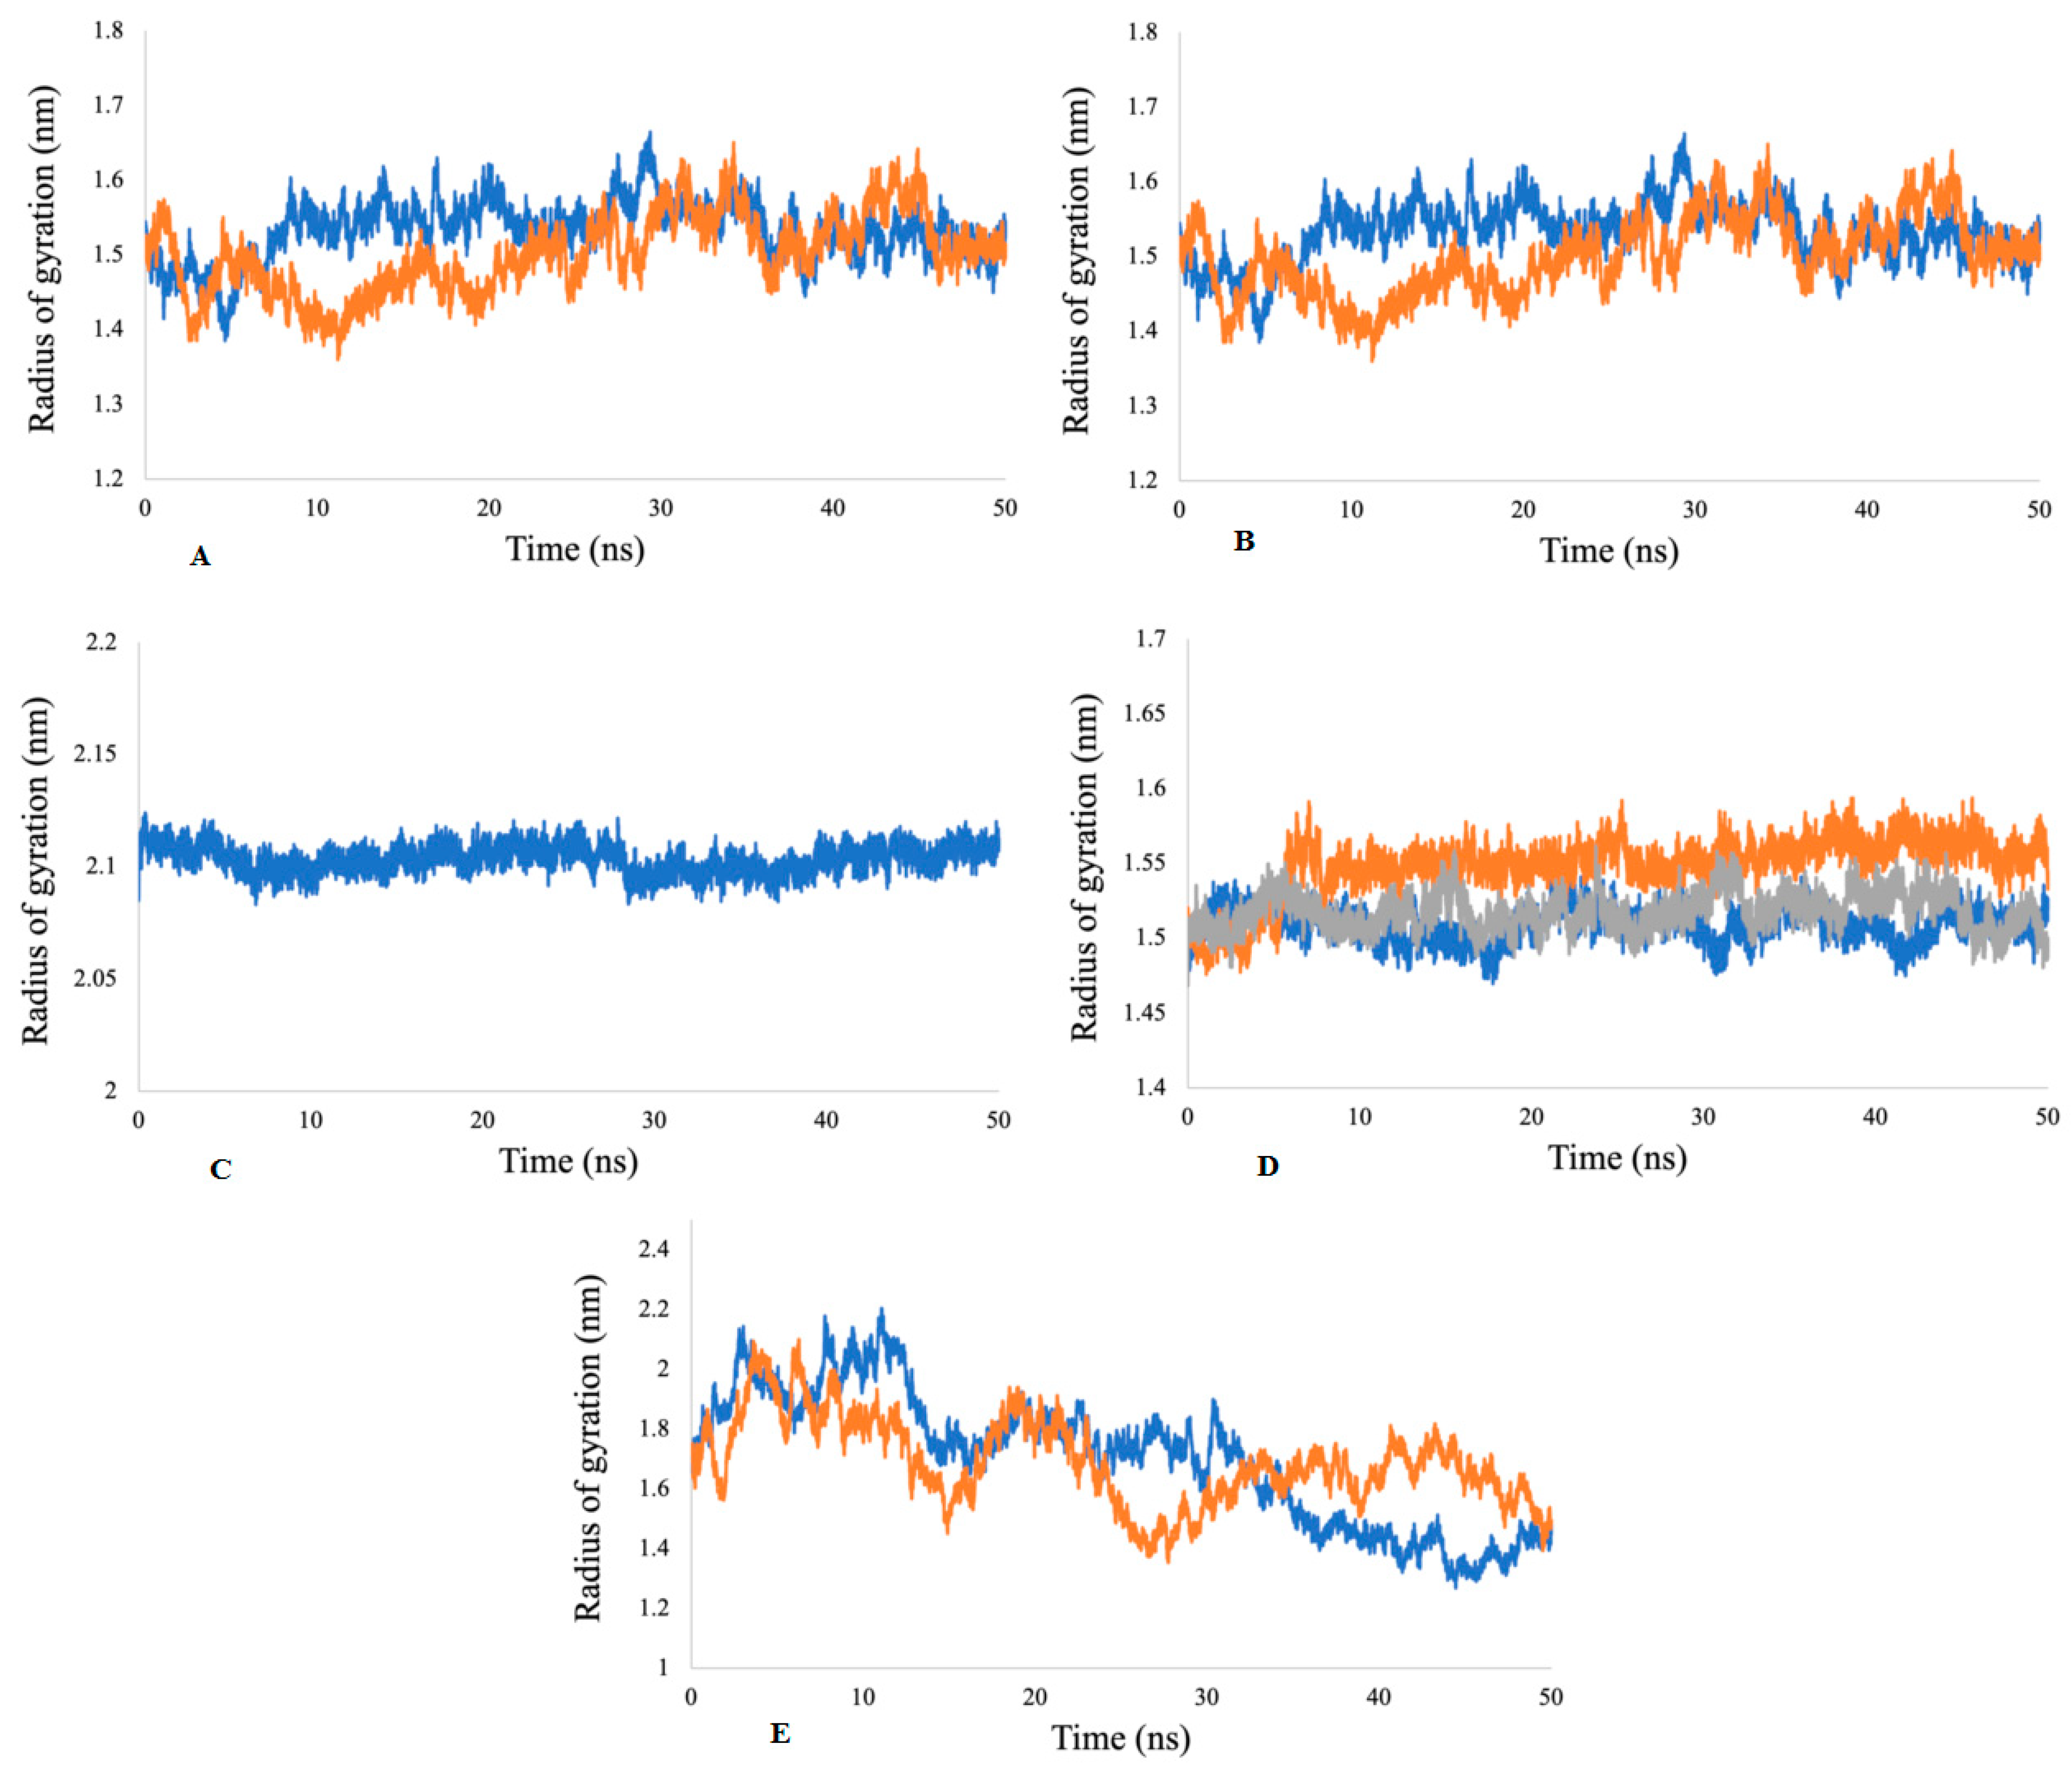
2.5.2. Radius of Gyration (Rg) Analysis
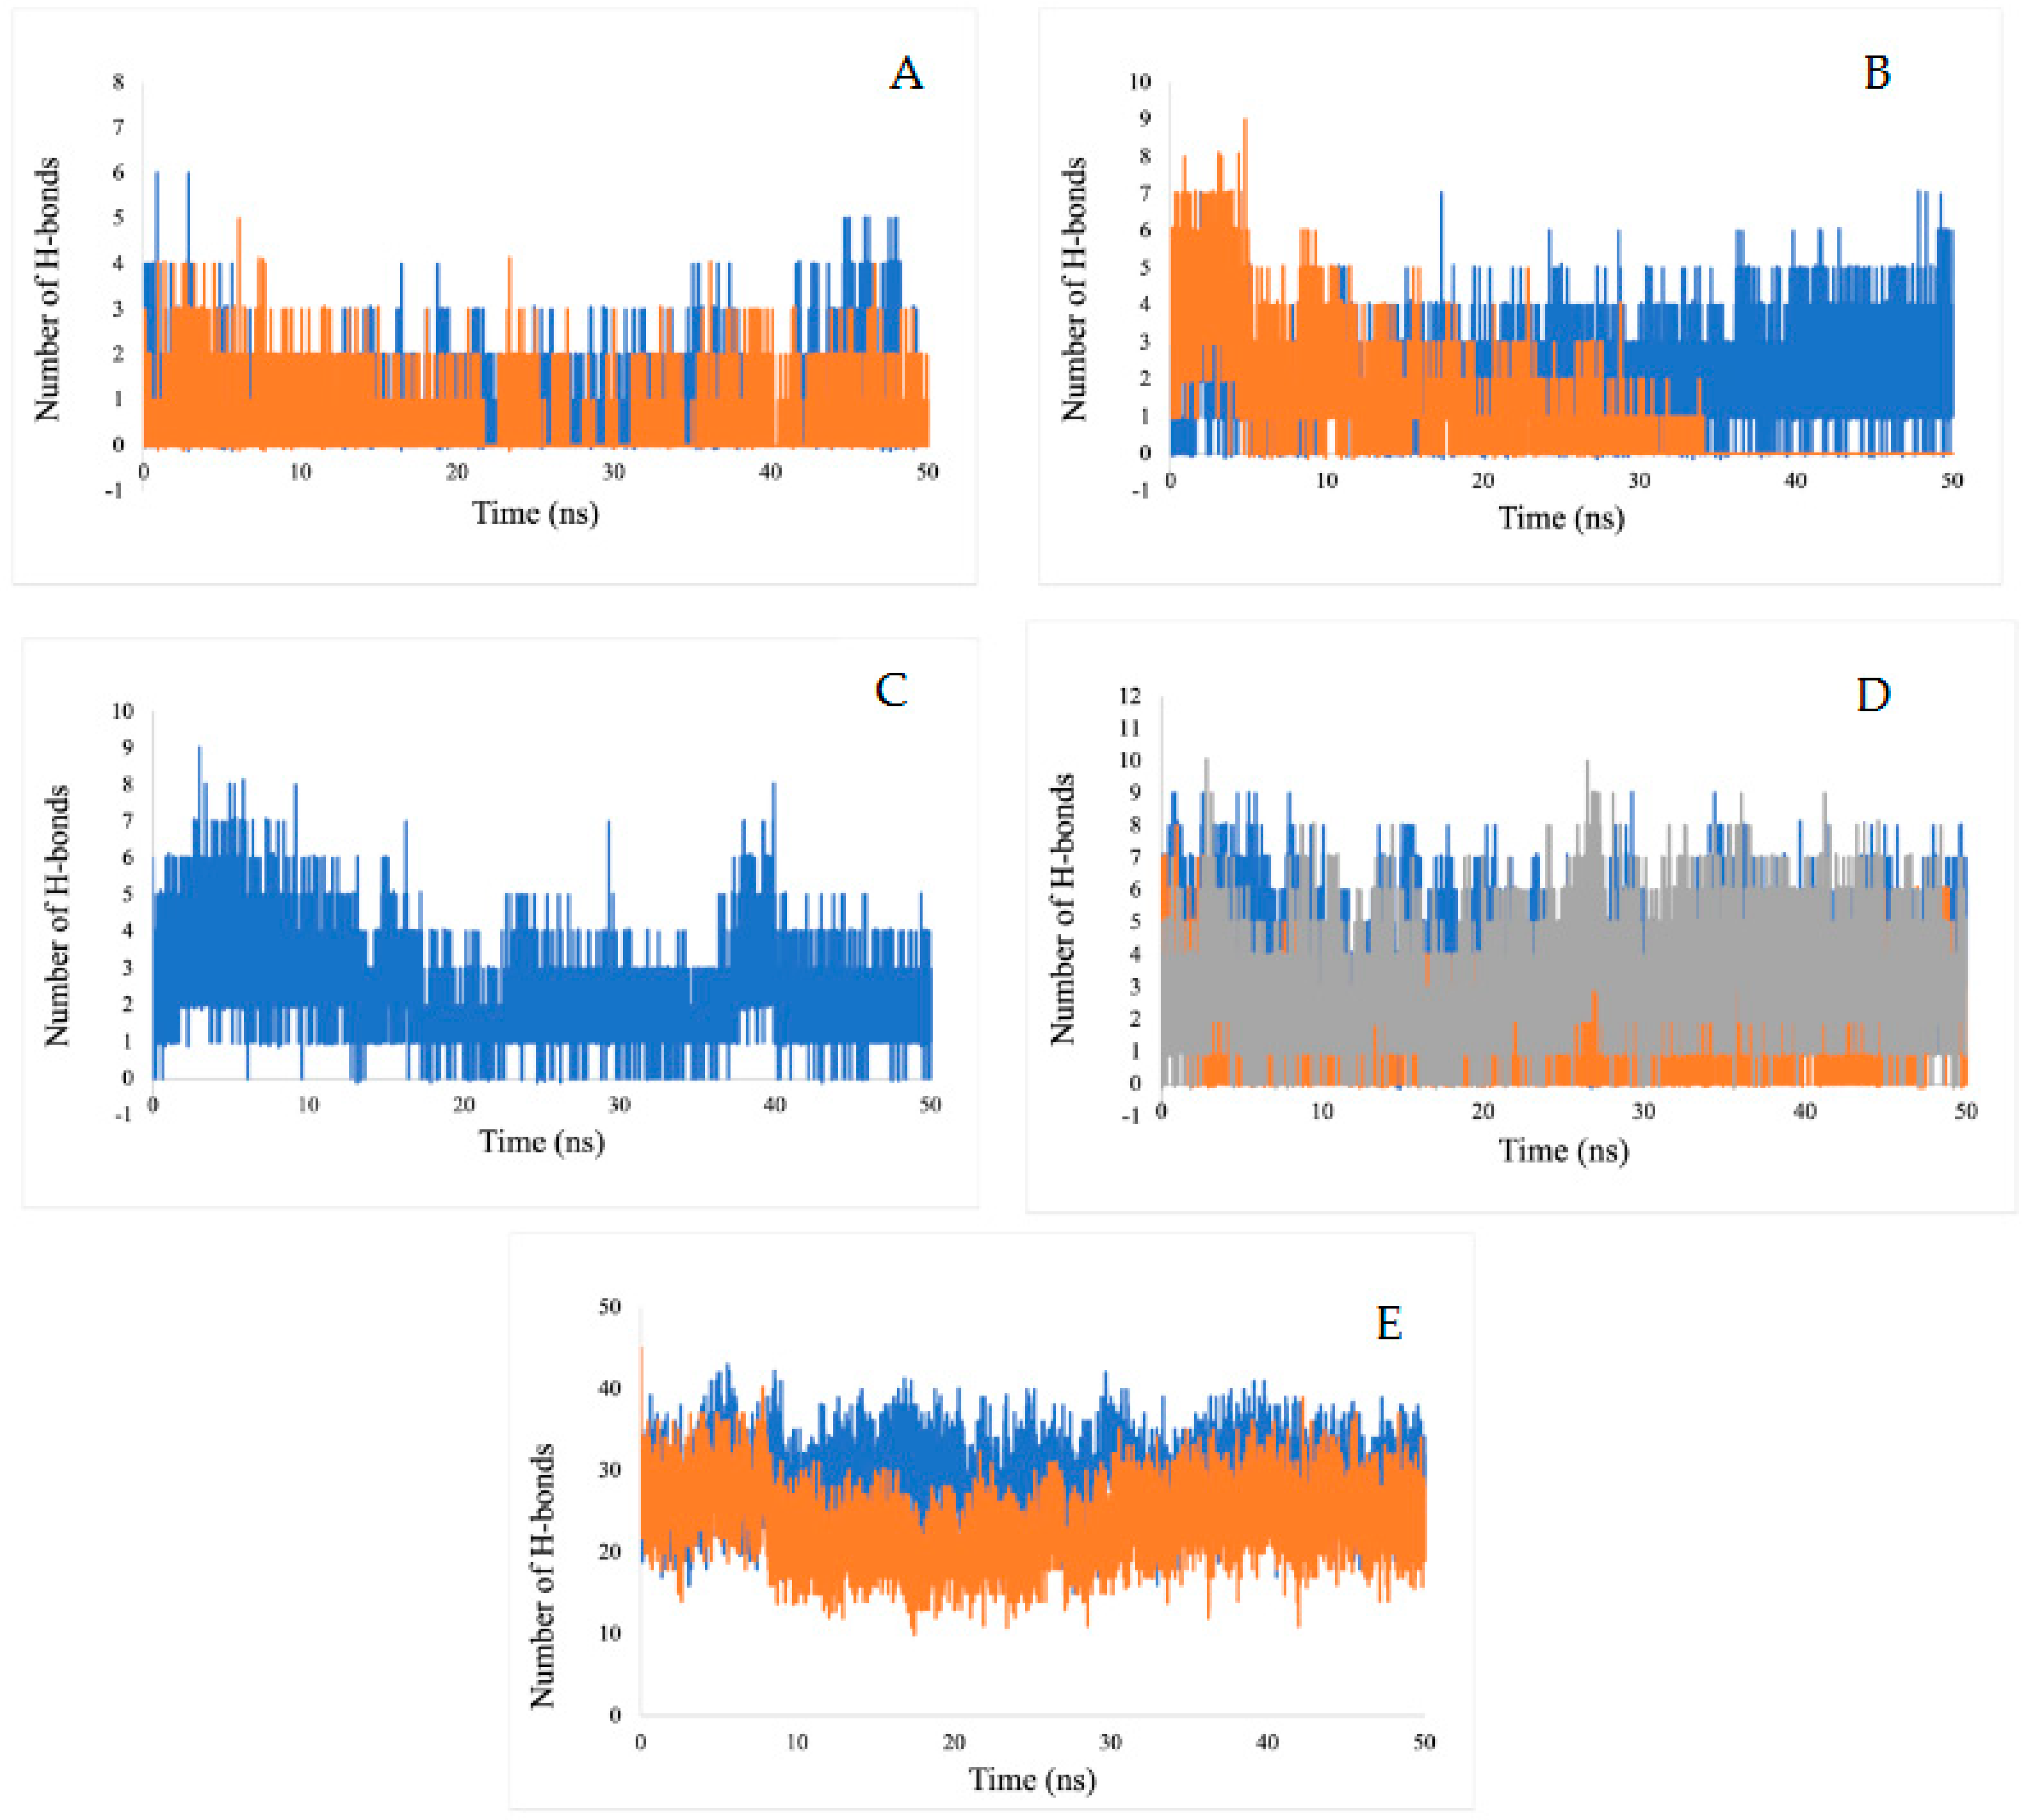
2.5.3. Hydrogen Bond Analysis
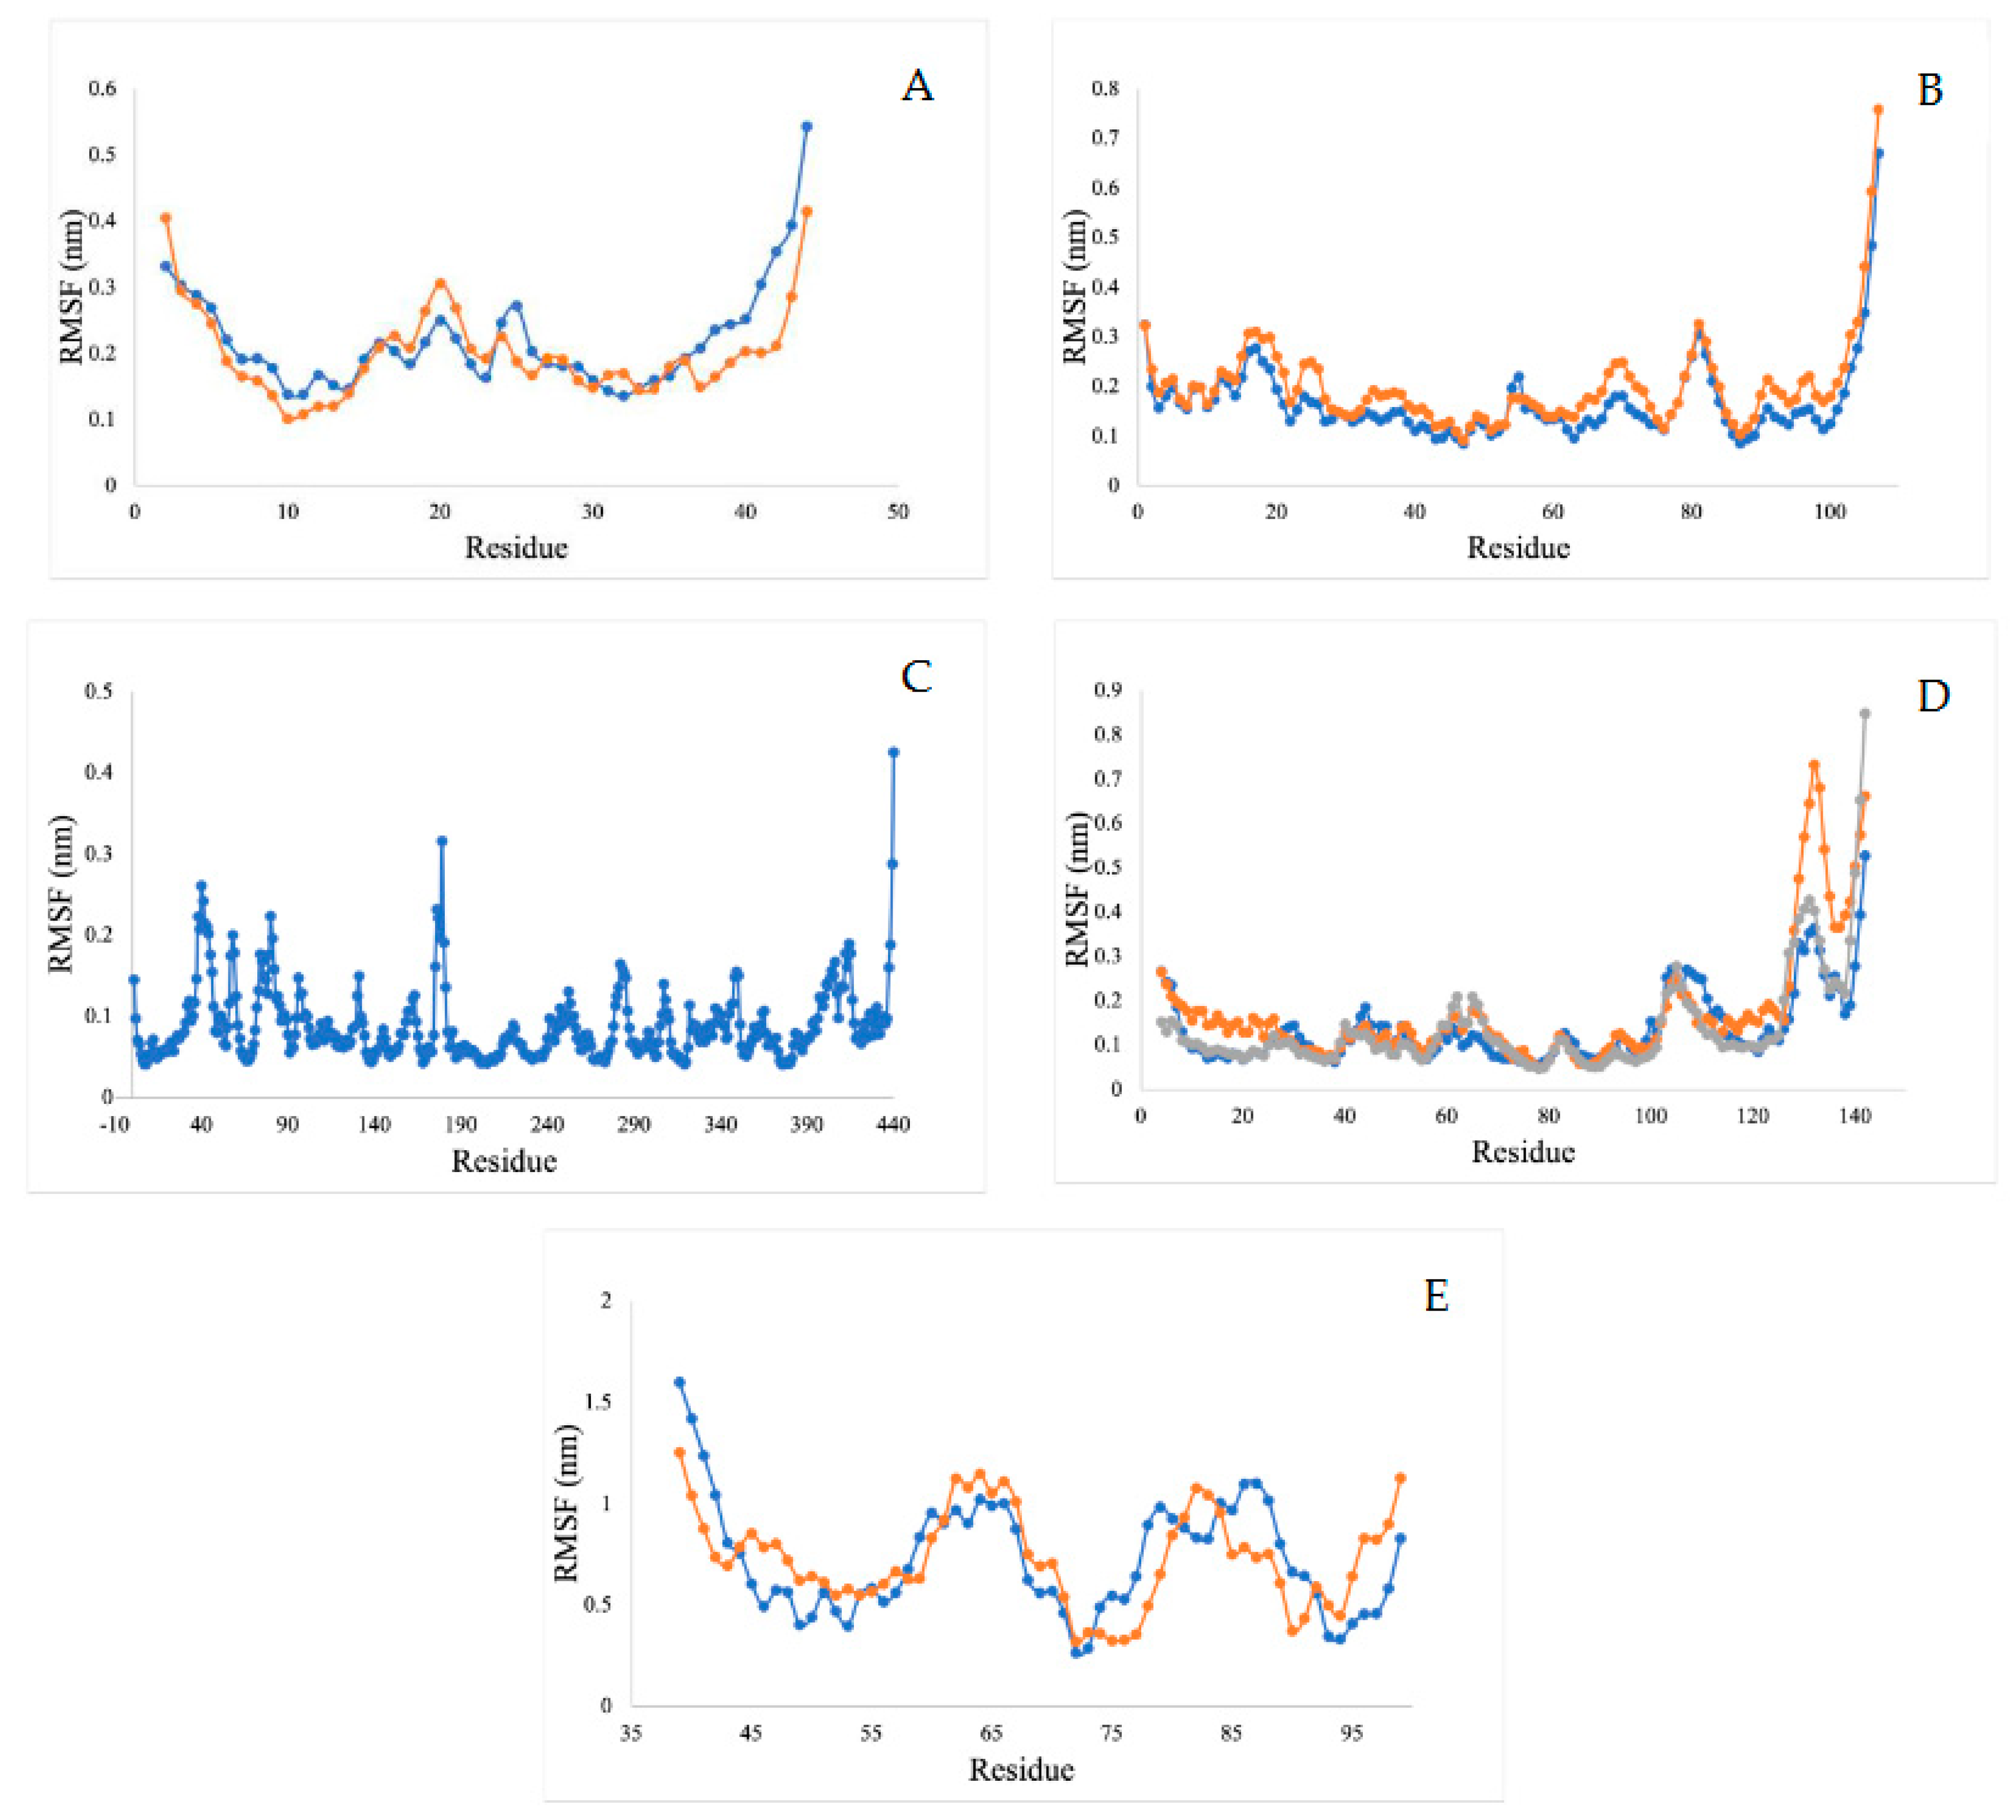
2.5.4. Root Mean Square Fluctuation Analysis (RMSF)
2.5.5. Molecular Mechanics Poisson-Boltzmann Surface Area Free Energy Calculations
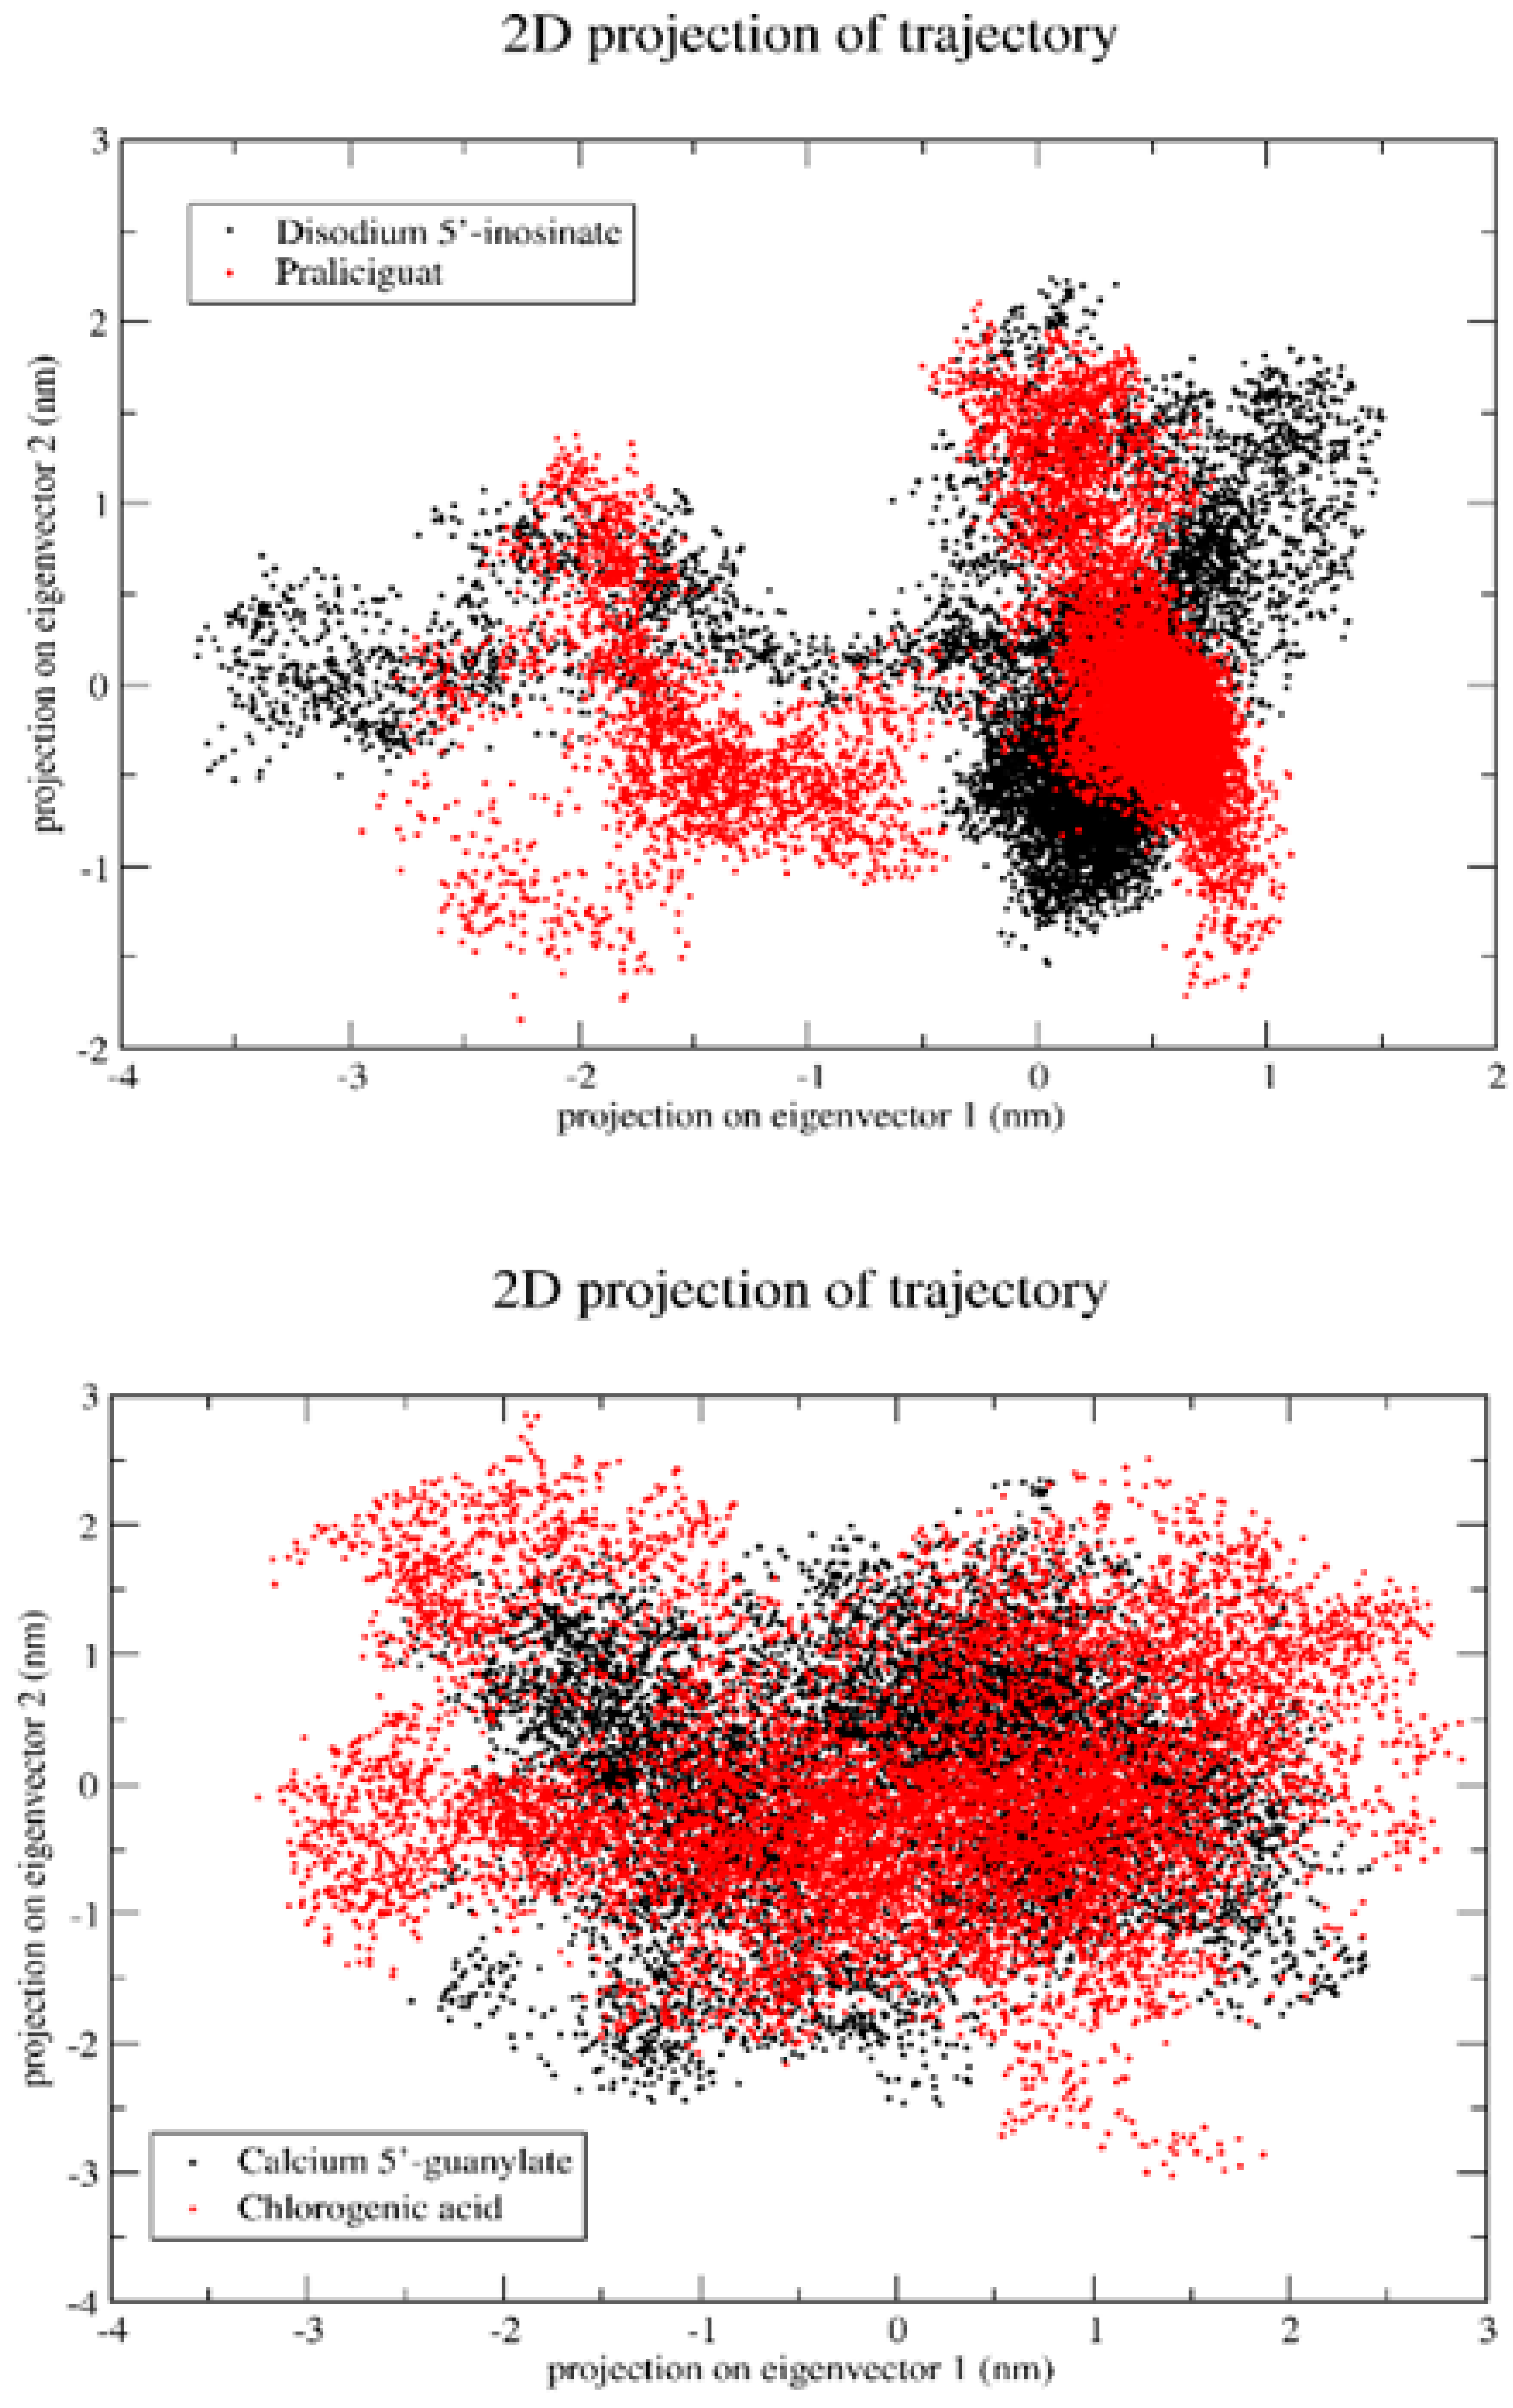
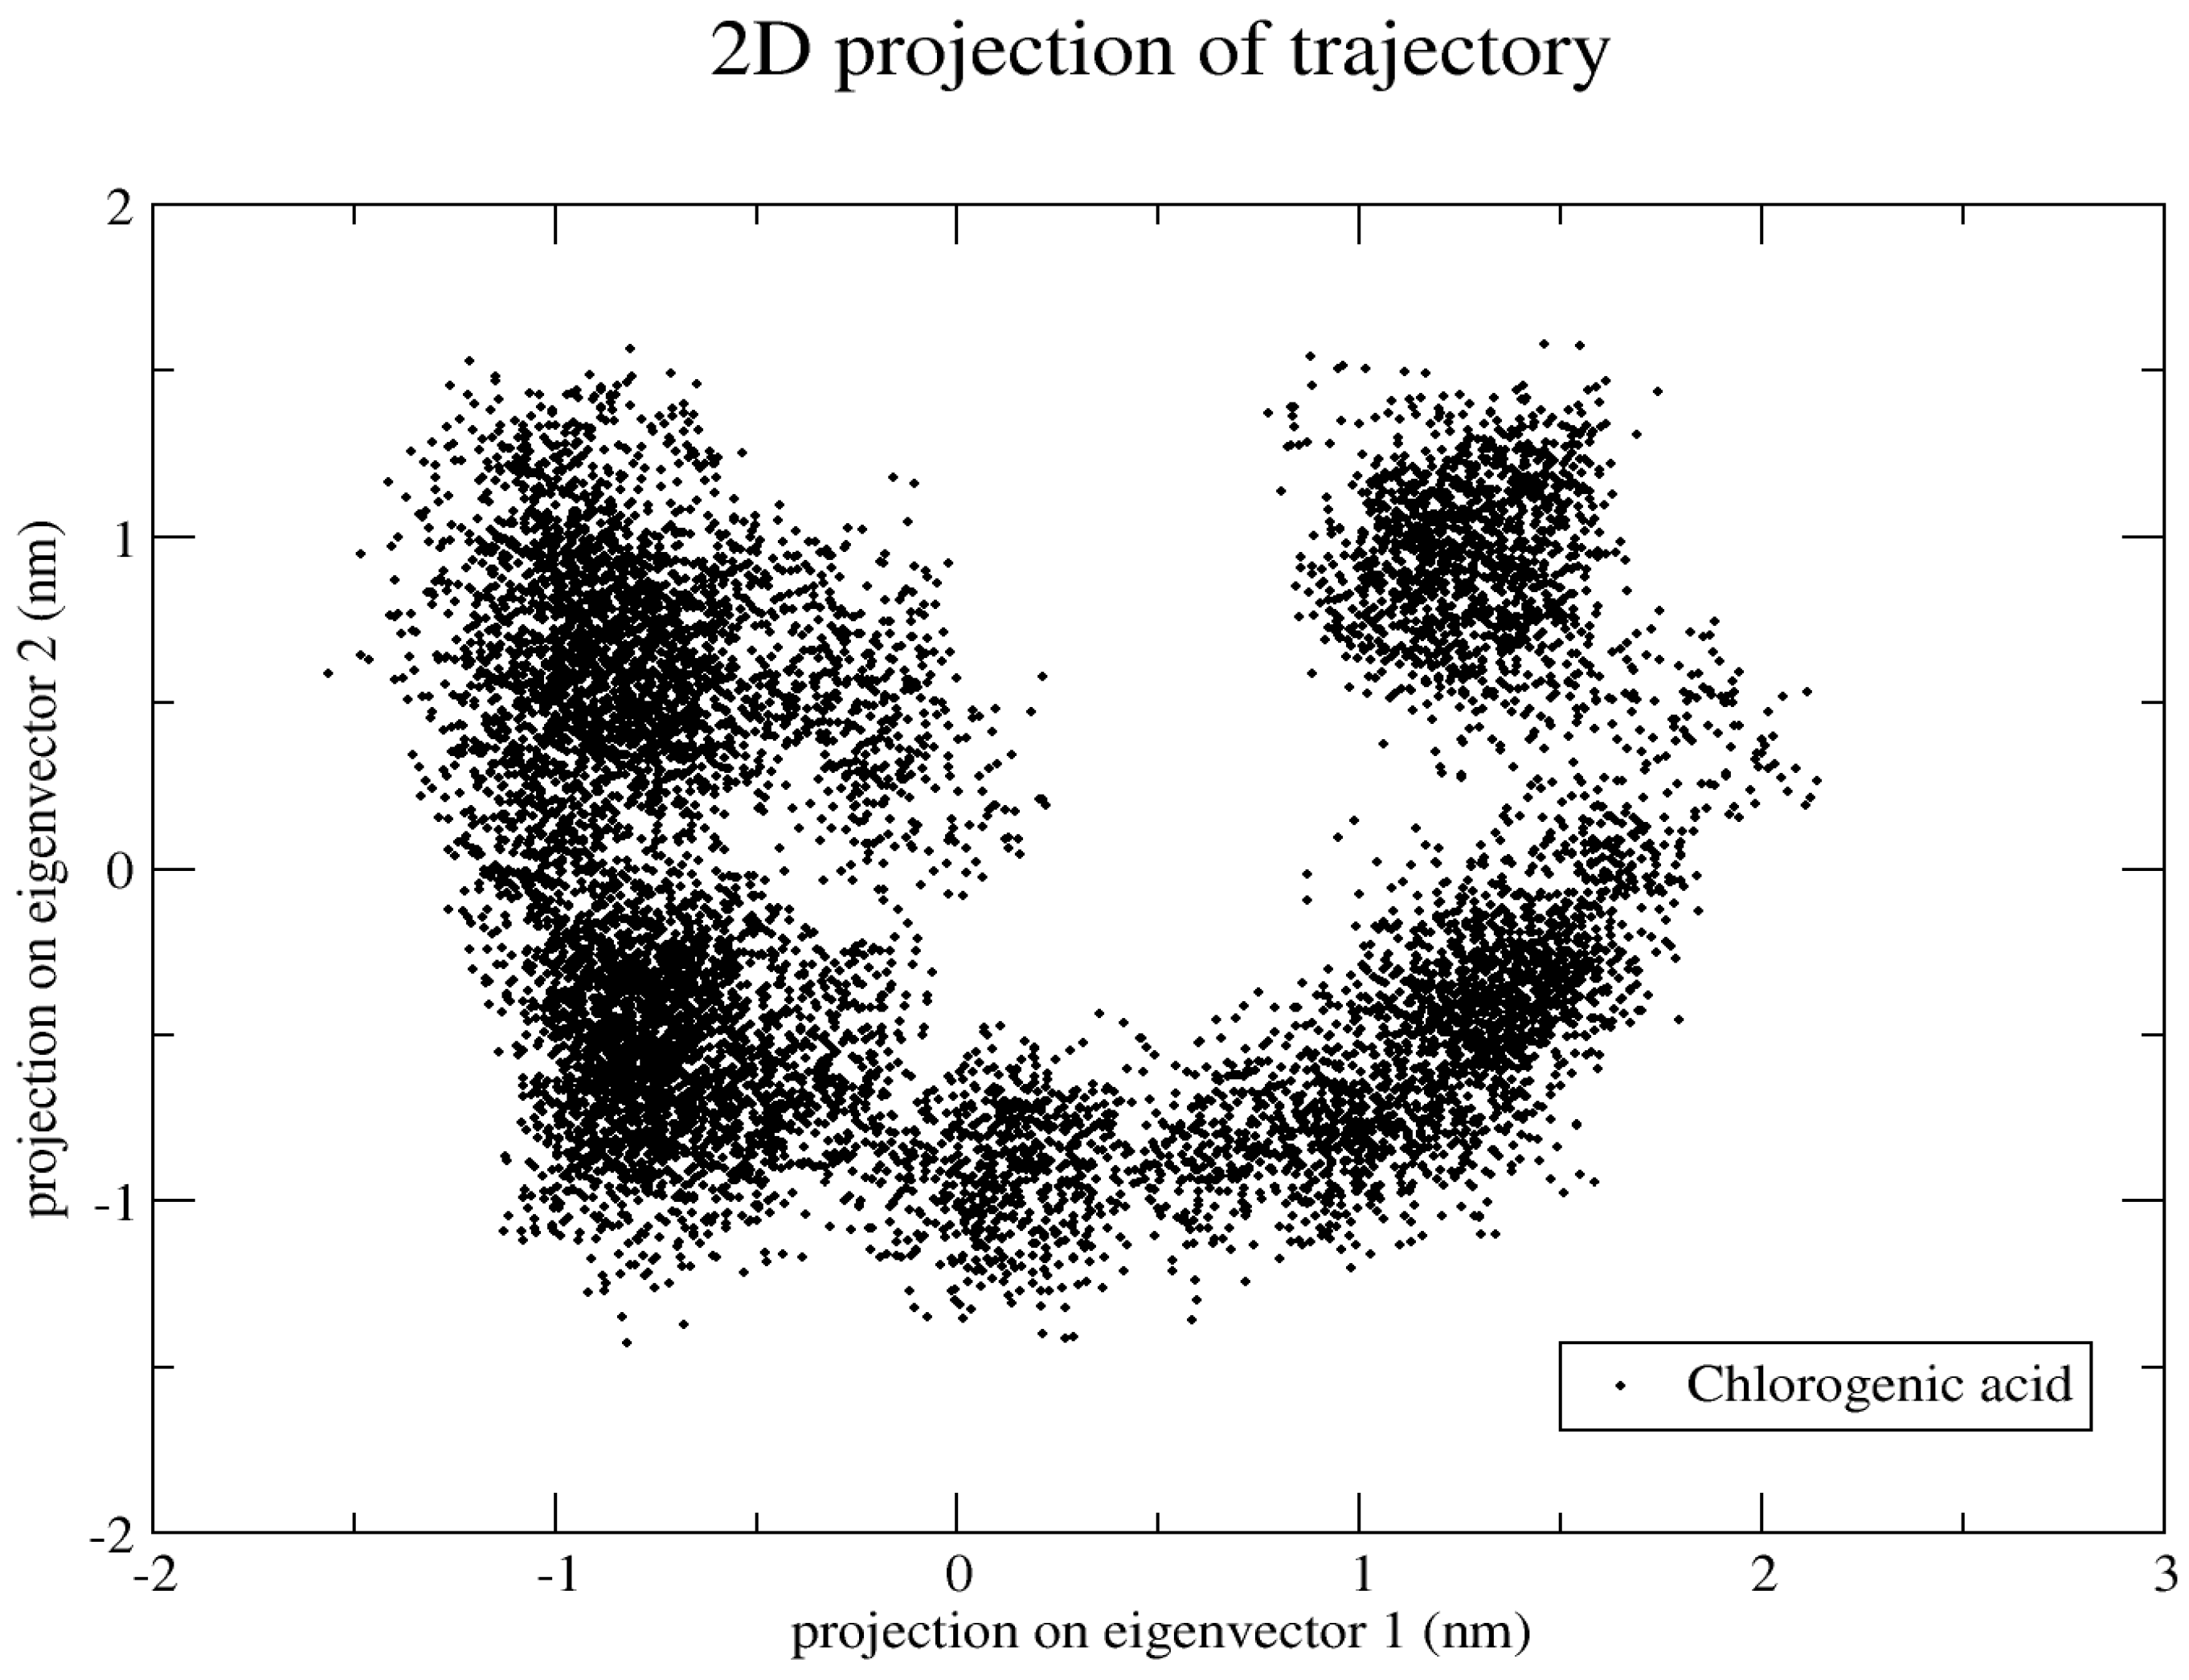
2.5.6. Principal Component Analysis (PCA)
3. Materials and Methods
3.1. Database Search, Structural Modeling, and Model Validation
3.2. Preparation of Proteins and Ligands
3.3. Binding Site Prediction and Protein-Ligand Docking
3.4. Protein Ligand Interaction Using SAMSON and Discovery Studio Software
3.5. Protein–Protein Interaction Network
3.6. Molecular Dynamics Simulation
4. Conclusions
Supplementary Materials
Author Contributions
Funding
Acknowledgments
Conflicts of Interest
References
- Berlinge, R.G. Pest Resistance to Pesticides; Department of Entomology, Clemson University: Clemson, SC, USA, 1996. [Google Scholar]
- Van der Werf, H.M.G. Assessing the impact of pesticides on the environment. Agric. Ecosyst. Environ. 1996, 60, 81–96. [Google Scholar] [CrossRef]
- Maroni, M.; Fanetti, A.C.; Metruccio, F. Risk assessment and management of occupational exposure to pesticides in agriculture. Med. Lav. 2006, 97, 430–437. [Google Scholar] [PubMed]
- Ibrahim, Y.A. Health and environmental impacts of pesticides: A responsibility principle and two novel systems for hazard classification and external cost determination. J. Toxicol. Health 2016, 3, 2056–3779. [Google Scholar] [CrossRef]
- Spencer, K.A. Agromyzidae (Diptera) of Economic Importance; 9 Series Entomologica; The Hague Publishers: Bath, UK, 1973; pp. 19–28. [Google Scholar]
- Fürstenberg-Hägg, J.; Zagrobelny, M.; Bak, S. Plant Defense against Insect Herbivores. Int. J. Mol. Sci. 2013, 14, 10242–10297. [Google Scholar] [CrossRef] [PubMed] [Green Version]
- Dietzgen, R.G.; Mann, K.S.; Johnson, K.N. Plant Virus-Insect Vector Interactions: Current and Potential Future Research Directions. Viruses 2016, 8, 303. [Google Scholar] [CrossRef]
- Polston Jane, E.; Capobianco, H. Transmitting plant viruses using whiteflies. J. Vis. Exp. JoVE 2013, 81, e4332. [Google Scholar] [CrossRef] [Green Version]
- Chen, J.; Shen, Z.; Lu, W.; Liu, X.; Wu, F.; Gao, G.; Liu, Y.; Wu, C.; Yan, C.; Fan, H.; et al. Leaf miner-induced morphological, physiological and molecular changes in mangrove plant Avicennia marina (Forsk.) Vierh. Tree Physiol. 2017, 37, 82–97. [Google Scholar] [CrossRef] [Green Version]
- Clemente, M.; Corigliano, M.G.; Pariani, S.A.; Sánchez-López, E.F.; Sander, V.A.; Ramos-Duarte, V.A. Plant Serine Protease Inhibitors: Biotechnology Application in Agriculture and Molecular Farming. Int. J. Mol. Sci. 2019, 20, 1345. [Google Scholar] [CrossRef] [Green Version]
- De Leo, F.; Volpicella, M.; Licciulli, F.; Liuni, S.; Gallerani, R.; Ceci, L.R. PLANT-PIs: A database for plant protease inhibitors and their genes. Nucleic Acids Res. 2002, 30, 347–348. [Google Scholar] [CrossRef] [Green Version]
- Mashamaite, C.V.; Ngcobo, B.L.; Manyevere, A.; Bertling, I.; Fawole, O.A. Assessing the Usefulness of Moringa oleifera Leaf Extract as a Biostimulant to Supplement Synthetic Fertilizers: A Review. Plants 2022, 11, 2214. [Google Scholar] [CrossRef]
- Mostafa, A.A.; El-Rahman, S.N.A.; Shehata, S.; Abdallah, N.A.; Omar, H.S. Assessing the Effects of a Novel Biostimulant to Enhance Leafminer Resistance and Plant Growth on Common Bean. Sci. Rep. 2021, 11, 20020. [Google Scholar] [CrossRef] [PubMed]
- Studer, G.; Biasini, M.; Schwede, T. Assessing the local structural quality of transmembrane protein models using statistical potentials (QMEANBrane). Bioinformatics 2014, 30, i505–i511. [Google Scholar] [CrossRef] [PubMed] [Green Version]
- Messaoudi, A.; Belguith, H.; Ben Hamida, J. Homology modeling and virtual screening approaches to identify potent inhibitors of VEB-1 β-lactamase. Theor. Biol. Med. Model. 2013, 10, 22. [Google Scholar] [CrossRef] [PubMed] [Green Version]
- Lin, Y.; Yoo, S.; Sanchez, R. SiteComp: A server for ligand binding site analysis in protein structures. Bioinformatics 2012, 28, 1172–1173. [Google Scholar] [CrossRef] [Green Version]
- Yang, Q.Q.; Gan, R.Y.; Ge, Y.Y.; Zhang, D.; Corke, H. Polyphenols in Common Beans (Phaseolus vulgaris L.): Chemistry, Analysis, and Factors Affecting Composition. Compr. Rev. Food Sci. Food Saf. 2018, 17, 1518–1539. [Google Scholar] [CrossRef] [PubMed] [Green Version]
- Berman, R.M.; Cappiello, A.; Anand, A.; Oren, D.A.; Heninger, G.R.; Charney, D.S.; Krystal, J.H. Antidepressant effects of ketamine in depressed patients. Biol. Psychiatry 2000, 47, 351–354. [Google Scholar] [CrossRef]
- BIOVIA DS. Discovery Studio Modeling Environment; Dassault Systemes: San Diego, CA, USA, 2015. [Google Scholar]
- OneAngstrom. SAMSON. 2020. Available online: https://www.samson-connect.net/ (accessed on 10 August 2022).
- Jain, A.N. Scoring functions for protein-ligand docking. Curr. Protein Pept. Sci. 2006, 7, 407–420. [Google Scholar] [CrossRef]
- Gelpi, J.; Hospital, A.; Goñi, R.; Orozco, M. Molecular dynamics simulations: Advances and applications. Adv. Appl. Bioinform. Chem. 2015, 8, 37–47. [Google Scholar] [CrossRef] [Green Version]
- Kumari, S.; Krishnan, V.; Sachdev, A. Impact of soaking and germination durations on antioxidants and anti-nutrients of black and yellow soybean (Glycine max. L) varieties. J. Plant Biochem. Biotechnol. 2015, 24, 355–358. [Google Scholar] [CrossRef]
- Maisuradze, G.G.; Liwo, A.; Scheraga, H.A. Principal Component Analysis for Protein Folding Dynamics. J. Mol. Biol. 2009, 385, 312–329. [Google Scholar] [CrossRef]
- Szklarczyk, D.; Morris, J.H.; Cook, H.; Kuhn, M.; Wyder, S.; Simonovic, M.; Santos, A.; Doncheva, N.T.; Roth, A.; Bork, P.; et al. The STRING database in 2017: Quality-controlled protein-protein association networks, made broadly accessible. Nucleic Acids Res. 2017, 45, D362–D368. [Google Scholar] [CrossRef] [PubMed]
- Altschul, S.F.; Madden, T.L.; Schäffer, A.A.; Zhang, J.; Zhang, Z.; Miller, W.; Lipman, D.J. Gapped BLAST and PSI-BLAST: A new generation of protein database search programs. Nucleic Acids Res. 1997, 25, 3389–3402. [Google Scholar] [CrossRef] [PubMed] [Green Version]
- Trott, O.; Olson, A.J. AutoDock Vina: Improving the speed and accuracy of docking with a new scoring function, efficient optimization, and multithreading. J. Comput. Chem. 2010, 31, 455–461. [Google Scholar] [CrossRef] [PubMed] [Green Version]
- Hess, B.; Kutzner, C.; van der Spoel, D.; Lindahl, E. GROMACS 4: Algorithms for Highly Efficient, Load-Balanced, and Scalable Molecular Simulation. J. Chem. Theory Comput. 2008, 4, 435–447. [Google Scholar] [CrossRef] [PubMed]


| Protein | Ramachandran Plot Values | |||
|---|---|---|---|---|
| Core % | Allowed % | Generously % | Disallowed % | |
| Acetylcholinesterase | 92.3 | 7.7 | 0.0 | 0.0 |
| α-tubulin | 94.3 | 5.5 | 0.3 | 0.0 |
| Actin | 94.6 | 5.4 | 0.0 | 0.0 |
| Arginine kinase | 94.2 | 5.0 | 0.8 | 0.0 |
| Histone subunit 3 | 96.4 | 0.3 | 0.0 | 0.0 |
| Hsp90 | 93.5 | 0.6 | 0.0 | 0.5 |
| Elongation factor | 94.0 | 5.2 | 0.4 | 0.4 |
| Carbamoyl phosphate synthase | 85.6 | 13.2 | 0.0 | 1.1 |
| Protein | Genbank: | Template | Seq Identity | Coverage | QMEAN |
|---|---|---|---|---|---|
| Acetylcholinesterase | CAI30732.1 | 1dx4.1.A | 54% | 96% | −0.11 |
| α-tubulin | ARQ84036.1 | 5kx5.1.C | 61% | 100% | −1.00 |
| Actin | ARQ84030.1 | 4cbu.1.A | 60% | 100% | 0.13 |
| Argenin Kinase | ARQ84038.1 | 4bg4.1.A | 58% | 98% | 0.43 |
| Histone Subunit3 | ARQ84034.1 | 4zux.1.A | 59% | 100% | 0.25 |
| Hsp90 | AGI19327.1 | 4cwr.1.A | 56% | 31% | 0.28 |
| Elongation Factor | ARQ84032.1 | 5o8w.1.A | 55% | 97% | 0.66 |
| Target | Ligands | Binding Energy of Direct Kcal/mole | Binding Energy of Indirect Kcal/mole | Binging Site | Type of Bond | X, Y and Z Value |
|---|---|---|---|---|---|---|
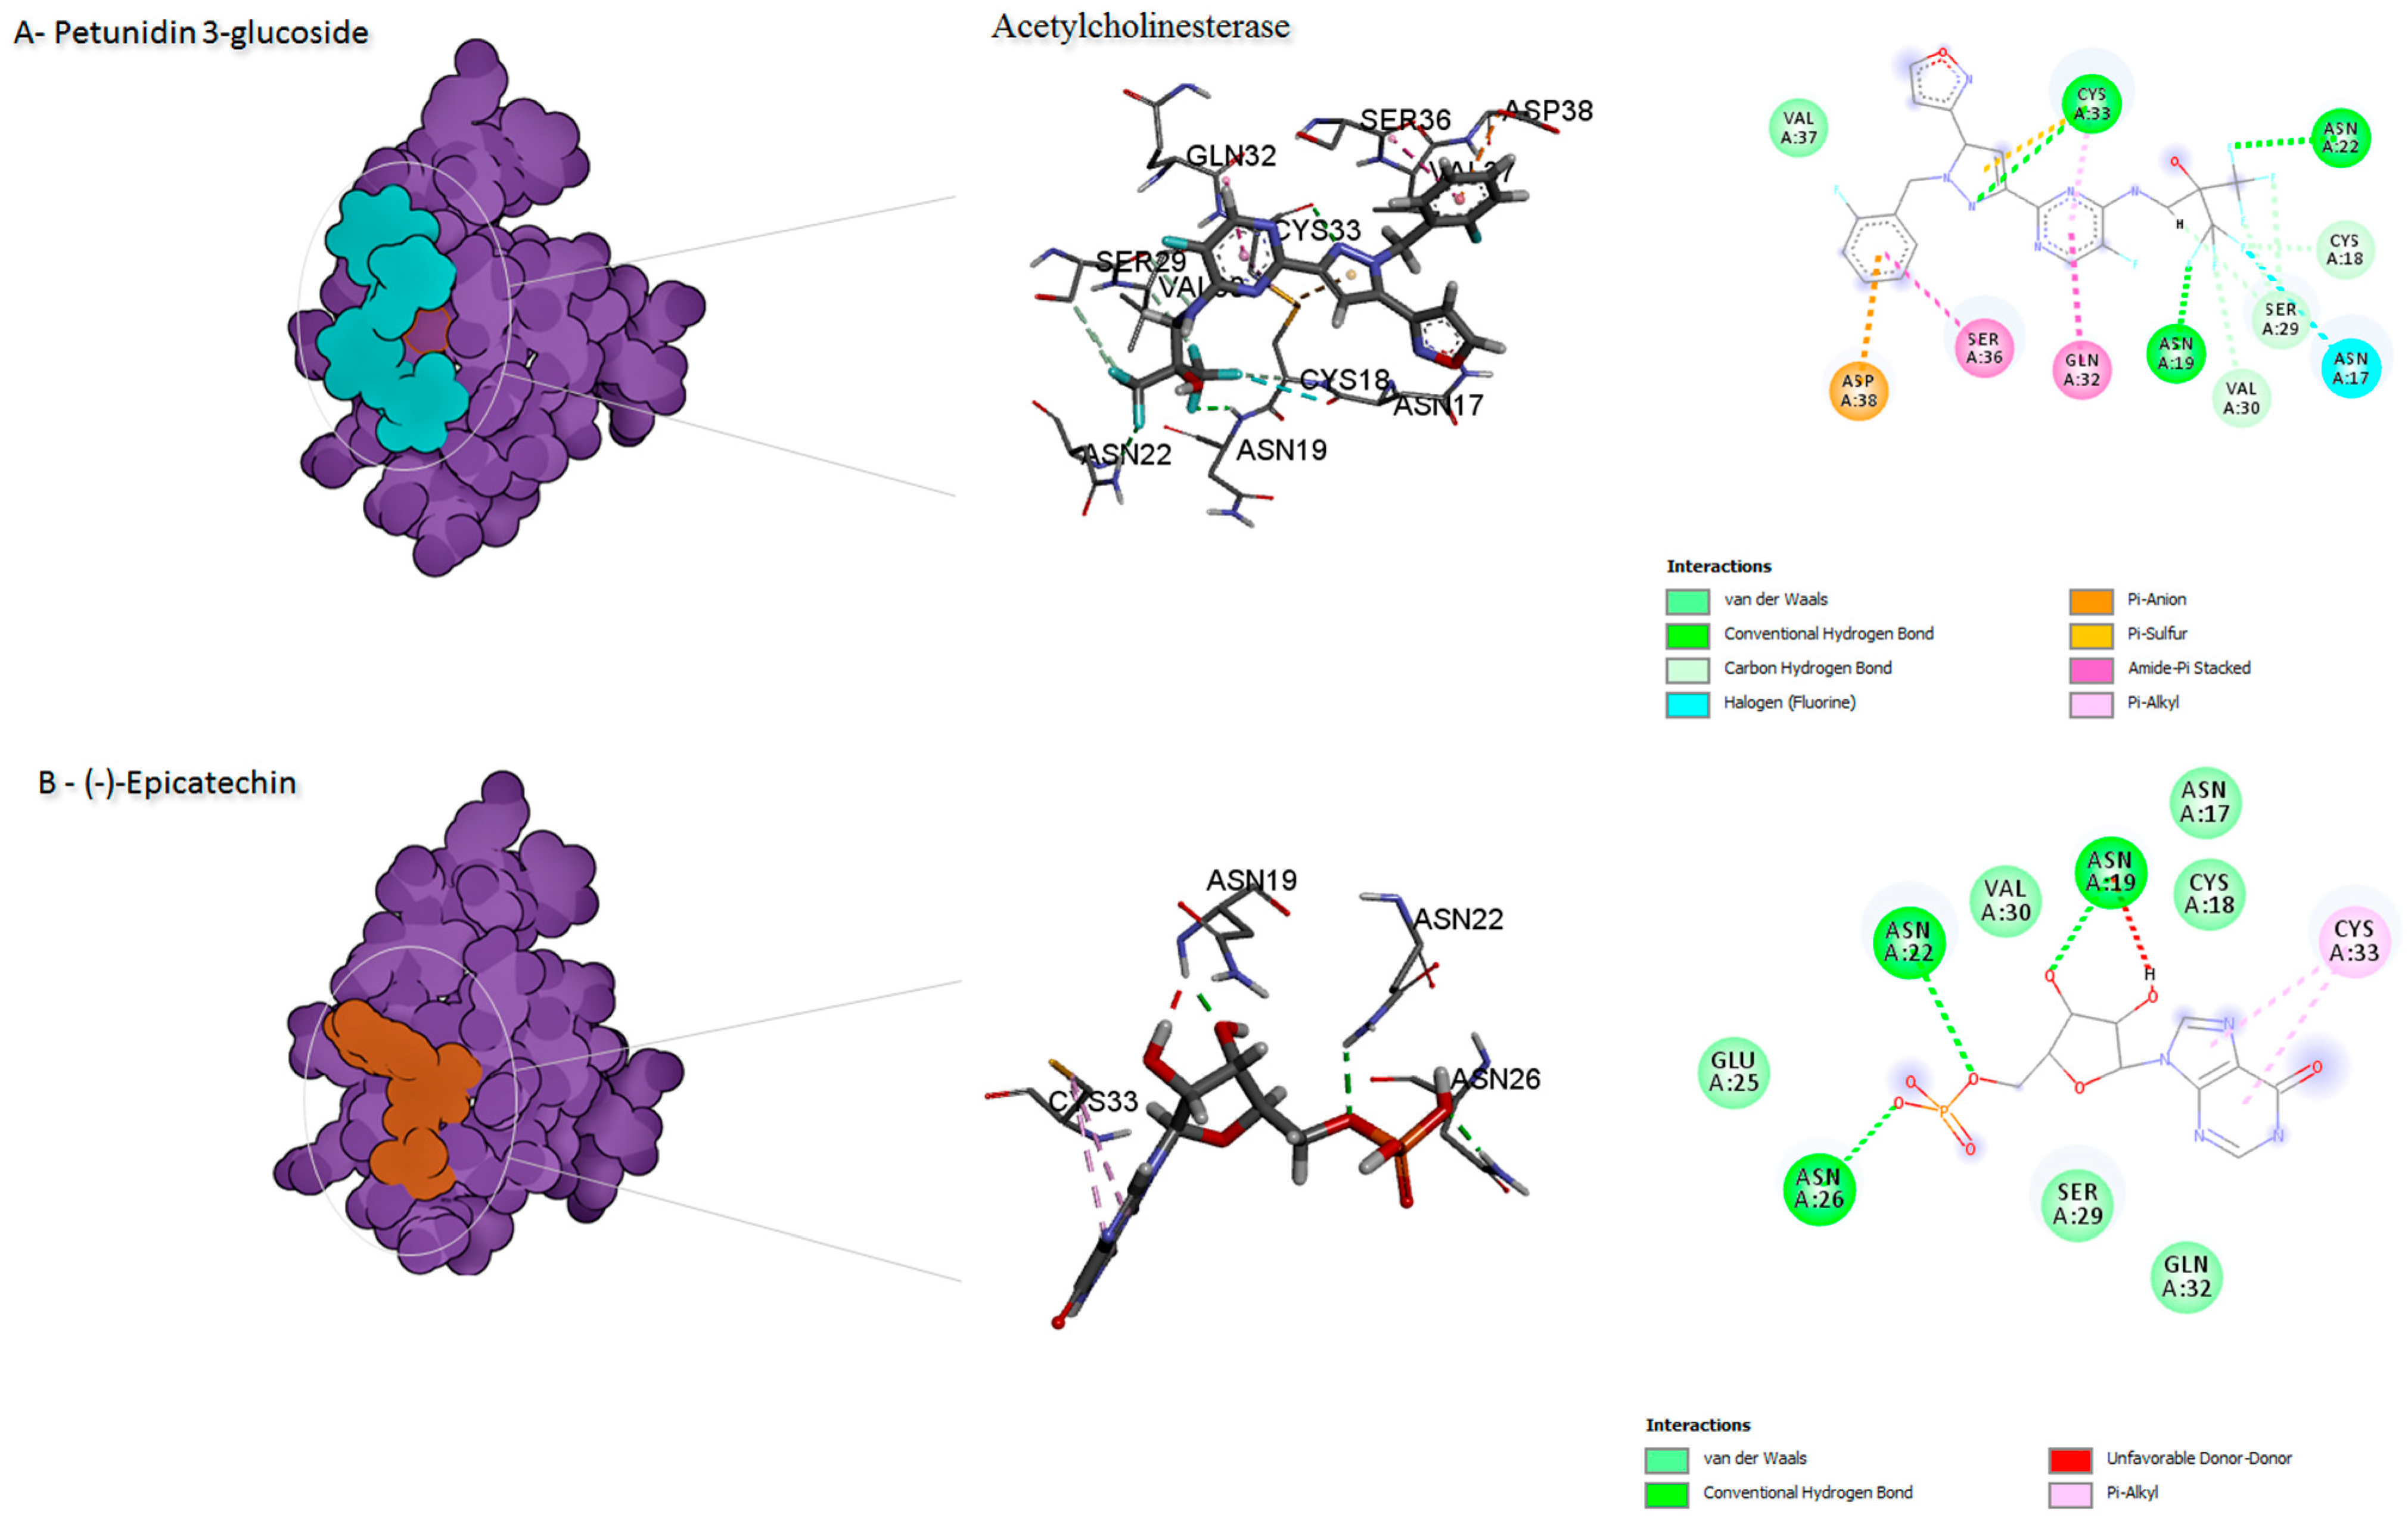
| Acetylcolenestras | Disodium 5′-inosinate | −6.5 | 0 | SER36, CYS33, SER29, ASN22, ASN19, CYS18 | center_x = 15.4462 center_y = 85.5487 center_z = −1.2087 | |
| Petunidin 3-glucoside | 0 | −6.9 | ASN17, CYS18 ASN19, ASN22 SER29, VAL30 GLN32, CYS33, SER36VAL37, ASP38 | Alkyl Conventional H-bond carbon H-bond Amide -pi stacked pi-Alkyl Van der waals pi-Alkyl pi-Anion Halogen (Fluorine) Pi-Sulfur | ||
| α-tubulin | Chlorogenic acid ID | 0 | −10.3 | GLN11, ALA12 ASP69, ALA100 GLY144, ILE171 TYR224, ASN228 | Conventional H-bond pi-Alkyl Amide-pi stacked Pi-Pi Stacked Pi-Sigma Unfavourable Donor–Donor Unfavourable Acceptor–Acceptor | center_x = 12.8911 center_y = 28.1478 center_z = −3.7346 |
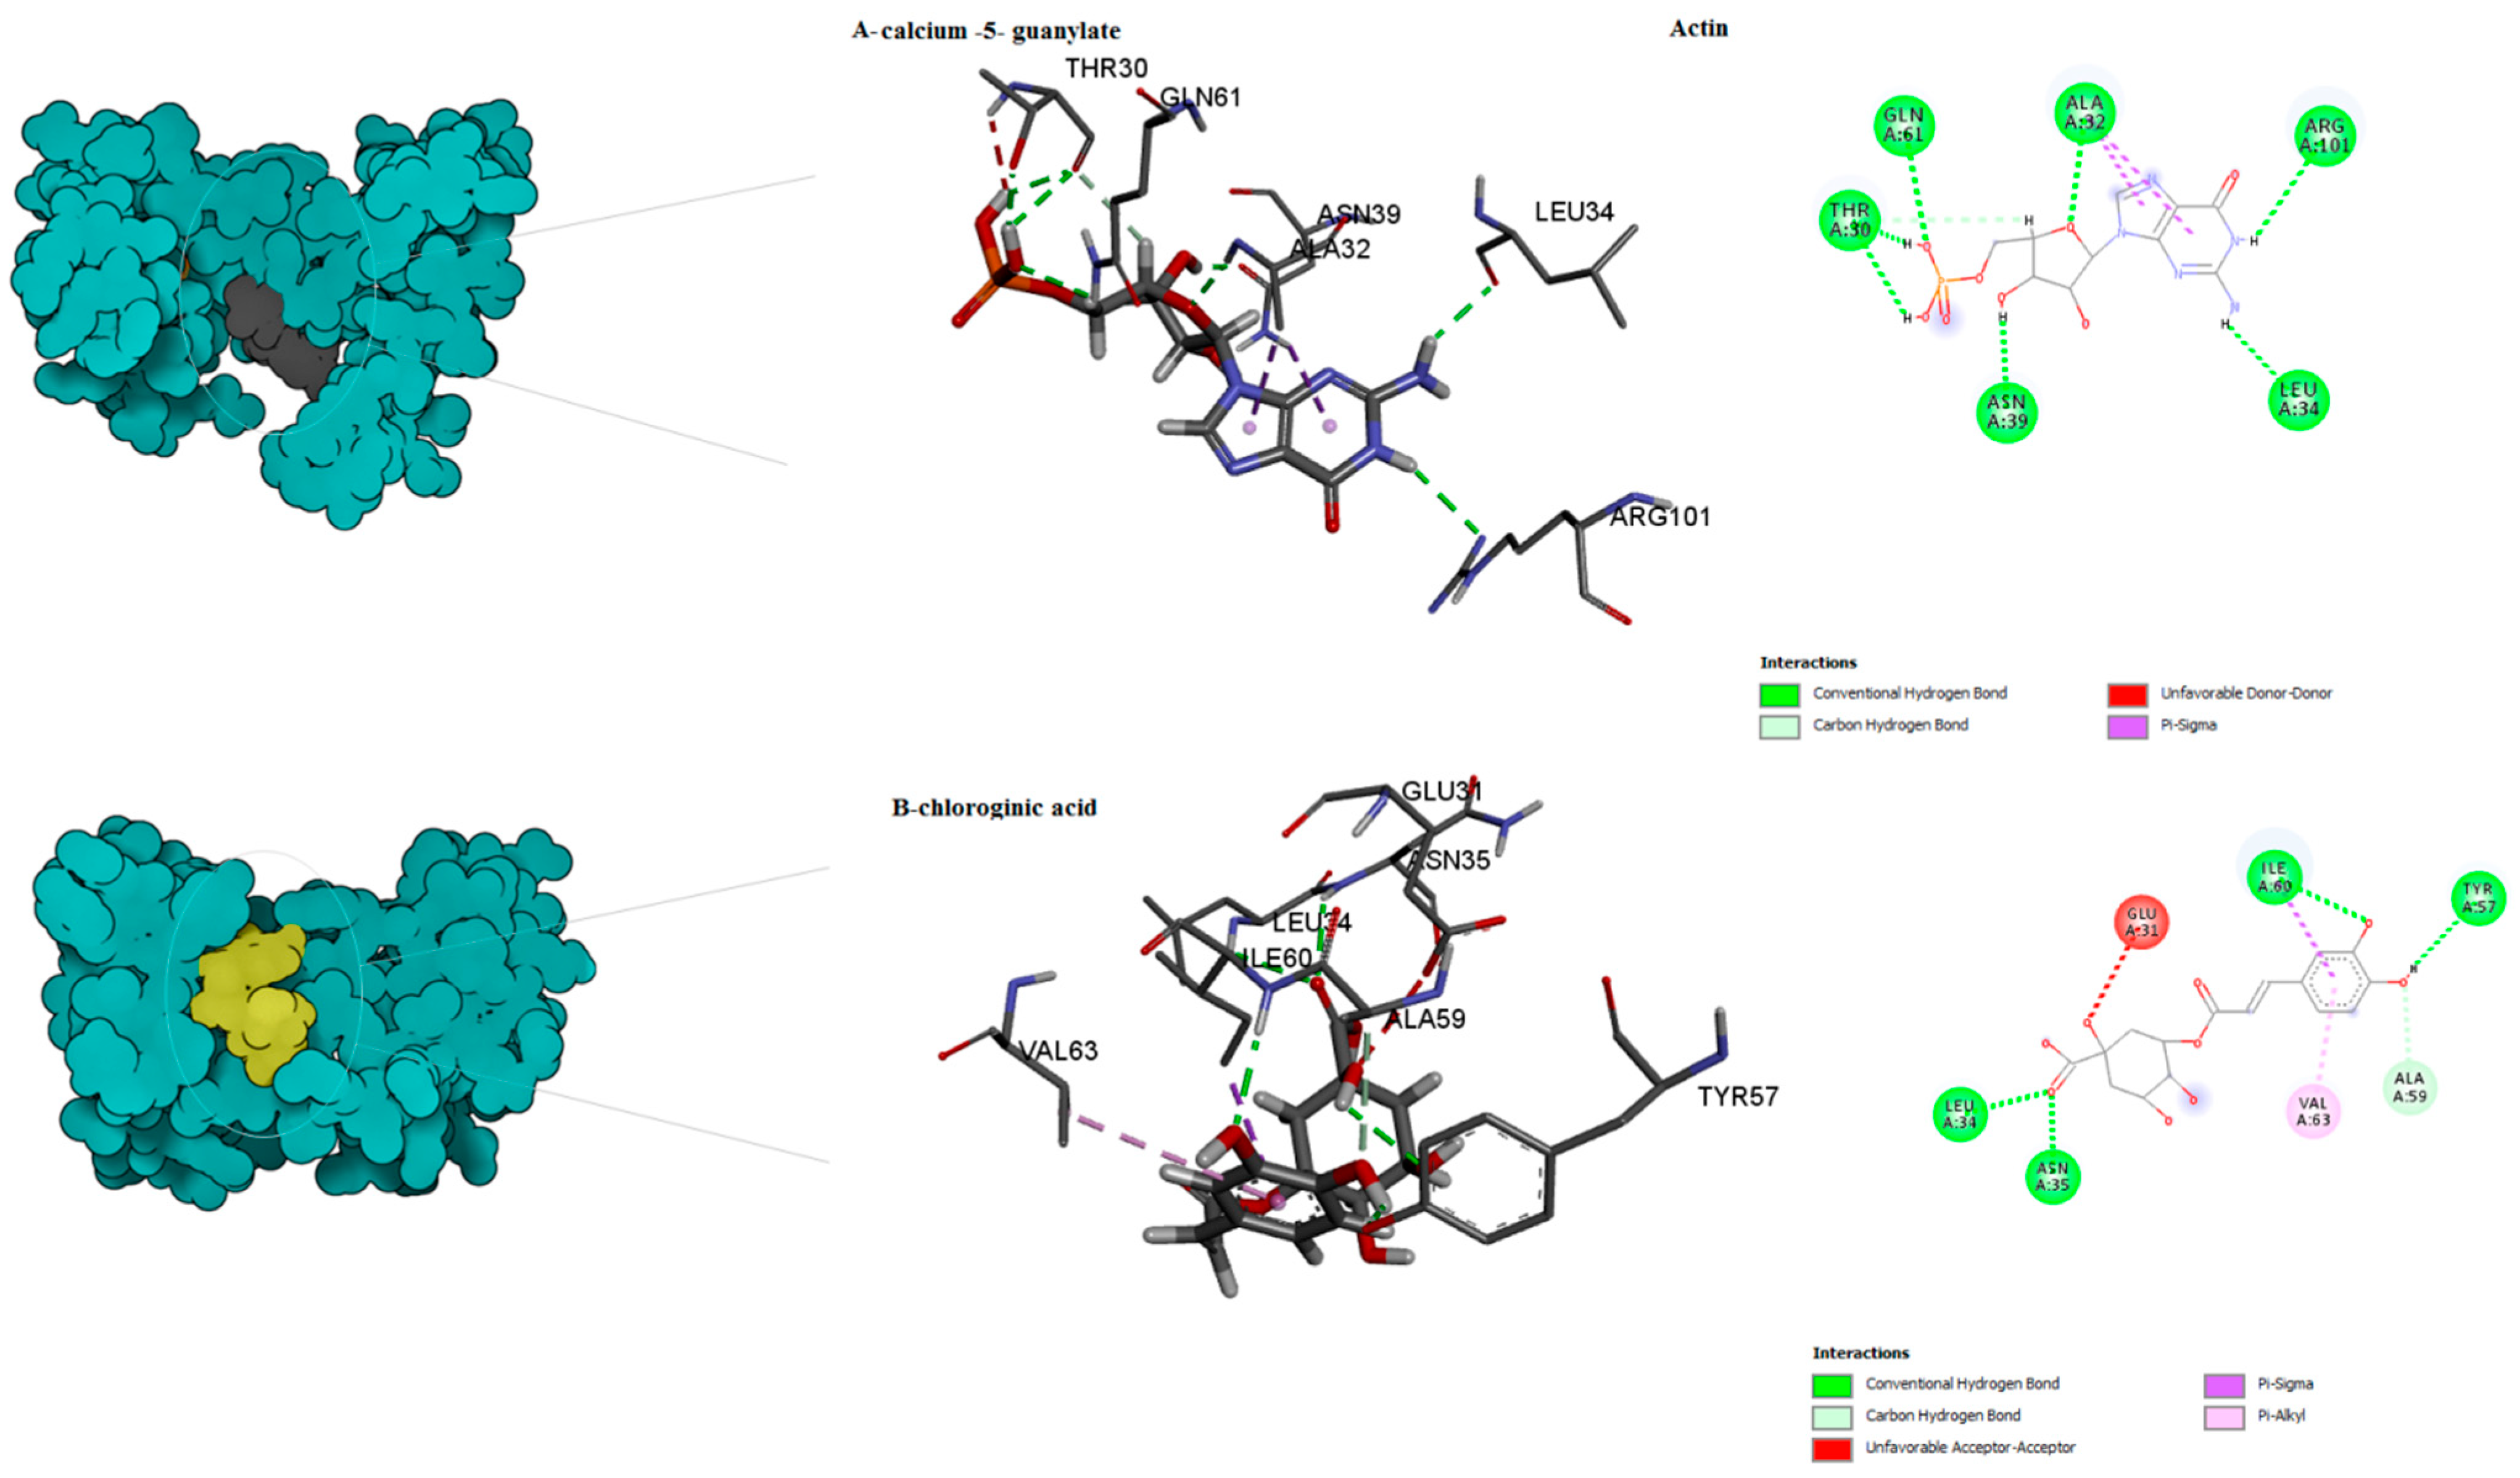
| Actin | Calcium 5′-guanylate D | −7.6 | 0 | THR30, ALA32 LEU34, ASN39, GLN61, ARG101 | Conventional H-bond cabon H-bond Unfavourable Donor–Donor Pi-Sigma | center_x = 16.2688 center_y = 30.1281 center_z = 30.8989 |
| Chlorogenic acid ID | 0 | −7.4 | GLU31, LEU34 ASN35, TYR57 ALA59, ILE60 VAL63 | Cabon H-bond Pi-Sigma pi-Alkyl Conventional H-bond Unfavourable Acceptor–Acceptor | ||
| Arginine kinase | Kaempferol-3,7-di-O-glucoside I | 0 | −9.9 | PHE135, SER128 PRO126, ILE98 HIS95 | cabon H-bond Conventional H-bond Unfavourable Donor–Donor Pi-Pi Stacked | center_x = 21.1887 center_y = −3.9607 center_z = 13.2428 |
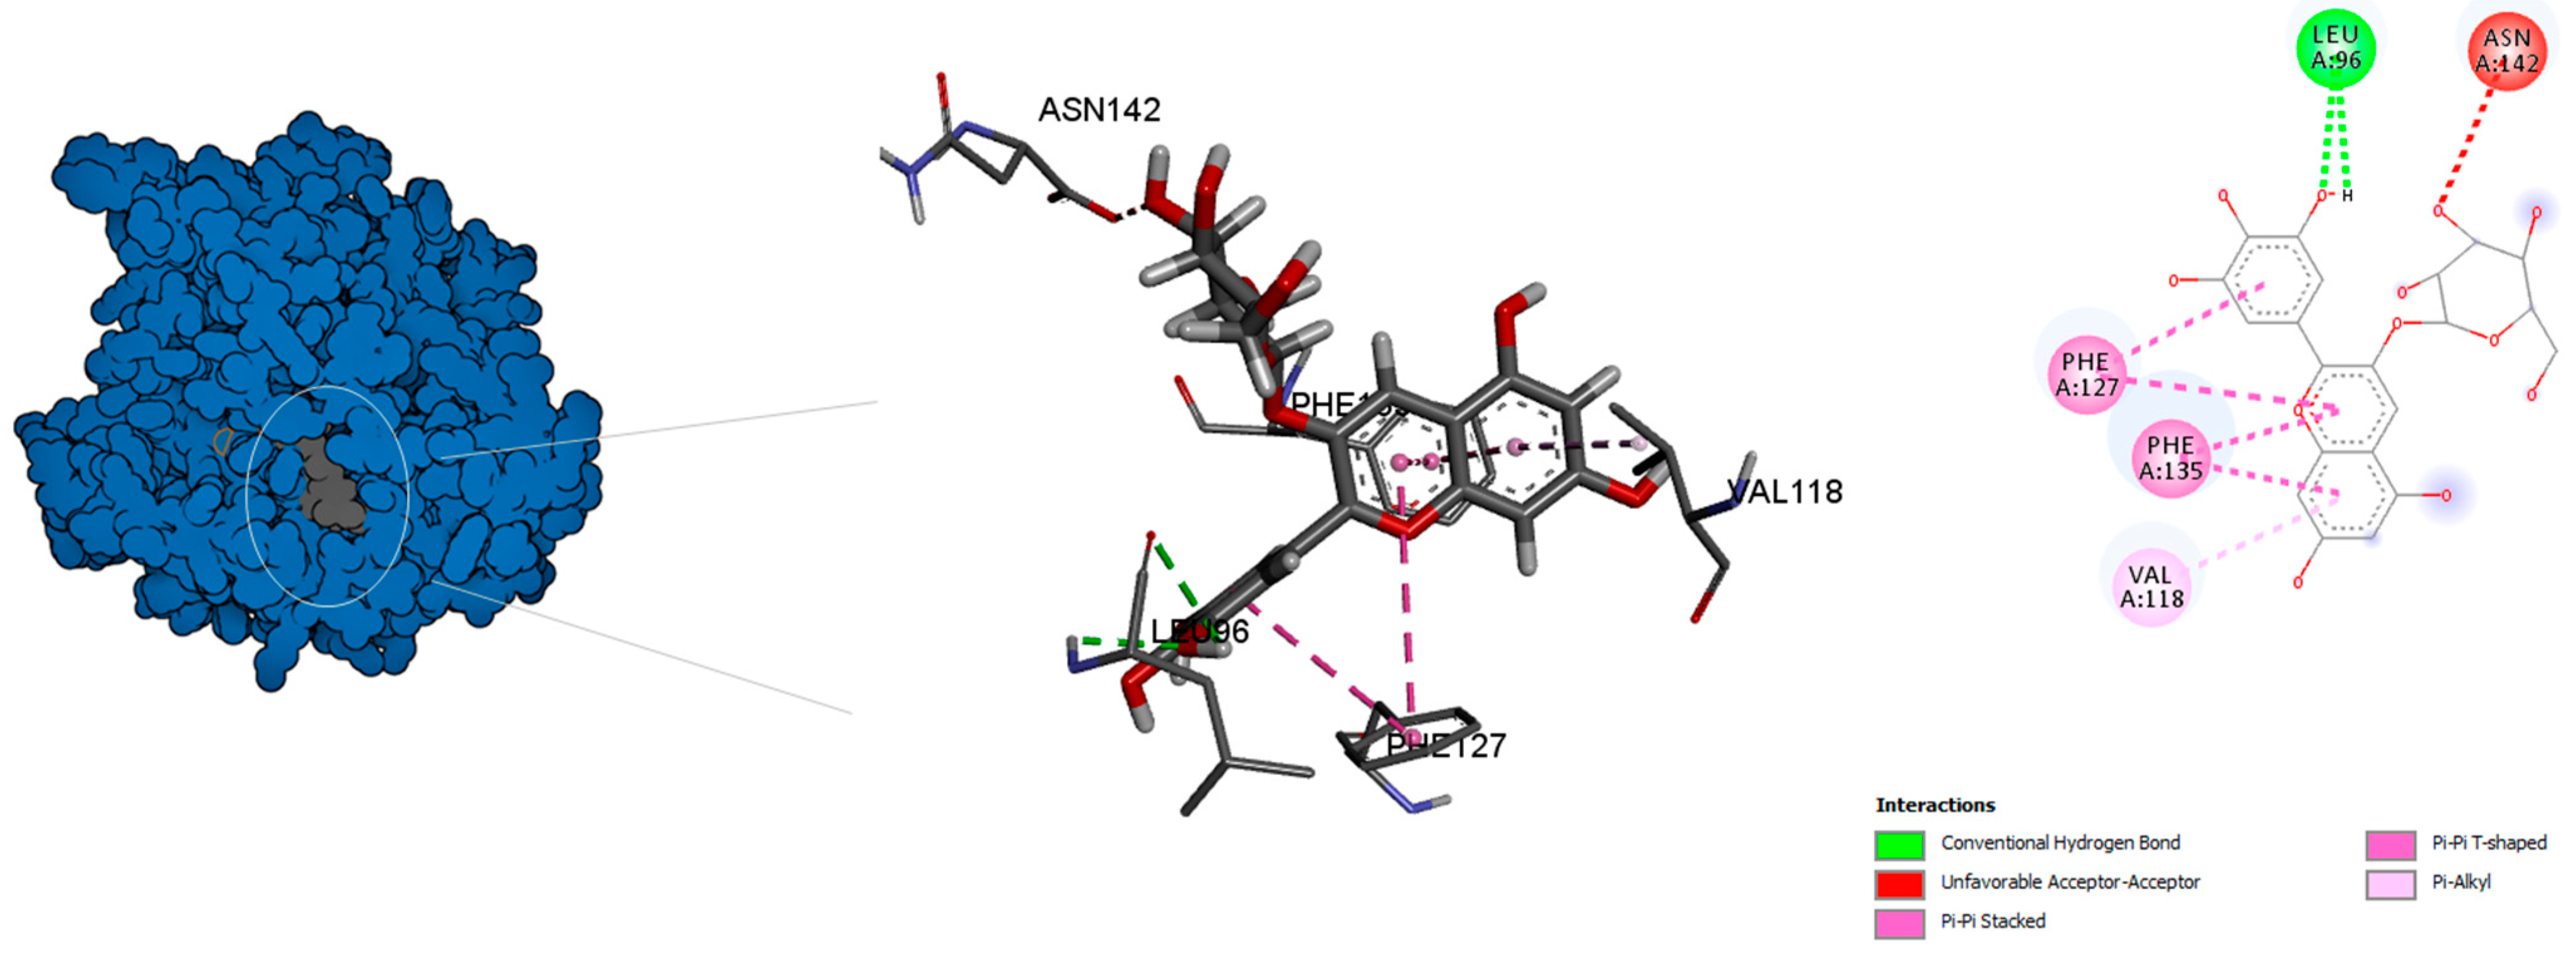
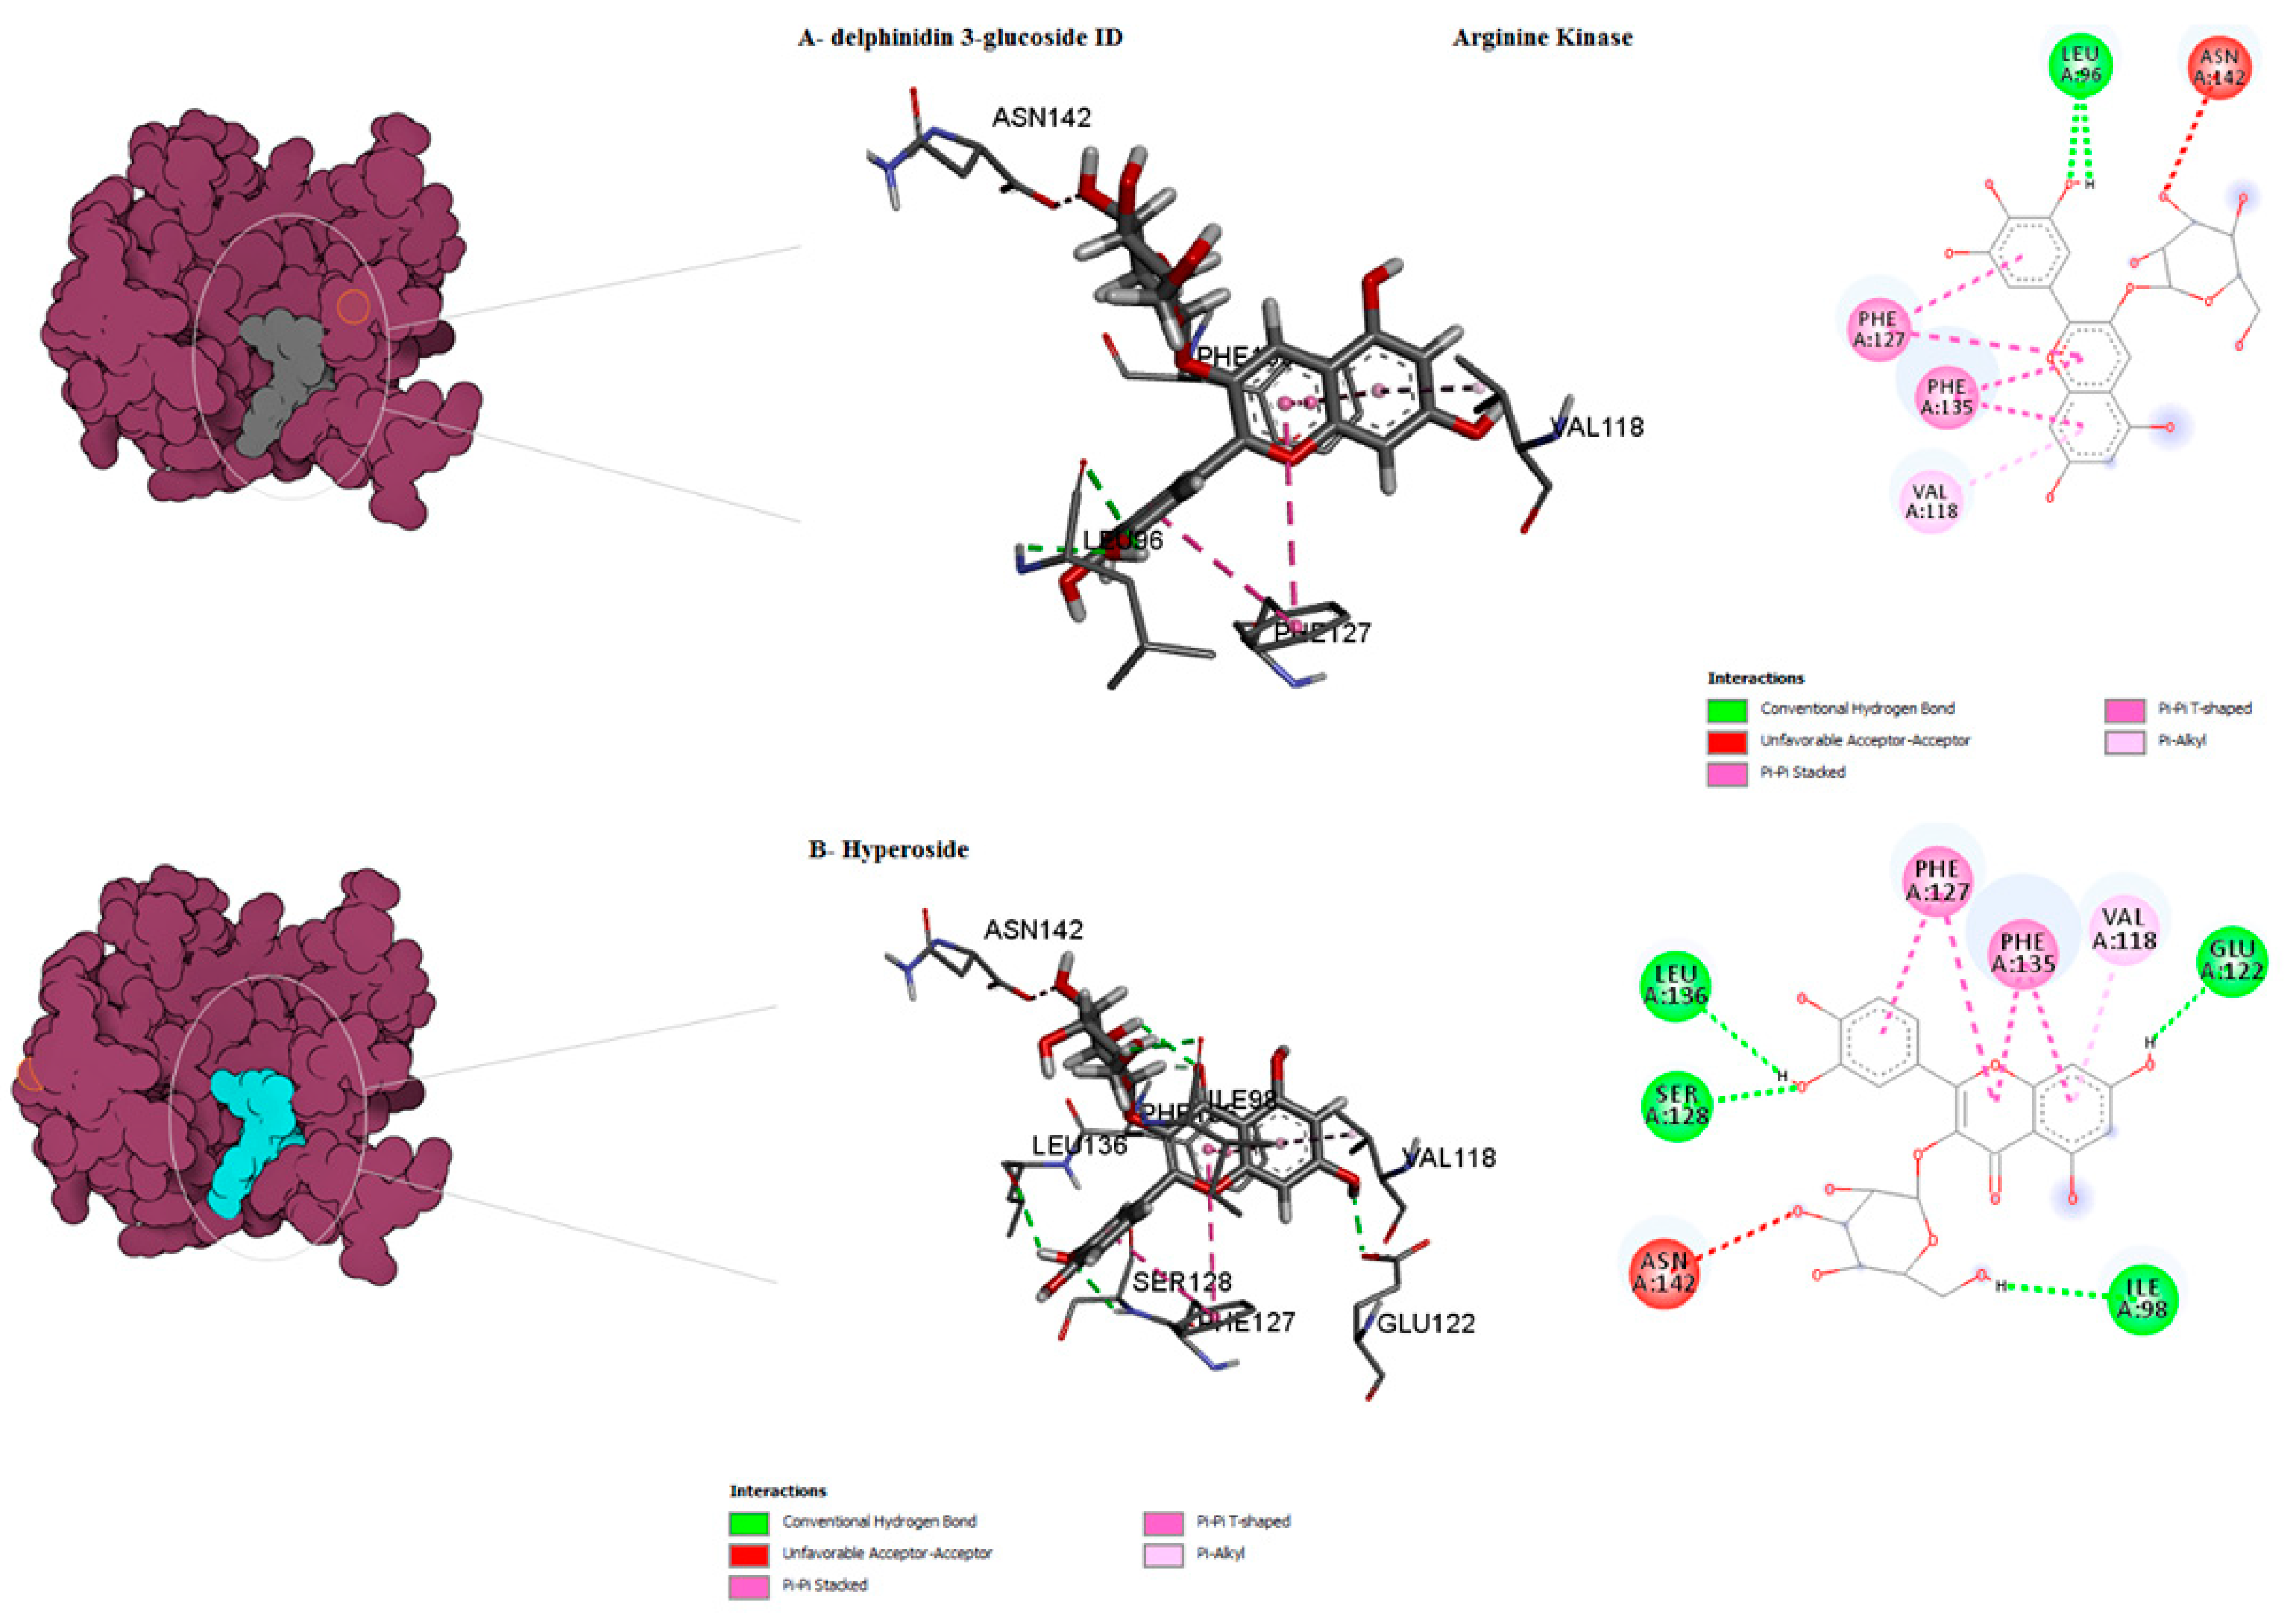
| Hyperoside D | −9 | 0 | ASN142, LEU136, PHE135, SER128, PHE127, VAL118, ILE98 | Van der waals Conventional H-bond Unfavourable Acceptor–Acceptor pi-Alkyl Pi-Pi Stacked Pi-Pi T–shaped | ||
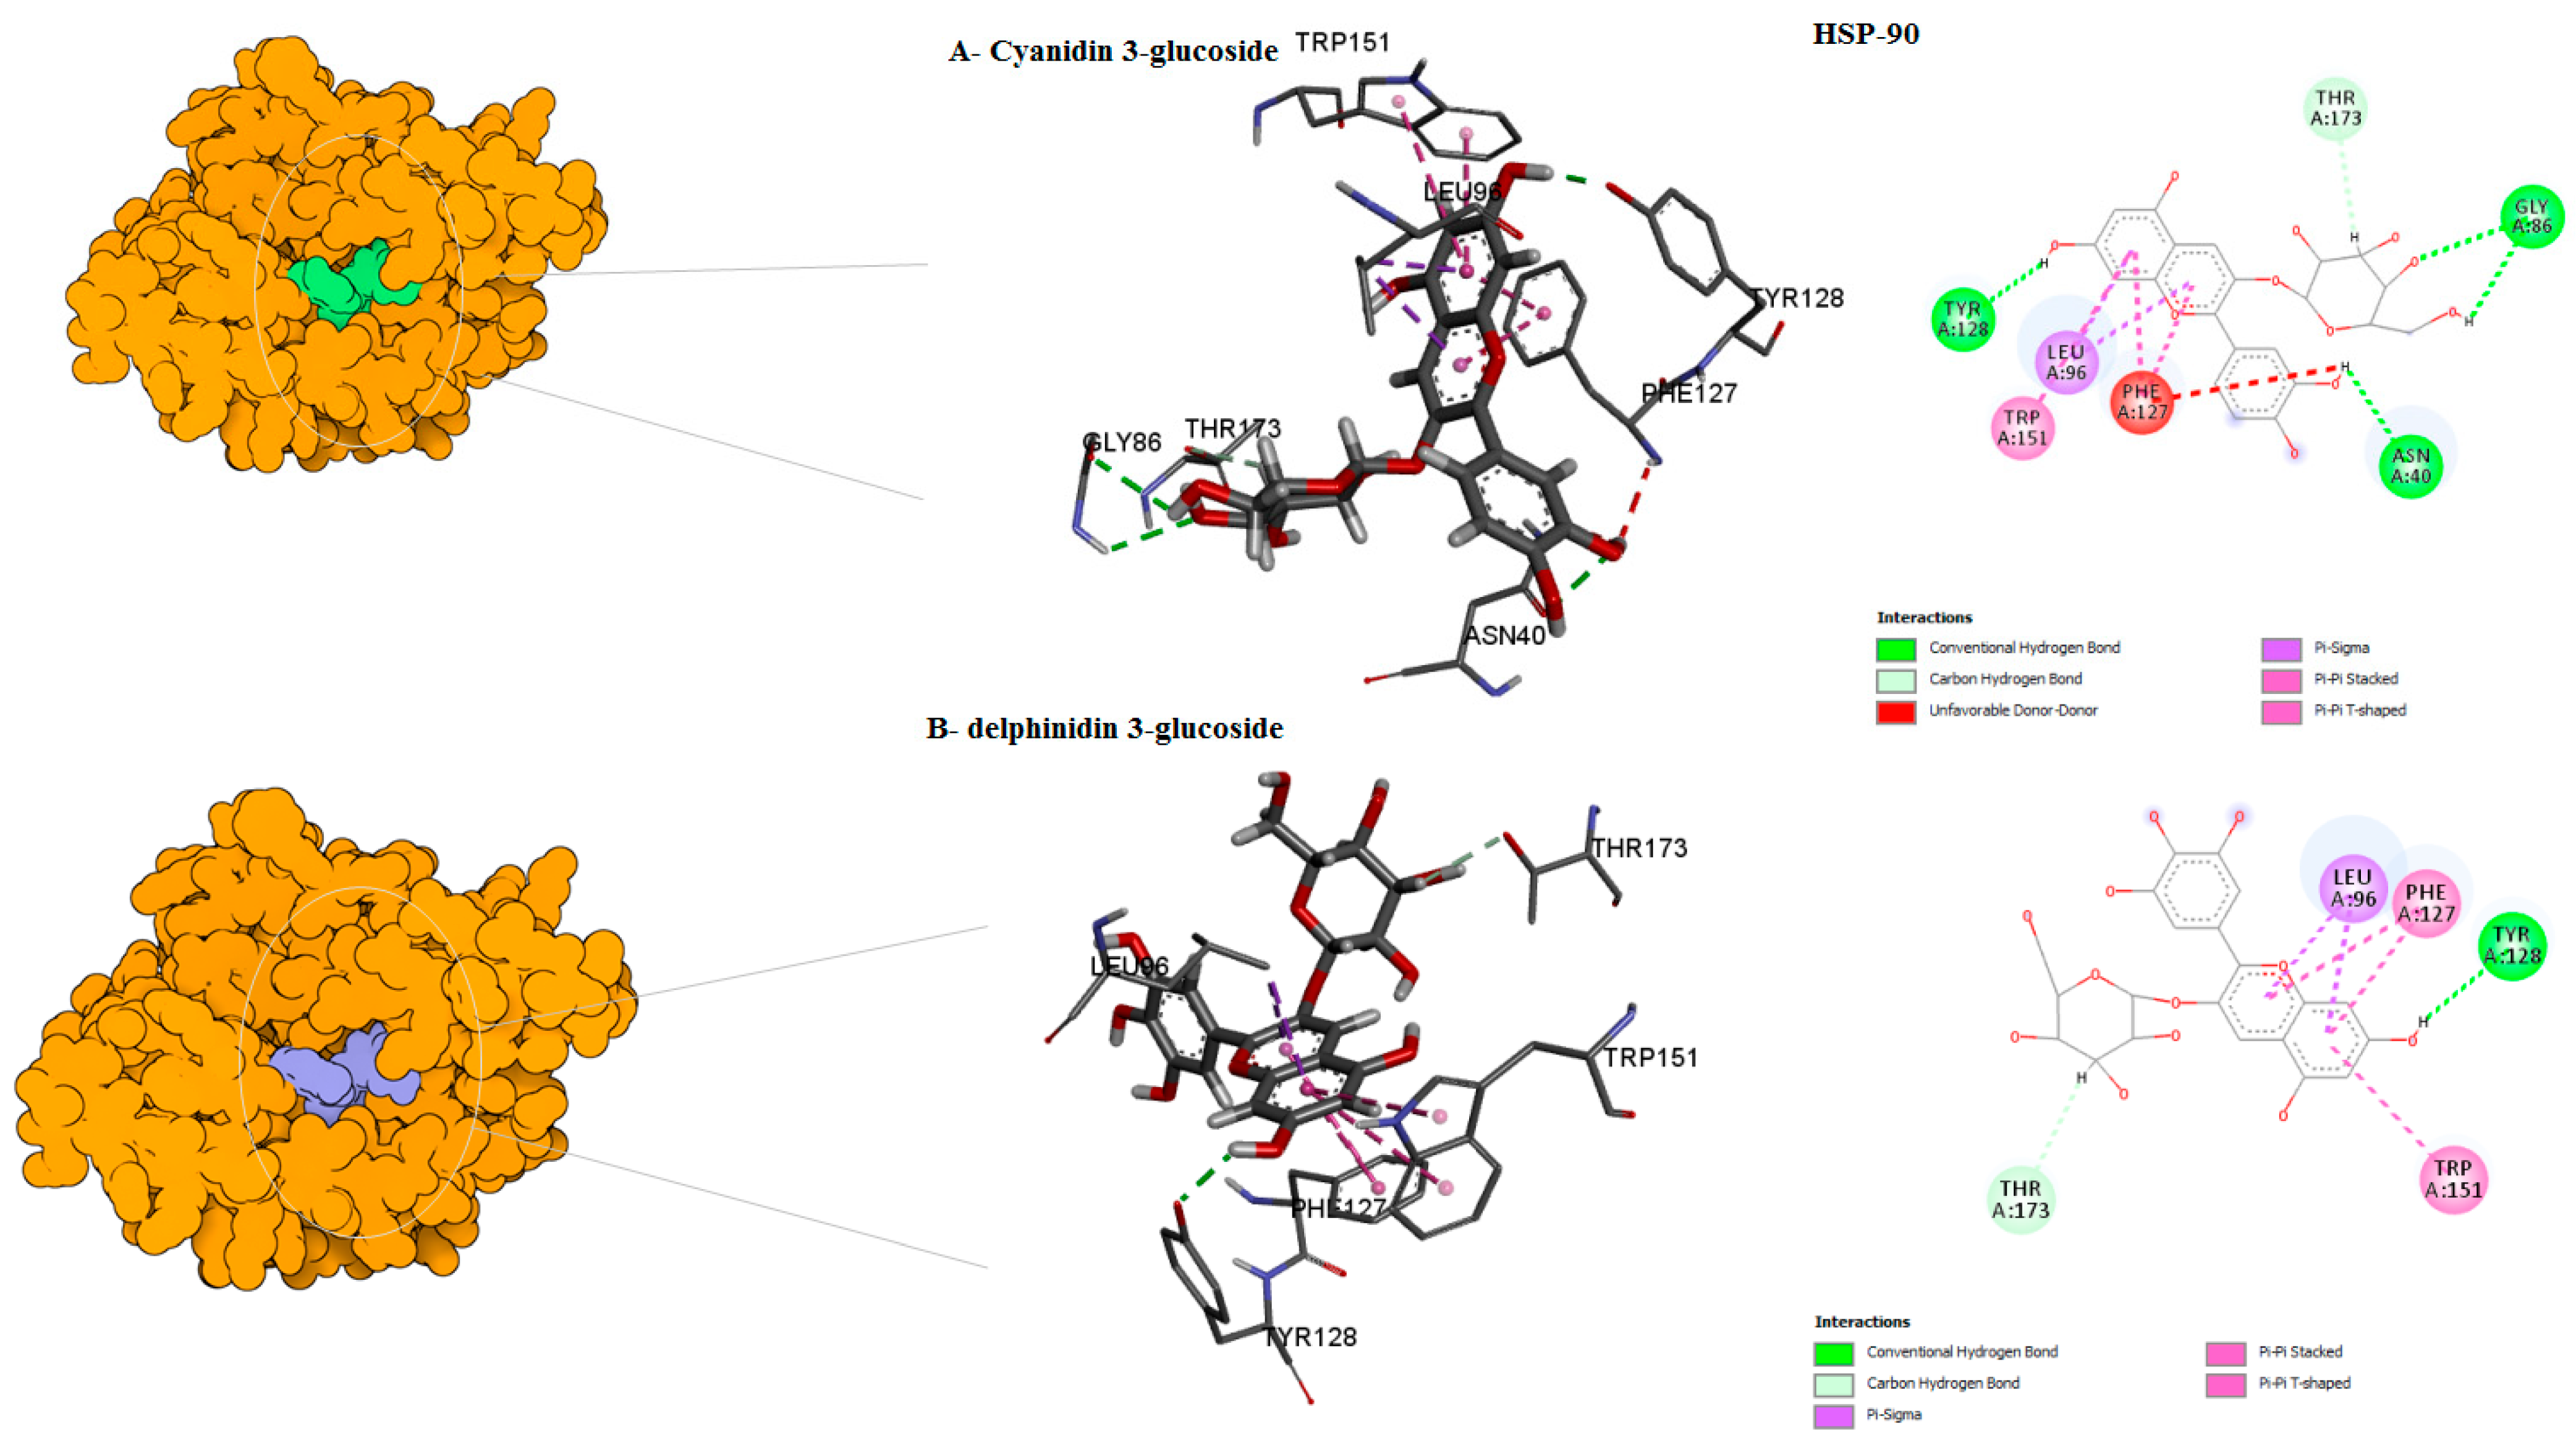
| Delphinidin 3-glucoside ID | −9 | −9 | ASN142, PHE135, PHE127, VAL118, LEU96 | Van der waals Conventional H-bond Unfavourable Acceptor–Acceptor pi-Alkyl Pi-Pi Stacked Pi-Pi T–shaped | ||
| Hsp90 | Cyanidin 3-glucoside ID –1 | 0 | −10.9 | ASN40 GLY86 LEU96 PHE127 TYR128 TRP151 THR173 | cabon H-bond Conventional H-bond Unfavourable Donor–Donor Pi-Pi Stacked Pi-Pi T–shaped Pi-Sigma | center_x = 0.6349 center_y = 14.4620 center_z = 20.6177 |
| Delphinidin 3-glucoside D/ID | −10 | 12 | ASN40, ASP82 GLY86, LEU96, GLY126 PHE127, TRP151 THR173 | Cabon H-bond Conventional H-bond Pi-Sigma Pi-Pi T–shaped Pi-Pi Stacked | ||
| Hyperoside D | −9 | 0 | ASN40 ASP82 GLY86 LEU96 GLY126 PHE127 TRP151 THR173 | Conventional H-bond Pi-Sigma Pi-Pi T–shaped Pi-Pi Stacked | ||
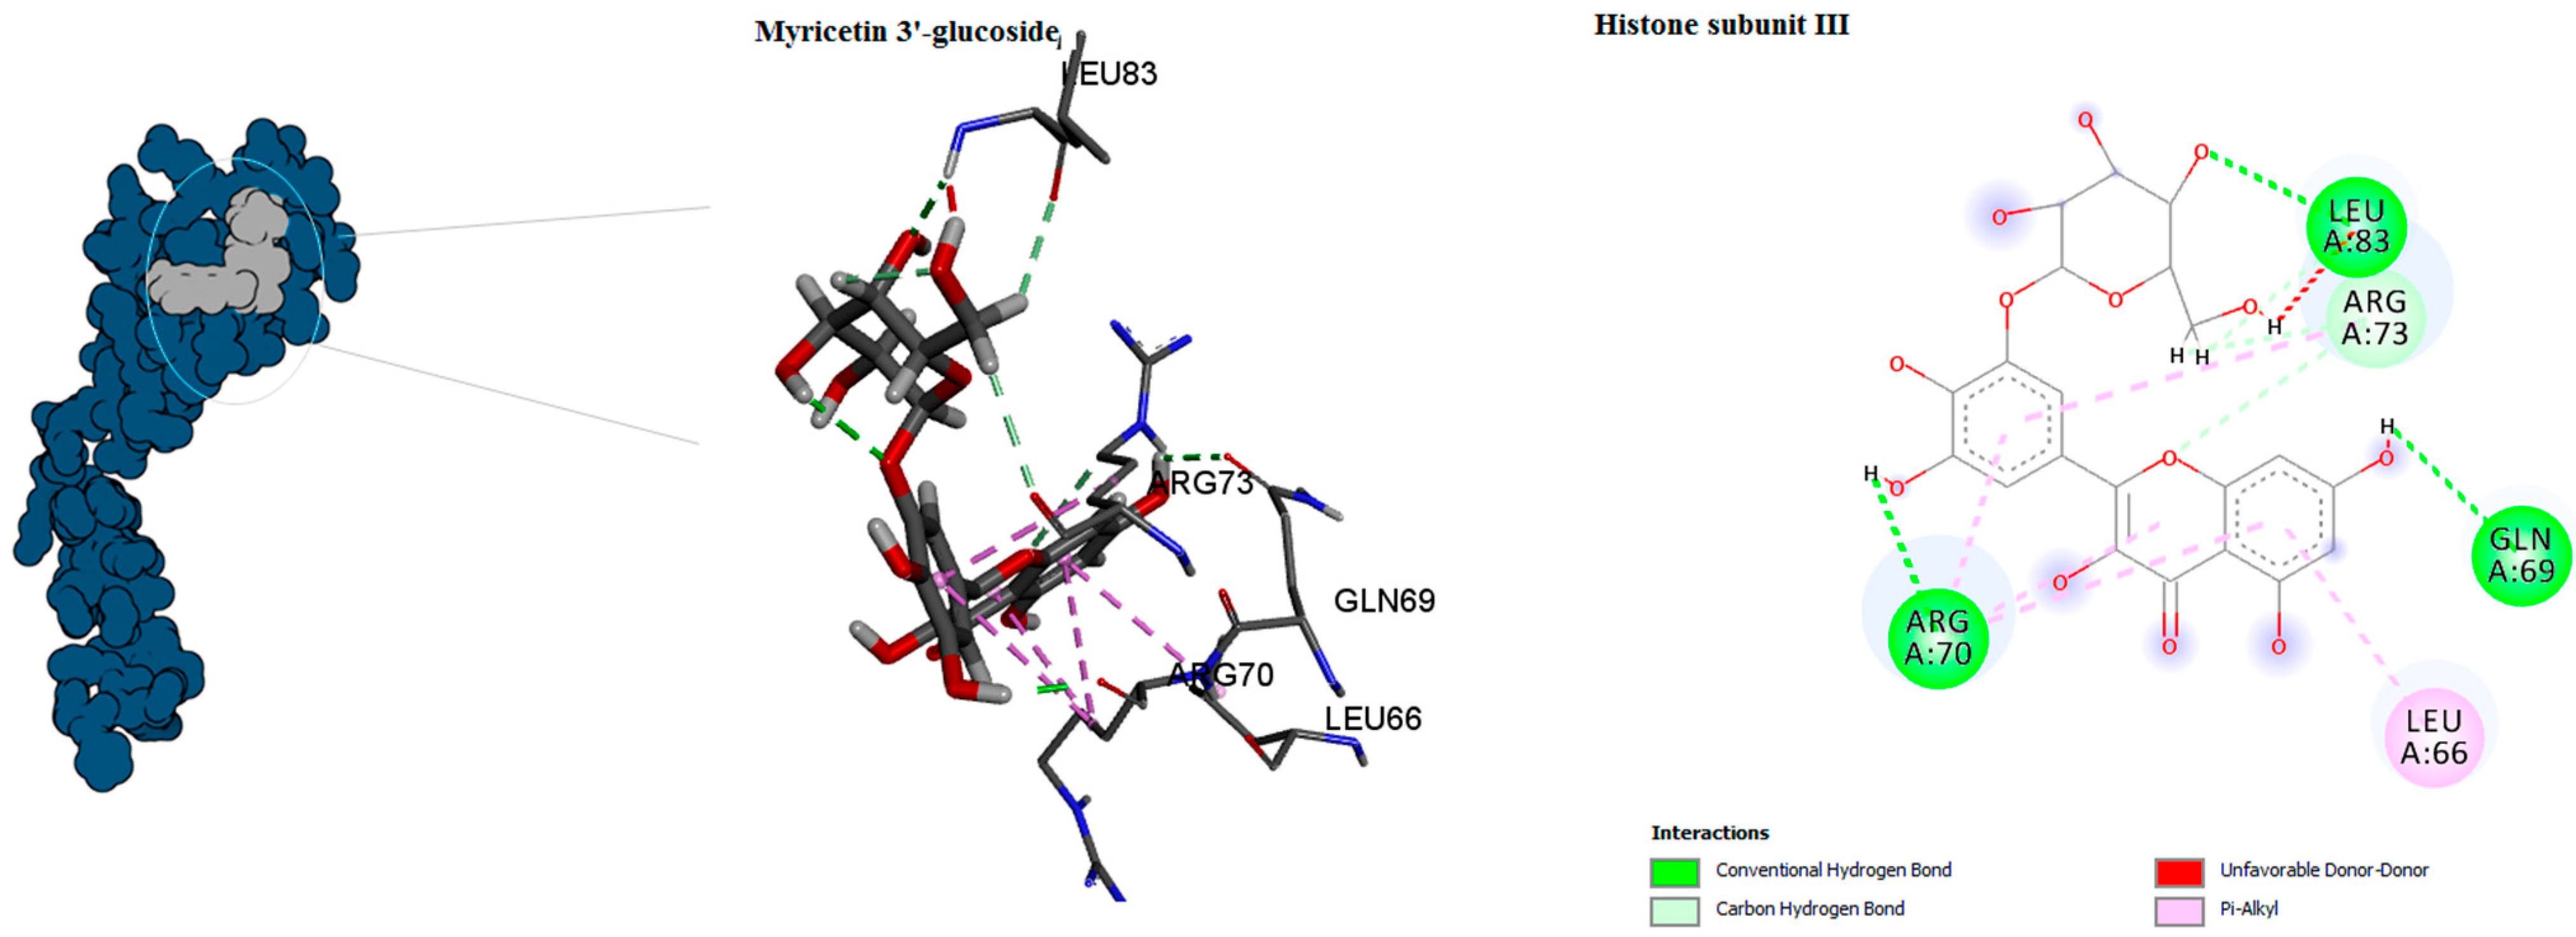
| Histone subunit3 | Myricetin 3′-glucoside ID | 0 | −8.5 | LEU66 GLN69 ARG70 ARG73 LEU83 | Cabon H-bond Conventional H-bond Unfavourable Donor–Donor pi-Alkyl | center_x = 74.957 center_y = 39.323 center_z = −20.6626 |
| Hyperoside D | −6 | TYR55 SER58 THR59 GLU60 | ||||
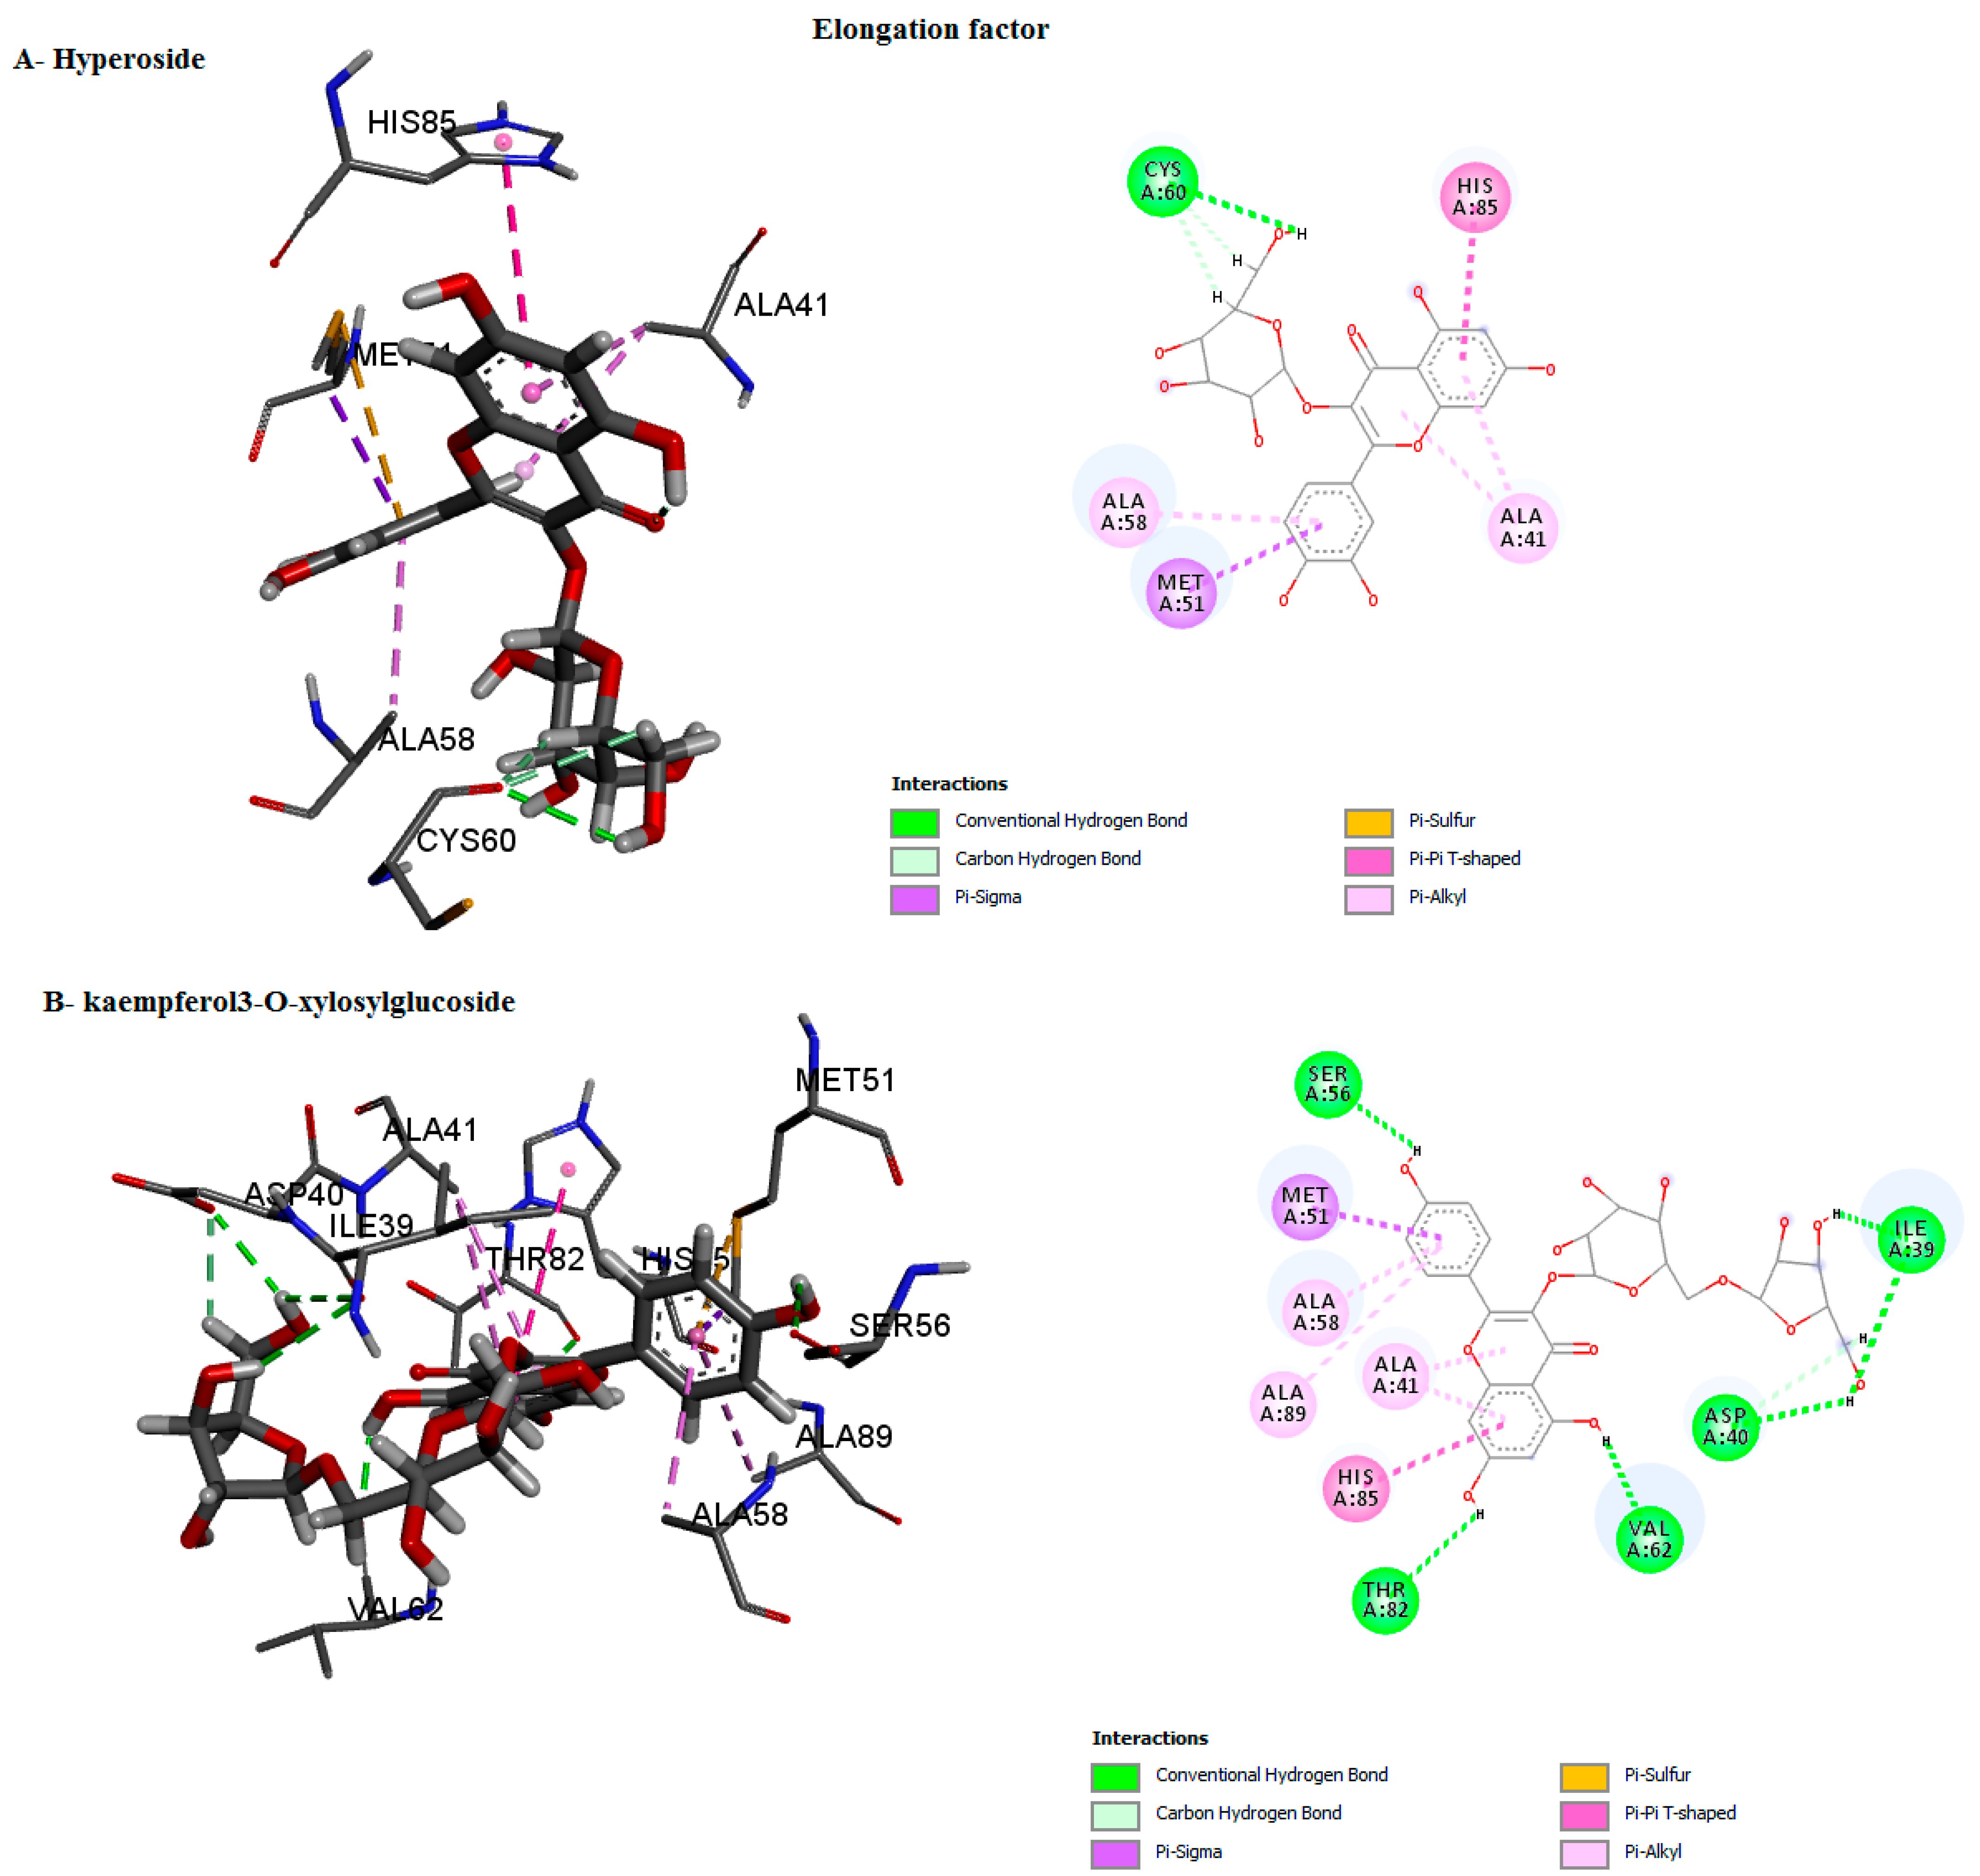
| Elongation factor | kaempferol3-O-xylosylglucoside, | 0 | −9.8 | HIS85, ALA58 GLN57, MET51 ALA41, ASP40, THR37 | Van der waals Conventional H-bond pi-Alkyl Pi-Pi T–shaped Pi-Sigma Pi-Sigma | center_x = 22.1139 center_y = 30.3465 center_z = 31.8549 |
| Delphinidin 3-glucoside ID/D | −9.5 | −9.5 | HIS85, VAL62 CYS60, ALA58 GLN57, MET51 ALA41, THR37 | Cabon H-bond Conventional H-bond Pi-Sigma Pi-Pi T–shaped pi-Alkyl Pi-Sulfur | ||
| hyperoside D | −9.9 | 0 | HIS85, CYS60, ALA58, MET51, ALA41, THR37 | Cabon H-bond Conventional H-bond Pi-Sigma Pi-Pi T–shaped pi-Alkyl Pi-Sulfur | ||
| Carbamoyl phosphate synthase | disodium 5′-guanylate | −8.1 | 0 | LYS196, MET195, LYS194, GLN182, CYS178, ASN152, GLY151, GLY149, PRO81, SER60 | Cabon H-bond Conventional H-bond pi-Alkyl Pi-Cation | |
| Petunidin 3-glucoside | 0 | −6.8 | TRP34, LEU31, GLU29, LYS28, ARG26, LEU13, ILE10, ILE8, PHE2 | Cabon H-bond Conventional H-bond Pi-Sigma pi-Alkyl Unfavourable Donor–Donor Halogen (Fluorine) | center_x = 21.3610 center_y = 59.0995 center_z = 103.8306 |
Publisher’s Note: MDPI stays neutral with regard to jurisdictional claims in published maps and institutional affiliations. |
© 2022 by the authors. Licensee MDPI, Basel, Switzerland. This article is an open access article distributed under the terms and conditions of the Creative Commons Attribution (CC BY) license (https://creativecommons.org/licenses/by/4.0/).
Share and Cite
Shamkh, I.M.; Al-Majidi, M.; Shntaif, A.H.; Deng Kai, P.T.; Nh-Pham, N.; Rahman, I.; Hamza, D.; Khan, M.S.; Elsharayidi, M.S.; Salah, E.T.; et al. Nontoxic and Naturally Occurring Active Compounds as Potential Inhibitors of Biological Targets in Liriomyza trifolii. Int. J. Mol. Sci. 2022, 23, 12791. https://doi.org/10.3390/ijms232112791
Shamkh IM, Al-Majidi M, Shntaif AH, Deng Kai PT, Nh-Pham N, Rahman I, Hamza D, Khan MS, Elsharayidi MS, Salah ET, et al. Nontoxic and Naturally Occurring Active Compounds as Potential Inhibitors of Biological Targets in Liriomyza trifolii. International Journal of Molecular Sciences. 2022; 23(21):12791. https://doi.org/10.3390/ijms232112791
Chicago/Turabian StyleShamkh, Israa M., Mohammed Al-Majidi, Ahmed Hassen Shntaif, Peter Tan Deng Kai, Ngoc Nh-Pham, Ishrat Rahman, Dalia Hamza, Mohammad Shahbaz Khan, Maii S. Elsharayidi, Eman T. Salah, and et al. 2022. "Nontoxic and Naturally Occurring Active Compounds as Potential Inhibitors of Biological Targets in Liriomyza trifolii" International Journal of Molecular Sciences 23, no. 21: 12791. https://doi.org/10.3390/ijms232112791