
Metabolic Syndrome: Updates on Pathophysiology and Management in 2021

 ,
,
Abstract
:1. Introduction
1.1. History
1.2. Epidemiology
2. Pathophysiology
2.1. Established Ideas
2.1.1. Insulin Resistance
2.1.2. Adipose Tissue, an Endocrine Organ
2.1.3. Chronic Inflammation
2.2. Novel Studies
2.2.1. Fetuin-A
2.2.2. Mitochondrial Dysfunction and PGC-1α in MetS
2.2.3. Circulatory MicroRNAs
2.2.4. IDEFICS/I.Family Study and the Underlying Genetic Predisposition for MetS Risk
2.2.5. GPCRs Gene Expression Affected by MetS Etiology
2.2.6. Parental MetS Epigenetic Effects on Offspring
2.2.7. Metabolomics
2.3. MetS and Mice Studies
3. Management
3.1. Mediterranean Diet
3.2. Nutraceuticals
3.3. Butyrate
3.4. Probiotics
3.5. Coconut Oil Effect on Asymmetric Dimethylarginine (ADMA)
3.6. Curcumin
3.7. Statins
3.8. Anti-Hyperglycemic Agents
4. Conclusions
Author Contributions
Funding
Conflicts of Interest
Abbreviations
| ACLY | ATP-citrate lyase |
| ADMA | asymmetric dimethylarginine |
| AHA | American Heart Association |
| AHSG | α2-Heremans–Schmid glycoprotein |
| ALT | alanine aminotransferase |
| AMPK | AMP-activated protein kinase |
| Ang II | angiotensin II |
| Apo-A1 | apolipoprotein A1 |
| Apo-B | apolipoprotein B |
| ASCVD | atherosclerotic cardiovascular disease |
| AST | aspartate aminotransferase |
| AUC | area under the curve |
| BMI | body mass index |
| CDC | Center of Disease Control and Prevention |
| CETP | cholesterol ester transfer protein |
| c-miRNAs | circulatory microRNAs |
| CRP | C-reactive protein |
| DAG | diacylglycerol |
| DAMPs | damage-associated molecular patterns |
| ED | endothelial dysfunction |
| ERRs | estrogen-related receptors |
| ETC | electron transport chain |
| FA | fatty acids |
| FADH2 | reduced flavin adenine dinucleotide |
| FFAs | free fatty acids |
| FFAR | free fatty acid receptors |
| FTO | fat mass and obesity-associated |
| GDF15 | growth differentiation factor 15 |
| GPCRs | G protein-coupled receptors |
| GLUT4 | glucose transporter |
| GLP-1 | glucagon-like peptide 1 |
| HDAC | histone deacetylase |
| HDL | high-density lipoprotein |
| HFD | high-fat diets |
| HMG-CoA | 3-hydroxy-3-methyl-glutaryl-coenzyme A |
| HMGCR | HMG-CoA reductase |
| HOMA-IR | homeostatic model assessment-insulin resistance |
| hs-CRP | high-sensitivity C-reactive protein |
| ICAM-1 | intercellular adhesion molecule 1 |
| IDEFICS | Identification and Prevention of Dietary- and Lifestyle-Induced Health Effects in Children and Infants |
| IGT | impaired glucose tolerance |
| IL-6 | interleukin 6 |
| IP3 | inositol 1,4,5-triphosphate |
| IRS-1 | insulin receptor substrate-1 |
| KO | knockout |
| LDL-C | low-density lipoprotein |
| LAP | latency-associated protein |
| LIKRO | liver-specific insulin receptor knockout |
| LOX-1 | lipoprotein receptor-1 |
| LPS | lipopolysaccharides |
| MCP-1 | monocyte chemoattractant protein-1 |
| MD | Mediterranean diet |
| MetS | metabolic syndrome |
| MCFAs | medium-chain fatty acids |
| miRNAs | microRNAs |
| NHANES | National Health and Nutrition Examination Survey |
| NADH | nicotinamide adenine dinucleotide |
| NADPH oxidase | nicotinamide adenine dinucleotide phosphate oxidase |
| NAFLD | non-alcoholic fatty liver disease |
| NF-kB | nuclear factor kappa-light-chain enhancer of activated B cells |
| NO | nitric oxide |
| NREP | neuronal regeneration–related protein |
| NRF-1 and NRF-2 | nuclear respiratory factors 1 and 2 |
| PAI-1 | plasminogen activator inhibitor 1 |
| PAMPs | pathogen-associated molecular patterns |
| PGC-1α | peroxisome proliferator-activated receptor-γ coactivator 1α |
| PI3K | phosphoinositide 3-kinase |
| PPARα and PPARδ | peroxisome proliferator-activated receptor α and δ |
| PPARγ | peroxisome proliferator-activated receptor-γ |
| PPY | peptide YY |
| PWV | pulse wave velocity |
| QUICKI | quantitative insulin sensitivity check index |
| RAS | renin–angiotensinogen system |
| ROS | reactive oxygen species |
| SCFAs | short-chain fatty acids |
| Sd-LDL | small dense LDL |
| SFA | saturated fatty acid |
| SNPs | single nucleotide polymorphisms |
| SREBP-1 | sterol regulatory element-binding protein 1 |
| STZ | streptozotocin |
| T2DM | type II diabetes mellitus |
| TFAM | mitochondrial transcription factor A |
| TFB2M | mitochondrial transcription factor B2 |
| TGs | triglycerides |
| Th1 | T helper type 1 |
| TNF α | tumor necrosis factor α |
| TLRs | Toll-like receptors |
| VCAM-1 | vascular cell adhesion molecule 1 |
| VLDLs | very low-density lipoproteins |
| VSMCs | vascular smooth muscle cells |
| VCO | virgin coconut oil |
| WBCs | white blood cells |
References
- Reaven, G.M. Banting Lecture 1988. Role of insulin resistance in human disease. Nutrition 1997, 13, 65. [Google Scholar] [CrossRef]
- Cheng, T.O. Cardiac syndrome X versus metabolic syndrome X. Int. J. Cardiol. 2006, 119, 137–138. [Google Scholar] [CrossRef] [PubMed]
- Manach, C.; Scalbert, A.; Morand, C.; Rémésy, C.; Jiménez, L. Polyphenols: Food sources and bioavailability. Am. J. Clin. Nutr. 2004, 79, 727–747. [Google Scholar] [CrossRef] [PubMed] [Green Version]
- Saklayen, M.G. The global epidemic of the metabolic syndrome. Curr. Hypertens. Rep. 2018, 20, 1–8. [Google Scholar] [CrossRef] [Green Version]
- Eckel, R.H.; Alberti, K.G.; Grundy, S.M.; Zimmet, P.Z. The metabolic syndrome. Lancet 2010, 375, 181–183. [Google Scholar] [CrossRef]
- McCracken, E.; Monaghan, M.; Sreenivasan, S. Pathophysiology of the metabolic syndrome. Clin. Dermatol. 2018, 36, 14–20. [Google Scholar] [CrossRef] [PubMed]
- Expert Panel on Detection, Evaluation, and Treatment of High Blood Cholesterol in Adults. Executive summary of the third report of the National Cholesterol Education Program (NCEP) expert panel on detection, evaluation, and treatment of high blood cholesterol in adults (adult treatment panel III). JAMA 2001, 285, 2486–2497. [Google Scholar] [CrossRef]
- Balkau, B.; Charles, M.-A. Comment on the provisional report from the WHO consultation. European Group for the Study of Insulin Resistance (EGIR). Diabet. Med. A J. Br. Diabet. Assoc. 1999, 16, 442–443. [Google Scholar]
- Ross, R.; Neeland, I.J.; Yamashita, S.; Shai, I.; Seidell, J.; Magni, P.; Santos, R.D.; Arsenault, B.; Cuevas, A.; Hu, F.B.; et al. Waist circumference as a vital sign in clinical practice: A Consensus Statement from the IAS and ICCR Working Group on Visceral Obesity. Nat. Rev. Endocrinol. 2020, 16, 177–189. [Google Scholar] [CrossRef]
- Neeland, I.J.; Poirier, P.; Després, J.-P. Cardiovascular and metabolic heterogeneity of obesity: Clinical challenges and implications for management. Circulation 2018, 137, 1391–1406. [Google Scholar] [CrossRef]
- Neeland, I.J.; Ross, R.; Després, J.-P.; Matsuzawa, Y.; Yamashita, S.; Shai, I.; Seidell, J.; Magni, P.; Santos, R.D.; Arsenault, B. Visceral and ectopic fat, atherosclerosis, and cardiometabolic disease: A position statement. Lancet Diabetes Endocrinol. 2019, 7, 715–725. [Google Scholar] [CrossRef]
- Nauli, A.M.; Matin, S. Why do men accumulate abdominal visceral fat? Front. Physiol. 2019, 10, 1486. [Google Scholar] [CrossRef] [PubMed] [Green Version]
- Liu, J.; Fox, C.S.; Hickson, D.; Bidulescu, A.; Carr, J.J.; Taylor, H.A. Fatty liver, abdominal visceral fat, and cardiometabolic risk factors: The Jackson Heart Study. Arterioscler. Thromb. Vasc. Biol. 2011, 31, 2715–2722. [Google Scholar] [CrossRef] [Green Version]
- Alberti, K.G.; Eckel, R.H.; Grundy, S.M.; Zimmet, P.Z.; Cleeman, J.I.; Donato, K.A.; Fruchart, J.-C.; James, W.P.T.; Loria, C.M.; Smith, S.C., Jr. Harmonizing the metabolic syndrome: A joint interim statement of the international diabetes federation task force on epidemiology and prevention; national heart, lung, and blood institute; American heart association; world heart federation; international atherosclerosis society; and international association for the study of obesity. Circulation 2009, 120, 1640–1645. [Google Scholar] [PubMed] [Green Version]
- Ashwell, M.; Gunn, P.; Gibson, S. Waist-to-height ratio is a better screening tool than waist circumference and BMI for adult cardiometabolic risk factors: Systematic review and meta-analysis. Obes. Rev. 2012, 13, 275–286. [Google Scholar] [CrossRef]
- Moore, J.X.; Chaudhary, N.; Akinyemiju, T. Peer reviewed: Metabolic syndrome prevalence by race/ethnicity and sex in the United States, National Health and Nutrition Examination Survey, 1988–2012. Prev. Chronic Dis. 2017, 14, E24. [Google Scholar] [CrossRef] [Green Version]
- Swarup, S.; Goyal, A.; Grigorova, Y.; Zeltser, R. Metabolic Syndrome; StatPearls: Treasure Island, FL, USA, 2020. [Google Scholar]
- Fathi Dizaji, B. The investigations of genetic determinants of the metabolic syndrome. Diabetes Metab. Syndr. 2018, 12, 783–789. [Google Scholar] [CrossRef] [PubMed]
- Matsuzawa, Y.; Funahashi, T.; Nakamura, T. The concept of metabolic syndrome: Contribution of visceral fat accumulation and its molecular mechanism. J. Atheroscler. Thromb. 2011, 18, 629–639. [Google Scholar] [CrossRef] [Green Version]
- Pekgor, S.; Duran, C.; Berberoglu, U.; Eryilmaz, M.A. The Role of Visceral Adiposity Index Levels in Predicting the Presence of Metabolic Syndrome and Insulin Resistance in Overweight and Obese Patients. Metab. Syndr. Relat. Disord. 2019, 17, 296–302. [Google Scholar] [CrossRef]
- Boden, G.; Shulman, G.I. Free fatty acids in obesity and type 2 diabetes: Defining their role in the development of insulin resistance and beta-cell dysfunction. Eur. J. Clin. Investig. 2002, 32, 14–23. [Google Scholar] [CrossRef]
- Griffin, M.E.; Marcucci, M.J.; Cline, G.W.; Bell, K.; Barucci, N.; Lee, D.; Goodyear, L.J.; Kraegen, E.W.; White, M.F.; Shulman, G.I. Free fatty acid-induced insulin resistance is associated with activation of protein kinase C theta and alterations in the insulin signaling cascade. Diabetes 1999, 48, 1270–1274. [Google Scholar] [CrossRef] [PubMed]
- Unger, R.H.; Zhou, Y.T. Lipotoxicity of beta-cells in obesity and in other causes of fatty acid spillover. Diabetes 2001, 50 (Suppl. 1), S118–S121. [Google Scholar] [CrossRef] [Green Version]
- Patel, P.; Abate, N. Body fat distribution and insulin resistance. Nutrients 2013, 5, 2019–2027. [Google Scholar] [CrossRef]
- Murakami, T.; Michelagnoli, S.; Longhi, R.; Gianfranceschi, G.; Pazzucconi, F.; Calabresi, L.; Sirtori, C.R.; Franceschini, G. Triglycerides are major determinants of cholesterol esterification/transfer and HDL remodeling in human plasma. Arter. Thromb. Vasc. Biol. 1995, 15, 1819–1828. [Google Scholar] [CrossRef] [PubMed]
- Eisenberg, S.; Gavish, D.; Oschry, Y.; Fainaru, M.; Deckelbaum, R.J. Abnormalities in very low, low and high density lipoproteins in hypertriglyceridemia. Reversal toward normal with bezafibrate treatment. J. Clin. Investig. 1984, 74, 470–482. [Google Scholar] [CrossRef] [PubMed] [Green Version]
- Tripathy, D.; Mohanty, P.; Dhindsa, S.; Syed, T.; Ghanim, H.; Aljada, A.; Dandona, P. Elevation of free fatty acids induces inflammation and impairs vascular reactivity in healthy subjects. Diabetes 2003, 52, 2882–2887. [Google Scholar] [CrossRef] [Green Version]
- Esler, M.; Rumantir, M.; Wiesner, G.; Kaye, D.; Hastings, J.; Lambert, G. Sympathetic nervous system and insulin resistance: From obesity to diabetes. Am. J. Hypertens. 2001, 14, 304S–309S. [Google Scholar] [CrossRef] [Green Version]
- Juhan-Vague, I.; Alessi, M.C.; Mavri, A.; Morange, P.E. Plasminogen activator inhibitor-1, inflammation, obesity, insulin resistance and vascular risk. J. Thromb. Haemost. 2003, 1, 1575–1579. [Google Scholar] [CrossRef]
- Duncan, M.; Singh, B.; Wise, P.H.; Carter, G.; Alaghband-Zadeh, J. A simple measure of insulin resistance. Lancet (Lond. Engl.) 1995, 346, 120–121. [Google Scholar] [CrossRef]
- Hřebíček, J.i.; Janout, V.r.; Malinčíková, J.; Horáková, D.; Čízžek, L.k. Detection of insulin resistance by simple quantitative insulin sensitivity check index QUICKI for epidemiological assessment and prevention. J. Clin. Endocrinol. Metab. 2002, 87, 144–147. [Google Scholar] [CrossRef]
- Matthews, D.R.; Hosker, J.; Rudenski, A.; Naylor, B.; Treacher, D.; Turner, R. Homeostasis model assessment: Insulin resistance and β-cell function from fasting plasma glucose and insulin concentrations in man. Diabetologia 1985, 28, 412–419. [Google Scholar] [CrossRef] [Green Version]
- Mondal, N.; Singh, V.; Saxena, V. Determining the interaction between groundwater and saline water through groundwater major ions chemistry. J. Hydrol. 2010, 388, 100–111. [Google Scholar] [CrossRef]
- Motamed, N.; Miresmail, S.J.H.; Rabiee, B.; Keyvani, H.; Farahani, B.; Maadi, M.; Zamani, F. Optimal cutoff points for HOMA-IR and QUICKI in the diagnosis of metabolic syndrome and non-alcoholic fatty liver disease: A population based study. J. Diabetes Complicat. 2016, 30, 269–274. [Google Scholar] [CrossRef]
- Mohamed-Ali, V.; Pinkney, J.H.; Coppack, S.W. Adipose tissue as an endocrine and paracrine organ. Int. J. Obes. Relat. Metab. Disord. 1998, 22, 1145–1158. [Google Scholar] [CrossRef] [Green Version]
- Trayhurn, P.; Wood, I.S. Adipokines: Inflammation and the pleiotropic role of white adipose tissue. Br. J. Nutr. 2004, 92, 347–355. [Google Scholar] [CrossRef] [PubMed] [Green Version]
- Considine, R.V.; Sinha, M.K.; Heiman, M.L.; Kriauciunas, A.; Stephens, T.W.; Nyce, M.R.; Ohannesian, J.P.; Marco, C.C.; McKee, L.J.; Bauer, T.L.; et al. Serum immunoreactive-leptin concentrations in normal-weight and obese humans. N. Engl. J. Med. 1996, 334, 292–295. [Google Scholar] [CrossRef]
- Berglund, E.D.; Vianna, C.R.; Donato, J., Jr.; Kim, M.H.; Chuang, J.C.; Lee, C.E.; Lauzon, D.A.; Lin, P.; Brule, L.J.; Scott, M.M.; et al. Direct leptin action on POMC neurons regulates glucose homeostasis and hepatic insulin sensitivity in mice. J. Clin. Investig. 2012, 122, 1000–1009. [Google Scholar] [CrossRef] [PubMed] [Green Version]
- Obradovic, M.; Sudar-Milovanovic, E.; Soskic, S.; Essack, M.; Arya, S.; Stewart, A.J.; Gojobori, T.; Isenovic, E.R. Leptin and Obesity: Role and Clinical Implication. Front. Endocrinol. (Lausanne) 2021, 12, 585887. [Google Scholar] [CrossRef] [PubMed]
- Lord, G.M.; Matarese, G.; Howard, J.K.; Baker, R.J.; Bloom, S.R.; Lechler, R.I. Leptin modulates the T-cell immune response and reverses starvation-induced immunosuppression. Nature 1998, 394, 897–901. [Google Scholar] [CrossRef]
- Patel, S.B.; Reams, G.P.; Spear, R.M.; Freeman, R.H.; Villarreal, D. Leptin: Linking obesity, the metabolic syndrome, and cardiovascular disease. Curr. Hypertens. Rep. 2008, 10, 131–137. [Google Scholar] [CrossRef]
- Yamauchi, T.; Kamon, J.; Waki, H.; Imai, Y.; Shimozawa, N.; Hioki, K.; Uchida, S.; Ito, Y.; Takakuwa, K.; Matsui, J.; et al. Globular adiponectin protected ob/ob mice from diabetes and ApoE-deficient mice from atherosclerosis. J. Biol. Chem. 2003, 278, 2461–2468. [Google Scholar] [CrossRef] [PubMed] [Green Version]
- Esteve, E.; Ricart, W.; Fernandez-Real, J.M. Adipocytokines and insulin resistance: The possible role of lipocalin-2, retinol binding protein-4, and adiponectin. Diabetes Care 2009, 32, S362–S367. [Google Scholar] [CrossRef] [PubMed] [Green Version]
- Wulster-Radcliffe, M.C.; Ajuwon, K.M.; Wang, J.; Christian, J.A.; Spurlock, M.E. Adiponectin differentially regulates cytokines in porcine macrophages. BioChem Biophys. Res. Commun. 2004, 316, 924–929. [Google Scholar] [CrossRef]
- Yamauchi, T.; Kamon, J.; Waki, H.; Terauchi, Y.; Kubota, N.; Hara, K.; Mori, Y.; Ide, T.; Murakami, K.; Tsuboyama-Kasaoka, N.; et al. The fat-derived hormone adiponectin reverses insulin resistance associated with both lipoatrophy and obesity. Nat. Med. 2001, 7, 941–946. [Google Scholar] [CrossRef] [PubMed]
- Ouchi, N.; Kihara, S.; Arita, Y.; Nishida, M.; Matsuyama, A.; Okamoto, Y.; Ishigami, M.; Kuriyama, H.; Kishida, K.; Nishizawa, H.; et al. Adipocyte-derived plasma protein, adiponectin, suppresses lipid accumulation and class A scavenger receptor expression in human monocyte-derived macrophages. Circulation 2001, 103, 1057–1063. [Google Scholar] [CrossRef]
- Ouchi, N.; Kihara, S.; Arita, Y.; Maeda, K.; Kuriyama, H.; Okamoto, Y.; Hotta, K.; Nishida, M.; Takahashi, M.; Nakamura, T.; et al. Novel modulator for endothelial adhesion molecules: Adipocyte-derived plasma protein adiponectin. Circulation 1999, 100, 2473–2476. [Google Scholar] [CrossRef] [Green Version]
- Pischon, T.; Girman, C.J.; Hotamisligil, G.S.; Rifai, N.; Hu, F.B.; Rimm, E.B. Plasma adiponectin levels and risk of myocardial infarction in men. JAMA 2004, 291, 1730–1737. [Google Scholar] [CrossRef] [PubMed] [Green Version]
- Hotta, K.; Funahashi, T.; Arita, Y.; Takahashi, M.; Matsuda, M.; Okamoto, Y.; Iwahashi, H.; Kuriyama, H.; Ouchi, N.; Maeda, K.; et al. Plasma concentrations of a novel, adipose-specific protein, adiponectin, in type 2 diabetic patients. Arter. Thromb. Vasc. Biol. 2000, 20, 1595–1599. [Google Scholar] [CrossRef] [Green Version]
- Chow, W.S.; Cheung, B.M.; Tso, A.W.; Xu, A.; Wat, N.M.; Fong, C.H.; Ong, L.H.; Tam, S.; Tan, K.C.; Janus, E.D.; et al. Hypoadiponectinemia as a predictor for the development of hypertension: A 5-year prospective study. Hypertension 2007, 49, 1455–1461. [Google Scholar] [CrossRef] [Green Version]
- Kondo, H.; Shimomura, I.; Matsukawa, Y.; Kumada, M.; Takahashi, M.; Matsuda, M.; Ouchi, N.; Kihara, S.; Kawamoto, T.; Sumitsuji, S.; et al. Association of adiponectin mutation with type 2 diabetes: A candidate gene for the insulin resistance syndrome. Diabetes 2002, 51, 2325–2328. [Google Scholar] [CrossRef] [Green Version]
- Buechler, C.; Feder, S.; Haberl, E.M.; Aslanidis, C. Chemerin Isoforms and Activity in Obesity. Int. J. Mol. Sci. 2019, 20, 1128. [Google Scholar] [CrossRef] [PubMed] [Green Version]
- Helfer, G.; Wu, Q.F. Chemerin: A multifaceted adipokine involved in metabolic disorders. J. Endocrinol. 2018, 238, R79–R94. [Google Scholar] [CrossRef]
- Jialal, I.; Devaraj, S.; Kaur, H.; Adams-Huet, B.; Bremer, A.A. Increased chemerin and decreased omentin-1 in both adipose tissue and plasma in nascent metabolic syndrome. J. Clin. Endocrinol. Metab. 2013, 98, E514–E517. [Google Scholar] [CrossRef] [PubMed]
- Wang, D.; Yuan, G.Y.; Wang, X.Z.; Jia, J.; Di, L.L.; Yang, L.; Chen, X.; Qian, F.F.; Chen, J.J. Plasma chemerin level in metabolic syndrome. Genet. Mol. Res. 2013, 12, 5986–5991. [Google Scholar] [CrossRef] [PubMed]
- Dong, B.; Ji, W.; Zhang, Y. Elevated serum chemerin levels are associated with the presence of coronary artery disease in patients with metabolic syndrome. Intern. Med. 2011, 50, 1093–1097. [Google Scholar] [CrossRef] [Green Version]
- Bozaoglu, K.; Bolton, K.; McMillan, J.; Zimmet, P.; Jowett, J.; Collier, G.; Walder, K.; Segal, D. Chemerin is a novel adipokine associated with obesity and metabolic syndrome. Endocrinology 2007, 148, 4687–4694. [Google Scholar] [CrossRef]
- Chu, S.H.; Lee, M.K.; Ahn, K.Y.; Im, J.A.; Park, M.S.; Lee, D.C.; Jeon, J.Y.; Lee, J.W. Chemerin and adiponectin contribute reciprocally to metabolic syndrome. PLoS ONE 2012, 7, e34710. [Google Scholar] [CrossRef]
- Shafer-Eggleton, J.; Adams-Huet, B.; Jialal, I. Chemerin Ratios to HDL-cholesterol and Adiponectin as Biomarkers of Metabolic Syndrome. Endocr. Res. 2020, 45, 241–245. [Google Scholar] [CrossRef]
- Saiki, A.; Ohira, M.; Endo, K.; Koide, N.; Oyama, T.; Murano, T.; Watanabe, H.; Miyashita, Y.; Shirai, K. Circulating angiotensin II is associated with body fat accumulation and insulin resistance in obese subjects with type 2 diabetes mellitus. Metabolism 2009, 58, 708–713. [Google Scholar] [CrossRef]
- Rajagopalan, S.; Kurz, S.; Munzel, T.; Tarpey, M.; Freeman, B.A.; Griendling, K.K.; Harrison, D.G. Angiotensin II-mediated hypertension in the rat increases vascular superoxide production via membrane NADH/NADPH oxidase activation. Contribution to alterations of vasomotor tone. J. Clin. Investig. 1996, 97, 1916–1923. [Google Scholar] [CrossRef] [Green Version]
- Lassegue, B.; Sorescu, D.; Szocs, K.; Yin, Q.; Akers, M.; Zhang, Y.; Grant, S.L.; Lambeth, J.D.; Griendling, K.K. Novel gp91(phox) homologues in vascular smooth muscle cells: Nox1 mediates angiotensin II-induced superoxide formation and redox-sensitive signaling pathways. Circ. Res. 2001, 88, 888–894. [Google Scholar] [CrossRef] [Green Version]
- Li, D.Y.; Zhang, Y.C.; Philips, M.I.; Sawamura, T.; Mehta, J.L. Upregulation of endothelial receptor for oxidized low-density lipoprotein (LOX-1) in cultured human coronary artery endothelial cells by angiotensin II type 1 receptor activation. Circ. Res. 1999, 84, 1043–1049. [Google Scholar] [CrossRef] [PubMed] [Green Version]
- Zafari, A.M.; Ushio-Fukai, M.; Akers, M.; Yin, Q.; Shah, A.; Harrison, D.G.; Taylor, W.R.; Griendling, K.K. Role of NADH/NADPH oxidase-derived H2O2 in angiotensin II-induced vascular hypertrophy. Hypertension 1998, 32, 488–495. [Google Scholar] [CrossRef] [Green Version]
- Mehta, P.K.; Griendling, K.K. Angiotensin II cell signaling: Physiological and pathological effects in the cardiovascular system. Am. J. Physiol. Cell Physiol. 2007, 292, C82–C97. [Google Scholar] [CrossRef]
- Kopp, H.P.; Kopp, C.W.; Festa, A.; Krzyzanowska, K.; Kriwanek, S.; Minar, E.; Roka, R.; Schernthaner, G. Impact of weight loss on inflammatory proteins and their association with the insulin resistance syndrome in morbidly obese patients. Arter. Thromb. Vasc. Biol. 2003, 23, 1042–1047. [Google Scholar] [CrossRef] [Green Version]
- Hotamisligil, G.S. Inflammation and metabolic disorders. Nature 2006, 444, 860–867. [Google Scholar] [CrossRef] [PubMed]
- Weisberg, S.P.; McCann, D.; Desai, M.; Rosenbaum, M.; Leibel, R.L.; Ferrante, A.W., Jr. Obesity is associated with macrophage accumulation in adipose tissue. J. Clin. Investig. 2003, 112, 1796–1808. [Google Scholar] [CrossRef] [PubMed]
- Kanemaki, T.; Kitade, H.; Kaibori, M.; Sakitani, K.; Hiramatsu, Y.; Kamiyama, Y.; Ito, S.; Okumura, T. Interleukin 1beta and interleukin 6, but not tumor necrosis factor alpha, inhibit insulin-stimulated glycogen synthesis in rat hepatocytes. Hepatology 1998, 27, 1296–1303. [Google Scholar] [CrossRef]
- Ridker, P.M.; Hennekens, C.H.; Buring, J.E.; Rifai, N. C-reactive protein and other markers of inflammation in the prediction of cardiovascular disease in women. N. Engl. J. Med. 2000, 342, 836–843. [Google Scholar] [CrossRef] [PubMed]
- Burstein, S.A.; Peng, J.; Friese, P.; Wolf, R.F.; Harrison, P.; Downs, T.; Hamilton, K.; Comp, P.; Dale, G.L. Cytokine-induced alteration of platelet and hemostatic function. Stem Cells 1996, 14, 154–162. [Google Scholar] [CrossRef]
- Wassmann, S.; Stumpf, M.; Strehlow, K.; Schmid, A.; Schieffer, B.; Bohm, M.; Nickenig, G. Interleukin-6 induces oxidative stress and endothelial dysfunction by overexpression of the angiotensin II type 1 receptor. Circ. Res. 2004, 94, 534–541. [Google Scholar] [CrossRef] [Green Version]
- Hotamisligil, G.S.; Arner, P.; Caro, J.F.; Atkinson, R.L.; Spiegelman, B.M. Increased adipose tissue expression of tumor necrosis factor-alpha in human obesity and insulin resistance. J. Clin. Investig. 1995, 95, 2409–2415. [Google Scholar] [CrossRef]
- Hotamisligil, G.S.; Murray, D.L.; Choy, L.N.; Spiegelman, B.M. Tumor necrosis factor alpha inhibits signaling from the insulin receptor. Proc. Natl. Acad. Sci. USA 1994, 91, 4854–4858. [Google Scholar] [CrossRef] [Green Version]
- Zhang, H.H.; Halbleib, M.; Ahmad, F.; Manganiello, V.C.; Greenberg, A.S. Tumor necrosis factor-alpha stimulates lipolysis in differentiated human adipocytes through activation of extracellular signal-related kinase and elevation of intracellular cAMP. Diabetes 2002, 51, 2929–2935. [Google Scholar] [CrossRef] [PubMed]
- Kawai, T.; Akira, S. The role of pattern-recognition receptors in innate immunity: Update on Toll-like receptors. Nat. Immunol. 2010, 11, 373–384. [Google Scholar] [CrossRef] [PubMed]
- Akira, S.; Takeda, K.; Kaisho, T. Toll-like receptors: Critical proteins linking innate and acquired immunity. Nat. Immunol. 2001, 2, 675–680. [Google Scholar] [CrossRef] [PubMed]
- Shi, H.; Kokoeva, M.V.; Inouye, K.; Tzameli, I.; Yin, H.; Flier, J.S. TLR4 links innate immunity and fatty acid-induced insulin resistance. J. Clin. Investig. 2006, 116, 3015–3025. [Google Scholar] [CrossRef] [PubMed]
- Himes, R.W.; Smith, C.W. Tlr2 is critical for diet-induced metabolic syndrome in a murine model. FASEB J. 2010, 24, 731–739. [Google Scholar] [CrossRef] [Green Version]
- Jialal, I.; Huet, B.A.; Kaur, H.; Chien, A.; Devaraj, S. Increased toll-like receptor activity in patients with metabolic syndrome. Diabetes Care 2012, 35, 900–904. [Google Scholar] [CrossRef] [Green Version]
- Hardy, O.T.; Kim, A.; Ciccarelli, C.; Hayman, L.L.; Wiecha, J. Increased Toll-like receptor (TLR) mRNA expression in monocytes is a feature of metabolic syndrome in adolescents. Pediatr. Obes. 2013, 8, e19–e23. [Google Scholar] [CrossRef] [Green Version]
- Lim, P.S.; Chang, Y.K.; Wu, T.K. Serum Lipopolysaccharide-Binding Protein is Associated with Chronic Inflammation and Metabolic Syndrome in Hemodialysis Patients. Blood Purif. 2019, 47, 28–36. [Google Scholar] [CrossRef] [PubMed]
- Leber, B.; Tripolt, N.J.; Blattl, D.; Eder, M.; Wascher, T.C.; Pieber, T.R.; Stauber, R.; Sourij, H.; Oettl, K.; Stadlbauer, V. The influence of probiotic supplementation on gut permeability in patients with metabolic syndrome: An open label, randomized pilot study. Eur. J. Clin. Nutr. 2012, 66, 1110–1115. [Google Scholar] [CrossRef] [PubMed] [Green Version]
- Perez-Sotelo, D.; Roca-Rivada, A.; Larrosa-Garcia, M.; Castelao, C.; Baamonde, I.; Baltar, J.; Crujeiras, A.B.; Seoane, L.M.; Casanueva, F.F.; Pardo, M. Visceral and subcutaneous adipose tissue express and secrete functional alpha2hsglycoprotein (fetuin a) especially in obesity. Endocrine 2017, 55, 435–446. [Google Scholar] [CrossRef]
- Jialal, I.; Devaraj, S.; Bettaieb, A.; Haj, F.; Adams-Huet, B. Increased adipose tissue secretion of Fetuin-A, lipopolysaccharide-binding protein and high-mobility group box protein 1 in metabolic syndrome. Atherosclerosis 2015, 241, 130–137. [Google Scholar] [CrossRef] [PubMed]
- Ix, J.H.; Shlipak, M.G.; Brandenburg, V.M.; Ali, S.; Ketteler, M.; Whooley, M.A. Association between human fetuin-A and the metabolic syndrome: Data from the Heart and Soul Study. Circulation 2006, 113, 1760–1767. [Google Scholar] [CrossRef] [Green Version]
- Pan, X.; Wen, S.W.; Bestman, P.L.; Kaminga, A.C.; Acheampong, K.; Liu, A. Fetuin-A in Metabolic syndrome: A systematic review and meta-analysis. PLoS ONE 2020, 15, e0229776. [Google Scholar] [CrossRef] [Green Version]
- Kalabay, L.; Chavin, K.; Lebreton, J.P.; Robinson, K.A.; Buse, M.G.; Arnaud, P. Human recombinant alpha 2-HS glycoprotein is produced in insect cells as a full length inhibitor of the insulin receptor tyrosine kinase. Horm. Metab. Res. 1998, 30, 1–6. [Google Scholar] [CrossRef]
- Auberger, P.; Falquerho, L.; Contreres, J.O.; Pages, G.; Le Cam, G.; Rossi, B.; Le Cam, A. Characterization of a natural inhibitor of the insulin receptor tyrosine kinase: cDNA cloning, purification, and anti-mitogenic activity. Cell 1989, 58, 631–640. [Google Scholar] [CrossRef]
- Srinivas, P.R.; Wagner, A.S.; Reddy, L.V.; Deutsch, D.D.; Leon, M.A.; Goustin, A.S.; Grunberger, G. Serum alpha 2-HS-glycoprotein is an inhibitor of the human insulin receptor at the tyrosine kinase level. Mol. Endocrinol. 1993, 7, 1445–1455. [Google Scholar] [CrossRef] [Green Version]
- Mathews, S.T.; Singh, G.P.; Ranalletta, M.; Cintron, V.J.; Qiang, X.; Goustin, A.S.; Jen, K.L.; Charron, M.J.; Jahnen-Dechent, W.; Grunberger, G. Improved insulin sensitivity and resistance to weight gain in mice null for the Ahsg gene. Diabetes 2002, 51, 2450–2458. [Google Scholar] [CrossRef] [Green Version]
- Siegel-Axel, D.I.; Ullrich, S.; Stefan, N.; Rittig, K.; Gerst, F.; Klingler, C.; Schmidt, U.; Schreiner, B.; Randrianarisoa, E.; Schaller, H.E.; et al. Fetuin-A influences vascular cell growth and production of proinflammatory and angiogenic proteins by human perivascular fat cells. Diabetologia 2014, 57, 1057–1066. [Google Scholar] [CrossRef]
- Dasgupta, S.; Bhattacharya, S.; Biswas, A.; Majumdar, S.S.; Mukhopadhyay, S.; Ray, S.; Bhattacharya, S. NF-kappaB mediates lipid-induced fetuin-A expression in hepatocytes that impairs adipocyte function effecting insulin resistance. BioChem. J. 2010, 429, 451–462. [Google Scholar] [CrossRef] [PubMed] [Green Version]
- Stefan, N.; Sun, Q.; Fritsche, A.; Machann, J.; Schick, F.; Gerst, F.; Jeppesen, C.; Joost, H.G.; Hu, F.B.; Boeing, H.; et al. Impact of the adipokine adiponectin and the hepatokine fetuin-A on the development of type 2 diabetes: Prospective cohort- and cross-sectional phenotyping studies. PLoS ONE 2014, 9, e92238. [Google Scholar] [CrossRef] [PubMed] [Green Version]
- Vionnet, N.; Hani, E.H.; Dupont, S.; Gallina, S.; Francke, S.; Dotte, S.; De Matos, F.; Durand, E.; Lepretre, F.; Lecoeur, C.; et al. Genomewide search for type 2 diabetes-susceptibility genes in French whites: Evidence for a novel susceptibility locus for early-onset diabetes on chromosome 3q27-qter and independent replication of a type 2-diabetes locus on chromosome 1q21-q24. Am. J. Hum. Genet. 2000, 67, 1470–1480. [Google Scholar] [CrossRef]
- Kissebah, A.H.; Sonnenberg, G.E.; Myklebust, J.; Goldstein, M.; Broman, K.; James, R.G.; Marks, J.A.; Krakower, G.R.; Jacob, H.J.; Weber, J.; et al. Quantitative trait loci on chromosomes 3 and 17 influence phenotypes of the metabolic syndrome. Proc. Natl. Acad. Sci. USA 2000, 97, 14478–14483. [Google Scholar] [CrossRef] [PubMed] [Green Version]
- Thakkinstian, A.; Chailurkit, L.; Warodomwichit, D.; Ratanachaiwong, W.; Yamwong, S.; Chanprasertyothin, S.; Attia, J.; Sritara, P.; Ongphiphadhanakul, B. Causal relationship between body mass index and fetuin-A level in the asian population: A bidirectional Mendelian randomization study. Clin. Endocrinol. (Oxf) 2014, 81, 197–203. [Google Scholar] [CrossRef] [PubMed]
- Brookes, P.S. Mitochondrial H(+) leak and ROS generation: An odd couple. Free Radic. Biol. Med. 2005, 38, 12–23. [Google Scholar] [CrossRef]
- Wang, B.; Van Veldhoven, P.P.; Brees, C.; Rubio, N.; Nordgren, M.; Apanasets, O.; Kunze, M.; Baes, M.; Agostinis, P.; Fransen, M. Mitochondria are targets for peroxisome-derived oxidative stress in cultured mammalian cells. Free Radic. Biol. Med. 2013, 65, 882–894. [Google Scholar] [CrossRef] [Green Version]
- Andreyev, A.Y.; Kushnareva, Y.E.; Starkov, A.A. Mitochondrial metabolism of reactive oxygen species. Biochemistry (Moscow) 2005, 70, 200–214. [Google Scholar] [CrossRef]
- Bhatti, J.S.; Bhatti, G.K.; Reddy, P.H. Mitochondrial dysfunction and oxidative stress in metabolic disorders—A step towards mitochondria based therapeutic strategies. Biochim. Biophys. Acta Mol. Basis Dis. 2017, 1863, 1066–1077. [Google Scholar] [CrossRef]
- Masschelin, P.M.; Cox, A.R.; Chernis, N.; Hartig, S.M. The Impact of Oxidative Stress on Adipose Tissue Energy Balance. Front. Physiol. 2019, 10, 1638. [Google Scholar] [CrossRef] [PubMed]
- Kowaltowski, A.J.; Vercesi, A.E. Mitochondrial damage induced by conditions of oxidative stress. Free Radic. Biol. Med. 1999, 26, 463–471. [Google Scholar] [CrossRef]
- Furukawa, S.; Fujita, T.; Shimabukuro, M.; Iwaki, M.; Yamada, Y.; Nakajima, Y.; Nakayama, O.; Makishima, M.; Matsuda, M.; Shimomura, I. Increased oxidative stress in obesity and its impact on metabolic syndrome. J. Clin. Investig. 2004, 114, 1752–1761. [Google Scholar] [CrossRef] [PubMed]
- Burkart, A.M.; Tan, K.; Warren, L.; Iovino, S.; Hughes, K.J.; Kahn, C.R.; Patti, M.E. Insulin Resistance in Human iPS Cells Reduces Mitochondrial Size and Function. Sci. Rep. 2016, 6, 22788. [Google Scholar] [CrossRef] [Green Version]
- Handschin, C.; Spiegelman, B.M. Peroxisome proliferator-activated receptor gamma coactivator 1 coactivators, energy homeostasis, and metabolism. Endocr. Rev. 2006, 27, 728–735. [Google Scholar] [CrossRef]
- Canto, C.; Auwerx, J. PGC-1alpha, SIRT1 and AMPK, an energy sensing network that controls energy expenditure. Curr. Opin. Lipidol. 2009, 20, 98–105. [Google Scholar] [CrossRef] [Green Version]
- Scarpulla, R.C.; Vega, R.B.; Kelly, D.P. Transcriptional integration of mitochondrial biogenesis. Trends Endocrinol. Metab. 2012, 23, 459–466. [Google Scholar] [CrossRef] [Green Version]
- Barshad, G.; Marom, S.; Cohen, T.; Mishmar, D. Mitochondrial DNA Transcription and Its Regulation: An Evolutionary Perspective. Trends Genet. 2018, 34, 682–692. [Google Scholar] [CrossRef]
- Vega, R.B.; Huss, J.M.; Kelly, D.P. The coactivator PGC-1 cooperates with peroxisome proliferator-activated receptor alpha in transcriptional control of nuclear genes encoding mitochondrial fatty acid oxidation enzymes. Mol. Cell Biol. 2000, 20, 1868–1876. [Google Scholar] [CrossRef] [Green Version]
- Olmos, Y.; Valle, I.; Borniquel, S.; Tierrez, A.; Soria, E.; Lamas, S.; Monsalve, M. Mutual dependence of Foxo3a and PGC-1alpha in the induction of oxidative stress genes. J. Biol. Chem. 2009, 284, 14476–14484. [Google Scholar] [CrossRef] [Green Version]
- Valle, I.; Alvarez-Barrientos, A.; Arza, E.; Lamas, S.; Monsalve, M. PGC-1alpha regulates the mitochondrial antioxidant defense system in vascular endothelial cells. Cardiovasc. Res. 2005, 66, 562–573. [Google Scholar] [CrossRef] [Green Version]
- Vandenbeek, R.; Khan, N.P.; Estall, J.L. Linking Metabolic Disease With the PGC-1alpha Gly482Ser Polymorphism. Endocrinology 2018, 159, 853–865. [Google Scholar] [CrossRef]
- Komen, J.C.; Thorburn, D.R. Turn up the power—Pharmacological activation of mitochondrial biogenesis in mouse models. Br. J. Pharmacol. 2014, 171, 1818–1836. [Google Scholar] [CrossRef] [PubMed] [Green Version]
- Wu, Z.; Boss, O. Targeting PGC-1 alpha to control energy homeostasis. Expert Opin. Targets 2007, 11, 1329–1338. [Google Scholar] [CrossRef] [PubMed]
- Fortuño, A.; San José, G.; Moreno, M.U.; Beloqui, O.; Díez, J.; Zalba, G. Phagocytic NADPH oxidase overactivity underlies oxidative stress in metabolic syndrome. Diabetes 2006, 55, 209–215. [Google Scholar] [CrossRef]
- Jialal, I.; Devaraj, S.; Adams-Huet, B.; Chen, X.; Kaur, H. Increased cellular and circulating biomarkers of oxidative stress in nascent metabolic syndrome. J. Clin. Endocrinol. Metab. 2012, 97, E1844–E1850. [Google Scholar] [CrossRef] [Green Version]
- Avogaro, A.; Pagnin, E.; Calò, L. Monocyte NADPH oxidase subunit p22phox and inducible hemeoxygenase-1 gene expressions are increased in type II diabetic patients: Relationship with oxidative stress. J. Clin. Endocrinol. Metab. 2003, 88, 1753–1759. [Google Scholar] [CrossRef] [Green Version]
- Friedman, R.C.; Farh, K.K.; Burge, C.B.; Bartel, D.P. Most mammalian mRNAs are conserved targets of microRNAs. Genome Res. 2009, 19, 92–105. [Google Scholar] [CrossRef] [Green Version]
- Selbach, M.; Schwanhausser, B.; Thierfelder, N.; Fang, Z.; Khanin, R.; Rajewsky, N. Widespread changes in protein synthesis induced by microRNAs. Nature 2008, 455, 58–63. [Google Scholar] [CrossRef]
- Li, M.; Zhang, J. Circulating MicroRNAs: Potential and Emerging Biomarkers for Diagnosis of Cardiovascular and Cerebrovascular Diseases. BioMed Res. Int. 2015, 2015, 730535. [Google Scholar] [CrossRef] [PubMed]
- Zhao, Y.; Song, Y.; Yao, L.; Song, G.; Teng, C. Circulating microRNAs: Promising Biomarkers Involved in Several Cancers and Other Diseases. DNA Cell Biol. 2017, 36, 77–94. [Google Scholar] [CrossRef] [PubMed]
- Deiuliis, J.A. MicroRNAs as regulators of metabolic disease: Pathophysiologic significance and emerging role as biomarkers and therapeutics. Int. J. Obes. 2016, 40, 88–101. [Google Scholar] [CrossRef] [Green Version]
- Calderari, S.; Diawara, M.R.; Garaud, A.; Gauguier, D. Biological roles of microRNAs in the control of insulin secretion and action. Physiol. Genom. 2017, 49, 1–10. [Google Scholar] [CrossRef] [Green Version]
- Heneghan, H.M.; Miller, N.; McAnena, O.J.; O’Brien, T.; Kerin, M.J. Differential miRNA expression in omental adipose tissue and in the circulation of obese patients identifies novel metabolic biomarkers. J. Clin. Endocrinol. Metab. 2011, 96, E846–E850. [Google Scholar] [CrossRef]
- Martinelli, R.; Nardelli, C.; Pilone, V.; Buonomo, T.; Liguori, R.; Castano, I.; Buono, P.; Masone, S.; Persico, G.; Forestieri, P.; et al. miR-519d overexpression is associated with human obesity. Obesity (Silver Spring) 2010, 18, 2170–2176. [Google Scholar] [CrossRef] [PubMed]
- Poy, M.N.; Eliasson, L.; Krutzfeldt, J.; Kuwajima, S.; Ma, X.; Macdonald, P.E.; Pfeffer, S.; Tuschl, T.; Rajewsky, N.; Rorsman, P.; et al. A pancreatic islet-specific microRNA regulates insulin secretion. Nature 2004, 432, 226–230. [Google Scholar] [CrossRef]
- Frost, R.J.; Olson, E.N. Control of glucose homeostasis and insulin sensitivity by the Let-7 family of microRNAs. Proc. Natl. Acad. Sci. USA 2011, 108, 21075–21080. [Google Scholar] [CrossRef] [PubMed] [Green Version]
- Wang, Y.T.; Tsai, P.C.; Liao, Y.C.; Hsu, C.Y.; Juo, S.H. Circulating microRNAs have a sex-specific association with metabolic syndrome. J. BioMed Sci. 2013, 20, 72. [Google Scholar] [CrossRef] [Green Version]
- Sharma, S.; Eghbali, M. Influence of sex differences on microRNA gene regulation in disease. Biol. Sex Differ. 2014, 5, 3. [Google Scholar] [CrossRef] [Green Version]
- Ramzan, F.; D’Souza, R.F.; Durainayagam, B.R.; Milan, A.M.; Markworth, J.F.; Miranda-Soberanis, V.; Sequeira, I.R.; Roy, N.C.; Poppitt, S.D.; Mitchell, C.J.; et al. Circulatory miRNA biomarkers of metabolic syndrome. Acta Diabetol. 2020, 57, 203–214. [Google Scholar] [CrossRef]
- Backes, C.; Kehl, T.; Stockel, D.; Fehlmann, T.; Schneider, L.; Meese, E.; Lenhof, H.P.; Keller, A. miRPathDB: A new dictionary on microRNAs and target pathways. Nucleic. Acids Res. 2017, 45, D90–D96. [Google Scholar] [CrossRef]
- Sliwinska, A.; Kasinska, M.A.; Drzewoski, J. MicroRNAs and metabolic disorders—Where are we heading? Arch. Med. Sci. 2017, 13, 885–896. [Google Scholar] [CrossRef] [Green Version]
- Chen, Y.; Tian, L.; Wan, S.; Xie, Y.; Chen, X.; Ji, X.; Zhao, Q.; Wang, C.; Zhang, K.; Hock, J.M.; et al. MicroRNA-17-92 cluster regulates pancreatic beta-cell proliferation and adaptation. Mol. Cell Endocrinol. 2016, 437, 213–223. [Google Scholar] [CrossRef] [PubMed]
- Sun, L.L.; Jiang, B.G.; Li, W.T.; Zou, J.J.; Shi, Y.Q.; Liu, Z.M. MicroRNA-15a positively regulates insulin synthesis by inhibiting uncoupling protein-2 expression. Diabetes Res. Clin. Pract. 2011, 91, 94–100. [Google Scholar] [CrossRef]
- Kamalden, T.A.; Macgregor-Das, A.M.; Kannan, S.M.; Dunkerly-Eyring, B.; Khaliddin, N.; Xu, Z.; Fusco, A.P.; Yazib, S.A.; Chow, R.C.; Duh, E.J.; et al. Exosomal MicroRNA-15a Transfer from the Pancreas Augments Diabetic Complications by Inducing Oxidative Stress. Antioxid. Redox Signal. 2017, 27, 913–930. [Google Scholar] [CrossRef]
- Rawal, S.; Munasinghe, P.E.; Nagesh, P.T.; Lew, J.K.S.; Jones, G.T.; Williams, M.J.A.; Davis, P.; Bunton, D.; Galvin, I.F.; Manning, P.; et al. Down-regulation of miR-15a/b accelerates fibrotic remodelling in the Type 2 diabetic human and mouse heart. Clin. Sci. (Lond.) 2017, 131, 847–863. [Google Scholar] [CrossRef] [PubMed]
- Banikazemi, Z.; Haji, H.A.; Mohammadi, M.; Taheripak, G.; Iranifar, E.; Poursadeghiyan, M.; Moridikia, A.; Rashidi, B.; Taghizadeh, M.; Mirzaei, H. Diet and cancer prevention: Dietary compounds, dietary MicroRNAs, and dietary exosomes. J. Cell BioChem 2018, 119, 185–196. [Google Scholar] [CrossRef]
- Marsetti, P.S.; Milagro, F.I.; Zulet, M.A.; Martinez, J.A.; Lorente-Cebrian, S. Changes in miRNA expression with two weight-loss dietary strategies in a population with metabolic syndrome. Nutrition 2021, 83, 111085. [Google Scholar] [CrossRef] [PubMed]
- Hermsdorff, H.H.; Zulet, M.A.; Abete, I.; Martinez, J.A. Discriminated benefits of a Mediterranean dietary pattern within a hypocaloric diet program on plasma RBP4 concentrations and other inflammatory markers in obese subjects. Endocrine 2009, 36, 445–451. [Google Scholar] [CrossRef]
- Van Horn, L.; Carson, J.A.; Appel, L.J.; Burke, L.E.; Economos, C.; Karmally, W.; Lancaster, K.; Lichtenstein, A.H.; Johnson, R.K.; Thomas, R.J.; et al. Recommended Dietary Pattern to Achieve Adherence to the American Heart Association/American College of Cardiology (AHA/ACC) Guidelines: A Scientific Statement From the American Heart Association. Circulation 2016, 134, e505–e529. [Google Scholar] [CrossRef]
- Rome, S. Use of miRNAs in biofluids as biomarkers in dietary and lifestyle intervention studies. Genes Nutr. 2015, 10, 483. [Google Scholar] [CrossRef]
- Cook, S.; Weitzman, M.; Auinger, P.; Nguyen, M.; Dietz, W.H. Prevalence of a metabolic syndrome phenotype in adolescents: Findings from the third National Health and Nutrition Examination Survey, 1988–1994. Arch. Pediatr. Adolesc. Med. 2003, 157, 821–827. [Google Scholar] [CrossRef] [Green Version]
- Reinehr, T.; de Sousa, G.; Toschke, A.M.; Andler, W. Comparison of metabolic syndrome prevalence using eight different definitions: A critical approach. Arch. Dis. Child. 2007, 92, 1067–1072. [Google Scholar] [CrossRef] [Green Version]
- Nagrani, R.; Foraita, R.; Gianfagna, F.; Iacoviello, L.; Marild, S.; Michels, N.; Molnar, D.; Moreno, L.; Russo, P.; Veidebaum, T.; et al. Common genetic variation in obesity, lipid transfer genes and risk of Metabolic Syndrome: Results from IDEFICS/I.Family study and meta-analysis. Sci. Rep. 2020, 10, 7189. [Google Scholar] [CrossRef]
- Ahrens, W.; Bammann, K.; Siani, A.; Buchecker, K.; De Henauw, S.; Iacoviello, L.; Hebestreit, A.; Krogh, V.; Lissner, L.; Marild, S.; et al. The IDEFICS cohort: Design, characteristics and participation in the baseline survey. Int. J. Obes. 2011, 35, S3–S15. [Google Scholar] [CrossRef] [Green Version]
- Ahrens, W.; Siani, A.; Adan, R.; De Henauw, S.; Eiben, G.; Gwozdz, W.; Hebestreit, A.; Hunsberger, M.; Kaprio, J.; Krogh, V.; et al. Cohort Profile: The transition from childhood to adolescence in European children-how I. Family extends the IDEFICS cohort. Int. J. Epidemiol. 2017, 46, 1394–1395j. [Google Scholar] [CrossRef] [PubMed] [Green Version]
- Zhu, Y.; Zhang, D.; Zhou, D.; Li, Z.; Li, Z.; Fang, L.; Yang, M.; Shan, Z.; Li, H.; Chen, J.; et al. Susceptibility loci for metabolic syndrome and metabolic components identified in Han Chinese: A multi-stage genome-wide association study. J. Cell Mol. Med. 2017, 21, 1106–1116. [Google Scholar] [CrossRef] [PubMed]
- Khella, M.S.; Hamdy, N.M.; Amin, A.I.; El-Mesallamy, H.O. The (FTO) gene polymorphism is associated with metabolic syndrome risk in Egyptian females: A case- control study. BMC Med. Genet. 2017, 18, 101. [Google Scholar] [CrossRef] [PubMed] [Green Version]
- Dina, C.; Meyre, D.; Gallina, S.; Durand, E.; Korner, A.; Jacobson, P.; Carlsson, L.M.; Kiess, W.; Vatin, V.; Lecoeur, C.; et al. Variation in FTO contributes to childhood obesity and severe adult obesity. Nat. Genet. 2007, 39, 724–726. [Google Scholar] [CrossRef]
- Zeggini, E.; Weedon, M.N.; Lindgren, C.M.; Frayling, T.M.; Elliott, K.S.; Lango, H.; Timpson, N.J.; Perry, J.R.; Rayner, N.W.; Freathy, R.M.; et al. Replication of genome-wide association signals in UK samples reveals risk loci for type 2 diabetes. Science 2007, 316, 1336–1341. [Google Scholar] [CrossRef] [Green Version]
- Gerken, T.; Girard, C.A.; Tung, Y.C.; Webby, C.J.; Saudek, V.; Hewitson, K.S.; Yeo, G.S.; McDonough, M.A.; Cunliffe, S.; McNeill, L.A.; et al. The obesity-associated FTO gene encodes a 2-oxoglutarate-dependent nucleic acid demethylase. Science 2007, 318, 1469–1472. [Google Scholar] [CrossRef] [Green Version]
- Mizuno, T.M. Fat Mass and Obesity Associated (FTO) Gene and Hepatic Glucose and Lipid Metabolism. Nutrients 2018, 10, 1600. [Google Scholar] [CrossRef] [PubMed] [Green Version]
- Romero-Nava, R.; Garcia, N.; Aguayo-Ceron, K.A.; Sanchez Munoz, F.; Huang, F.; Hong, E.; Villafana, S. Modifications in GPR21 and GPR82 genes expression as a consequence of metabolic syndrome etiology. J. Recept. Signal Transduct. Res. 2021, 41, 38–44. [Google Scholar] [CrossRef] [PubMed]
- Ruiz-Hernandez, A.; Sanchez-Munoz, F.; Rodriguez, J.; Calderon-Zamora, L.; Romero-Nava, R.; Huang, F.; Hong, E.; Villafana, S. Expression of orphan receptors GPR22 and GPR162 in streptozotocin-induced diabetic rats. J. Recept. Signal Transduct. Res. 2015, 35, 46–53. [Google Scholar] [CrossRef] [PubMed]
- Uhlenbrock, K.; Gassenhuber, H.; Kostenis, E. Sphingosine 1-phosphate is a ligand of the human gpr3, gpr6 and gpr12 family of constitutively active G protein-coupled receptors. Cell Signal. 2002, 14, 941–953. [Google Scholar] [CrossRef]
- Osborn, O.; Oh, D.Y.; McNelis, J.; Sanchez-Alavez, M.; Talukdar, S.; Lu, M.; Li, P.; Thiede, L.; Morinaga, H.; Kim, J.J.; et al. G protein-coupled receptor 21 deletion improves insulin sensitivity in diet-induced obese mice. J. Clin. Investig. 2012, 122, 2444–2453. [Google Scholar] [CrossRef] [Green Version]
- Bresnick, J.N.; Skynner, H.A.; Chapman, K.L.; Jack, A.D.; Zamiara, E.; Negulescu, P.; Beaumont, K.; Patel, S.; McAllister, G. Identification of signal transduction pathways used by orphan g protein-coupled receptors. Assay Drug Dev. Technol. 2003, 1, 239–249. [Google Scholar] [CrossRef]
- Molkentin, J.D.; Dorn, G.W., 2nd. Cytoplasmic signaling pathways that regulate cardiac hypertrophy. Annu. Rev. Physiol. 2001, 63, 391–426. [Google Scholar] [CrossRef]
- Edwards, R.M.; Trizna, W.; Kinter, L.B. Renal microvascular effects of vasopressin and vasopressin antagonists. Am. J. Physiol. 1989, 256, F274–F278. [Google Scholar] [CrossRef]
- Engel, K.M.; Schrock, K.; Teupser, D.; Holdt, L.M.; Tonjes, A.; Kern, M.; Dietrich, K.; Kovacs, P.; Krugel, U.; Scheidt, H.A.; et al. Reduced food intake and body weight in mice deficient for the G protein-coupled receptor GPR82. PLoS ONE 2011, 6, e29400. [Google Scholar] [CrossRef] [Green Version]
- Lee, J.H.; Friso, S.; Choi, S.W. Epigenetic mechanisms underlying the link between non-alcoholic fatty liver diseases and nutrition. Nutrients 2014, 6, 3303–3325. [Google Scholar] [CrossRef] [PubMed] [Green Version]
- Del Campo, J.A.; Gallego-Duran, R.; Gallego, P.; Grande, L. Genetic and Epigenetic Regulation in Nonalcoholic Fatty Liver Disease (NAFLD). Int. J. Mol. Sci. 2018, 19, 911. [Google Scholar] [CrossRef] [PubMed] [Green Version]
- Michael, M.D.; Kulkarni, R.N.; Postic, C.; Previs, S.F.; Shulman, G.I.; Magnuson, M.A.; Kahn, C.R. Loss of insulin signaling in hepatocytes leads to severe insulin resistance and progressive hepatic dysfunction. Mol. Cell 2000, 6, 87–97. [Google Scholar] [CrossRef]
- Cohen, S.E.; Kokkotou, E.; Biddinger, S.B.; Kondo, T.; Gebhardt, R.; Kratzsch, J.; Mantzoros, C.S.; Kahn, C.R. High circulating leptin receptors with normal leptin sensitivity in liver-specific insulin receptor knock-out (LIRKO) mice. J. Biol. Chem. 2007, 282, 23672–23678. [Google Scholar] [CrossRef] [Green Version]
- De Jesus, D.F.; Orime, K.; Kaminska, D.; Kimura, T.; Basile, G.; Wang, C.H.; Haertle, L.; Riemens, R.; Brown, N.K.; Hu, J.; et al. Parental metabolic syndrome epigenetically reprograms offspring hepatic lipid metabolism in mice. J. Clin. Investig. 2020, 130, 2391–2407. [Google Scholar] [CrossRef] [Green Version]
- Wang, Q.; Jiang, L.; Wang, J.; Li, S.; Yu, Y.; You, J.; Zeng, R.; Gao, X.; Rui, L.; Li, W.; et al. Abrogation of hepatic ATP-citrate lyase protects against fatty liver and ameliorates hyperglycemia in leptin receptor-deficient mice. Hepatology 2009, 49, 1166–1175. [Google Scholar] [CrossRef] [PubMed] [Green Version]
- Paliwal, S.; Shi, J.; Dhru, U.; Zhou, Y.; Schuger, L. P311 binds to the latency associated protein and downregulates the expression of TGF-beta1 and TGF-beta2. BioChem Biophys Res. Commun. 2004, 315, 1104–1109. [Google Scholar] [CrossRef] [PubMed]
- Lent-Schochet, D.; McLaughlin, M.; Ramakrishnan, N.; Jialal, I. Exploratory metabolomics of metabolic syndrome: A status report. World J. Diabetes 2019, 10, 23–36. [Google Scholar] [CrossRef] [PubMed]
- Yamada, J.; Tomiyama, H.; Yambe, M.; Koji, Y.; Motobe, K.; Shiina, K.; Yamamoto, Y.; Yamashina, A. Elevated serum levels of alanine aminotransferase and gamma glutamyltransferase are markers of inflammation and oxidative stress independent of the metabolic syndrome. Atherosclerosis 2006, 189, 198–205. [Google Scholar] [CrossRef]
- Velasquez, M.T.; Ramezani, A.; Manal, A.; Raj, D.S. Trimethylamine N-Oxide: The Good, the Bad and the Unknown. Toxins 2016, 8, 326. [Google Scholar] [CrossRef] [Green Version]
- Tang, W.H.; Hazen, S.L. Microbiome, trimethylamine N-oxide, and cardiometabolic disease. Transl. Res. 2017, 179, 108–115. [Google Scholar] [CrossRef] [Green Version]
- Hart, L.M.; Vogelzangs, N.; Mook-Kanamori, D.O.; Brahimaj, A.; Nano, J.; van der Heijden, A.; Willems van Dijk, K.; Slieker, R.C.; Steyerberg, E.W.; Ikram, M.A.; et al. Blood Metabolomic Measures Associate With Present and Future Glycemic Control in Type 2 Diabetes. J. Clin. Endocrinol. Metab. 2018, 103, 4569–4579. [Google Scholar] [CrossRef] [PubMed]
- Adams, S.H. Emerging perspectives on essential amino acid metabolism in obesity and the insulin-resistant state. Adv. Nutr. 2011, 2, 445–456. [Google Scholar] [CrossRef] [PubMed] [Green Version]
- Chen, T.; Zheng, X.; Ma, X.; Bao, Y.; Ni, Y.; Hu, C.; Rajani, C.; Huang, F.; Zhao, A.; Jia, W.; et al. Tryptophan Predicts the Risk for Future Type 2 Diabetes. PLoS ONE 2016, 11, e0162192. [Google Scholar] [CrossRef] [PubMed] [Green Version]
- Oxenkrug, G.; van der Hart, M.; Summergrad, P. Elevated anthranilic acid plasma concentrations in type 1 but not type 2 diabetes mellitus. Integr. Mol. Med. 2015, 2, 365–368. [Google Scholar] [CrossRef] [PubMed] [Green Version]
- Feng, R.N.; Niu, Y.C.; Sun, X.W.; Li, Q.; Zhao, C.; Wang, C.; Guo, F.C.; Sun, C.H.; Li, Y. Histidine supplementation improves insulin resistance through suppressed inflammation in obese women with the metabolic syndrome: A randomised controlled trial. Diabetologia 2013, 56, 985–994. [Google Scholar] [CrossRef]
- Iida, M.; Harada, S.; Kurihara, A.; Fukai, K.; Kuwabara, K.; Sugiyama, D.; Takeuchi, A.; Okamura, T.; Akiyama, M.; Nishiwaki, Y.; et al. Profiling of plasma metabolites in postmenopausal women with metabolic syndrome. Menopause 2016, 23, 749–758. [Google Scholar] [CrossRef] [Green Version]
- Kennedy, A.J.; Ellacott, K.L.; King, V.L.; Hasty, A.H. Mouse models of the metabolic syndrome. Dis. Model. Mech. 2010, 3, 156–166. [Google Scholar] [CrossRef] [Green Version]
- Ingalls, A.M.; Dickie, M.M.; Shell, G. Obese, a new mutation in the house mouse. J. Hered. 1950, 41, 317–318. [Google Scholar] [CrossRef]
- Hummel, K.P.; Dickie, M.M.; Coleman, D.L. Diabetes, a new mutafton in the mouse. Science 1966, 153, 1127–1128. [Google Scholar] [CrossRef]
- Dickie, M.M. Mutations at the agouti locus in the mouse. J. Hered. 1969, 60, 20–25. [Google Scholar] [CrossRef]
- Huszar, D.; Lynch, C.A.; Fairchild-Huntress, V.; Dunmore, J.H.; Fang, Q.; Berkemeier, L.R.; Gu, W.; Kesterson, R.A.; Boston, B.A.; Cone, R.D.; et al. Targeted disruption of the melanocortin-4 receptor results in obesity in mice. Cell 1997, 88, 131–141. [Google Scholar] [CrossRef] [Green Version]
- Ishibashi, S.; Brown, M.S.; Goldstein, J.L.; Gerard, R.D.; Hammer, R.E.; Herz, J. Hypercholesterolemia in low density lipoprotein receptor knockout mice and its reversal by adenovirus-mediated gene delivery. J. Clin. Investig. 1993, 92, 883–893. [Google Scholar] [CrossRef] [Green Version]
- Hasty, A.H.; Shimano, H.; Osuga, J.-I.; Namatame, I.; Takahashi, A.; Yahagi, N.; Perrey, S.; Iizuka, Y.; Tamura, Y.; Amemiya-Kudo, M.; et al. Severe hypercholesterolemia, hypertriglyceridemia, and atherosclerosis in mice lacking both leptin and the low density lipoprotein receptor. J. Biol. Chem. 2001, 276, 37402–37408. [Google Scholar] [CrossRef] [Green Version]
- Plump, A.S.; Smith, J.D.; Hayek, T.; Aalto-Setälä, K.; Walsh, A.; Verstuyft, J.G.; Rubin, E.M.; Breslow, J.L. Severe hypercholesterolemia and atherosclerosis in apolipoprotein E-deficient mice created by homologous recombination in ES cells. Cell 1992, 71, 343–353. [Google Scholar]
- Gruen, M.L.; Plummer, M.R.; Zhang, W.; Posey, K.A.; Linton, M.; Fazio, S.; Hasty, A.H. Persistence of high density lipoprotein particles in obese mice lacking apolipoprotein AI. J. Lipid Res. 2005, 46, 2007–2014. [Google Scholar] [CrossRef] [Green Version]
- Coenen, K.R.; Hasty, A.H. Obesity potentiates development of fatty liver and insulin resistance, but not atherosclerosis, in high-fat diet-fed agouti LDLR-deficient mice. Am. J. Physiol.-Endocrinol. Metab. 2007, 293, E492–E499. [Google Scholar] [CrossRef] [PubMed] [Green Version]
- Chang, G.-R.; Chiu, Y.-S.; Wu, Y.-Y.; Chen, W.-Y.; Liao, J.-W.; Chao, T.-H.; Mao, F.C. Rapamycin protects against high fat diet–induced obesity in C57BL/6J mice. J. Pharmacol. Sci. 2009, 109, 496–503. [Google Scholar] [CrossRef] [PubMed]
- Aizawa-Abe, M.; Ogawa, Y.; Masuzaki, H.; Ebihara, K.; Satoh, N.; Iwai, H.; Matsuoka, N.; Hayashi, T.; Hosoda, K.; Inoue, G.; et al. Pathophysiological role of leptin in obesity-related hypertension. J. Clin. Investig. 2000, 105, 1243–1252. [Google Scholar] [CrossRef] [PubMed] [Green Version]
- Lloyd, D.J.; McCormick, J.; Helmering, J.; Kim, K.W.; Wang, M.; Fordstrom, P.; Kaufman, S.A.; Lindberg, R.A.; Véniant, M.M. Generation and characterization of two novel mouse models exhibiting the phenotypes of the metabolic syndrome: Apob48−/− Lepob/ob mice devoid of ApoE or Ldlr. Am. J. Physiol.-Endocrinol. Metab. 2008, 294, E496–E505. [Google Scholar] [CrossRef] [Green Version]
- King, V.L.; Hatch, N.W.; Chan, H.W.; De Beer, M.C.; De Beer, F.C.; Tannock, L.R. A murine model of obesity with accelerated atherosclerosis. Obesity 2010, 18, 35–41. [Google Scholar] [CrossRef] [PubMed] [Green Version]
- Ryan, M.J.; McLemore, G.R., Jr.; Hendrix, S.T. Insulin resistance and obesity in a mouse model of systemic lupus erythematosus. Hypertension 2006, 48, 988–993. [Google Scholar] [CrossRef] [Green Version]
- Kastorini, C.M.; Milionis, H.J.; Esposito, K.; Giugliano, D.; Goudevenos, J.A.; Panagiotakos, D.B. The effect of Mediterranean diet on metabolic syndrome and its components: A meta-analysis of 50 studies and 534,906 individuals. J. Am. Coll. Cardiol. 2011, 57, 1299–1313. [Google Scholar] [CrossRef] [Green Version]
- Esposito, K.; Kastorini, C.M.; Panagiotakos, D.B.; Giugliano, D. Mediterranean diet and metabolic syndrome: An updated systematic review. Rev. Endocr. Metab. Disord. 2013, 14, 255–263. [Google Scholar] [CrossRef] [PubMed]
- Esposito, K.; Ciotola, M.; Giugliano, D. Mediterranean diet and the metabolic syndrome. Mol. Nutr. Food Res. 2007, 51, 1268–1274. [Google Scholar] [CrossRef]
- Dai, J.; Jones, D.P.; Goldberg, J.; Ziegler, T.R.; Bostick, R.M.; Wilson, P.W.; Manatunga, A.K.; Shallenberger, L.; Jones, L.; Vaccarino, V. Association between adherence to the Mediterranean diet and oxidative stress. Am. J. Clin. Nutr. 2008, 88, 1364–1370. [Google Scholar] [PubMed]
- Pitsavos, C.; Panagiotakos, D.B.; Tzima, N.; Chrysohoou, C.; Economou, M.; Zampelas, A.; Stefanadis, C. Adherence to the Mediterranean diet is associated with total antioxidant capacity in healthy adults: The ATTICA study. Am. J. Clin. Nutr. 2005, 82, 694–699. [Google Scholar] [CrossRef]
- Giugliano, D.; Esposito, K. Mediterranean diet and metabolic diseases. Curr. Opin. Lipidol. 2008, 19, 63–68. [Google Scholar] [CrossRef]
- Salas-Salvadó, J.; Guasch-Ferré, M.; Lee, C.-H.; Estruch, R.; Clish, C.B.; Ros, E. Protective effects of the Mediterranean diet on type 2 diabetes and metabolic syndrome. J. Nutr. 2015, 146, 920S–927S. [Google Scholar] [CrossRef] [Green Version]
- Rochlani, Y.; Pothineni, N.V.; Kovelamudi, S.; Mehta, J.L. Metabolic syndrome: Pathophysiology, management, and modulation by natural compounds. Adv. Cardiovasc. Dis. 2017, 11, 215–225. [Google Scholar] [CrossRef]
- Aggarwal, B.B. Targeting inflammation-induced obesity and metabolic diseases by curcumin and other nutraceuticals. Annu. Rev. Nutr. 2010, 30, 173–199. [Google Scholar] [CrossRef] [PubMed] [Green Version]
- Xu, J.; Fu, Y.; Chen, A. Activation of peroxisome proliferator-activated receptor-gamma contributes to the inhibitory effects of curcumin on rat hepatic stellate cell growth. Am. J. Physiol. Gastrointest. Liver Physiol. 2003, 285, G20–G30. [Google Scholar] [CrossRef] [PubMed] [Green Version]
- Reinhart, K.M.; Talati, R.; White, C.M.; Coleman, C.I. The impact of garlic on lipid parameters: A systematic review and meta-analysis. Nutr. Res. Rev. 2009, 22, 39–48. [Google Scholar] [CrossRef] [Green Version]
- Yang, J.; Yin, J.; Gao, H.; Xu, L.; Wang, Y.; Xu, L.; Li, M. Berberine improves insulin sensitivity by inhibiting fat store and adjusting adipokines profile in human preadipocytes and metabolic syndrome patients. Evid. Based Complement Altern. Med. 2012, 2012, 363845. [Google Scholar] [CrossRef] [Green Version]
- Pérez-Rubio, K.G.; González-Ortiz, M.; Martínez-Abundis, E.; Robles-Cervantes, J.A.; Espinel-Bermúdez, M.C. Effect of berberine administration on metabolic syndrome, insulin sensitivity, and insulin secretion. Metab. Syndr. Relat. Disord. 2013, 11, 366–369. [Google Scholar] [CrossRef]
- Bhat, M.; Kothiwale, S.K.; Tirmale, A.R.; Bhargava, S.Y.; Joshi, B.N. Antidiabetic Properties of Azardiracta indica and Bougainvillea spectabilis: In Vivo Studies in Murine Diabetes Model. Evid. Based Complement Altern. Med. 2011, 2011, 561625. [Google Scholar] [CrossRef] [Green Version]
- Mollace, V.; Ragusa, S.; Sacco, I.; Muscoli, C.; Sculco, F.; Visalli, V.; Palma, E.; Muscoli, S.; Mondello, L.; Dugo, P.; et al. The protective effect of bergamot oil extract on lecitine-like oxyLDL receptor-1 expression in balloon injury-related neointima formation. J. Cardiovasc. Pharm. 2008, 13, 120–129. [Google Scholar] [CrossRef] [PubMed]
- Bremer, A.A. Resveratrol use in metabolic syndrome. Metab. Syndr. Relat. Disord. 2014, 12, 493–495. [Google Scholar] [CrossRef] [Green Version]
- Méndez-del Villar, M.; González-Ortiz, M.; Martínez-Abundis, E.; Pérez-Rubio, K.G.; Lizárraga-Valdez, R. Effect of resveratrol administration on metabolic syndrome, insulin sensitivity, and insulin secretion. Metab. Syndr. Relat. Disord. 2014, 12, 497–501. [Google Scholar] [CrossRef] [PubMed]
- Rivera, L.; Morón, R.; Sánchez, M.; Zarzuelo, A.; Galisteo, M. Quercetin ameliorates metabolic syndrome and improves the inflammatory status in obese Zucker rats. Obesity (Silver Spring) 2008, 16, 2081–2087. [Google Scholar] [CrossRef]
- Gillies, P.J.; Bhatia, S.K.; Belcher, L.A.; Hannon, D.B.; Thompson, J.T.; Vanden Heuvel, J.P. Regulation of inflammatory and lipid metabolism genes by eicosapentaenoic acid-rich oil. J. Lipid Res. 2012, 53, 1679–1689. [Google Scholar] [CrossRef] [Green Version]
- Wu, L.; Juurlink, B.H. The impaired glutathione system and its up-regulation by sulforaphane in vascular smooth muscle cells from spontaneously hypertensive rats. J. Hypertens. 2001, 19, 1819–1825. [Google Scholar] [CrossRef]
- Castellino, G.; Nikolic, D.; Magán-Fernández, A.; Malfa, G.A.; Chianetta, R.; Patti, A.M.; Amato, A.; Montalto, G.; Toth, P.P.; Banach, M.; et al. Altilix® Supplement Containing Chlorogenic Acid and Luteolin Improved Hepatic and Cardiometabolic Parameters in Subjects with Metabolic Syndrome: A 6 Month Randomized, Double-Blind, Placebo-Controlled Study. Nutrients 2019, 11, 2580. [Google Scholar] [CrossRef] [Green Version]
- Fogacci, F.; Banach, M.; Mikhailidis, D.P.; Bruckert, E.; Toth, P.P.; Watts, G.F.; Reiner, Ž.; Mancini, J.; Rizzo, M.; Mitchenko, O.; et al. Safety of red yeast rice supplementation: A systematic review and meta-analysis of randomized controlled trials. Pharm. Res. 2019, 143, 1–16. [Google Scholar] [CrossRef] [PubMed]
- Roy, C.C.; Kien, C.L.; Bouthillier, L.; Levy, E. Short-chain fatty acids: Ready for prime time? Nutr. Clin. Pract. 2006, 21, 351–366. [Google Scholar] [CrossRef]
- Zhang, X.; Shen, D.; Fang, Z.; Jie, Z.; Qiu, X.; Zhang, C.; Chen, Y.; Ji, L. Human gut microbiota changes reveal the progression of glucose intolerance. PLoS ONE 2013, 8, e71108. [Google Scholar]
- Vrieze, A.; Van Nood, E.; Holleman, F.; Salojärvi, J.; Kootte, R.S.; Bartelsman, J.F.; Dallinga–Thie, G.M.; Ackermans, M.T.; Serlie, M.J.; Oozeer, R.; et al. Transfer of intestinal microbiota from lean donors increases insulin sensitivity in individuals with metabolic syndrome. Gastroenterology 2012, 143, 913–916.e7. [Google Scholar] [CrossRef] [PubMed]
- Canani, R.B.; Di Costanzo, M.; Leone, L.; Pedata, M.; Meli, R.; Calignano, A. Potential beneficial effects of butyrate in intestinal and extraintestinal diseases. World J. Gastroenterol. WJG 2011, 17, 1519. [Google Scholar] [CrossRef]
- Gao, Q.; Zhang, L. Ultraviolet-B-induced oxidative stress and antioxidant defense system responses in ascorbate-deficient vtc1 mutants of Arabidopsis. J. Plant Physiol. 2008, 165, 138–148. [Google Scholar] [CrossRef] [PubMed]
- Hara, T.; Kimura, I.; Inoue, D.; Ichimura, A.; Hirasawa, A. Free fatty acid receptors and their role in regulation of energy metabolism. Rev. Physiol. Biochem. Pharmacol. 2013, 164, 77–116. [Google Scholar]
- Gao, Z.; Yin, J.; Zhang, J.; Ward, R.E.; Martin, R.J.; Lefevre, M.; Cefalu, W.T.; Ye, J. Butyrate improves insulin sensitivity and increases energy expenditure in mice. Diabetes 2009, 58, 1509–1517. [Google Scholar] [CrossRef] [PubMed] [Green Version]
- Steinert, R.E.; Feinle-Bisset, C.; Asarian, L.; Horowitz, M.; Beglinger, C.; Geary, N. Ghrelin, CCK, GLP-1, and PYY (3–36): Secretory controls and physiological roles in eating and glycemia in health, obesity, and after RYGB. Physiol. Rev. 2017, 97, 411–463. [Google Scholar] [CrossRef] [Green Version]
- Matheus, V.; Monteiro, L.; Oliveira, R.; Maschio, D.; Collares-Buzato, C. Butyrate reduces high-fat diet-induced metabolic alterations, hepatic steatosis and pancreatic beta cell and intestinal barrier dysfunctions in prediabetic mice. Exp. Biol. Med. 2017, 242, 1214–1226. [Google Scholar] [CrossRef] [PubMed] [Green Version]
- Keenan, M.J.; Zhou, J.; McCutcheon, K.L.; Raggio, A.M.; Bateman, H.G.; Todd, E.; Jones, C.K.; Tulley, R.T.; Melton, S.; Martin, R.J. Effects of resistant starch, a non-digestible fermentable fiber, on reducing body fat. Obesity 2006, 14, 1523–1534. [Google Scholar] [CrossRef]
- Yan, H.; Ajuwon, K.M. Mechanism of butyrate stimulation of triglyceride storage and adipokine expression during adipogenic differentiation of porcine stromovascular cells. PLoS ONE 2015, 10, e0145940. [Google Scholar]
- Hafidi, M.E.; Buelna-Chontal, M.; Sánchez-Muñoz, F.; Carbó, R. Adipogenesis: A necessary but harmful strategy. Int. J. Mol. Sci. 2019, 20, 3657. [Google Scholar] [CrossRef] [Green Version]
- Marcil, V.; Delvin, E.; Garofalo, C.; Levy, E. Butyrate impairs lipid transport by inhibiting microsomal triglyceride transfer protein in Caco-2 cells. J. Nutr. 2003, 133, 2180–2183. [Google Scholar] [CrossRef] [PubMed] [Green Version]
- Chen, Y.; Xu, C.; Huang, R.; Song, J.; Li, D.; Xia, M. Butyrate from pectin fermentation inhibits intestinal cholesterol absorption and attenuates atherosclerosis in apolipoprotein E-deficient mice. J. Nutr. Biochem. 2018, 56, 175–182. [Google Scholar] [CrossRef]
- Khan, S.; Jena, G. Sodium butyrate reduces insulin-resistance, fat accumulation and dyslipidemia in type-2 diabetic rat: A comparative study with metformin. Chem. Biol. Interact. 2016, 254, 124–134. [Google Scholar] [CrossRef]
- Chriett, S.; Zerzaihi, O.; Vidal, H.; Pirola, L. The histone deacetylase inhibitor sodium butyrate improves insulin signalling in palmitate-induced insulin resistance in L6 rat muscle cells through epigenetically-mediated up-regulation of Irs1. Mol. Cell. Endocrinol. 2017, 439, 224–232. [Google Scholar] [CrossRef]
- Khan, S.; Jena, G. Protective role of sodium butyrate, a HDAC inhibitor on beta-cell proliferation, function and glucose homeostasis through modulation of p38/ERK MAPK and apoptotic pathways: Study in juvenile diabetic rat. Chem. Biol. Interact. 2014, 213, 1–12. [Google Scholar] [CrossRef]
- Roshanravan, N.; Mahdavi, R.; Alizadeh, E.; Jafarabadi, M.A.; Hedayati, M.; Ghavami, A.; Alipour, S.; Alamdari, N.M.; Barati, M.; Ostadrahimi, A. Effect of butyrate and inulin supplementation on glycemic status, lipid profile and glucagon-like peptide 1 level in patients with type 2 diabetes: A randomized double-blind, placebo-controlled trial. Horm. Metab. Res. 2017, 49, 886–891. [Google Scholar] [CrossRef] [PubMed]
- Cook, S.; Sellin, J. Short chain fatty acids in health and disease. Aliment. Pharmacol. Ther. 1998, 12, 499–507. [Google Scholar] [CrossRef] [PubMed]
- Rephaeli, A.; Rabizadeh, E.; Aviram, A.; Shaklai, M.; Ruse, M.; Nudelman, A. Derivatives of butyric acid as potential anti-neoplastic agents. Int. J. Cancer 1991, 49, 66–72. [Google Scholar] [CrossRef]
- Patnaik, A.; Rowinsky, E.K.; Villalona, M.A.; Hammond, L.A.; Britten, C.D.; Siu, L.L.; Goetz, A.; Felton, S.A.; Burton, S.; Valone, F.H.; et al. A phase I study of pivaloyloxymethyl butyrate, a prodrug of the differentiating agent butyric acid, in patients with advanced solid malignancies. Clin. Cancer Res. 2002, 8, 2142–2148. [Google Scholar] [PubMed]
- Kim, S.W.; Hooker, J.M.; Otto, N.; Win, K.; Muench, L.; Shea, C.; Carter, P.; King, P.; Reid, A.E.; Volkow, N.D.; et al. Whole-body pharmacokinetics of HDAC inhibitor drugs, butyric acid, valproic acid and 4-phenylbutyric acid measured with carbon-11 labeled analogs by PET. Nucl. Med. Biol. 2013, 40, 912–918. [Google Scholar] [CrossRef] [Green Version]
- Krokowicz, L.; Stojcev, Z.; Kaczmarek, B.F.; Kociemba, W.; Kaczmarek, E.; Walkowiak, J.; Krokowicz, P.; Drews, M.; Banasiewicz, T. Microencapsulated sodium butyrate administered to patients with diverticulosis decreases incidence of diverticulitis—a prospective randomized study. Int. J. Color. Dis. 2014, 29, 387–393. [Google Scholar] [CrossRef] [PubMed] [Green Version]
- Sabatino, A.D.; Morera, R.; Ciccocioppo, R.; Cazzola, P.; Gotti, S.; Tinozzi, F.; Tinozzi, S.; Corazza, G. Oral butyrate for mildly to moderately active Crohn’s disease. Aliment. Pharmacol. Ther. 2005, 22, 789–794. [Google Scholar] [CrossRef]
- Vernia, P.; Monteleone, G.; Grandinetti, G.; Villotti, G.; Di Giulio, E.; Frieri, G.; Marcheggiano, A.; Pallone, F.; Caprilli, R.; Torsoli, A. Combined oral sodium butyrate and mesalazine treatment compared to oral mesalazine alone in ulcerative colitis. Dig. Dis. Sci. 2000, 45, 976–981. [Google Scholar] [CrossRef] [PubMed]
- Krokowicz, L.; Kaczmarek, B.F.; Krokowicz, P.; Stojcev, Z.; Mackiewicz, J.; Walkowiak, J.; Drews, M.; Banasiewicz, T. Sodium butyrate and short chain fatty acids in prevention of travellers’ diarrhoea: A randomized prospective study. Travel Med. Infect. Dis. 2014, 12, 183–188. [Google Scholar] [CrossRef]
- Bouter, K.; Bakker, G.; Levin, E.; Hartstra, A.; Kootte, R.; Udayappan, S.; Katiraei, S.; Bahler, L.; Gilijamse, P.; Tremaroli, V.; et al. Differential metabolic effects of oral butyrate treatment in lean versus metabolic syndrome subjects. Clin. Transl. Gastroenterol. 2018, 9, e155. [Google Scholar] [CrossRef] [PubMed]
- Bäckhed, F.; Ding, H.; Wang, T.; Hooper, L.V.; Koh, G.Y.; Nagy, A.; Semenkovich, C.F.; Gordon, J.I. The gut microbiota as an environmental factor that regulates fat storage. Proc. Natl. Acad. Sci. USA 2004, 101, 15718–15723. [Google Scholar] [CrossRef] [PubMed] [Green Version]
- Le Chatelier, E.; Nielsen, T.; Qin, J.; Prifti, E.; Hildebrand, F.; Falony, G.; Almeida, M.; Arumugam, M.; Batto, J.-M.; Kennedy, S.; et al. Richness of human gut microbiome correlates with metabolic markers. Nature 2013, 500, 541–546. [Google Scholar] [CrossRef] [PubMed]
- Cani, P.D.; Bibiloni, R.; Knauf, C.; Waget, A.; Neyrinck, A.M.; Delzenne, N.M.; Burcelin, R. Changes in gut microbiota control metabolic endotoxemia-induced inflammation in high-fat diet–induced obesity and diabetes in mice. Diabetes 2008, 57, 1470–1481. [Google Scholar] [CrossRef] [PubMed] [Green Version]
- Turnbaugh, P.J.; Hamady, M.; Yatsunenko, T.; Cantarel, B.L.; Duncan, A.; Ley, R.E.; Sogin, M.L.; Jones, W.J.; Roe, B.A.; Affourtit, J.P.; et al. A core gut microbiome in obese and lean twins. Nature 2009, 457, 480–484. [Google Scholar] [CrossRef] [Green Version]
- Barreto, F.M.; Simão, A.N.C.; Morimoto, H.K.; Lozovoy, M.A.B.; Dichi, I.; da Silva Miglioranza, L.H. Beneficial effects of Lactobacillus plantarum on glycemia and homocysteine levels in postmenopausal women with metabolic syndrome. Nutrition 2014, 30, 939–942. [Google Scholar] [CrossRef] [PubMed]
- Stadlbauer, V.; Leber, B.; Lemesch, S.; Trajanoski, S.; Bashir, M.; Horvath, A.; Tawdrous, M.; Stojakovic, T.; Fauler, G.; Fickert, P.; et al. Lactobacillus casei Shirota supplementation does not restore gut microbiota composition and gut barrier in metabolic syndrome: A randomized pilot study. PLoS ONE 2015, 10, e0141399. [Google Scholar] [CrossRef] [PubMed] [Green Version]
- Tripolt, N.; Leber, B.; Blattl, D.; Eder, M.; Wonisch, W.; Scharnagl, H.; Stojakovic, T.; Obermayer-Pietsch, B.; Wascher, T.; Pieber, T. Effect of supplementation with Lactobacillus casei Shirota on insulin sensitivity, β-cell function, and markers of endothelial function and inflammation in subjects with metabolic syndrome—A pilot study. J. Dairy Sci. 2013, 96, 89–95. [Google Scholar] [CrossRef] [PubMed]
- Szulińska, M.; Łoniewski, I.; Skrypnik, K.; Sobieska, M.; Korybalska, K.; Suliburska, J.; Bogdański, P. Multispecies probiotic supplementation favorably affects vascular function and reduces arterial stiffness in obese postmenopausal women—A 12-week placebo-controlled and randomized clinical study. Nutrients 2018, 10, 1672. [Google Scholar] [CrossRef] [PubMed] [Green Version]
- Tenorio-Jiménez, C.; Martínez-Ramírez, M.J.; Gil, Á. and Gómez-Llorente, C. Effects of Probiotics on Metabolic Syndrome: A Systematic Review of Randomized Clinical Trials. Nutrients 2020, 12, 124. [Google Scholar] [CrossRef] [PubMed] [Green Version]
- Wallace, C.J.; Milev, R.V. The efficacy, safety, and tolerability of probiotics on depression: Clinical results from an open-label pilot study. Front. Psychiatry 2021, 12, 132. [Google Scholar] [CrossRef]
- Szulińska, M.; Łoniewski, I.; Van Hemert, S.; Sobieska, M.; Bogdański, P. Dose-dependent effects of multispecies probiotic supplementation on the lipopolysaccharide (LPS) level and cardiometabolic profile in obese postmenopausal women: A 12-week randomized clinical trial. Nutrients 2018, 10, 773. [Google Scholar] [CrossRef] [Green Version]
- Sahhaf Ebrahimi, F.; Homayouni Rad, A.; Mosen, M.; Abbasalizadeh, F.; Tabrizi, A.; Khalili, L. Effect of L. acidophilus and B. lactis on blood glucose in women with gestational diabetes mellitus: A randomized placebo-controlled trial. Diabetol. Metab. Syndr. 2019, 11, 75–77. [Google Scholar] [CrossRef]
- Tenorio-Jimenez, C.; Martinez-Ramirez, M.J.; Del Castillo-Codes, I.; Arraiza-Irigoyen, C.; Tercero-Lozano, M.; Camacho, J.; Chueca, N.; Garcia, F.; Olza, J.; Plaza-Diaz, J.; et al. Lactobacillus reuteri V3401 Reduces Inflammatory Biomarkers and Modifies the Gastrointestinal Microbiome in Adults with Metabolic Syndrome: The PROSIR Study. Nutrients 2019, 11, 1761. [Google Scholar] [CrossRef] [PubMed] [Green Version]
- Clifton, P. Metabolic syndrome—role of dietary fat type and quantity. Nutrients 2019, 11, 1438. [Google Scholar] [CrossRef] [PubMed] [Green Version]
- Kang, Y.J.; Hwang, K.M.; Cheon, S.Y.; Lee, H.J.; Yoon, H.S. Associations of obesity and dyslipidemia with intake of sodium, fat, and sugar among Koreans: A qualitative systematic review. Clin. Nutr. Res. 2016, 5, 290–304. [Google Scholar] [CrossRef] [PubMed]
- Hoyas, I.; Leon-Sanz, M. Nutritional challenges in metabolic syndrome. J. Clin. Med. 2019, 8, 1301. [Google Scholar] [CrossRef] [PubMed] [Green Version]
- Sacks, F.M.; Lichtenstein, A.H.; Wu, J.H.; Appel, L.J.; Creager, M.A.; Kris-Etherton, P.M.; Miller, M.; Rimm, E.B.; Rudel, L.L.; Robinson, J.G.; et al. Dietary fats and cardiovascular disease: A presidential advisory from the American Heart Association. Circulation 2017, 136, e1–e23. [Google Scholar] [CrossRef] [PubMed]
- Unger, A.L.; Torres-Gonzalez, M.; Kraft, J. Dairy fat consumption and the risk of metabolic syndrome: An examination of the saturated fatty acids in dairy. Nutrients 2019, 11, 2200. [Google Scholar] [CrossRef] [PubMed] [Green Version]
- Babu, A.S.; Veluswamy, S.K.; Arena, R.; Guazzi, M.; Lavie, C.J. Virgin coconut oil and its potential cardioprotective effects. Postgrad. Med. 2014, 126, 76–83. [Google Scholar] [CrossRef] [PubMed]
- Boateng, L.; Ansong, R.; Owusu, W.; Steiner-Asiedu, M. Coconut oil and palm oil’s role in nutrition, health and national development: A review. Ghana Med. J. 2016, 50, 189–196. [Google Scholar] [CrossRef] [PubMed]
- Eyres, L.; Eyres, M.F.; Chisholm, A.; Brown, R.C. Coconut oil consumption and cardiovascular risk factors in humans. Nutr. Rev. 2016, 74, 267–280. [Google Scholar] [CrossRef] [PubMed] [Green Version]
- Sibal, L.; Agarwal, S.; Home, P.; Boger, R. The role of asymmetric dimethylarginine (ADMA) in endothelial dysfunction and cardiovascular disease. Curr. Cardiol. Rev. 2010, 6, 82–90. [Google Scholar] [CrossRef] [PubMed]
- Palomo, I.; Contreras, A.; Alarcón, L.M.; Leiva, E.; Guzmán, L.; Mujica, V.; Icaza, G.; Díaz, N.; González, D.R.; Moore-Carrasco, R. Elevated concentration of asymmetric dimethylarginine (ADMA) in individuals with metabolic syndrome. Nitric. Oxide 2011, 24, 224–228. [Google Scholar] [CrossRef]
- Engeli, S.; Tsikas, D.; Lehmann, A.; Böhnke, J.; Haas, V.; Strauß, A.; Janke, J.; Gorzelniak, K.; Luft, F.; Jordan, J. Influence of dietary fat ingestion on asymmetrical dimethylarginine in lean and obese human subjects. Nutr. Metab. Cardiovasc. Dis. 2012, 22, 720–726. [Google Scholar] [CrossRef] [PubMed]
- Nikooei, P.; Hosseinzadeh-Attar, M.J.; Asghari, S.; Norouzy, A.; Yaseri, M.; Vasheghani-Farahani, A. Effects of virgin coconut oil consumption on metabolic syndrome components and asymmetric dimethylarginine: A randomized controlled clinical trial. Nutr. Metab. Cardiovasc. Dis. 2021, 31, 939–949. [Google Scholar] [CrossRef] [PubMed]
- Chattopadhyay, I.; Biswas, K.; Bandyopadhyay, U.; Banerjee, R.K. Turmeric and curcumin: Biological actions and medicinal applications. Curr. Sci. 2004, 44–53. [Google Scholar]
- Hasanzadeh, S.; Read, M.I.; Bland, A.R.; Majeed, M.; Jamialahmadi, T.; Sahebkar, A. Curcumin: An inflammasome silencer. Pharmacol. Res. 2020, 159, 104921. [Google Scholar] [CrossRef] [PubMed]
- Alidadi, M.; Sahebkar, A.; Eslami, S.; Vakilian, F.; Jarahi, L.; Alinezhad-Namaghi, M.; Arabi, S.M.; Vakili, S.; Tohidinezhad, F.; Nikooiyan, Y.; et al. The Effect of Curcumin Supplementation on Pulse Wave Velocity in Patients with Metabolic Syndrome: A Randomized, Double-Blind, Placebo-Controlled Trial. Adv. Exp. Med. Biol. 2021, 1308, 1–11. [Google Scholar] [CrossRef] [PubMed]
- Panahi, Y.; Ahmadi, Y.; Teymouri, M.; Johnston, T.P.; Sahebkar, A. Curcumin as a potential candidate for treating hyperlipidemia: A review of cellular and metabolic mechanisms. J. Cell Physiol. 2018, 233, 141–152. [Google Scholar] [CrossRef] [PubMed]
- Ejaz, A.; Wu, D.; Kwan, P.; Meydani, M. Curcumin inhibits adipogenesis in 3T3-L1 adipocytes and angiogenesis and obesity in C57/BL mice. J. Nutr. 2009, 139, 919–925. [Google Scholar] [CrossRef]
- Giglio, R.V.; Patti, A.M.; Cicero, A.; Lippi, G.; Rizzo, M.; Toth, P.P.; Banach, M. Polyphenols: Potential Use in the Prevention and Treatment of Cardiovascular Diseases. Curr Pharm Des. 2018, 24, 239–258. [Google Scholar] [CrossRef]
- Fleenor, B.S.; Sindler, A.L.; Marvi, N.K.; Howell, K.L.; Zigler, M.L.; Yoshizawa, M.; Seals, D.R. Curcumin ameliorates arterial dysfunction and oxidative stress with aging. Exp. Gerontol. 2013, 48, 269–276. [Google Scholar] [CrossRef] [PubMed] [Green Version]
- Velarde, G.P.; Choudhary, N.; Bravo-Jaimes, K.; Smotherman, C.; Sherazi, S.; Kraemer, D.F. Effect of atorvastatin on lipogenic, inflammatory and thrombogenic markers in women with the metabolic syndrome. Nutr. Metab. Cardiovasc. Dis. 2021, 31, 634–640. [Google Scholar] [CrossRef] [PubMed]
- Ridker, P.M.; Rifai, N.; Pfeffer, M.A.; Sacks, F.M.; Moye, L.A.; Goldman, S.; Flaker, G.C.; Braunwald, E. Inflammation, pravastatin, and the risk of coronary events after myocardial infarction in patients with average cholesterol levels. Circulation 1998, 98, 839–844. [Google Scholar] [CrossRef] [PubMed]
- Ridker, P.M.; Cannon, C.P.; Morrow, D.; Rifai, N.; Rose, L.M.; McCabe, C.H.; Pfeffer, M.A.; Braunwald, E. C-reactive protein levels and outcomes after statin therapy. N. Engl. J. Med. 2005, 352, 20–28. [Google Scholar] [CrossRef]
- Grosso, A.F.; de Oliveira, S.F.; Higuchi Mde, L.; Favarato, D.; Dallan, L.A.; da Luz, P.L. Synergistic anti-inflammatory effect: Simvastatin and pioglitazone reduce inflammatory markers of plasma and epicardial adipose tissue of coronary patients with metabolic syndrome. Diabetol. Metab. Syndr. 2014, 6, 47. [Google Scholar] [CrossRef] [Green Version]
- Shah, Z.; Pineda, C.; Kampfrath, T.; Maiseyeu, A.; Ying, Z.; Racoma, I.; Deiuliis, J.; Xu, X.; Sun, Q.; Moffatt-Bruce, S.; et al. Acute DPP-4 inhibition modulates vascular tone through GLP-1 independent pathways. Vascul. Pharmacol. 2011, 55, 2–9. [Google Scholar] [CrossRef] [Green Version]
- Ishii, M.; Shibata, R.; Kondo, K.; Kambara, T.; Shimizu, Y.; Tanigawa, T.; Bando, Y.K.; Nishimura, M.; Ouchi, N.; Murohara, T. Vildagliptin stimulates endothelial cell network formation and ischemia-induced revascularization via an endothelial nitric-oxide synthase-dependent mechanism. J. Biol. Chem. 2014, 289, 27235–27245. [Google Scholar] [CrossRef] [Green Version]
- Lamers, D.; Famulla, S.; Wronkowitz, N.; Hartwig, S.; Lehr, S.; Ouwens, D.M.; Eckardt, K.; Kaufman, J.M.; Ryden, M.; Müller, S.; et al. Dipeptidyl peptidase 4 is a novel adipokine potentially linking obesity to the metabolic syndrome. Diabetes 2011, 60, 1917–1925. [Google Scholar] [CrossRef] [Green Version]
- Sell, H.; Blüher, M.; Klöting, N.; Schlich, R.; Willems, M.; Ruppe, F.; Knoefel, W.T.; Dietrich, A.; Fielding, B.A.; Arner, P.; et al. Adipose dipeptidyl peptidase-4 and obesity: Correlation with insulin resistance and depot-specific release from adipose tissue in vivo and in vitro. Diabetes Care 2013, 36, 4083–4090. [Google Scholar] [CrossRef] [Green Version]
- Prakash, S.; Rai, U.; Kosuru, R.; Tiwari, V.; Singh, S. Amelioration of diet-induced metabolic syndrome and fatty liver with sitagliptin via regulation of adipose tissue inflammation and hepatic Adiponectin/AMPK levels in mice. Biochimie 2020, 168, 198–209. [Google Scholar] [CrossRef]
- Cicek, F.A.; Tokcaer-Keskin, Z.; Ozcinar, E.; Bozkus, Y.; Akcali, K.C.; Turan, B. Di-peptidyl peptidase-4 inhibitor sitagliptin protects vascular function in metabolic syndrome: Possible role of epigenetic regulation. Mol. Biol. Rep. 2014, 41, 4853–4863. [Google Scholar] [CrossRef] [Green Version]
- Rizzo, M.; Nikolic, D.; Patti, A.M.; Mannina, C.; Montalto, G.; McAdams, B.S.; Rizvi, A.A.; Cosentino, F. GLP-1 receptor agonists and reduction of cardiometabolic risk: Potential underlying mechanisms. Biochim. Biophys Acta Mol. Basis Dis. 2018, 1864, 2814–2821. [Google Scholar] [CrossRef] [PubMed]
- Nauck, M.A.; Quast, D.R.; Wefers, J.; Meier, J.J. GLP-1 receptor agonists in the treatment of type 2 diabetes—State-of-the-art. Mol Metab. 2021, 46, 101102. [Google Scholar] [CrossRef]
- Orchard, T.J.; Temprosa, M.; Goldberg, R.; Haffner, S.; Ratner, R.; Marcovina, S.; Fowler, S.; Diabetes Prevention Program Research Group. The effect of metformin and intensive lifestyle intervention on the metabolic syndrome: The Diabetes Prevention Program randomized trial. Ann. Intern. Med. 2005, 142, 611–619. [Google Scholar] [CrossRef] [PubMed]
- Rizvi, A.A.; Stoian, A.P.; Rizzo, M. Metabolic Syndrome: From Molecular Mechanisms to Novel Therapies. Int. J. Mol. Sci. 2021, 22, 10038. [Google Scholar] [CrossRef] [PubMed]


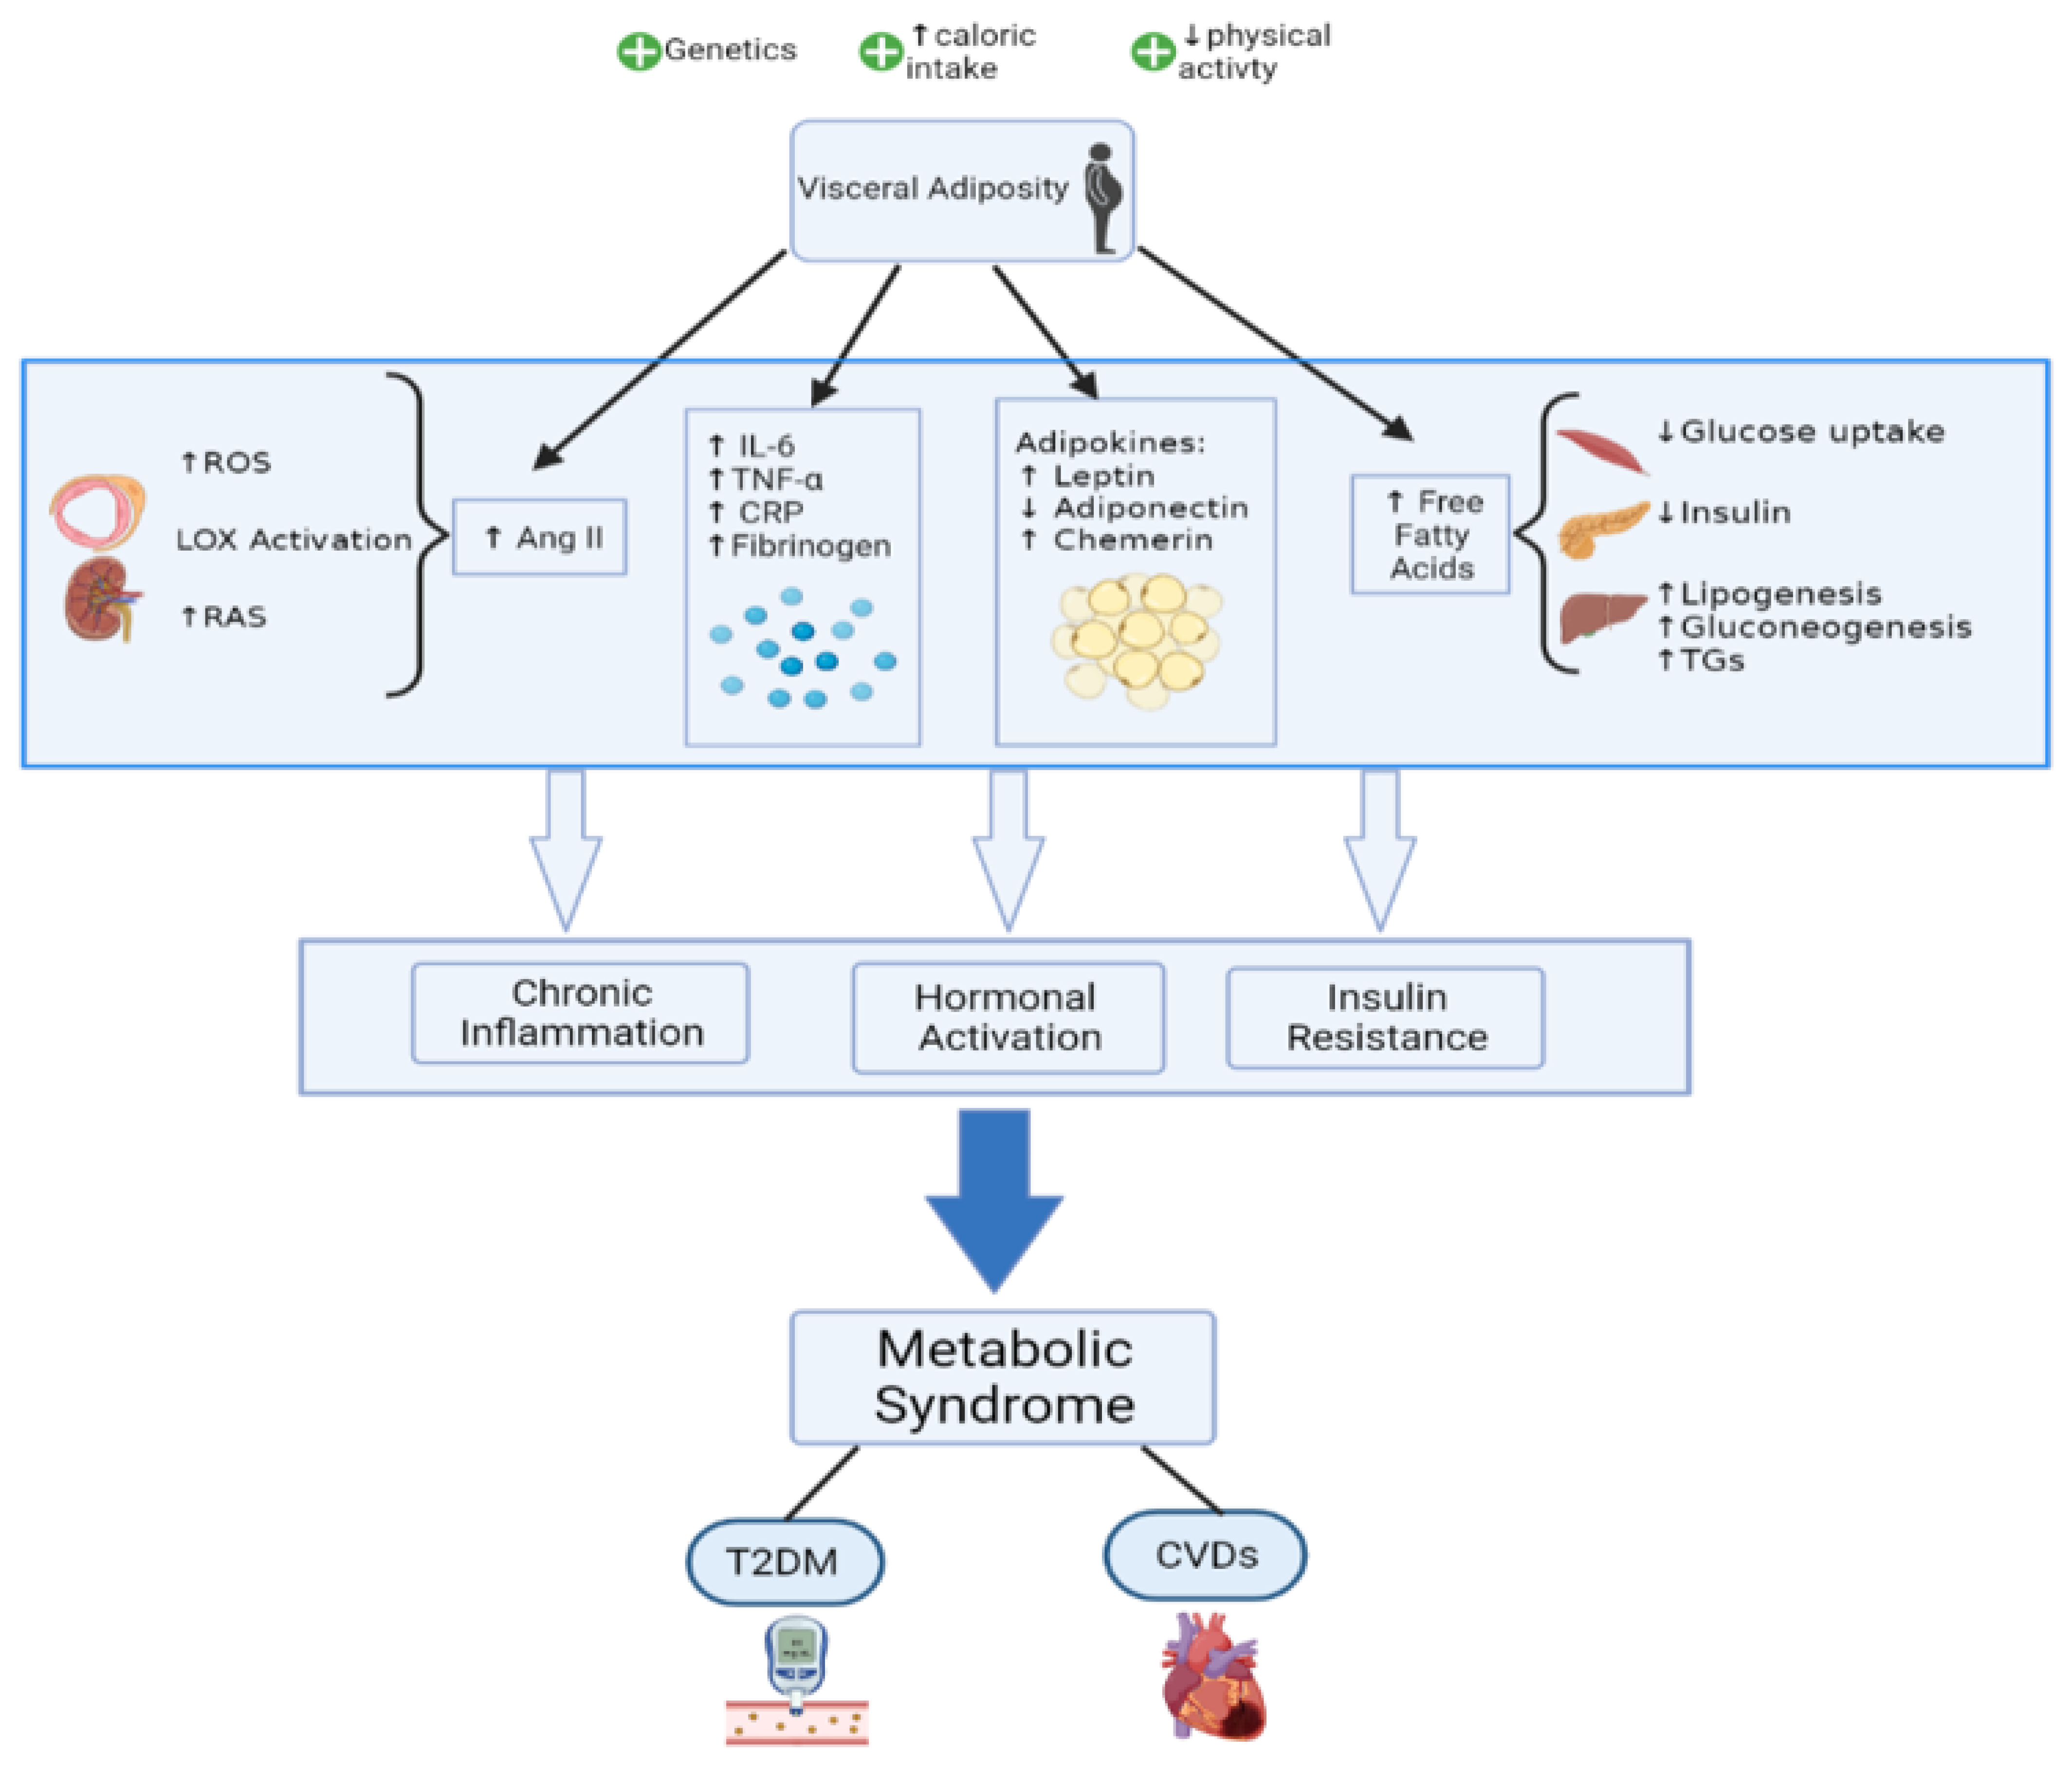
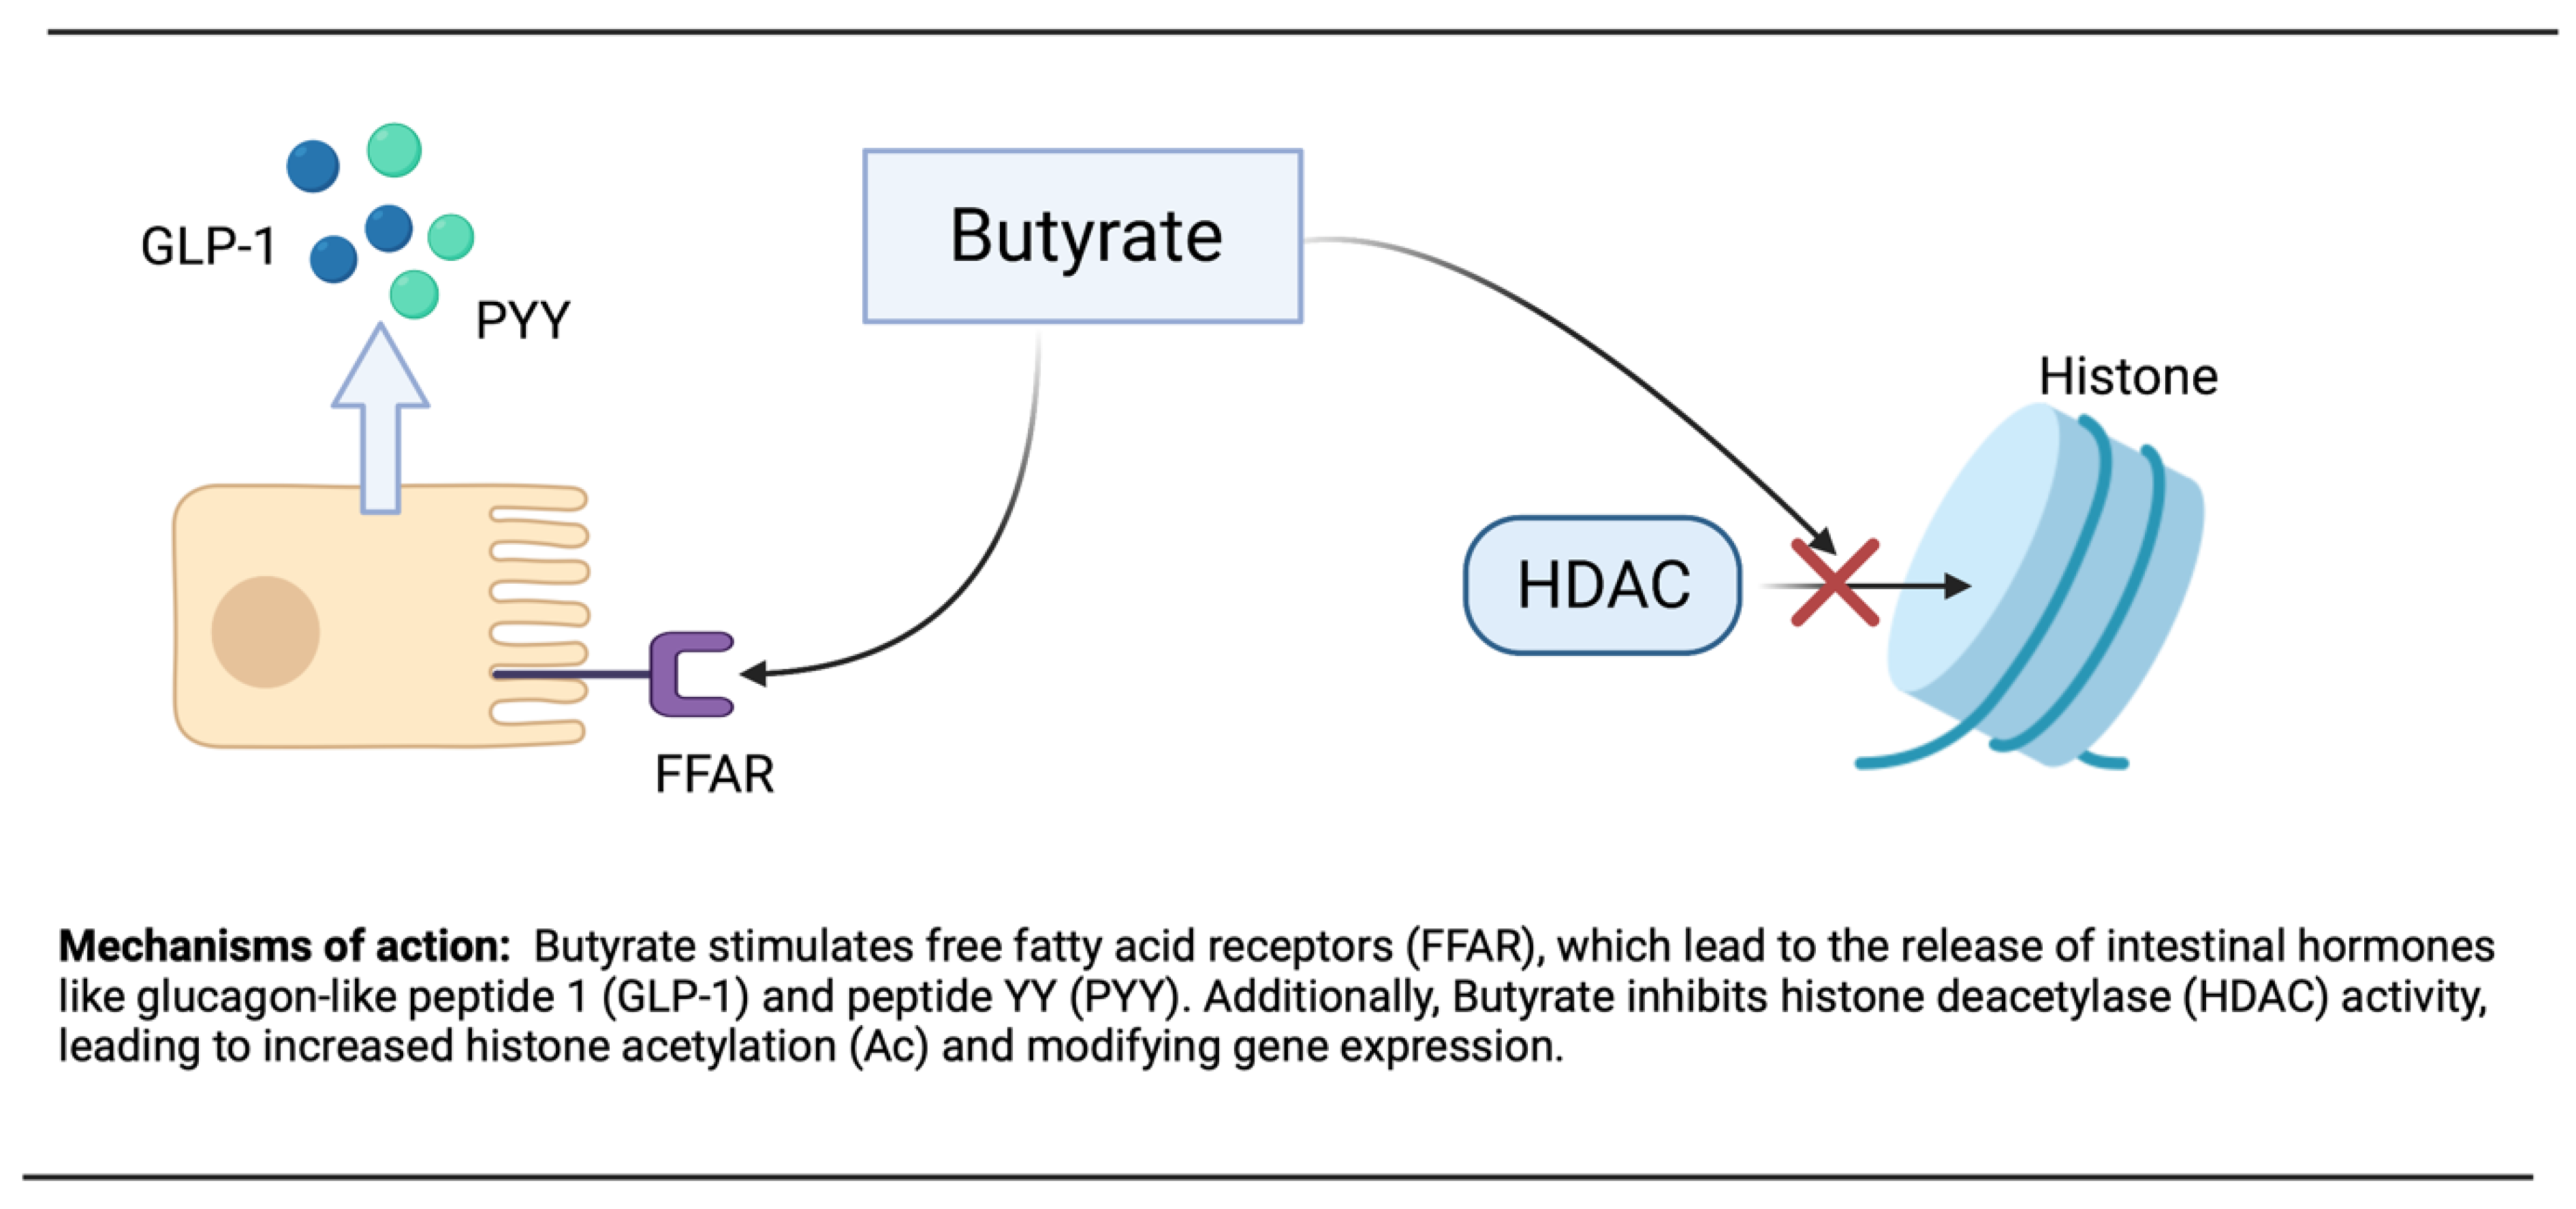
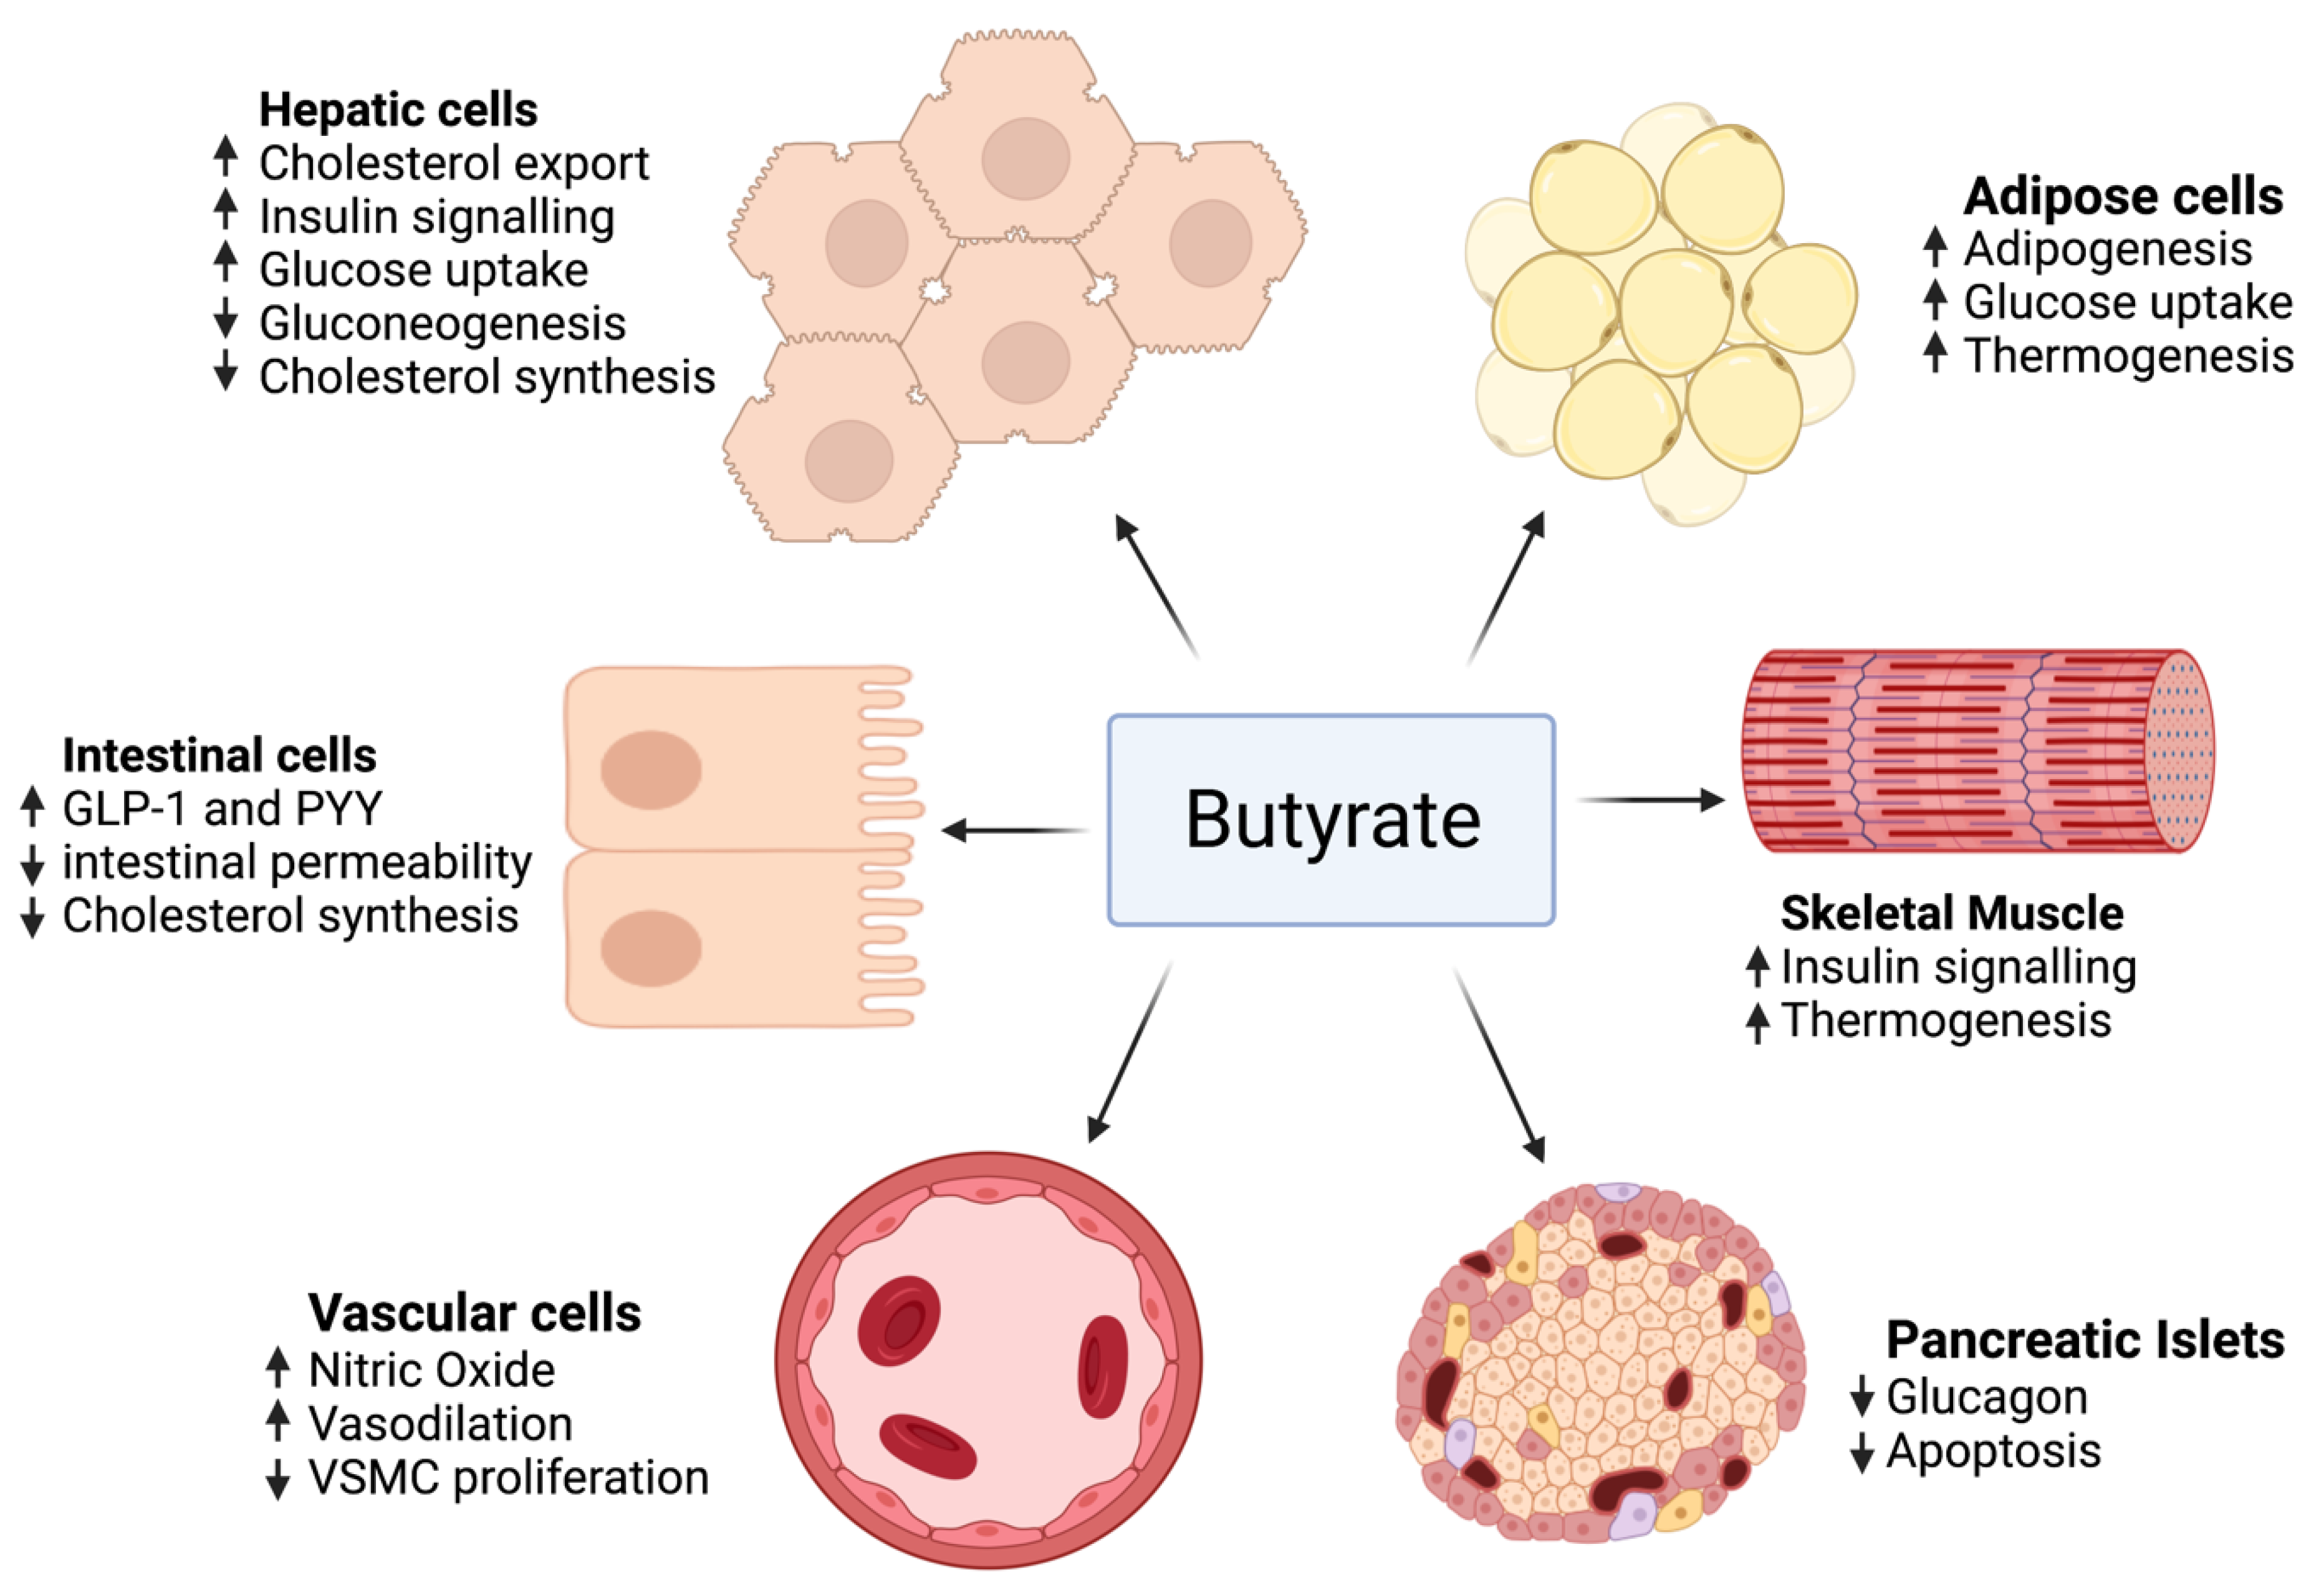
| Clinical Measure | Criteria | Diagnosis | ||||
|---|---|---|---|---|---|---|
| Central Obesity | Blood Glc | High TG | Low HDL | High BP | ||
| AHA/ NHLBI (2009) [4] |
>40” (men) or >35” (women) |
|
|
|
| ≥3 criteria |
| IDF (2005) [5,6] |
>32” (women) or
| ≥3 criteria one of which should be central obesity | ||||
| ATPIII (2001) [7] | WC >40” (men) or >35” (women) |
|
|
| ≥3 criteria | |
| EGIR (1999) [8] |
>32” (women) |
|
|
| ≥3 criteria one of which should be IR * | |
| WHO (1998) [1] |
|
|
|
| ≥3 criteria one of which should be IR ** | |
| Index | AUC (95% CI) | Optimal Cut off Point | Sensitivity | Specificity |
|---|---|---|---|---|
| HOMA-IR | ||||
| Men MetS | 0.7000 (0.68034–0.71972) | 2.00 | 64.4 | 66.8 |
| Women MetS | 0.6779 (0.65530–0.70043) | 2.50 | 57.6 | 67.9 |
| QUICKI | ||||
| Men MetS | 0.7016 (0.68198–0.72129) | 0.343 | 63.7 | 67.8 |
| Women MetS | 0.6803 (0.65779–0.70281) | 0.331 | 55.7 | 70.7 |
| Increased Expression (↑) | Decreased Expression (↓) |
|---|---|
| ↑ Leptin, PAI-1, chemerin ↑ IL-1, IL-6, IL-8, MCP-1, TNF-α ↑ High sensitivity CRP, fibrinogen ↑ Monocytic TLR2 and TLR4 | ↓ Adiponectin, omentin ↓ IL-10 |
| Model | Obesity | Hyperlipidemia | IR | Hypertension | Caveats | Reference |
|---|---|---|---|---|---|---|
| OBESITY MODELS | ||||||
| Lepob/ob | From weaning | F HDL (LDL/HDL1) | Yes | ↑↓ blood pressure | No leptin signalling; strain differences; anomalies with reproduction, thyroid axis, and HPA axis | [180] |
| LepRdb/db | From weaning | F HDL (LDL/HDL1) | Yes | ↑↓ blood pressure | No leptin signalling; strain differences; anomalies with reproduction, thyroid axis, and HPA axis | [181] |
| Ay/a | Postponed onset | Slight F HDL | Postponed | yes | Tumor formation | [182] |
| MC4-R–/– | Postponed onset; exacerbated following high-fat feeding; haploinsufficiency of MC4-R also seen in obese humans | ND | Yes | ↓ blood pressure | - | [183] |
| MC3-R–/– | Postponed onset | ND | protected | ND | ↑ adiposity without an increase in body weight | [184] |
| HYPERLIPIDEMIA MODELS | ||||||
| LDLR–/– | HFD induced | ↑ LDL | HFD induced | - | - | [185] |
| apoE–/– | Generally resistant | ↑ VLDL and LDL, ↓ HDL | Generally resistant | - | - | [186] |
| OBESITY WITH HYPERLIPIDEMIA MODELS | ||||||
| Lepob/ob;LDLR–/– and LepRdb/db;LDLR–/– | From weaning | ↑↑ VLDL and LDL | Yes | ND | Extreme hyperlipidemia; no leptin signaling | [187] |
| Lepob/ob;apoE–/– and LepRdb/db;apoE–/– | From weaning | ↑↑ VLDL and LDL, ↓↓ HDL | Yes | ND | Extreme hyperlipidemia; no leptin signaling | [187] |
| Ay/a;LDLR–/– Western diet feeding | Postponed onset | ↑ VLDL and LDL | Yes | ND | Extreme hyperlipidemia | [188] |
| LDLR 3KO | From weaning | ↑ VLDL and LDL | Yes | Yes | Extreme hyperlipidemia; no leptin signaling | [189] |
| ApoE 3KO | From weaning | ↑ VLDL and LDL | Yes | Yes | Extreme hyperlipidemia; no leptin signaling | [190] |
| ApoE–/– 60% HFD | Over time on HFD | ↑ VLDL | Yes | Yes | - | [191] |
| OBESITY WITH HYPERTENSION MODELS | ||||||
| NZBWF1 | Age onset | ND | Yes | Yes | - | [192] |
| KKAy/a | yes | - | Yes | Yes | - | [193] |
| Source | Action |
|---|---|
| Turmeric (Curcuma longa) Active ingredient: diferuloylmethane in curcumin | Suppress NF-kB activation-> ↓ expression of pro-inflammatory cytokines-↓ TNF-α expression, ↓ expression of plasminogen activator inhibitor type-1-> ↓ inflammation [202]—antioxidant effect [201]—curcumin hinders Wnt/β-catenin pathway associated with obesity [203] |
| Garlic (Allium sativum) Active ingredient: allicin | Anti-inflammatory effect from the organosulfur compounds in its derivatives. Antioxidant action due to thiol groups—Antithrombotic effect [201]—increases insulin sensitivity [204] |
| Cinnamon (Cinnamomum verum) Active ingredient: polyphenols | Antithrombotic–antioxidant–anti-inflammatory effects—increases insulin sensitivity—regulates blood glucose and blood pressure [201] |
| Rhizoma coptidis Active ingredient: berberine | Improves body weight, triglyceride levels—increases insulin sensitivity—downregulation of genes involved in lipogenesis [205]—reduction in blood pressure [206] |
| Neem (Azadirachta indica) Active ingredient: neem oil | Increases glucose tolerance via reduction of intestinal and pancreatic glucosidase activity → improves post-prandial hyperglycemia [207]—regenerates pancreatic beta cells → ↑ insulin secretion [201] |
| Bergamot orange (Citrus bergamia) Active ingredient: bergamot essential oil | Anticancer–anti-inflammatory–antimicrobial–antioxidant–antianxiety properties—↓ ROS formation—↓ lectin-like LDL receptor-1 expression [208] |
| Grapes (Vitus vinifera) Active ingredient: resveratrol, (3,5,4′-trihydroxystilbene) | ↓ Adipogenesis—↑ lipolysis—inhibits cyclooxygenase → antioxidant action [209]—enhances insulin sensitivity, glucose tolerance, overall weight, and BMI—[210] |
| Onions (Allium cepa) Active ingredient: quercetin | Anti-inflammatory—antioxidant—↓ blood pressure—↓ cholesterol levels—↓ insulin resistance [211] |
| Fish oils (omega fatty acids) Active ingredient: polyunsaturated fatty acids | ↓ Lipogenesis—↑ fatty acid oxidation in liver and adipose tissue—regulates peroxisome proliferator—activates receptor gamma [212] |
| Broccoli (Brassica oleracea) Active ingredient: sulforaphrane | Anti-inflammatory properties—activates nuclear factor erythroid 2-related factor 2, an antioxidant transcription factor → antioxidant properties—role against hypertension, hyperlipidemia, and diabetes [213] |
| Ginger Active ingredient: gingerols, shogaols, parasols | Anti-inflammatory—↓ cyclooxygenase-2—↓ 5-lipoxygenase—↓ systolic blood pressure [201] |
| Cumin (Cuminum cyaminum) Active ingredient: cuminaldehyde | ↓ Lipid levels—↓ glycemia [201] |
| Cynara cardunculus (L.) subsp. scolymus Hayek-based Altilix® | Modulates the expression of PPAR-γ and inhibits fatty acid synthase activity—↓ in body weight, waist circumference, HbA1c, plasma lipids, hepatic transaminases, flow-mediated dilation, carotid intima-media thickness [214]. |
| Monascus purpureus, red yeast rice | Reversible inhibition of 3-hydroxy-3-methyl-glutaryl-CoA reductase [215] |
| Reference | Sample Size (n) | Age Range Probiotic Strain Period of Intervention (Weeks) Probiotic Dose | Primary Outcomes | Secondary Outcomes |
|---|---|---|---|---|
| [247] | 28 | Control group: 54.5 ± 8.9 Probiotic group: 51.5 ± 11.4 Lactobacillus casei Shirota 12 milk (65 mL bottles × 3/day) 108 cells/mL | No changes were found in BMI, BP, waist circumference, triacylglycerols, TC, and fasting glucose levels. | High-sensitive CRP (1.86 mg/L in the probiotic group vs. −1.60 mg/L in the placebo group, p = 0.016) and LBP levels (5827 ng/mL in the probiotic group vs. −1510 ng/mL in the placebo group, p = 0.023) increased within the probiotic group |
| [248] | 40 | Control group: 51.7 ± 12.1 Probiotic group: 52 ± 10.9 Lactobacillus plantarum TENSIA 3 cheese (50 g/day) 1.5 × 10¹¹ CFU/g | BMI was significantly reduced in the probiotic group (BMI variation in probiotic group −2 vs. −1.6 kg/m2 in the placebo group, p = 0.031). | A positive association was detected between TENSIA colonization and the extent of change of morning diastolic BP (r = 0.617, p = 0.0248) |
| [249] | 28 | Control group: 55 ± 9 Probiotic group: 51 ± 11 Lactobacillus casei Shirota 12 milk (65 mL bottles × 3/day) 108 cells/mL | No changes were found in BMI, fasting plasma glucose levels, and HOMA-IR index. | Probiotic supplementation resulted in a significant reduction in sVCAM-1 level (−195 ng/mL in the probiotic group vs. 30 ng/mL in the placebo group, p = 0.008) and a significant increase in high-sensitive CRP level (1.86 mg/L in the probiotic group vs. −1.60 mg/L in the placebo group, p = 0.002) |
| [247] | 24 | Control group: 63 ± 7.6 Probiotic group: 62 ± 4.35 Lactobacillus plantarum 12 milk (80 mL bottles × 1/day) 107 CFU/g | Glucose levels showed a significant reduction in the FM group compared with the NFM group (glucose variation in FM −10.5 vs. −3 mg/dL in NFM group, p = 0.037). | Homocysteine levels showed a significant reduction in the FM group compared with the NFM group p = 0.019). |
| [250] | 28 | Control group: 55 ± 9 Probiotic group: 51 ± 11 Lactobacillus casei Shirota 12 milk (65 mL bottles × 3/day) 108 cells/mL | No changes were found in BMI, BP, waist circumference, triacylglycerols, and TC blood levels. | LcS administration was associated with subtle microbiota changes at a genus level (enrichment of Parabacteroidetes) |
| [251] | 51 | No data Bifidobacterium lactis HN019 6 milk (80 mL bottle × 1/day) 3.4 × 10⁸ CFU/mL | Significant differences in BMI variation (probiotic group −1.3 vs. −0.3 kg/m2 in control group, p = 0.017); TC variation (probiotic group −15 vs. 6 mg/dL in control group, p = 0.09) and LDLc variation (probiotic group −17.5 vs. −2 mg/dL in control group, p = 0.08). | Significant decrease in TNFα and IL−6 (p < 0.05) in the probiotic group |
| [252] | 81 | Control group: 58.72 ± 7.25 Low-dose group: 56.38 ± 6.55 High-dose group: 55.16 ± 6.87 Bifidobacterium bifidum W23, Bifidobacterium lactis W51, Bifidobacterium lactis W52, Lactobacillus acidophilus W37, Lactobacillus brevis W63, Lactobacillus casei W56, Lactobacillus salivarius W24, Lactococcus lactis W19, and Lactococcus lactis W58 12 lyophilisate powder low dose (2.5 × 10⁹ CFU/day) or high dose (1 × 10¹⁰ CFU/day) | Significant differences were found in glucose variation (HD vs. placebo −0.61 mg/dL, p= 0.0272; HD vs. LD −0.72 mg/dL, p = 0.0043), insulin (HD vs. placebo −0.83 UI/L, p = 0.0002; HD vs. LD −0.40 UI/L, p = 0.0155), and HOMA-IR (HD vs. placebo −0.90, p = 0.0005; HD vs. LD −0.54 mg/dL, p = 0.0127). | Significant differences were found in uric acid (HD vs. placebo −0.73 mmol/L, p = 0.0109; HD vs. LD −0.92 mmol/L, p = 0.0016) and LPS levels (HD vs. placebo −0.99 ng/mL, p = 0.001) |
| [253] | 81 | Control group: 58.72 ± 7.25 Low-dose group: 56.38 ± 6.55 High-dose group: 55.16 ± 6.87 Bifidobacterium bifidum W23, Bifidobacterium lactis W51, Bifidobacterium lactis W52, Lactobacillus acidophilus W37, Lactobacillus brevis W63, Lactobacillus casei W56, Lactobacillus salivarius W24, Lactococcus lactis W19, and Lactococcus lactis W58 12 lyophilisate powder low dose (2.5 × 10⁹ CFU/day) or high dose (1 × 10¹⁰ CFU/day) | No changes were found in BMI and BP. | Significant differences were found in the pulse wave analysis systolic pressure (HD vs. placebo −1 mmHg, p = 0.0054; HD vs. LD −0.91 mmHg, p = 0.0057), the pulse wave analysis augmentation index (HD vs. placebo −0.55, p = 0.0079), the pulse wave velocity (HD vs. placebo −0.82 m/s, p = 0.0045; HD vs. LD −0.55 m/s, p = 0.0189), VEGF (HD vs. placebo −1.09 pg/mL, p = 0.0001; HD vs. LD −1.10 pg/mL, p = 0.0007), TNFα (HD vs. placebo −1.03 pg/mL, p = 0.0009; HD vs. LD −0.68 pg/mL, p = 0.0471), and thrombomodulin levels (HD vs. placebo −0.78 ng/mL, p= 0.0194) |
| [254] | 44 | Control group: 44.55 ± 5.70 Probiotic group: 44.05 ± 6.60 Lactobacillus acidophilus La5, Bifidobacterium lactis Bb12 8 yogurt containing 6.45 × 10⁶ CFU/g of L. acidophilus and 4.94 × 10⁶ CFU/g of B. lactis Bb12 | Consumption of probiotic yogurt resulted in a significant reduction in the level of blood glucose (mean difference: −3.80, p = 0.01). | Consumption of probiotic yogurt resulted in a significant reduction in the level of VCAM-1 (mean difference −463.39, p = 0.001) |
Publisher’s Note: MDPI stays neutral with regard to jurisdictional claims in published maps and institutional affiliations. |
© 2022 by the authors. Licensee MDPI, Basel, Switzerland. This article is an open access article distributed under the terms and conditions of the Creative Commons Attribution (CC BY) license (https://creativecommons.org/licenses/by/4.0/).
Share and Cite
Fahed, G.; Aoun, L.; Bou Zerdan, M.; Allam, S.; Bou Zerdan, M.; Bouferraa, Y.; Assi, H.I. Metabolic Syndrome: Updates on Pathophysiology and Management in 2021. Int. J. Mol. Sci. 2022, 23, 786. https://doi.org/10.3390/ijms23020786
Fahed G, Aoun L, Bou Zerdan M, Allam S, Bou Zerdan M, Bouferraa Y, Assi HI. Metabolic Syndrome: Updates on Pathophysiology and Management in 2021. International Journal of Molecular Sciences. 2022; 23(2):786. https://doi.org/10.3390/ijms23020786
Chicago/Turabian StyleFahed, Gracia, Laurence Aoun, Morgan Bou Zerdan, Sabine Allam, Maroun Bou Zerdan, Youssef Bouferraa, and Hazem I. Assi. 2022. "Metabolic Syndrome: Updates on Pathophysiology and Management in 2021" International Journal of Molecular Sciences 23, no. 2: 786. https://doi.org/10.3390/ijms23020786