
Non-Invasive Brain Stimulation Effects on Biomarkers of Tryptophan Metabolism: A Scoping Review and Meta-Analysis
 ,
,
Abstract
:1. Introduction
1.1. Rationale
1.2. Objective
2. Methods
2.1. Eligibility Criteria
2.2. Information Sources
2.3. Search Strategy
2.4. Selection and Data Collection
2.5. Data Items
2.6. Qualitative Synthesis Methods
2.7. Quantitative Synthesis Methods by Bayesian Meta-Analysis
3. Results
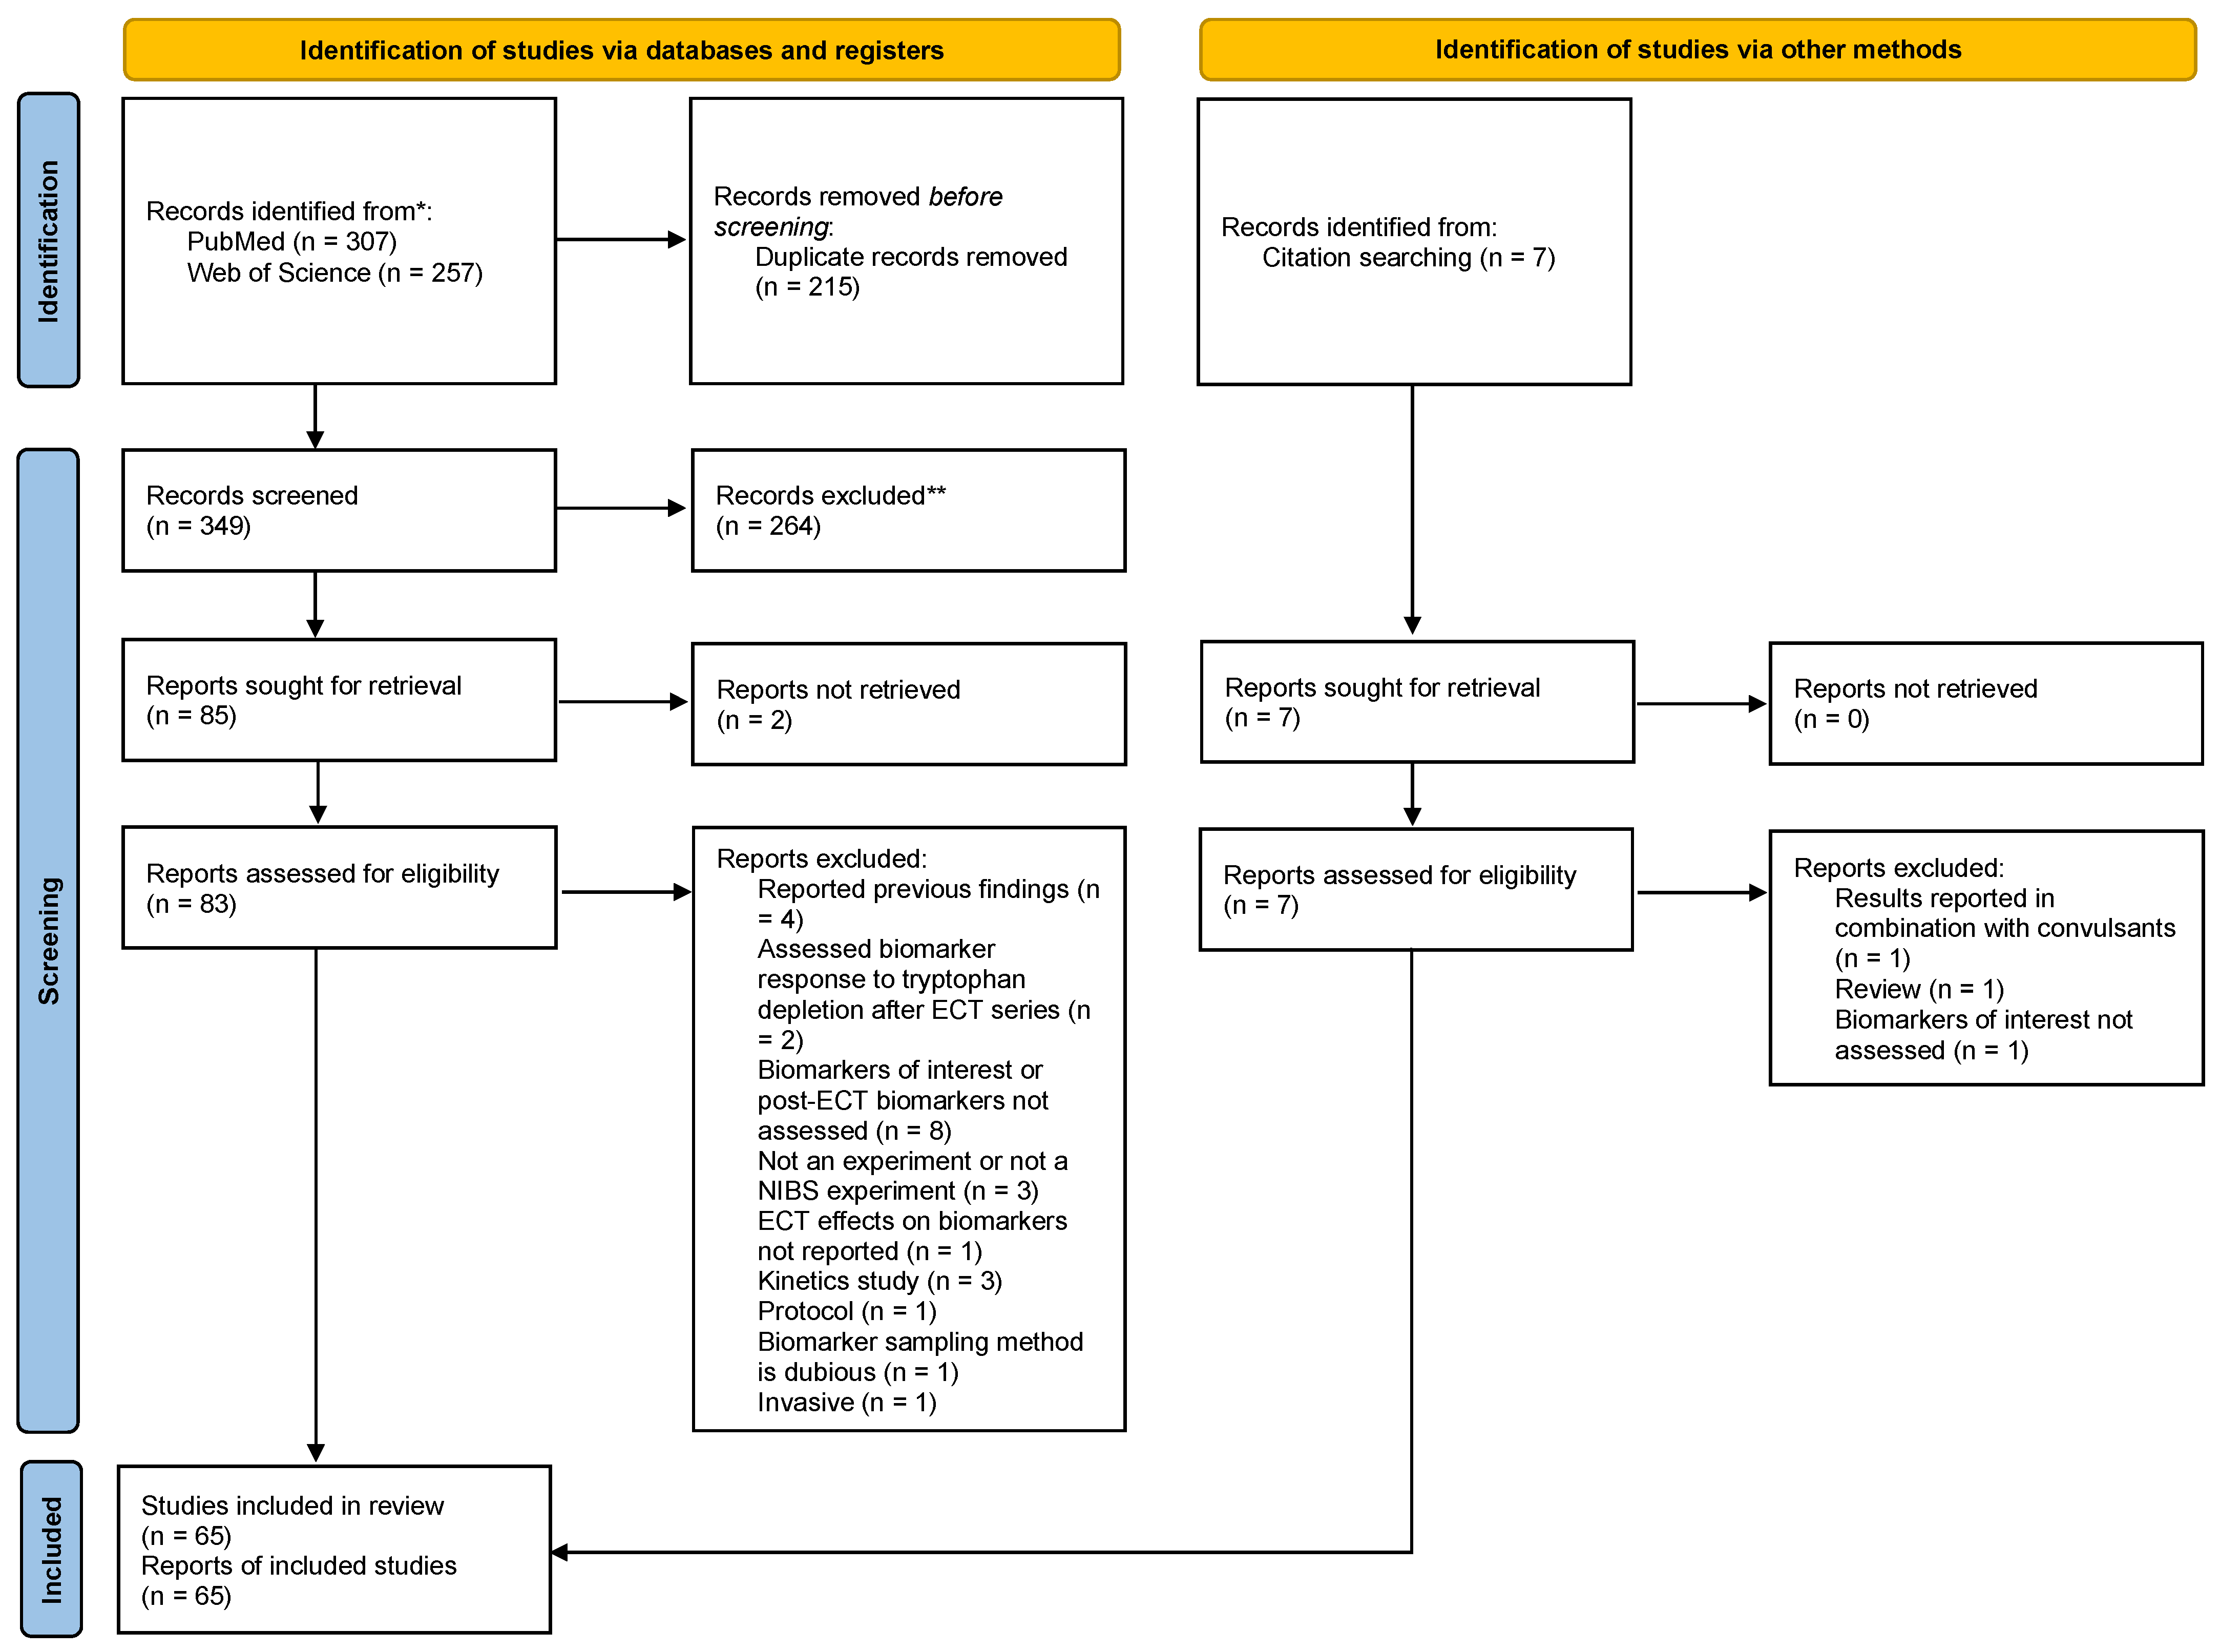
3.1. Selection of Sources of Evidence
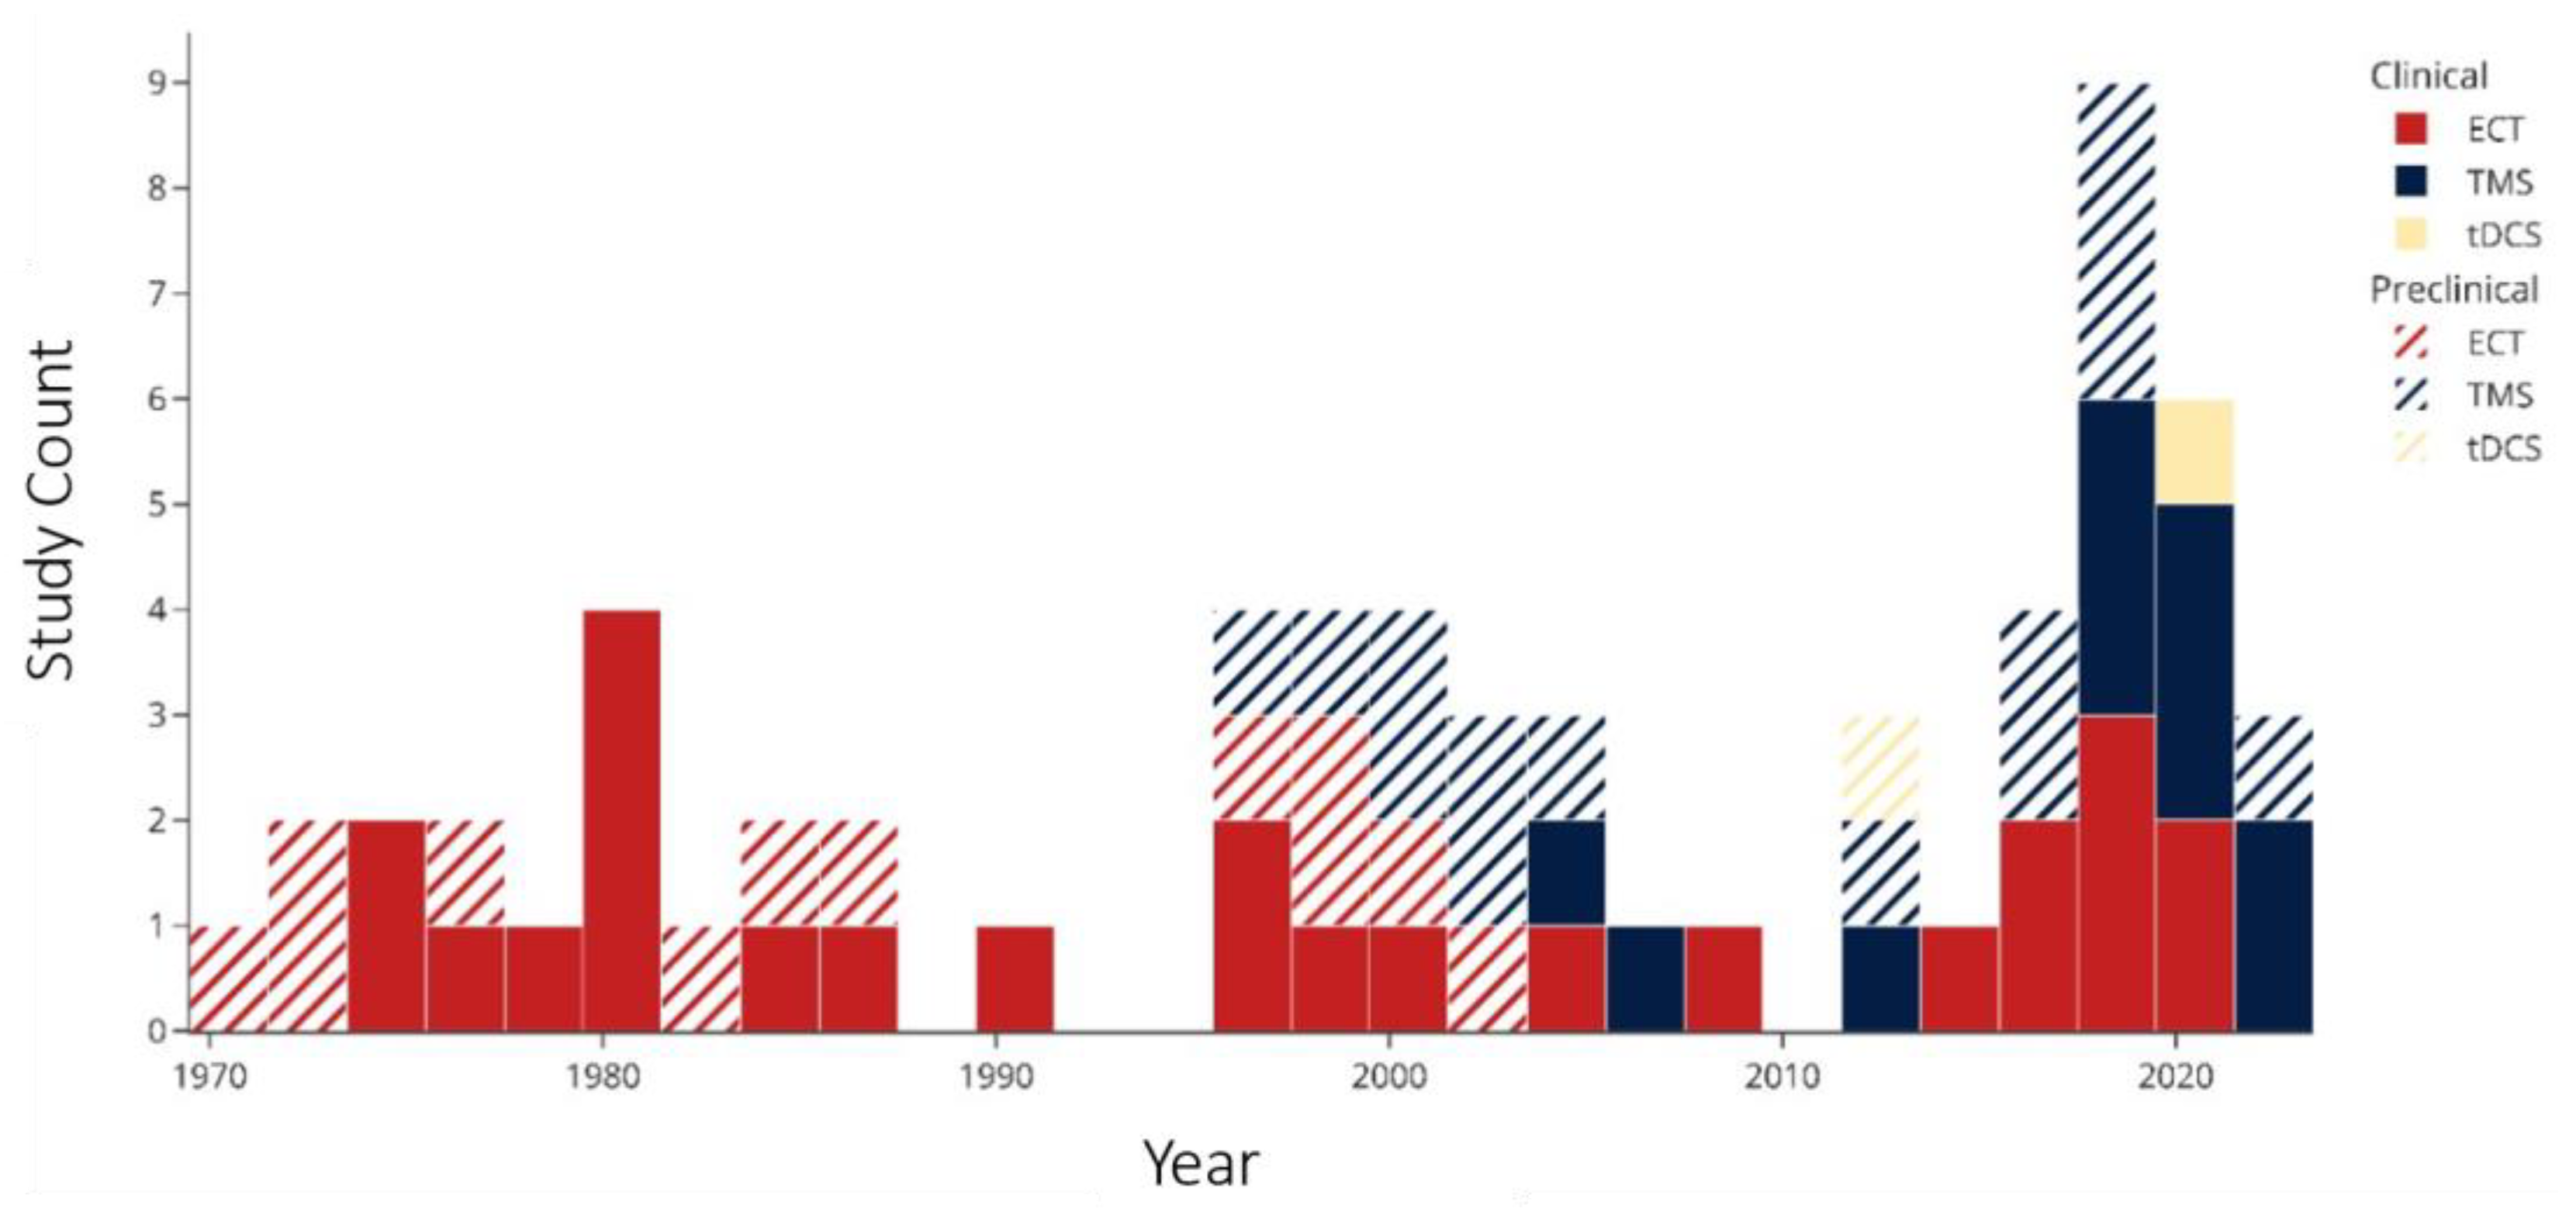
3.2. Characteristics of Included Studiess
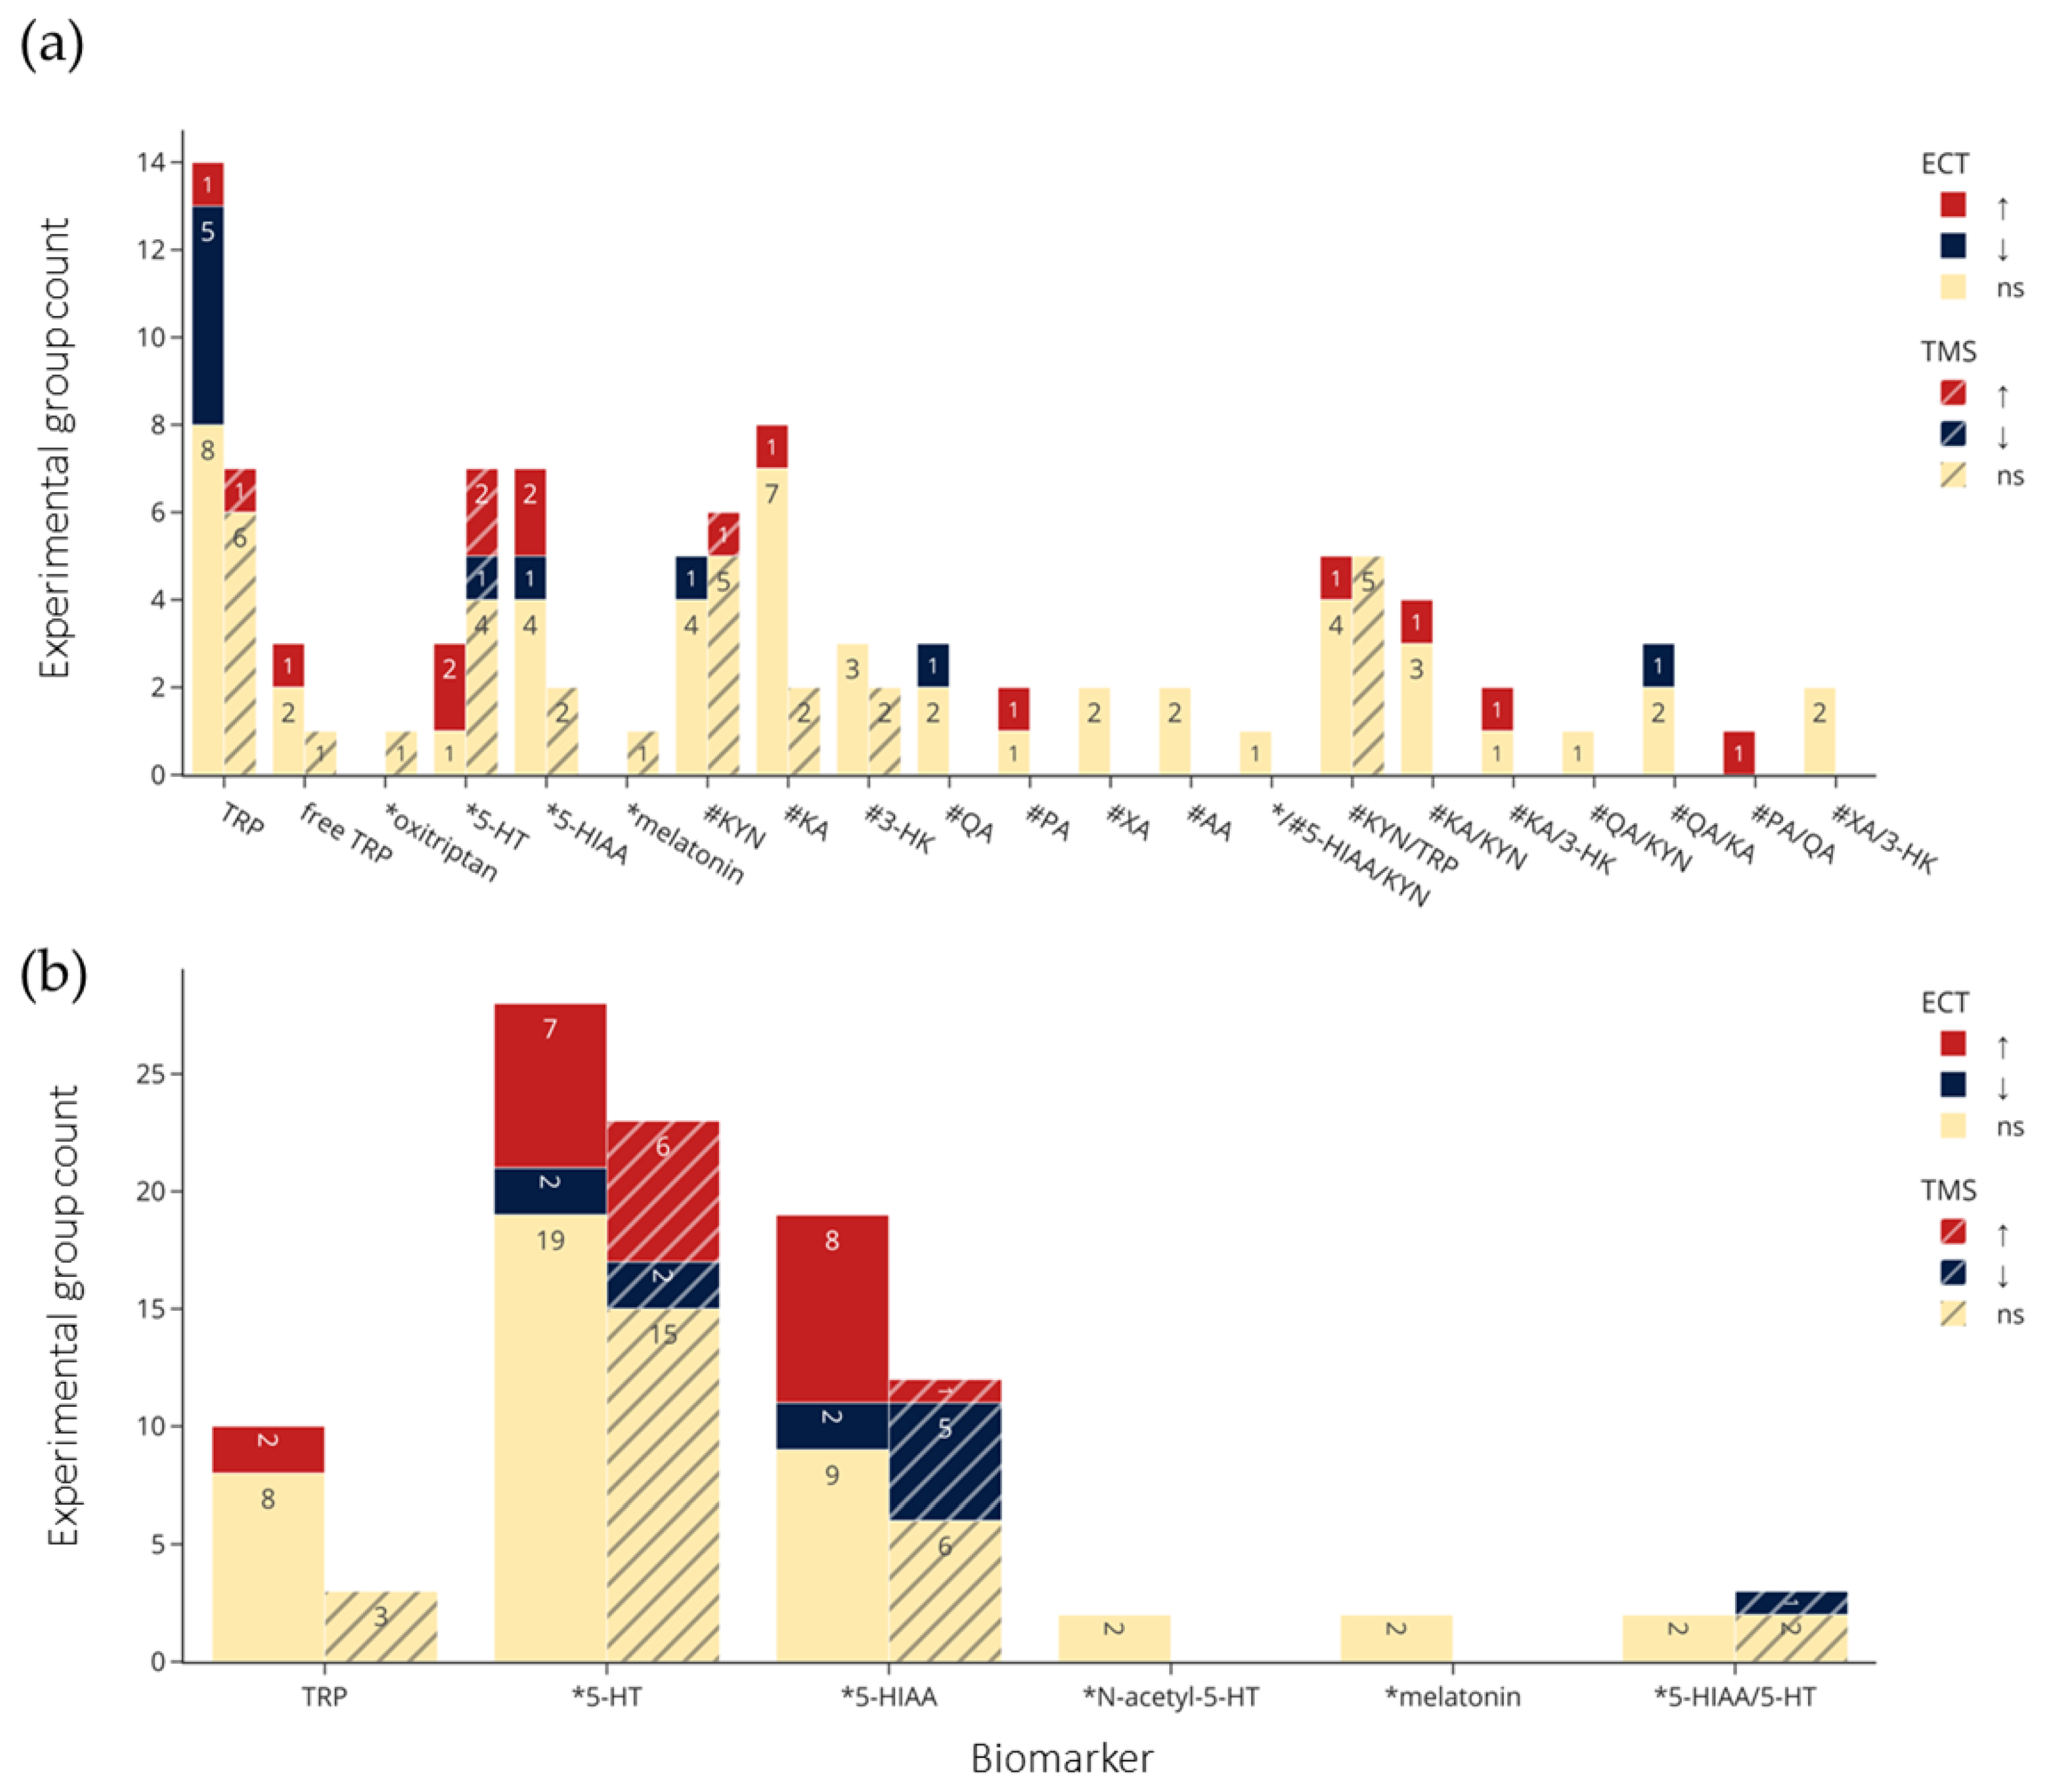
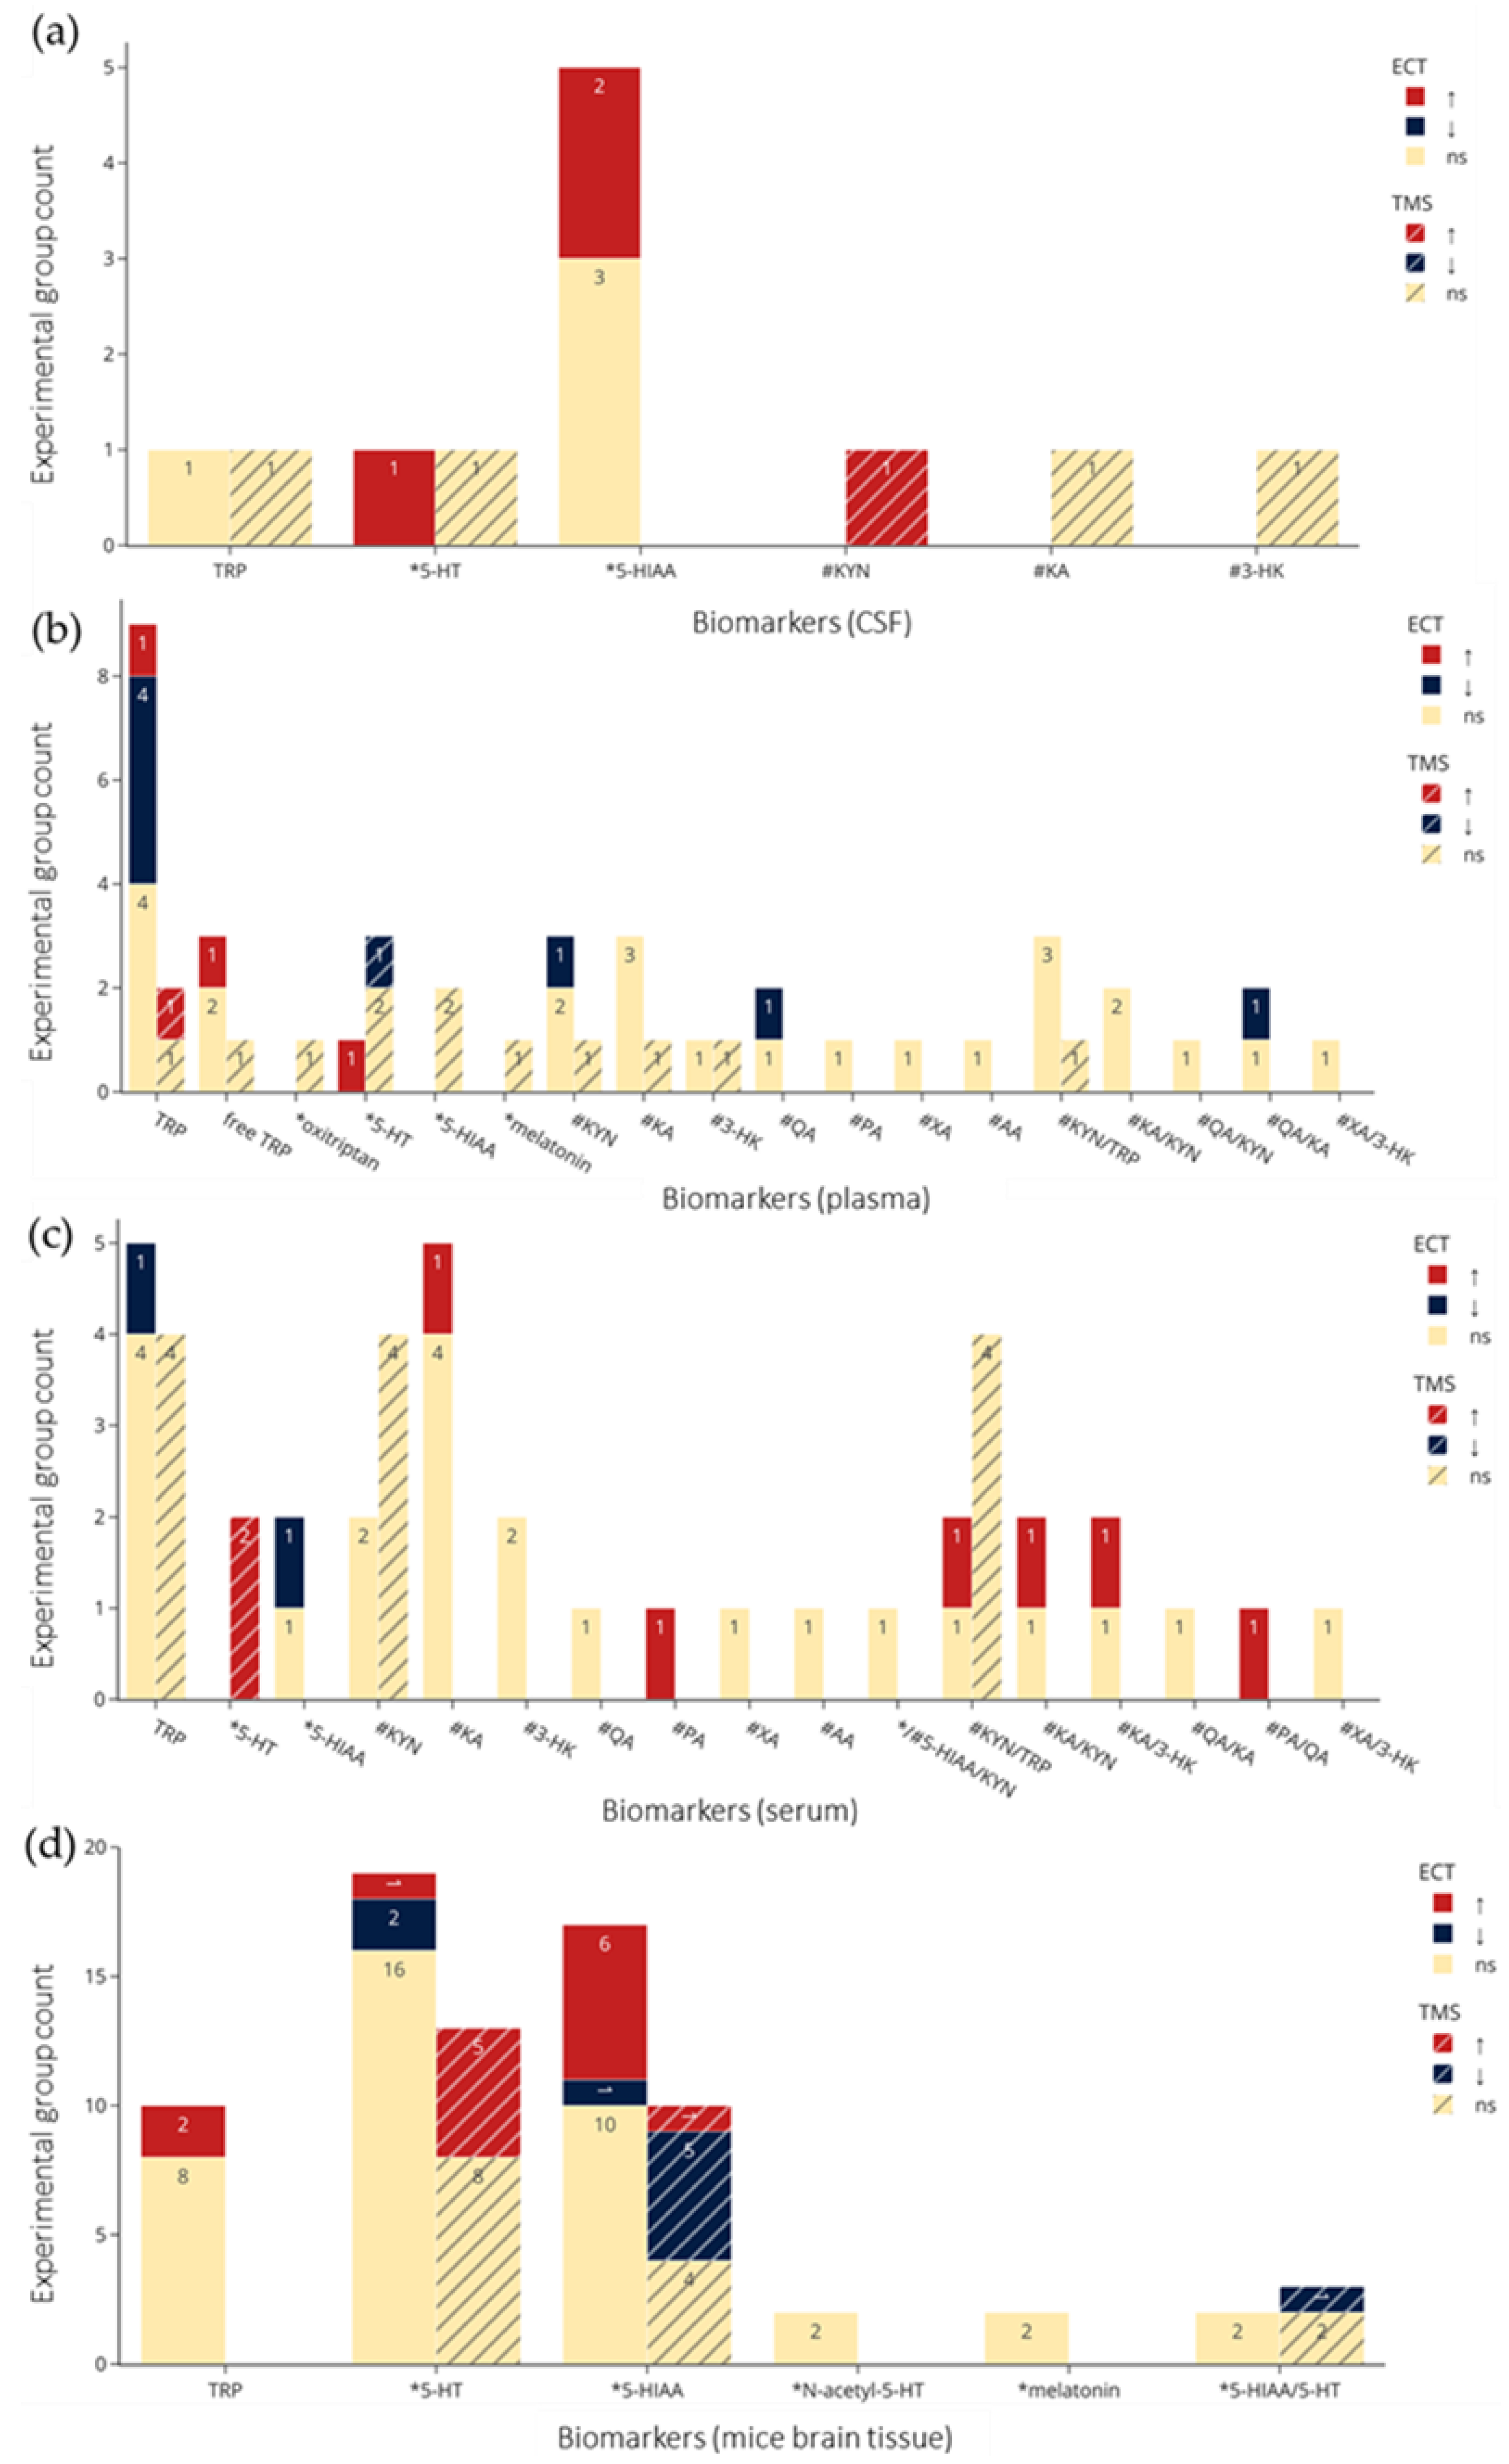
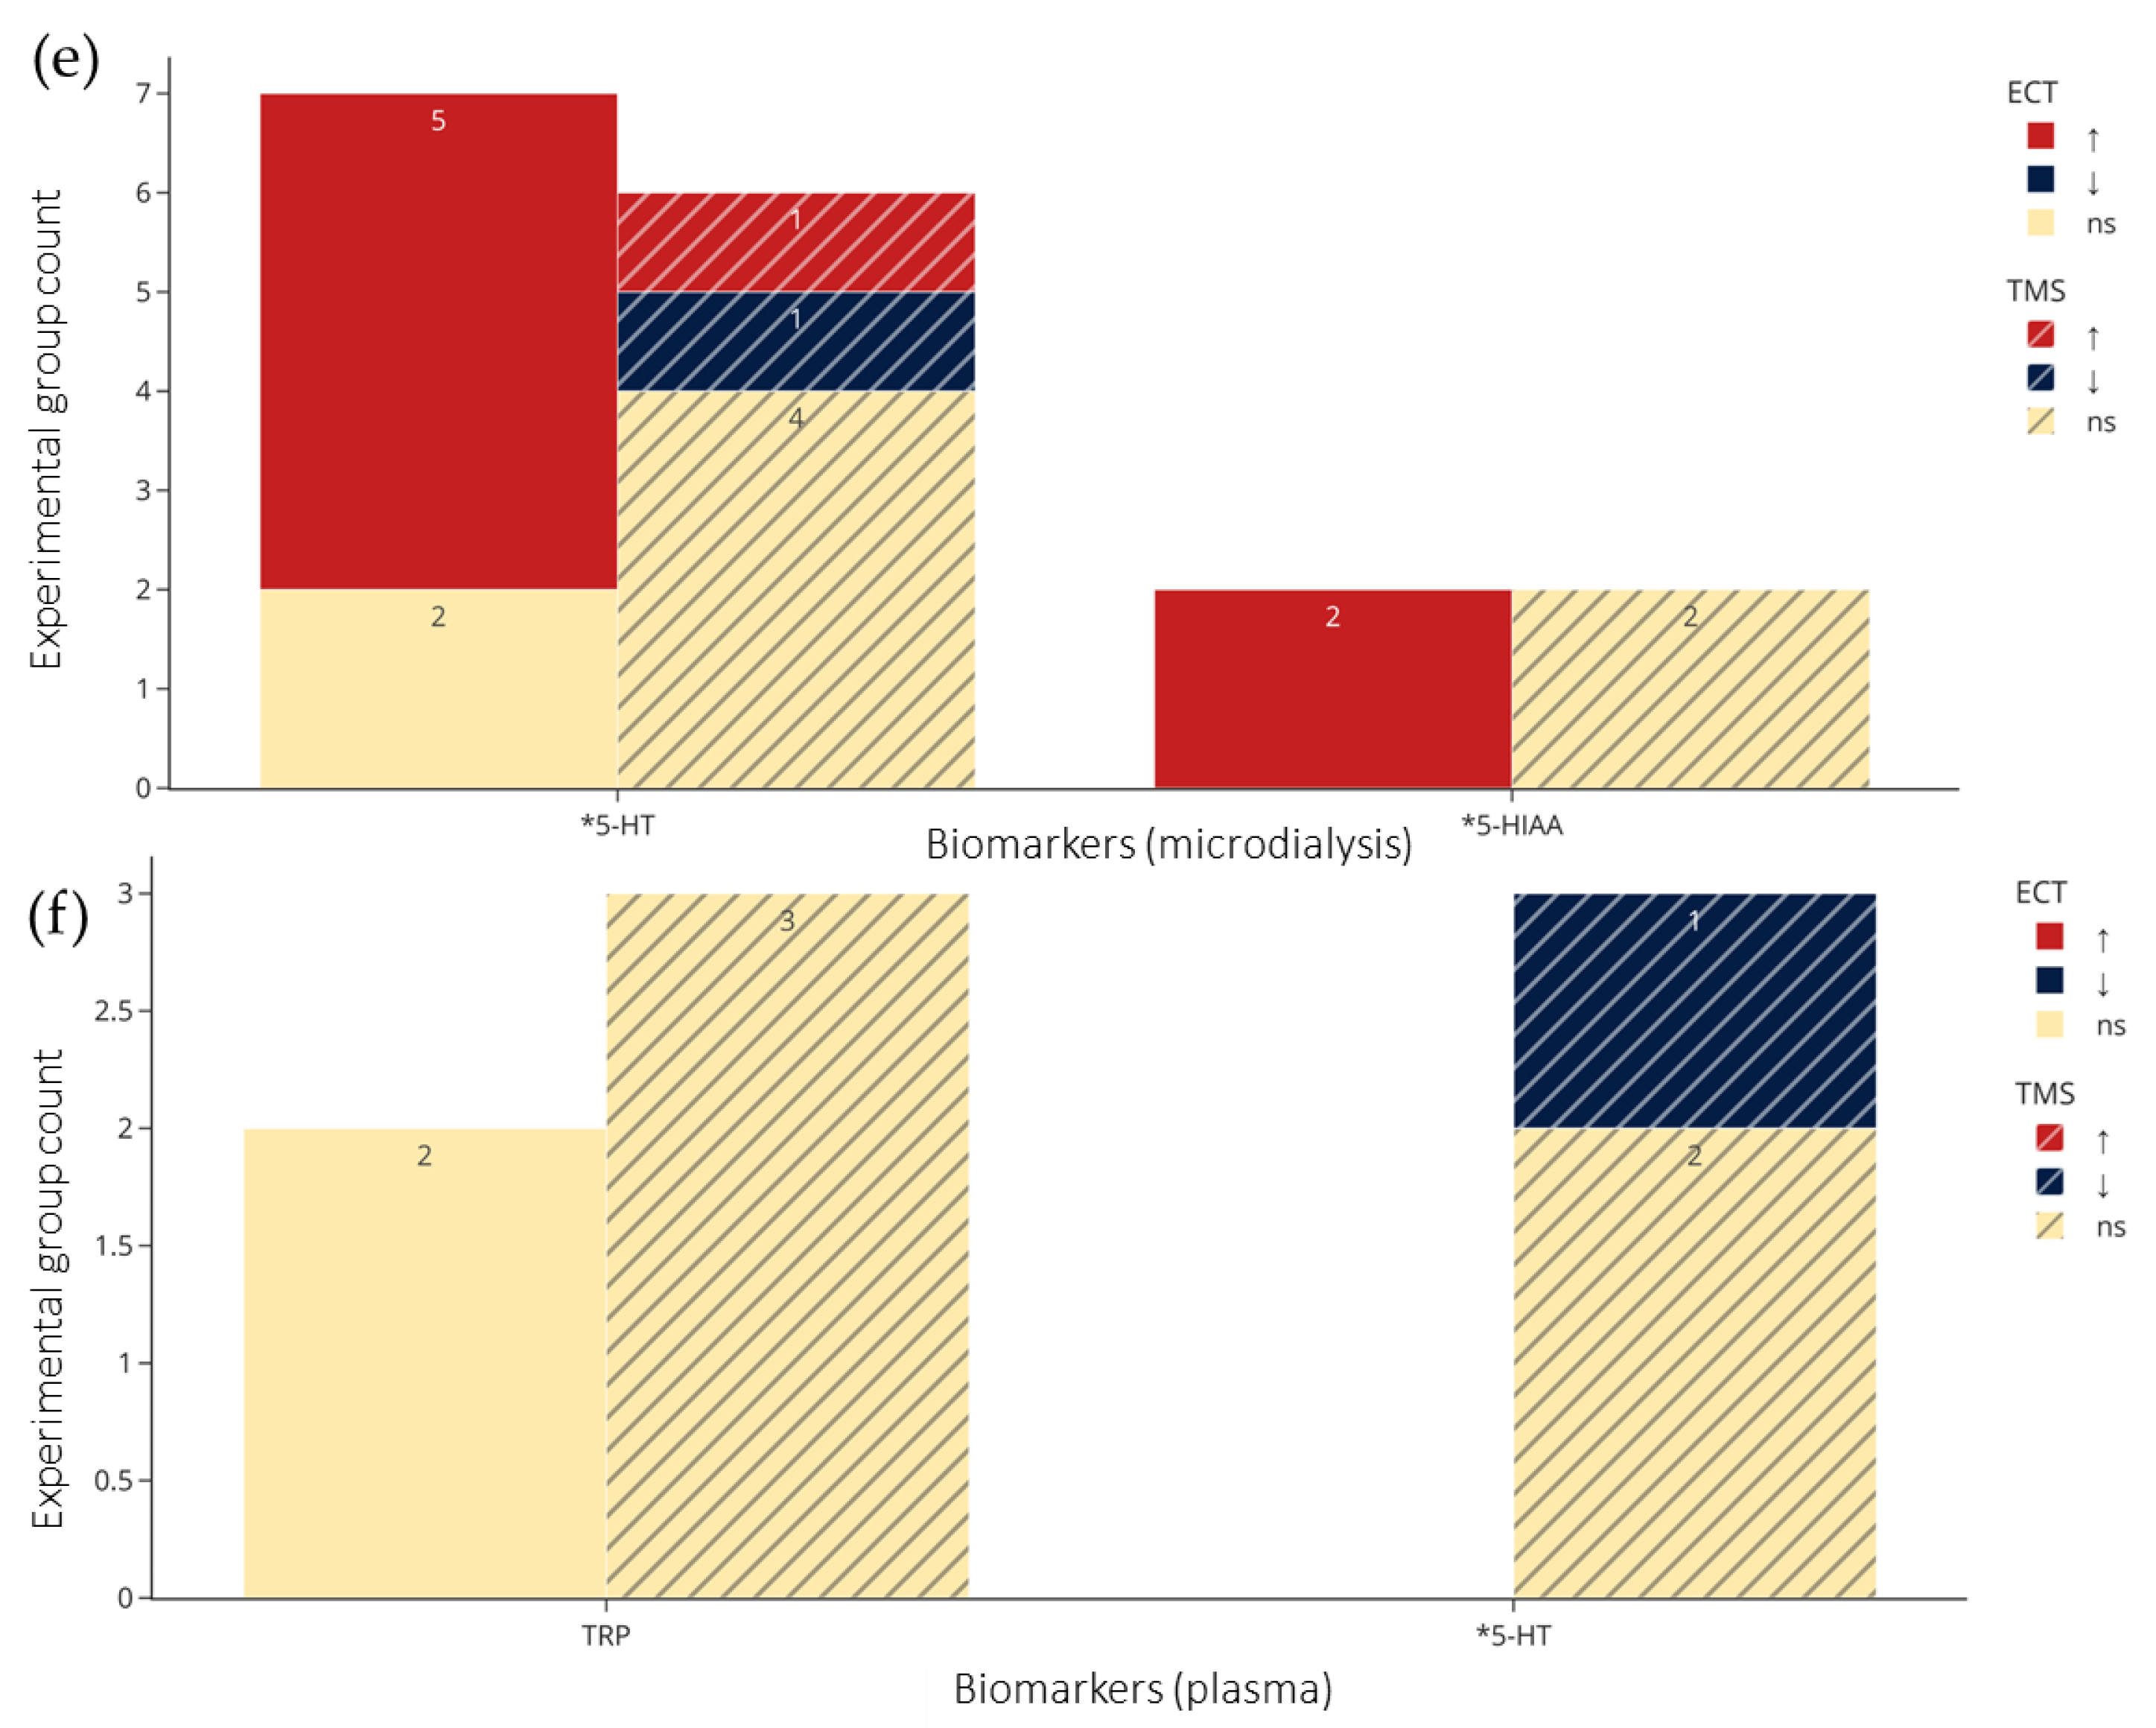
3.3. Qualitative Synthesis Results
3.4. Quantitative Synthesis Results by Bayesian Meta-Analysis
4. Discussion
5. Conclusions
Supplementary Materials
Author Contributions
Funding
Institutional Review Board Statement
Data Availability Statement
Conflicts of Interest
References
- Melhem, N.J.; Taleb, S. Tryptophan: From Diet to Cardiovascular Diseases. Int. J. Mol. Sci. 2021, 22, 9904. [Google Scholar] [CrossRef] [PubMed]
- Roth, W.; Zadeh, K.; Vekariya, R.; Ge, Y.; Mohamadzadeh, M. Tryptophan Metabolism and Gut-Brain Homeostasis. Int. J. Mol. Sci. 2021, 22, 2973. [Google Scholar] [CrossRef] [PubMed]
- Bacqué-Cazenave, J.; Bharatiya, R.; Barrière, G.; Delbecque, J.-P.; Bouguiyoud, N.; Di Giovanni, G.; Cattaert, D.; De Deurwaerdère, P. Serotonin in Animal Cognition and Behavior. Int. J. Mol. Sci. 2020, 21, 1649. [Google Scholar] [CrossRef] [PubMed]
- Cowen, P.J.; Browning, M. What has serotonin to do with depression? World Psychiatry 2015, 14, 158–160. [Google Scholar] [CrossRef]
- Kanova, M.; Kohout, P. Tryptophan: A Unique Role in the Critically III. Int. J. Mol. Sci. 2021, 22, 11714. [Google Scholar] [CrossRef]
- James, G.M.; Gryglewski, G.; Vanicek, T.; Berroterán-Infante, N.; Philippe, C.; Kautzky, A.; Nics, L.; Vraka, C.; Godbersen, G.M.; Unterholzner, J.; et al. Parcellation of the Human Cerebral Cortex Based on Molecular Targets in the Serotonin System Quantified by Positron Emission Tomography In vivo. Cereb. Cortex 2019, 29, 372–382. [Google Scholar] [CrossRef]
- Savitz, J. The kynurenine pathway: A finger in every pie. Mol. Psychiatry 2020, 25, 131–147. [Google Scholar] [CrossRef]
- Carvalho, A.F.; Solmi, M.; Sanches, M.; Machado, M.O.; Stubbs, B.; Ajnakina, O.; Sherman, C.; Sun, Y.R.; Liu, C.S.; Brunoni, A.R.; et al. Evidence-based umbrella review of 162 peripheral biomarkers for major mental disorders. Transl. Psychiatry 2020, 10, 152. [Google Scholar] [CrossRef]
- Marx, W.; McGuinness, A.J.; Rocks, T.; Ruusunen, A.; Cleminson, J.; Walker, A.J.; Gomes-da-Costa, S.; Lane, M.; Sanches, M.; Diaz, A.P.; et al. The kynurenine pathway in major depressive disorder, bipolar disorder, and schizophrenia: A meta-analysis of 101 studies. Mol. Psychiatry 2021, 26, 4158–4178. [Google Scholar] [CrossRef]
- Ogyu, K.; Kubo, K.; Noda, Y.; Iwata, Y.; Tsugawa, S.; Omura, Y.; Wada, M.; Tarumi, R.; Plitman, E.; Moriguchi, S.; et al. Kynurenine pathway in depression: A systematic review and meta-analysis. Neurosci. Biobehav. Rev. 2018, 90, 16–25. [Google Scholar] [CrossRef]
- Kappelmann, N.; Lewis, G.; Dantzer, R.; Jones, P.B.; Khandaker, G.M. Antidepressant activity of anti-cytokine treatment: A systematic review and meta-analysis of clinical trials of chronic inflammatory conditions. Mol. Psychiatry 2018, 23, 335–343. [Google Scholar] [CrossRef] [PubMed]
- Köhler-Forsberg, O.; Benros, M.E.; Nordentoft, M.; Farkouh, M.E.; Iyengar, R.L.; Mors, O.; Krogh, J. Effect of anti-inflammatory treatment on depression, depressive symptoms, and adverse effects: A systematic review and meta-analysis of randomized clinical trials. JAMA Psychiatry 2014, 71, 1381–1391. [Google Scholar] [CrossRef] [PubMed]
- Erabi, H.; Okada, G.; Shibasaki, C.; Setoyama, D.; Kang, D.; Takamura, M.; Yoshino, A.; Fuchikami, M.; Kurata, A.; Kato, T.A.; et al. Kynurenic acid is a potential overlapped biomarker between diagnosis and treatment response for depression from metabolome analysis. Sci. Rep. 2020, 10, 16822. [Google Scholar] [CrossRef]
- Haroon, E.; Welle, J.R.; Woolwine, B.J.; Goldsmith, D.R.; Baer, W.; Patel, T.; Felger, J.C.; Miller, A.H. Associations among peripheral and central kynurenine pathway metabolites and inflammation in depression. Neuropsychopharmacology 2020, 45, 998–1007. [Google Scholar] [CrossRef] [PubMed]
- Kraus, C.; Castrén, E.; Kasper, S.; Lanzenberger, R. Serotonin and neuroplasticity—Links between molecular, functional and structural pathophysiology in depression. Neurosci. Biobehav. Rev. 2017, 77, 317–326. [Google Scholar] [CrossRef]
- Westfall, S.; Caracci, F.; Estill, M.; Frolinger, T.; Shen, L.; Pasinetti, G.M. Chronic Stress-Induced Depression and Anxiety Priming Modulated by Gut-Brain-Axis Immunity. Front. Immunol. 2021, 12, 670500. [Google Scholar] [CrossRef]
- Rosson, S.; de Filippis, R.; Croatto, G.; Collantoni, E.; Pallottino, S.; Guinart, D.; Brunoni, A.R.; Dell’Osso, B.; Pigato, G.; Hyde, J.; et al. Brain stimulation and other biological non-pharmacological interventions in mental disorders: An umbrella review. Neurosci. Biobehav. Rev. 2022, 139, 104743. [Google Scholar] [CrossRef]
- Hyde, J.; Carr, H.; Kelley, N.; Seneviratne, R.; Reed, C.; Parlatini, V.; Garner, M.; Solmi, M.; Rosson, S.; Cortese, S.; et al. Efficacy of neurostimulation across mental disorders: Systematic review and meta-analysis of 208 randomized controlled trials. Mol. Psychiatry 2022, 27, 2709–2719. [Google Scholar] [CrossRef]
- Lefaucheur, J.-P.; Aleman, A.; Baeken, C.; Benninger, D.H.; Brunelin, J.; Di Lazzaro, V.; Filipović, S.R.; Grefkes, C.; Hasan, A.; Hummel, F.C.; et al. Evidence-based guidelines on the therapeutic use of repetitive transcranial magnetic stimulation (rTMS): An update (2014–2018). Clin. Neurophysiol. 2020, 131, 474–528. [Google Scholar] [CrossRef]
- Kan, R.L.D.; Zhang, B.B.B.; Zhang, J.J.Q.; Kranz, G.S. Non-invasive brain stimulation for posttraumatic stress disorder: A systematic review and meta-analysis. Transl. Psychiatry 2020, 10, 168. [Google Scholar] [CrossRef]
- Kellner, C.H.; Greenberg, R.M.; Petrides, G.; Ahle, G.M.; Adams, D.A.; Liebman, L.S. Electroconvulsive Therapy Is a Noninvasive Brain Stimulation Technique. J. ECT 2016, 32, 70. [Google Scholar] [CrossRef] [PubMed]
- Padberg, F.; Bulubas, L.; Mizutani-Tiebel, Y.; Burkhardt, G.; Kranz, G.S.; Koutsouleris, N.; Kambeitz, J.; Hasan, A.; Takahashi, S.; Keeser, D.; et al. The intervention, the patient and the illness—Personalizing non-invasive brain stimulation in psychiatry. Exp. Neurol. 2021, 341, 113713. [Google Scholar] [CrossRef] [PubMed]
- Cirillo, G.; Di Pino, G.; Capone, F.; Ranieri, F.; Florio, L.; Todisco, V.; Tedeschi, G.; Funke, K.; Di Lazzaro, V. Neurobiological after-effects of non-invasive brain stimulation. Brain Stimul. 2017, 10, 1–18. [Google Scholar] [CrossRef] [PubMed]
- Tateishi, H.; Mizoguchi, Y.; Monji, A. Is the Therapeutic Mechanism of Repetitive Transcranial Magnetic Stimulation in Cognitive Dysfunctions of Depression Related to the Neuroinflammatory Processes in Depression? Front. Psychiatry 2022, 13, 834425. [Google Scholar] [CrossRef] [PubMed]
- Baldinger-Melich, P.; Gryglewski, G.; Philippe, C.; James, G.M.; Vraka, C.; Silberbauer, L.; Balber, T.; Vanicek, T.; Pichler, V.; Unterholzner, J.; et al. The effect of electroconvulsive therapy on cerebral monoamine oxidase A expression in treatment-resistant depression investigated using positron emission tomography. Brain Stimul. 2019, 12, 714–723. [Google Scholar] [CrossRef]
- Yrondi, A.; Sporer, M.; Péran, P.; Schmitt, L.; Arbus, C.; Sauvaget, A. Electroconvulsive therapy, depression, the immune system and inflammation: A systematic review. Brain Stimul. 2018, 11, 29–51. [Google Scholar] [CrossRef] [PubMed]
- Tricco, A.C.; Lillie, E.; Zarin, W.; O’Brien, K.K.; Colquhoun, H.; Levac, D.; Moher, D.; Peters, M.D.J.; Horsley, T.; Weeks, L.; et al. PRISMA Extension for Scoping Reviews (PRISMA-ScR): Checklist and Explanation. Ann. Intern. Med. 2018, 169, 467–473. [Google Scholar] [CrossRef]
- Maier, M.; Bartoš, F.; Wagenmakers, E.-J. Robust Bayesian meta-analysis: Addressing publication bias with model-averaging. Psychol. Methods 2022. [Google Scholar] [CrossRef]
- Lee, M.D.; Wagenmakers, E.-J. Bayesian Cognitive Modeling; Cambridge University Press: Cambridge, UK, 2014. [Google Scholar]
- Rosenthal, R. Meta-Analytic Procedures for Social Research; SAGE Publications, Inc.: New York, NY, USA, 1991. [Google Scholar]
- Higgins, J.P.T.; Li, T.; Deeks, J.J. Choosing effect measures and computing estimates of effect. In Cochrane Handbook for Systematic Reviews of Interventions; John Wiley & Sons, Inc.: Hoboken, NJ, USA, 2019; pp. 143–176. [Google Scholar]
- McGrath, S.; Zhao, X.; Steele, R.; Thombs, B.D.; Benedetti, A.; Levis, B.; Riehm, K.E.; Saadat, N.; Levis, A.W.; Azar, M.; et al. Estimating the sample mean and standard deviation from commonly reported quantiles in meta-analysis. Stat. Methods Med. Res. 2020. [Google Scholar] [CrossRef]
- Aarsland, T.I.; Leskauskaite, I.; Midttun, O.; Ulvik, A.; Ueland, P.M.; Oltedal, L.; Erchinger, V.J.; Oedegaard, K.J.; Haavik, J.; Kessler, U. The effect of electroconvulsive therapy (ECT) on serum tryptophan metabolites. Brain Stimul. 2019, 12, 1135–1142. [Google Scholar] [CrossRef] [Green Version]
- Aberg-Wistedt, A.; Mårtensson, B.; Bertilsson, L.; Malmgren, R. Electroconvulsive Therapy Effects on Cerebrospinal Fluid Monoamine Metabolites and Platelet Serotonin Uptake In Melancholia. Convuls. Ther. 1986, 2, 91–98. [Google Scholar] [PubMed]
- Allen, A.P.; Naughton, M.; Dowling, J.; Walsh, A.; O’Shea, R.; Shorten, G.; Scott, L.; McLoughlin, D.M.; Cryan, J.F.; Clarke, G.; et al. Kynurenine pathway metabolism and the neurobiology of treatment-resistant depression: Comparison of multiple ketamine infusions and electroconvulsive therapy. J. Psychiatr. Res. 2018, 100, 24–32. [Google Scholar] [CrossRef] [PubMed]
- D’Elia, G.; Lehmann, J.; Raotma, H. Evaluation of the combination of tryptophan and ECT in the treatment of depression. Acta Psychiatr. Scand. 1977, 56, 319–334. [Google Scholar] [CrossRef] [PubMed]
- Guloksuz, S.; Arts, B.; Walter, S.; Drukker, M.; Rodriguez, L.; Myint, A.M.; Schwarz, M.J.; Ponds, R.; van Os, J.; Kenis, G.; et al. The impact of electroconvulsive therapy on the tryptophan-kynurenine metabolic pathway. Brain Behav. Immun. 2015, 48, 48–52. [Google Scholar] [CrossRef] [PubMed]
- Hasani, P.A.M.; Moghadam, F.M.; Mokhtaree, M.; Nazer, M. Effect of Electroconvulsive Therapy on Serum Serotonin Level in Patients with Treatment- Resistant Major Depressive Disorder. J. Evol. Med. Dent. Sci. 2019, 8, 1283–1286. [Google Scholar] [CrossRef]
- Hoekstra, R.; van den Broek, W.W.; Fekkes, D.; Bruijn, J.A.; Mulder, P.G.; Pepplinkhuizen, L. Effect of electroconvulsive therapy on biopterin and large neutral amino acids in severe, medication-resistant depression. Psychiatry Res. 2001, 103, 115–123. [Google Scholar] [CrossRef]
- Hoffmann, G.; Linkowski, P.; Kerkhofs, M.; Desmedt, D.; Mendlewicz, J. Effects of ECT on sleep and CSF biogenic amines in affective illness. Psychiatry Res. 1985, 16, 199–206. [Google Scholar] [CrossRef]
- Hofmann, P.; Loimer, N.; Chaudhry, H.R.; Pfersmann, D.; Schmid, R.; Wieselmann, G. 5-Hydroxy-indolacetic-acid (5-HIAA) serum levels in depressive patients and ECT. J. Psychiatr. Res. 1996, 30, 209–216. [Google Scholar] [CrossRef]
- Jori, A.; Dolfini, E.; Casati, C.; Argenta, G. Effect of ECT and imipramine treatment on the concentration of 5-hydroxyindoleacetic acid (5HIAA) and homovanillic acid (HVA) in the cerebrospinal fluid of depressed patients. Psychopharmacologia 1975, 44, 87–90. [Google Scholar] [CrossRef]
- Kirkegaard, C.; Mosller, S.E.; Bjosrum, N. Addition of L-tryptophan to electroconvulsive treatment in endogenous depression. A double-blind study. Acta Psychiatr. Scand. 1978, 58, 457–462. [Google Scholar] [CrossRef]
- Lestra, C.; d’Amato, T.; Ghaemmaghami, C.; Perret-Liaudet, A.; Broyer, M.; Renaud, B.; Dalery, J.; Chamba, G. Biological parameters in major depression: Effects of paroxetine, viloxazine, moclobemide, and electroconvulsive therapy. Relation to early clinical outcome. Biol. Psychiatry 1998, 44, 274–280. [Google Scholar] [CrossRef]
- Mokhtar, A.S.E.; Morgan, C.J.; Bradley, D.M.; Badawy, A.A.B. No early effects of electroconvulsive therapy on tryptophan metabolism and disposition in endogenous depression. Biol. Psychiatry 1997, 42, 201–205. [Google Scholar] [CrossRef]
- Nikisch, G.; Mathé, A.A. CSF monoamine metabolites and neuropeptides in depressed patients before and after electroconvulsive therapy. Eur. Psychiatry 2008, 23, 356–359. [Google Scholar] [CrossRef] [PubMed]
- Olajossy, M.; Olajossy, B.; Wnuk, S.; Potembska, E.; Urbańska, E. Blood serum concentrations of kynurenic acid in patients diagnosed with recurrent depressive disorder, depression in bipolar disorder, and schizoaffective disorder treated with electroconvulsive therapy. Psychiatr. Pol. 2017, 51, 455–468. [Google Scholar] [CrossRef] [PubMed]
- Palmio, J.; Huuhka, M.; Saransaari, P.; Oja, S.S.; Peltola, J.; Leinonen, E.; Suhonen, J.; Keränen, T. Changes in plasma amino acids after electroconvulsive therapy of depressed patients. Psychiatry Res. 2005, 137, 183–190. [Google Scholar] [CrossRef]
- Rudorfer, M.V.; Risby, E.D.; Hsiao, J.K.; Linnoila, M.; Potter, W.Z. Disparate Biochemical Actions of Electroconvulsive Therapy and Antidepressant Drugs. Convuls. Ther. 1988, 4, 133–140. [Google Scholar]
- Rudorfer, M.V.; Risby, E.D.; Osman, O.T.; Gold, P.W.; Potter, W.Z. Hypothalamic-pituitary-adrenal axis and monoamine transmitter activity in depression: A pilot study of central and peripheral effects of electroconvulsive therapy. Biol. Psychiatry 1991, 29, 253–264. [Google Scholar] [CrossRef]
- Ryan, K.M.; Allers, K.A.; Harkin, A.; McLoughlin, D.M. Blood plasma B vitamins in depression and the therapeutic response to electroconvulsive therapy. Brain Behav. Immun. Health 2020, 4, 100063. [Google Scholar] [CrossRef]
- Ryan, K.M.; Allers, K.A.; McLoughlin, D.M.; Harkin, A. Tryptophan metabolite concentrations in depressed patients before and after electroconvulsive therapy. Brain Behav. Immun. 2020, 83, 153–162. [Google Scholar] [CrossRef]
- Sawa, Y. The effect of electroconvulsive therapy on plasma cyclic-AMP, non-esterified fatty acid, tryptophan and tyrosine in depression. Keio J. Med. 1981, 30, 193–204. [Google Scholar] [CrossRef]
- Schwieler, L.; Samuelsson, M.; Frye, M.A.; Bhat, M.; Schuppe-Koistinen, I.; Jungholm, O.; Johansson, A.G.; Landén, M.; Sellgren, C.M.; Erhardt, S. Electroconvulsive therapy suppresses the neurotoxic branch of the kynurenine pathway in treatment-resistant depressed patients. J. Neuroinflamm. 2016, 13, 51. [Google Scholar] [CrossRef] [PubMed] [Green Version]
- Smith, D.F.; Strömgren, L.S. Influence of unilateral ECT on tryptophan metabolism in endogenous depression. Pharmacopsychiatria 1981, 14, 135–138. [Google Scholar] [CrossRef] [PubMed]
- Stelmasiak, Z.; Curzon, G. Effect of electroconvulsive therapy on plasma unesterified fatty acid and free tryptophan concentrations in man. J. Neurochem. 1974, 22, 603–604. [Google Scholar] [CrossRef] [PubMed]
- Udayakumar, M.A.; Subrahmanyam, T.S.; Ramanamurthy, P.S.V.; Haranath, P.S. Influence of single ECT on dopamine, noradrenaline and 5-hydroxytryptamine concentrations in CSF of schizophenics. Indian J. Med. Res. 1981, 74, 757–762. [Google Scholar] [PubMed]
- Whalley, L.J.; Yates, C.M.; Christie, J.E. Effect of electroconvulsive therapy (ECT) on plasma tryptophan. Psychol. Med. 1980, 10, 377–380. [Google Scholar] [CrossRef]
- Leblhuber, F.; Geisler, S.; Ehrlich, D.; Steiner, K.; Reibnegger, G.; Fuchs, D.; Kurz, K. Repetitive transcranial magnetic stimulation in the treatment of resistant depression: Changes of specific neurotransmitter precursor amino acids. J. Neural Transm. 2021, 128, 1225–1231. [Google Scholar] [CrossRef]
- Leblhuber, F.; Steiner, K.; Fuchs, D. Treatment of patients with geriatric depression with repetitive transcranial magnetic stimulation. J. Neural Transm. 2019, 126, 1105–1110. [Google Scholar] [CrossRef]
- Leblhuber, F.; Steiner, K.; Gostner, J.; Fuchs, D. Repetitive transcranial magnetic stimulation in patients with late life depression influences phenylalanine metabolism. Pteridines 2018, 29, 87–90. [Google Scholar] [CrossRef]
- Liu, S.; Wang, X.; Yu, R.; Sun, Y. Effect of transcranial magnetic stimulation on treatment effect and immune function. Saudi J. Biol. Sci. 2022, 29, 379–384. [Google Scholar] [CrossRef]
- Lu, R.; Zhang, C.; Liu, Y.; Wang, L.; Chen, X.; Zhou, X. The effect of bilateral low-frequency rTMS over dorsolateral prefrontal cortex on serum brain-derived neurotropic factor and serotonin in patients with generalized anxiety disorder. Neurosci. Lett. 2018, 684, 67–71. [Google Scholar] [CrossRef]
- Maestú, C.; Blanco, M.; Nevado, A.; Romero, J.; Rodriguez-Rubio, P.; Galindo, J.; Bautista Lorite, J.; de las Morenas, F.; Fernández-Argüelles, P. Reduction of pain thresholds in fibromyalgia after very low-intensity magnetic stimulation: A double-blinded, randomized placebo-controlled clinical trial. Pain Res. Manag. 2013, 18, e101–e106. [Google Scholar] [CrossRef] [PubMed] [Green Version]
- Miniussi, C.; Bonato, C.; Bignotti, S.; Gazzoli, A.; Gennarelli, M.; Pasqualetti, P.; Tura, G.B.; Ventriglia, M.; Rossini, P.M. Repetitive transcranial magnetic stimulation (rTMS) at high and low frequency: An efficacious therapy for major drug-resistant depression? Clin. Neurophysiol. 2005, 116, 1062–1071. [Google Scholar] [CrossRef] [PubMed]
- Niimi, M.; Ishima, T.; Hashimoto, K.; Hara, T.; Yamada, N.; Abo, M. Effect of repetitive transcranial magnetic stimulation on the kynurenine pathway in stroke patients. Neuroreport 2020, 31, 629–636. [Google Scholar] [CrossRef] [PubMed]
- Sibon, I.; Strafella, A.P.; Gravel, P.; Ko, J.H.; Booij, L.; Soucy, J.P.; Leyton, M.; Diksic, M.; Benkelfat, C. Acute prefrontal cortex TMS in healthy volunteers: Effects on brain 11C-alphaMtrp trapping. Neuroimage 2007, 34, 1658–1664. [Google Scholar] [CrossRef]
- Tateishi, H.; Setoyama, D.; Kang, D.; Matsushima, J.; Kojima, R.; Fujii, Y.; Mawatari, S.; Kikuchi, J.; Sakemura, Y.; Fukuchi, J.; et al. The changes in kynurenine metabolites induced by rTMS in treatment-resistant depression: A pilot study. J. Psychiatr. Res. 2021, 138, 194–199. [Google Scholar] [CrossRef] [PubMed]
- Tateishi, H.; Setoyama, D.; Kato, T.A.; Kang, D.; Matsushima, J.; Nogami, K.; Mawatari, S.; Kojima, R.; Fujii, Y.; Sakemura, Y.; et al. Changes in the metabolites of cerebrospinal fluid induced by rTMS in treatment-resistant depression: A pilot study. Psychiatry Res. 2022, 313, 114636. [Google Scholar] [CrossRef] [PubMed]
- Hadoush, H.; Alqudah, A.; Banihani, S.A.; Al-Jarrah, M.; Amro, A.; Aldajah, S. Melatonin serum level, sleep functions, and depression level after bilateral anodal transcranial direct current stimulation in patients with Parkinson’s disease: A feasibility study. Sleep Sci. 2021, 14, 25–30. [Google Scholar] [CrossRef]
- Evans, J.P.; Grahame-Smith, D.G.; Green, A.R.; Tordoff, A.F. Electroconvulsive shock increases the behavioural responses of rats to brain 5-hydroxytryptamine accumulation and central nervous system stimulant drugs. Br. J. Pharmacol. 1976, 56, 193–199. [Google Scholar] [CrossRef]
- Gur, E.; Dremencov, E.; Garcia, F.; Van de Kar, L.D.; Lerer, B.; Newman, M.E. Functional effects of chronic electroconvulsive shock on serotonergic 5-HT(1A) and 5-HT(1B) receptor activity in rat hippocampus and hypothalamus. Brain Res. 2002, 952, 52–60. [Google Scholar] [CrossRef]
- Juckel, G.; Mendlin, A.; Jacobs, B.L. Electrical stimulation of rat medial prefrontal cortex enhances forebrain serotonin output: Implications for electroconvulsive therapy and transcranial magnetic stimulation in depression. Neuropsychopharmacology 1999, 21, 391–398. [Google Scholar] [CrossRef]
- Karoum, F.; Korpi, E.R.; Chuang, L.W.; Linnoila, M.; Wyatt, R.J. The effects of desipramine, zimelidine, electroconvulsive treatment and lithium on rat brain biogenic amines: A comparison with peripheral changes. Eur. J. Pharmacol. 1986, 121, 377–385. [Google Scholar] [CrossRef]
- Khanna, N.K.; Lauria, P.; Sharma, V.N. 5-hydroxytryptamine content of the dog myocardium after chronic electroconvulsive therapy. Indian J. Physiol. Pharmacol. 1971, 15, 187–188. [Google Scholar] [PubMed]
- Madhav, T.R.; Pei, Q.; Grahame-Smith, D.G.; Zetterström, T.S. Repeated electroconvulsive shock promotes the sprouting of serotonergic axons in the lesioned rat hippocampus. Neuroscience 2000, 97, 677–683. [Google Scholar] [CrossRef]
- McIntyre, I.M.; Oxenkrug, G.F. Electroconvulsive shock: Effect on pineal and hypothalamic indoles. J. Pineal Res. 1984, 1, 273–279. [Google Scholar] [CrossRef] [PubMed]
- Shields, P.J. Effects of electroconvulsive shock on the metabolism of 5-hydroxytryptamine in the rat brain. J. Pharm. Pharmacol. 1972, 24, 919–920. [Google Scholar] [CrossRef] [PubMed]
- Sugrue, M.F. Some effects of chronic antidepressant treatments on rat brain monoaminergic systems. J. Neural Transm. 1983, 57, 281–295. [Google Scholar] [CrossRef] [PubMed]
- Tagliamonte, A.; Tagliamonte, P.; Di Chiara, G.; Gessa, R.; Gessa, G.L. Increase of brain tryptophan by electroconvulsive shock in rats. J. Neurochem. 1972, 19, 1509–1512. [Google Scholar] [CrossRef]
- Yoshida, K.; Higuchi, H.; Kamata, M.; Yoshimoto, M.; Shimizu, T.; Hishikawa, Y. Dopamine releasing response in rat striatum to single and repeated electroconvulsive shock treatment. Prog. Neuropsychopharmacol. Biol. Psychiatry 1997, 21, 707–715. [Google Scholar] [CrossRef]
- Yoshida, K.; Higuchi, H.; Kamata, M.; Yoshimoto, M.; Shimizu, T.; Hishikawa, Y. Single and repeated electroconvulsive shocks activate dopaminergic and 5-hydroxytryptaminergic neurotransmission in the frontal cortex of rats. Prog. Neuropsychopharmacol. Biol. Psychiatry 1998, 22, 435–444. [Google Scholar] [CrossRef]
- Ben-Shachar, D.; Belmaker, R.H.; Grisaru, N.; Klein, E. Transcranial magnetic stimulation induces alterations in brain monoamines. J. Neural Transm. 1997, 104, 191–197. [Google Scholar] [CrossRef]
- Ben-Shachar, D.; Gazawi, H.; Riboyad-Levin, J.; Klein, E. Chronic repetitive transcranial magnetic stimulation alters beta-adrenergic and 5-HT2 receptor characteristics in rat brain. Brain Res. 1999, 816, 78–83. [Google Scholar] [CrossRef]
- El Arfani, A.; Parthoens, J.; Demuyser, T.; Servaes, S.; De Coninck, M.; De Deyn, P.P.; Van Dam, D.; Wyckhuys, T.; Baeken, C.; Smolders, I.; et al. Accelerated high-frequency repetitive transcranial magnetic stimulation enhances motor activity in rats. Neuroscience 2017, 347, 103–110. [Google Scholar] [CrossRef] [PubMed]
- Gur, E.; Lerer, B.; Dremencov, E.; Newman, M.E. Chronic repetitive transcranial magnetic stimulation induces subsensitivity of presynaptic serotonergic autoreceptor activity in rat brain. Neuroreport 2000, 11, 2925–2929. [Google Scholar] [CrossRef]
- Heath, A.; Lindberg, D.R.; Makowiecki, K.; Gray, A.; Asp, A.J.; Rodger, J.; Choi, D.S.; Croarkin, P.E. Medium- and high-intensity rTMS reduces psychomotor agitation with distinct neurobiologic mechanisms. Transl. Psychiatry 2018, 8, 126. [Google Scholar] [CrossRef] [PubMed]
- Kanno, M.; Matsumoto, M.; Togashi, H.; Yoshioka, M.; Mano, Y. Effects of repetitive transcranial magnetic stimulation on behavioral and neurochemical changes in rats during an elevated plus-maze test. J. Neurol. Sci. 2003, 211, 5–14. [Google Scholar] [CrossRef]
- Kanno, M.; Matsumoto, M.; Togashi, H.; Yoshioka, M.; Mano, Y. Effects of acute repetitive transcranial magnetic stimulation on extracellular serotonin concentration in the rat prefrontal cortex. J. Pharmacol. Sci. 2003, 93, 451–457. [Google Scholar] [CrossRef]
- Kanno, M.; Matsumoto, M.; Togashi, H.; Yoshioka, M.; Mano, Y. Effects of acute repetitive transcranial magnetic stimulation on dopamine release in the rat dorsolateral striatum. J. Neurol. Sci. 2004, 217, 73–81. [Google Scholar] [CrossRef]
- Keck, M.E.; Sillaber, I.; Ebner, K.; Welt, T.; Toschi, N.; Kaehler, S.T.; Singewald, N.; Philippu, A.; Elbel, G.K.; Wotjak, C.T.; et al. Acute transcranial magnetic stimulation of frontal brain regions selectively modulates the release of vasopressin, biogenic amines and amino acids in the rat brain. Eur. J. Neurosci. 2000, 12, 3713–3720. [Google Scholar] [CrossRef]
- Kim, J.; Park, H.; Yu, S.L.; Jee, S.; Cheon, K.A.; Song, D.H.; Kim, S.J.; Im, W.Y.; Kang, J. Effects of high-frequency repetitive transcranial magnetic stimulation (rTMS) on spontaneously hypertensive rats, an animal model of attention-deficit/hyperactivity disorder. Int. J. Dev. Neurosci. 2016, 53, 83–89. [Google Scholar] [CrossRef]
- Löffler, S.; Gasca, F.; Richter, L.; Leipscher, U.; Trillenberg, P.; Moser, A. The effect of repetitive transcranial magnetic stimulation on monoamine outflow in the nucleus accumbens shell in freely moving rats. Neuropharmacology 2012, 63, 898–904. [Google Scholar] [CrossRef]
- Peng, Z.W.; Xue, F.; Zhou, C.H.; Zhang, R.G.; Wang, Y.; Liu, L.; Sang, H.F.; Wang, H.N.; Tan, Q.R. Repetitive transcranial magnetic stimulation inhibits Sirt1/MAO-A signaling in the prefrontal cortex in a rat model of depression and cortex-derived astrocytes. Mol. Cell. Biochem. 2018, 442, 59–72. [Google Scholar] [CrossRef] [PubMed]
- Poh, E.Z.; Hahne, D.; Moretti, J.; Harvey, A.R.; Clarke, M.W.; Rodger, J. Simultaneous quantification of dopamine, serotonin, their metabolites and amino acids by LC-MS/MS in mouse brain following repetitive transcranial magnetic stimulation. Neurochem. Int. 2019, 131, 104546. [Google Scholar] [CrossRef] [PubMed]
- Wang, S.; Wang, P.; Yin, R.; Xiao, M.; Zhang, Y.; Reinhardt, J.D.; Wang, H.; Xu, G. Combination of repetitive transcranial magnetic stimulation and treadmill training reduces hyperreflexia by rebalancing motoneuron excitability in rats after spinal cord contusion. Neurosci. Lett. 2022, 775, 136536. [Google Scholar] [CrossRef] [PubMed]
- Tanaka, T.; Takano, Y.; Tanaka, S.; Hironaka, N.; Kobayashi, K.; Hanakawa, T.; Watanabe, K.; Honda, M. Transcranial direct-current stimulation increases extracellular dopamine levels in the rat striatum. Front. Syst. Neurosci. 2013, 7, 6. [Google Scholar] [CrossRef]
- Cassidy, F.; Murry, E.; Weiner, R.D.; Carroll, B.J. Lack of relapse with tryptophan depletion following successful treatment with ECT. Am. J. Psychiatry 1997, 154, 1151–1152. [Google Scholar] [CrossRef]
- Cassidy, F.; Weiner, R.D.; Cooper, T.B.; Carroll, B.J. Combined catecholamine and indoleamine depletion following response to ECT. Br. J. Psychiatry 2010, 196, 493–494. [Google Scholar] [CrossRef]
- Chang, T.G.; Wang, C.H.; Chiu, N.Y.; Hsu, W.Y. Application of electroconvulsive therapy in treatment of retinitis pigmentosa comorbid with major depressive disorder and panic disorder. J. ECT 2011, 27, e57–e58. [Google Scholar] [CrossRef]
- Costain, D.W.; Grahame-Smith, D.G.; Green, A.R. Relevance of the enhanced 5-hydroxytryptamine behavioural responses in rats to electroconvulsive therapy [proceedings]. Br. J. Pharmacol. 1978, 62, 394P. [Google Scholar]
- D’Elia, G.; Lehmann, J.; Raotma, H. Influence of tryptophan on memory functions in depressive patients treated with unilateral ECT. Acta Psychiatr. Scand. 1978, 57, 259–268. [Google Scholar] [CrossRef]
- Green, A.R. Repeated exposure of rats to the convulsant agent flurothyl enhances 5-hydroxytryptamine- and dopamine-mediated behavioural responses. Br. J. Pharmacol. 1978, 62, 325–331. [Google Scholar] [CrossRef]
- Ikeda, T.; Kurosawa, M.; Uchikawa, C.; Kitayama, S.; Nukina, N. Modulation of monoamine transporter expression and function by repetitive transcranial magnetic stimulation. Biochem. Biophys. Res. Commun. 2005, 327, 218–224. [Google Scholar] [CrossRef]
- Krahn, L.E.; Gleber, E.; Rummans, T.A.; Pileggi, T.S.; Lucas, D.L.; Li, H. The effects of electroconvulsive therapy on melatonin. J. ECT 2000, 16, 391–398. [Google Scholar] [CrossRef] [PubMed]
- Kranaster, L.; Hoyer, C.; Mindt, S.; Neumaier, M.; Müller, N.; Zill, P.; Schwarz, M.J.; Moll, N.; Lutz, B.; Bindila, L.; et al. The novel seizure quality index for the antidepressant outcome prediction in electroconvulsive therapy: Association with biomarkers in the cerebrospinal fluid. Eur. Arch. Psychiatry Clin. Neurosci. 2020, 270, 911–919. [Google Scholar] [CrossRef] [PubMed]
- Liu, H.; Xiong, D.; Pang, R.; Deng, Q.; Sun, N.; Zheng, J.; Liu, J.; Xiang, W.; Chen, Z.; Lu, J.; et al. Effects of repetitive magnetic stimulation on motor function and GAP43 and 5-HT expression in rats with spinal cord injury. J. Int. Med. Res. 2020, 48. [Google Scholar] [CrossRef] [PubMed]
- Nordin, G.; Ottosson, J.O.; Roos, B.E. Influence of convulsive therapy on 5-hydroxyindoleacetic acid and homovanillic acid in cerebrospinal fluid in endogenous depression. Psychopharmacologia 1971, 20, 315–320. [Google Scholar] [CrossRef] [PubMed]
- Olajossy, M.; Olajossy, B.; Potembska, E.; Skoczen, N.; Wnuk, S.; Urbanska, E. Differences in the dynamics of changes in the concentration of kynurenic acid in the blood serum of depressed patients treated with electroconvulsive therapy. Psychiatr. Danub. 2018, 30, 331–339. [Google Scholar] [CrossRef]
- Papakostas, Y.G.; Markianos, M.; Zervas, I.M.; Theodoropoulou, M.; Vaidakis, N.; Daras, M. Administration of Citalopram Before ECT: Seizure Duration and Hormone Responses. J. ECT 2000, 16, 356–360. [Google Scholar] [CrossRef]
- Peng, Y.; Lin, Y.; Yu, N.W.; Liao, X.L.; Shi, L. The Clinical Efficacy and Possible Mechanism of Combination Treatment of Cerebral Ischemic Stroke with Ginkgo Biloba Extract and Low-Frequency Repetitive Transcranial Magnetic Stimulation. Sichuan Da Xue Xue Bao Yi Xue Ban 2021, 52, 883–889. [Google Scholar] [CrossRef]
- Potter, W.Z.; Rudorfer, M.V.; Pickar, D.; Linnoila, M. Effects of psychotropic drugs on neurotransmitters in man. Life Sci. 1987, 41, 817–820. [Google Scholar] [CrossRef]
- Price, W.A.; Zimmer, B. Effects of L-Tryptophan on Electroconvulsive Therapy Seizure Time. J. Nerv. Ment. Dis. 1985, 175, 636–638. [Google Scholar] [CrossRef]
- Rausch, J.L.; Rich, C.L.; Risch, S.C. Platelet serotonin transport after a single ECT. Psychopharmacology 1988, 95, 139–141. [Google Scholar] [CrossRef] [PubMed]
- Shiiba, S.J.; Yamamoto, S.; Sasaki, H.; Nishi, M.; Ishikawa, K.; Yasuda, S.; Tokuda, N.; Nakanishi, O.; Ishikawa, T. Cutaneous magnetic stimulation reduces rat chronic pain via activation of the supra-spinal descending pathway. Cell. Mol. Neurobiol. 2012, 32, 245–253. [Google Scholar] [CrossRef] [PubMed]
- Wägner, A.; Aberg-Wistedt, A.; Åsberg, M.; Bertilsson, L.; Mårtensson, B.; Montero, D. Effects of antidepressant treatments on platelet tritiated imipramine binding in major depressive disorder. Arch. Gen. Psychiatry 1987, 44, 870–877. [Google Scholar] [CrossRef] [PubMed]
- Abrams, R.; Essman, W.B.; Taylor, M.A.; Fink, M. Concentration of 5-hydroxyindoleacetic acid, homovanillic acid, and tryptophan in the cerebrospinal fluid of depressed patients before and after ECT. Biol. Psychiatry 1976, 11, 85–90. [Google Scholar] [PubMed]
- Belmaker, R.H.; Grisaru, N. Magnetic stimulation of the brain in animal depression models responsive to ECS. J. ECT 1998, 14, 194–205. [Google Scholar] [CrossRef]
- Mano, Y.; Funakawa, I.; Nakamuro, T.; Takayanagi, T.; Matsui, K. The kinesiological, chemical and pathological analysis in pulsed magnetic stimulation to the brain. Rinsho Shinkeigaku 1989, 29, 982–988. [Google Scholar]
- Molnár, L.; Degrell, I.; Rochlitz, S. Effect of bilateral and unilateral electroconvulsive therapy (ECT) on the composition of the cerebrospinal fluid (CSF). A possibility to calculate the intracellular redox changes of the brain in humans (author’s transl). Arch. Psychiatr. Nervenkr. 1979, 227, 159–169. [Google Scholar] [CrossRef]
- Mohamad Safiai, N.I.; Amir, N.A.; Basri, H.; Inche Mat, L.N.; Hoo, F.K.; Yusof Khan, A.H.K.; Loh, W.C.; Chia, P.K.; Ramachandran, V.; Mat Din, H.; et al. Effectiveness and tolerability of repetitive transcranial magnetic stimulation for preventive treatment of episodic migraine: A single-centre, randomised, double-blind, sham-controlled phase 2 trial (Magnet-EM). Trials 2020, 21, 923. [Google Scholar] [CrossRef]
- Papakostas, Y.; Markianos, M.; Papadimitriou, G.; Stefanis, C. Thyrotropin and Prolactin Secretion During ECT: Implications for the Mechanism of ECT Action. Convuls. Ther. 1990, 6, 214–220. [Google Scholar]
- Wang, M.; Li, Y.; Wang, X.; Guo, M. Study on the influence of simulative EEG modulation magnetic field on the discharge of median raphe nuclei. Sheng Wu Yi Xue Gong Cheng Xue Za Zhi 2004, 21, 219–224. [Google Scholar]
- Dalal, P.K.; Lal, N.; Trivedi, J.K.; Seth, P.K.; Agarwal, A.K.; Khalid, A. Ect and platelet 5ht uptake in major depression. Indian J. Psychiatry 1997, 39, 272–277. [Google Scholar] [PubMed]
- D’Elia, G.; Lehmann, J.; Raotma, H. Bimodal distribution of serum trypotphan level. Acta Psychiatr. Scand. 1979, 60, 10–16. [Google Scholar] [CrossRef] [PubMed]
- Tateishi, H.; Mizoguchi, Y.; Kawaguchi, A.; Imamura, Y.; Matsushima, J.; Kunitake, H.; Murakawa, T.; Haraguchi, Y.; Kunitake, Y.; Maekawa, T.; et al. Changes in interleukin-1 beta induced by rTMS are significantly correlated with partial improvement of cognitive dysfunction in treatment-resistant depression: A pilot study. Psychiatry Res. 2020, 289, 112995. [Google Scholar] [CrossRef] [PubMed]
- Iseger, T.A.; van Bueren, N.E.R.; Kenemans, J.L.; Gevirtz, R.; Arns, M. A frontal-vagal network theory for Major Depressive Disorder: Implications for optimizing neuromodulation techniques. Brain Stimul. 2020, 13, 1–9. [Google Scholar] [CrossRef]
- Michael, J.A.; Kaur, M. The Heart-Brain Connection in Depression: Can it inform a personalised approach for repetitive transcranial magnetic stimulation (rTMS) treatment? Neurosci. Biobehav. Rev. 2021, 127, 136–143. [Google Scholar] [CrossRef]
- Iseger, T.A.; Arns, M.; Downar, J.; Blumberger, D.M.; Daskalakis, Z.J.; Vila-Rodriguez, F. Cardiovascular differences between sham and active iTBS related to treatment response in MDD. Brain Stimul. 2020, 13, 167–174. [Google Scholar] [CrossRef]
- Fukui, S.; Schwarcz, R.; Rapoport, S.I.; Takada, Y.; Smith, Q.R. Blood-brain barrier transport of kynurenines: Implications for brain synthesis and metabolism. J. Neurochem. 1991, 56, 2007–2017. [Google Scholar] [CrossRef]
- Meier, T.B.; Drevets, W.C.; Wurfel, B.E.; Ford, B.N.; Morris, H.M.; Victor, T.A.; Bodurka, J.; Teague, T.K.; Dantzer, R.; Savitz, J. Relationship between neurotoxic kynurenine metabolites and reductions in right medial prefrontal cortical thickness in major depressive disorder. Brain Behav. Immun. 2016, 53, 39–48. [Google Scholar] [CrossRef]
- Savitz, J.; Dantzer, R.; Wurfel, B.E.; Victor, T.A.; Ford, B.N.; Bodurka, J.; Bellgowan, P.S.; Teague, T.K.; Drevets, W.C. Neuroprotective kynurenine metabolite indices are abnormally reduced and positively associated with hippocampal and amygdalar volume in bipolar disorder. Psychoneuroendocrinology 2015, 52, 200–211. [Google Scholar] [CrossRef]
- Baeken, C.; De Raedt, R.; Bossuyt, A.; Van Hove, C.; Mertens, J.; Dobbeleir, A.; Blanckaert, P.; Goethals, I. The impact of HF-rTMS treatment on serotonin(2A) receptors in unipolar melancholic depression. Brain Stimul. 2011, 4, 104–111. [Google Scholar] [CrossRef]
- Vaidya, V.A.; Marek, G.J.; Aghajanian, G.K.; Duman, R.S. 5-HT2A receptor-mediated regulation of brain-derived neurotrophic factor mRNA in the hippocampus and the neocortex. J. Neurosci. 1997, 17, 2785–2795. [Google Scholar] [CrossRef]
- Baldinger, P.; Lotan, A.; Frey, R.; Kasper, S.; Lerer, B.; Lanzenberger, R. Neurotransmitters and electroconvulsive therapy. J. ECT 2014, 30, 116–121. [Google Scholar] [CrossRef] [PubMed]
- Saijo, T.; Takano, A.; Suhara, T.; Arakawa, R.; Okumura, M.; Ichimiya, T.; Ito, H.; Okubo, Y. Effect of electroconvulsive therapy on 5-HT1A receptor binding in patients with depression: A PET study with [11C]WAY 100635. Int. J. Neuropsychopharmacol. 2010, 13, 785–791. [Google Scholar] [CrossRef] [PubMed]
- Lanzenberger, R.; Baldinger, P.; Hahn, A.; Ungersboeck, J.; Mitterhauser, M.; Winkler, D.; Micskei, Z.; Stein, P.; Karanikas, G.; Wadsak, W.; et al. Global decrease of serotonin-1A receptor binding after electroconvulsive therapy in major depression measured by PET. Mol. Psychiatry 2013, 18, 93–100. [Google Scholar] [CrossRef]
- Yatham, L.N.; Liddle, P.F.; Lam, R.W.; Zis, A.P.; Stoessl, A.J.; Sossi, V.; Adam, M.J.; Ruth, T.J. Effect of electroconvulsive therapy on brain 5-HT(2) receptors in major depression. Br. J. Psychiatry 2010, 196, 474–479. [Google Scholar] [CrossRef] [Green Version]
- Wilkinson, S.T.; Holtzheimer, P.E.; Gao, S.; Kirwin, D.S.; Price, R.B. Leveraging Neuroplasticity to Enhance Adaptive Learning: The Potential for Synergistic Somatic-Behavioral Treatment Combinations to Improve Clinical Outcomes in Depression. Biol. Psychiatry 2019, 85, 454–465. [Google Scholar] [CrossRef] [PubMed]
- Winter, N.R.; Leenings, R.; Ernsting, J.; Sarink, K.; Fisch, L.; Emden, D.; Blanke, J.; Goltermann, J.; Opel, N.; Barkhau, C.; et al. Quantifying Deviations of Brain Structure and Function in Major Depressive Disorder Across Neuroimaging Modalities. JAMA Psychiatry 2022. [Google Scholar] [CrossRef] [PubMed]
- Bucolo, M.; Buscarino, A.; Fortuna, L.; Gagliano, S. Can Noise in the Feedback Improve the Performance of a Control System? J. Phys. Soc. Jpn. 2021, 90, 075002. [Google Scholar] [CrossRef]
- Corradino, C.; Bucolo, M. Automatic preprocessing of EEG signals in long time scale. In Proceedings of the 37th Annual International Conference of the IEEE Engineering in Medicine and Biology Society, Milan, Italy, 25–29 August 2015; pp. 4110–4113. [Google Scholar]
- Fortuna, L.; Bucolo, M.; Frasca, M.; La Rosa, M.; Shannahoff-Khalsa, D.S.; Schult, R.L.; Wright, J.A. Independent component analysis of magnetoencephalography data. In Proceedings of the 23rd Annual International Conference of the IEEE, Istanbul, Turkey, 25–28 October 2001; pp. 1981–1984. [Google Scholar]


| Patient | Human or animal models; can be healthy or with an underlying health condition. |
| Intervention | NIBS techniques: ECT, rTMS, or tDCS |
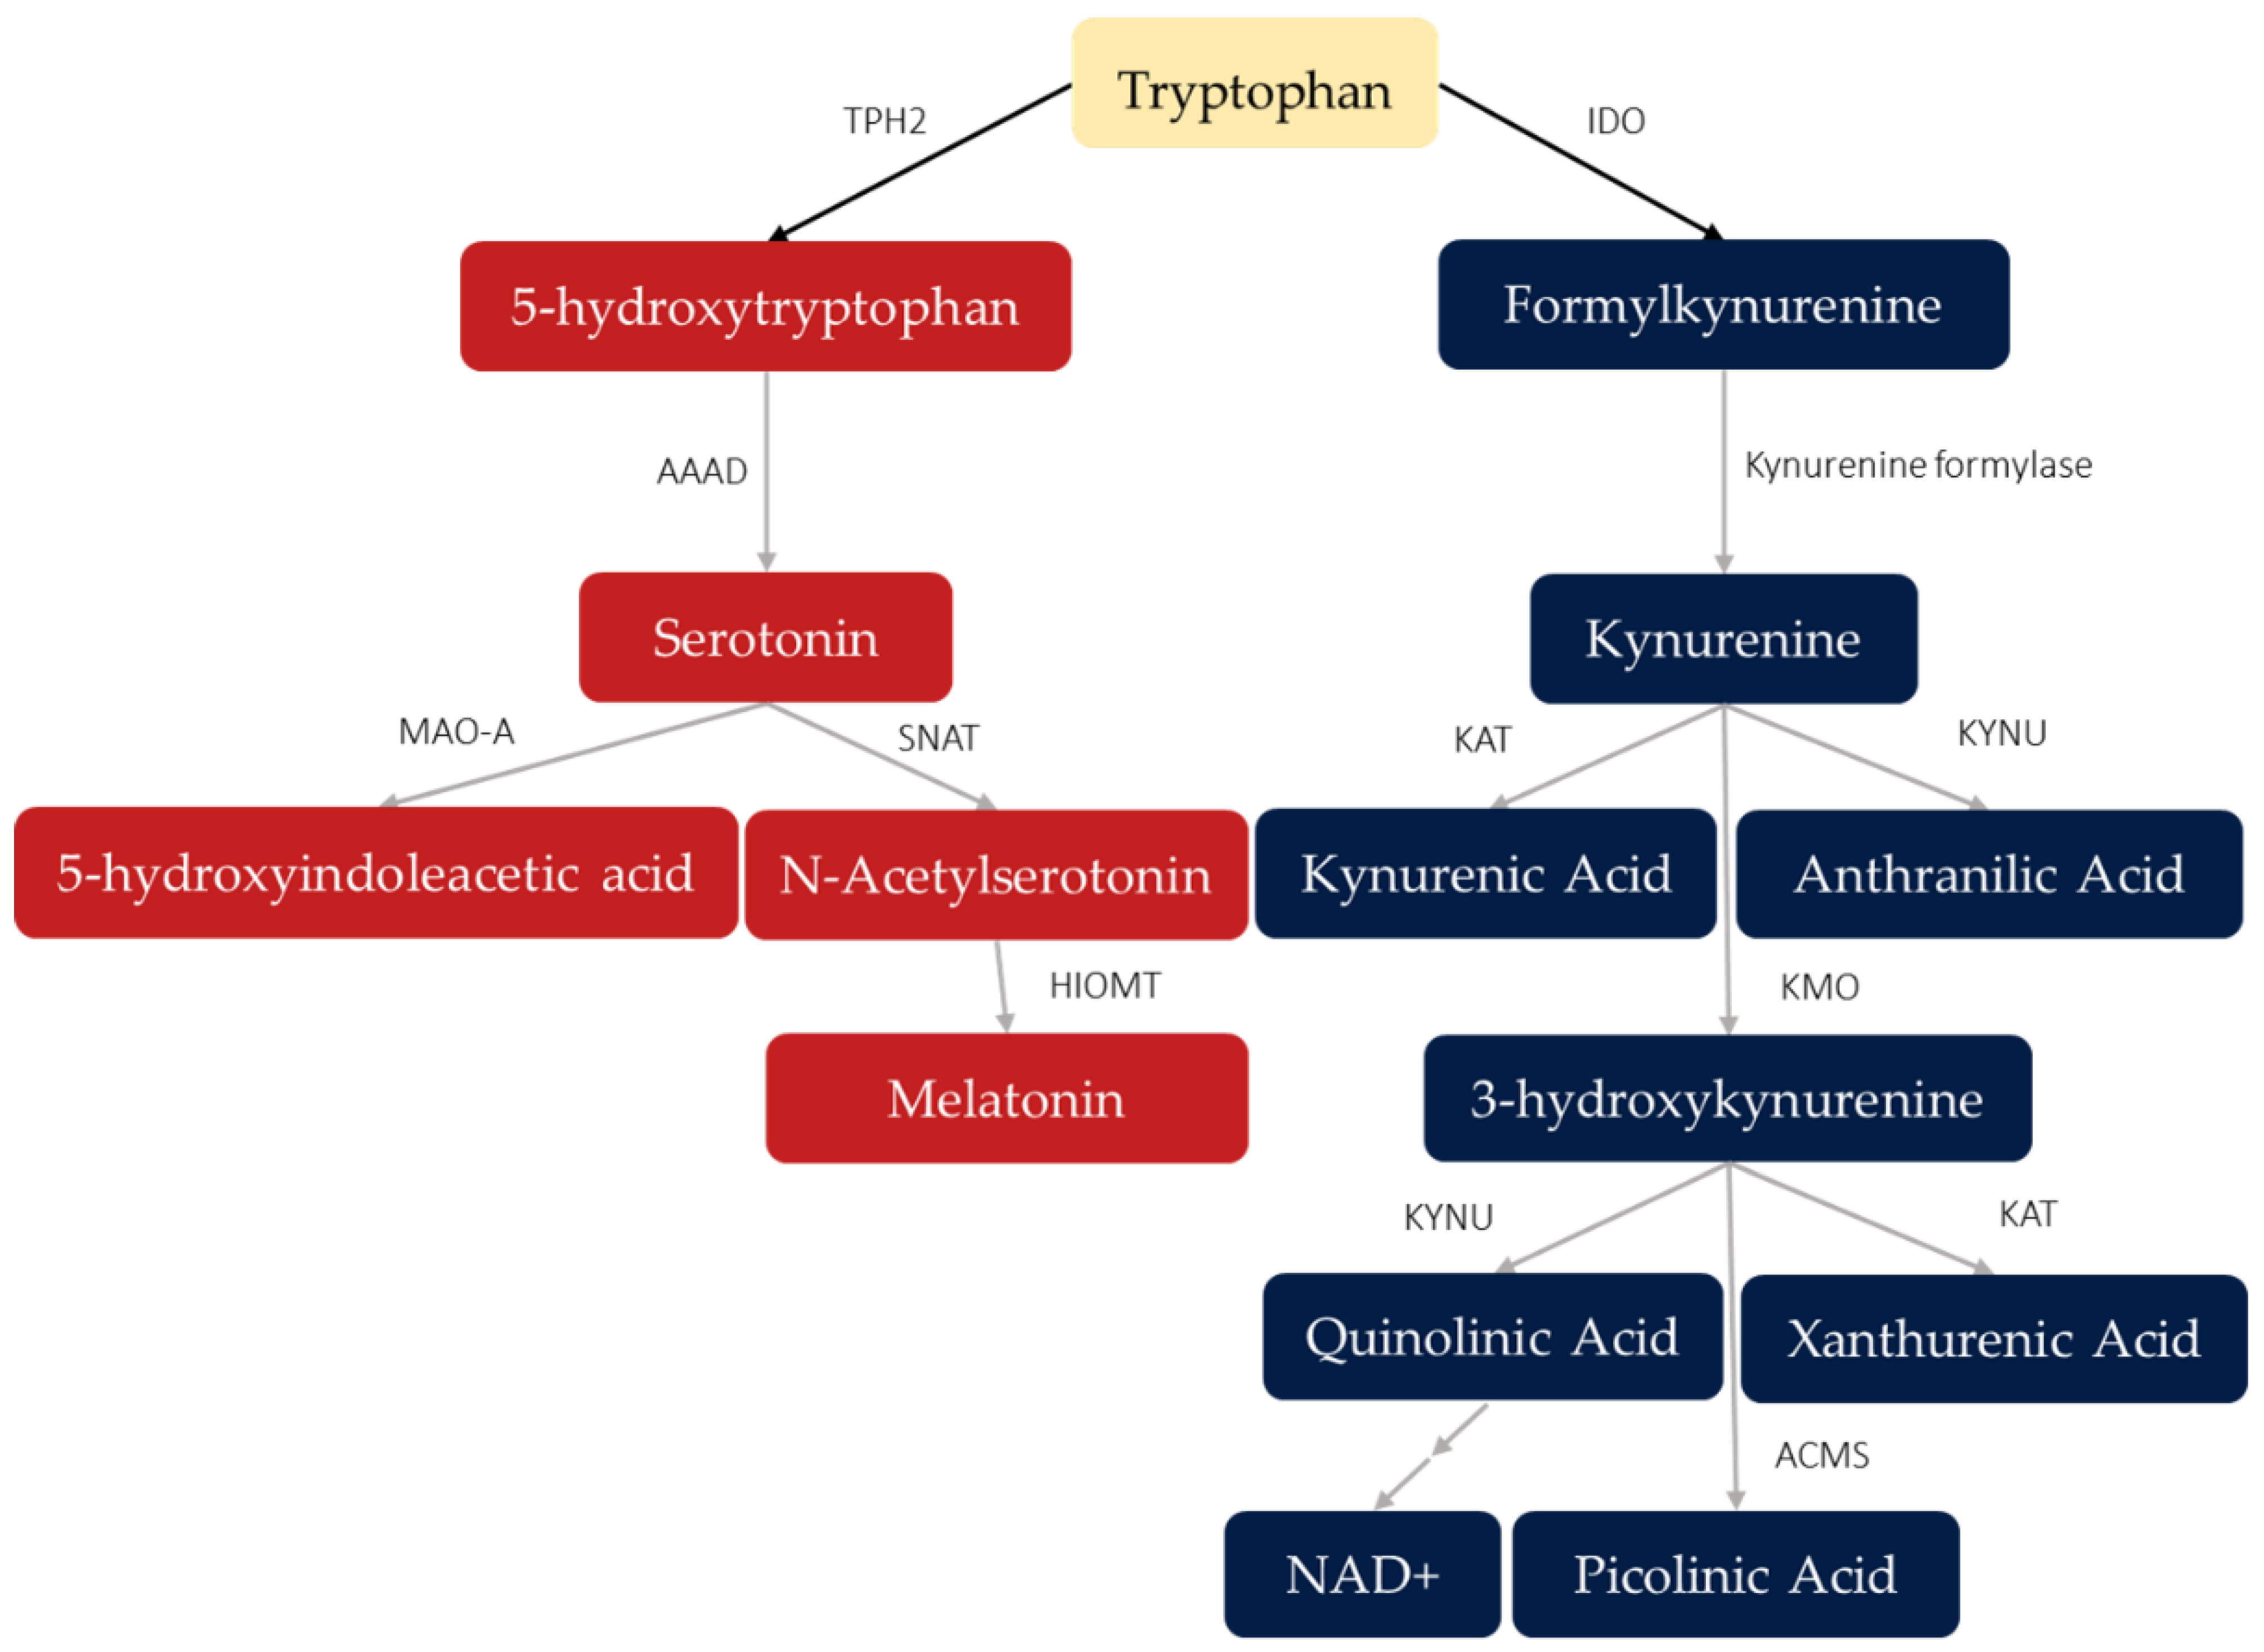
| Comparison | Biomarkers of interest assessed: tryptophan (TRP), kynurenine (KYN), formylkynurenine, kynurenic acid (KA), quinolinic acid (QA), NAD+, 3-hydroxykynurenine (3-HK), xanthurenic acid (XA), picolinic acid (PA), anthranilic acid (AA), serotonin (5-HT), oxitriptan, 5-hydroxytryptamine (5-HT), 5-hydroxyindoleacetic acid (5-HIAA), N-acetyl-5-HT, or melatonin. Measures of their concentrations must be reported and compared to baseline levels, e.g., measures obtained before and again during or after NIBS, or comparison of animal models that received active versus sham NIBS. Studies without a control group can be included, so long as baseline measures are clearly defined. |
| Outcome | Biomarkers must measure serotonin or kynurenine pathway activation, sampled peripherally or centrally (e.g., CSF, plasma/serum, microdialysis, brain tissue analysis in animal models). Changes in health condition will be collected if available (e.g., in humans, clinical scales; in rodents, task specific performance) |
| Study | Design | Protocol | Participants | Demographics | Source | Timing of Post-NIBS Sampling | Biomarker | Result |
|---|---|---|---|---|---|---|---|---|
| ECT | ||||||||
| Aarsland et al., 2019 [33] | pretest-posttest | Site: right unilateral Seizure length: *median 50.7 s, IQR 16 s Session N: *max. 20 Session freq.: 3/week | depression (uni- and bipolar, with and without psychotic symptoms) | N: 21 M:F: 44:56% * Age: median 46, IQR 21.0 * | serum | 1–2 weeks after the last session (median 10 days, IQR 6) | TRP | ns |
| KYN | ns | |||||||
| KA | ns | |||||||
| 3-HK | ns | |||||||
| QA | ns | |||||||
| PA | ↑ | |||||||
| XA | ns | |||||||
| AA | ns | |||||||
| KYN/TRP | ns | |||||||
| KA/KYN | ns | |||||||
| KA/3-HK | ns | |||||||
| QA/KA | ns | |||||||
| XA/3-HK | ns | |||||||
| PA/QA | ↑ | |||||||
| Aberg-Wistedt et al., 1986 [34] | pretest-posttest | Site: bifrontotemporal Seizure length: 45.0 ± 8.2 s * Session N: 8.0 ± 3.1 * Session freq.: 3/week | depression (unipolar, without psychotic symptoms) | N: 11 M:F: 33:67% * Age: 56 ± 16.2 * | CSF | 3 weeks after the last session | 5-HIAA | ns |
| Allen et al., 2018 [35] | pretest-posttest | Site: bitemporal Session N: max. 6 Session freq.: 2/week | TRD (unipolar) | N: 18 M:F: 33:67% Age: 57.5 ± 14.7 | plasma | 4–7 days after the last session | TRP | ns |
| KYN | ns | |||||||
| KA | ns | |||||||
| KYN/TRP | ns | |||||||
| KA/KYN | ns | |||||||
| D’Elia et al., 1977 [36] | pretest-posttest | Site: nondominant unilateral Session N: mean 6.1, range 3–12 | depression (uni- and bipolar) | N: 24 M:F: 38:63% Age: 48.0 ± 12.5, range 22–64 | serum | mean of levels sampled before each session from the second to the last. | TRP | ns |
| Guloksuz et al., 2015 [37] | pretest-posttest | Site: bifrontotemporal Seizure length: mean 52 s, range 10–200 s Session N: mean 6.1, range 3–11 Session freq.: 2/week | TRD (uni- and bipolar) | N: 19 M:F: 32:68% Age: 52.6 ± 14.4, range 23–74 | serum | before every other session | TRP | ns |
| KYN | ns | |||||||
| KA | ↑ | |||||||
| 3-HK | ns | |||||||
| 5-HIAA | ns | |||||||
| KYN/TRP | ↑ | |||||||
| KA/KYN | ↑ | |||||||
| KA/3-HK | ↑ | |||||||
| 5-HIAA/KYN | ns | |||||||
| Hasani et al., 2019 [38] | parallel | Site: bifrontotemporal Session N: 6–8 Session freq.: every other day | TRD (unipolar) | Exp. group N: 21 Age: 35.24 ± 14.17 Control group N: 15 Age: 33.26 ± 13.59 | plasma | 16 days after the first session | 5-HT | ↑ (posttest) |
| 30 days after the first session | ↑ (posttest) | |||||||
| Hoekstra et al., 2001 [39] | pretest-posttest | Site: unilateral and bifrontotemporal Session N: mean 11 Session freq.: 2/week | TRD (unipolar, with and without psychotic symptoms) | N: 20 M:F: 35:65% Age: 52 ± 13.1 | plasma | the morning after the final session | TRP | ns |
| Hoffmann et al., 1985 [40] | pretest-posttest | Site: bitemporal Session N: mean 11, range 6–19 * Session freq.: 3/week | depression (uni- and bipolar, with and without psychotic symptoms) | N: 7 all male Age: 46 ± 11.2, range 29–61 | CSF | 12 days after the last session | 5-HIAA | ns |
| Hofmann et al., 1996 [41] | pretest-posttest | Site: bifrontotemporal Seizure length: 40.48 ± 14.12 s Session N: 1 | depression (unipolar) | N: 31 M:F: 29:71% Age: 37.22 ± 13.98 | serum | 1 min after the session | 5-HIAA | ns |
| 1 h after the session | ↓ | |||||||
| 2 h after the session | ↓ | |||||||
| Jori et al., 1975 [42] | pretest-posttest | Session N: 4–8 | depression (with psychotic symptoms) | N: 12 M:F: 88:12% * Age: mean 45, range 25–63 * | CSF | 7 days after the final session | 5-HIAA | ↑ |
| Kirkegaard, Møller and Bjørum, 1978 [43] | pretest-posttest | Site: unilateral Session N: 10.5 ± 2.6 Session freq.: 2/week | depression (uni- and bipolar) | N: 10 M:F: 30:70% Age: mean 63 | CSF | - | TRP | ns |
| plasma | TRP | ↓ | ||||||
| free TRP | ns | |||||||
| free/total TRP | ↑ | |||||||
| Lestra et al., 1998 [44] | pretest-posttest | Session N: 5–9 Session freq.: every 3 or 4 days | depression (unipolar) | N: 6 M:F: 43:57% * Age: range 27–70 * | platelet pellet | 10 days after the last session | 5-HT | ns |
| Mokhtar et al., 1997 [45] | pretest-posttest | Site: bilateral Seizure length: 20 s in nine, a mild fit in one Session N: 1 | depression (uni- and bipolar) | N: 10 M:F: 50:50% Age: mean 48.5, SEM 4.3 | serum | 15 min after the session | TRP | ns |
| 30 min after the session | ns | |||||||
| 45 min after the session | ↓ | |||||||
| 1 h after the session | ↓ | |||||||
| Nikisch and Mathé, 2008 [46] | pretest-posttest | Site: unilateral Session N: 8 Session freq.: 2/week | TRD (unipolar, with and without psychotic symptoms) | N: 6 M:F: 83:17% Age: 40 ± 8 | CSF | 1 week after the last session | 5-HIAA | ↑ |
| Olajossy et al., 2017 [47] | pretest-posttest | Site: bifrontotemporal Session N: 12 Session freq.: 2/week | recurrent depressive disorder | N: 32 M:F: 41:59% Age: 49.41 ± 12.73 | serum | 30 min after the first, sixth, and 12th sessions | KA | ns |
| depression in bipolar disorder | N: 11 M:F: 36:64% Age: 44.73 ± 13.83 | ns | ||||||
| schizoaffective disorder | N: 7 M:F: 43:57% Age: 33.29 ± 8.56 | ns | ||||||
| Palmio et al., 2005 [48] | pretest-posttest | Site: bilateral Seizure length: 45.7 ± 13.2, range 21–66 Session N: 3.8 ± 2.2, range 1–7 | depression (unipolar, with and without psychotic symptoms) | N: 10 M:F: 30:70% Age: 55.6 ± 15.8, range 28–73 | plasma | 2 h after the last session | TRP | ↑ |
| 6 h after the last session | ↑ | |||||||
| 24 h after the last session | ↑ | |||||||
| 48 h after the last session | ns | |||||||
| Rudorfer et al., 1988 [49] | pretest-posttest | Site: uni- and bilateral Seizure length: at least 25 s Session N: 14.3 ± 1.2, range 13–15 | depression (unipolar) | N: 3 all female Age: 48.7 ± 22.0, range 35–74 | CSF | 4–5 days after the last session | 5-HIAA | No statistical tests: levels reportedly increased in 2 of 3 patients. |
| Rudorfer et al., 1991 [50] | pretest-posttest | Site: uni- and bilateral Seizure length: at least 25 s Session N: 13.6 ± 3.3, range 9–19 | TRD (unipolar) | N: 8 M:F: 25:75% Age: 53.1 ± 13.2, range 35–71 | CSF | 5–10 days after the last session | 5-HIAA | ns |
| Ryan et al., 2020 [51] | pretest-posttest | Site: unilateral and bitemporal Session N: 7.97 ± 2.46 Session freq.: 2/week | depression (uni- and bipolar, with and without psychotic symptoms) | N: 94 M:F: 38:62% Age: 55.48 ± 14.72 | plasma | 1–3 days after the last session | XA/3-HK | ns |
| Ryan et al., 2020 [52] | pretest-posttest | Site: unilateral and bitemporal Session N: 7.96 ± 2.47 Session freq.: 2/week | depression (uni- and bipolar, with and without psychotic symptoms) | N: 94 M:F: 38:62% Age: 55.48 ± 14.72 | plasma | 1–3 days after the last session | TRP | ns |
| KYN | ns | |||||||
| KA | ns | |||||||
| 3-HK | ns | |||||||
| QA | ns | |||||||
| PA | ns | |||||||
| XA | ns | |||||||
| AA | ns | |||||||
| KYN/TRP | ns | |||||||
| KA/KYN | ns | |||||||
| QA/KA | ns | |||||||
| QA/KYN | ns | |||||||
| Sawa, 1981 [53] | pretest-posttest | Session N: 1 | depression (uni- and bipolar) | N: 9 M:F: 44:56% Age: 40.7 ± 11.8, range 20–52 | plasma | 1 min after the session | TRP | ns |
| free TRP | ↑ | |||||||
| 5 min after the session | TRP | ↓ | ||||||
| free TRP | ns | |||||||
| 10 min after the session | TRP | ↓ | ||||||
| free TRP | ns | |||||||
| 30 min after the session | TRP | ns | ||||||
| free TRP | ns | |||||||
| 1 h after the session | TRP | ns | ||||||
| free TRP | ↓ | |||||||
| Schwieler et al., 2016 [54] | pretest-posttest | Site: right unilateral Session N: 3 | TRD (unipolar) | N: 15 M:F: 58:42% * Age: median 41.0, IQR 25.0–54.0 * | plasma | - | TRP | ↓ |
| KYN | ↓ $ | |||||||
| KA | ns | |||||||
| QA | ↓ | |||||||
| KYN/TRP | ns | |||||||
| QA/KA | ↓ | |||||||
| Smith and Strömgren, 1981 [55] | pretest-posttest | Site: nondominant unilateral Session freq.: 4/week | depression | N: 13 M:F: 69:31% Age: 42.7 ± 12.5, range 24–61 | serum | 9 am on the day after the last session | TRP | ns |
| Stelmasiak and Curzon, 1974 [56] | pretest-posttest | Site: unilateral Session N: 1 | depression | N: 18 M:F: 39:61% Age: mean 48, range 20–70 | plasma | 1 min after the session | TRP | ns |
| free TRP | ↑ | |||||||
| 15 min after the session | TRP | ns | ||||||
| free TRP | ↑ | |||||||
| 30 min after the session | TRP | ns | ||||||
| free TRP | ns | |||||||
| 1 h after the session | TRP | ns | ||||||
| free TRP | ns | |||||||
| Udayakumar et al., 1981 [57] | pretest-posttest | Site: bitemporal Session N: 1 | schizophrenia | N: 29 M:F: 66:34% Age: 27.4 ± 8.0, range 14–49 | CSF | 5 min after the session | 5-HT | ↑ |
| 48–72 h after the session | ns | |||||||
| Whalley, Yates and Christie, 1980 [58] | pretest-posttest | Session N: 4–9 * | depression (unipolar, without psychotic symptoms) | N: 11 M:F: 25:75% * Age: 49 ± 13.9 * | plasma | 10 min after the first session | TRP | ↓ |
| free TRP | ns | |||||||
| immediately before the last session | TRP | ns # | ||||||
| free TRP | ns # | |||||||
| 12 weeks after the last session | TRP | ns $ | ||||||
| free TRP | ns $ | |||||||
| TMS | ||||||||
| Leblhuber et al., 2021 [59] | pretest-posttest | Site: medial frontopolar cortex Pulse freq.: 20 Hz Intensity: 1.5 T Pulse N: 2400 Session N: 10 Session freq.: 5/week | TRD (unipolar) | N: 21 M:F: 48:52% Age: 59.4 ± 15.7 | serum | - | TRP | ns |
| KYN | ns | |||||||
| KYN/TRP | ns | |||||||
| Leblhuber, Steiner and Fuchs, 2019 [60] | parallel | Site: bilateral prefrontal cortex Pulse freq.: 3 Hz Intensity: 0.08 T Pulse N: 30 min Session N: 10 Session freq.: 5/week | TRD (geriatric) | Exp. group N: 19 M:F: 45:55% * Age: mean 71.9, SEM 2.92 Control group N: 10 M:F: 45:55% * Age: mean 73.3, SEM 2.69 | serum | immediately after the last session | TRP | ns (group x time) |
| KYN | ns (group x time) | |||||||
| KYN/TRP | ns (group x time) | |||||||
| Leblhuber et al., 2018 [61] | pretest-posttest | Site: bilateral prefrontal cortex Pulse freq.: 3 Hz Intensity: above 100% MT Session N: 10 | TRD (geriatric) | N: 10 M:F: 40:60% Age: 69 ± 8.78 | serum | - | TRP | ns |
| KYN | ns | |||||||
| KYN/TRP | ns | |||||||
| Liu et al., 2022 [62] | parallel | Site: bilateral dorsolateral and ventrolateral prefrontal cortex Pulse freq.: 0.5 Hz Intensity: 0.70 T Session N: 8 Session freq.: 5/week | post-stroke depression | Exp. group N: 35 M:F: 57:43% Age: 55.61 ± 6.84 Control group N: 35 M:F: 66:34% Age: 50.20 ± 6.28 | serum | 8 weeks after the last session | 5-HT | ↑ (posttest) |
| Lu et al., 2018 [63] | pretest-posttest | Site: bilateral dorsolateral prefrontal cortex Pulse freq.: 1 Hz Intensity: 80% MT Pulse N: 750 Session N: 10 Session freq.: 5/week | generalized anxiety disorders | N: 28 M:F: 39:61% Age: 45.5 ± 12.67, range 27–72 | serum | 1 h after the last session | 5-HT | ↑ |
| Maestú et al., 2013 [64] | parallel | Site: 33 stimulation coils distributed evenly across an EEG cap Pulse freq.: 8 Hz Intensity: 43 nT Pulse N: 20 min Session N: 8 Session freq.: 1/week | fibromyalgia | Exp. group N: 28 all female Age: 40.7 ± 6.7 * Control group N: 26 all female Age: 40.7 ± 6.7 * | blood | - | 5-HT | ns (group x time) |
| Miniussi et al., 2005 [65] | pretest-posttest | Site: left dorsolateral prefrontal cortex Pulse freq.: 17 Hz Intensity: 110% MT Pulse N: 408 Session N: 5 Session freq.: 1/day | TRD (uni- and bipolar, with and without psychotic symptoms) | N: 10 M:F: 25:75% * Age: mean 58 | plasma | the day of the last session | 5-HT | ns |
| 5-HIAA | ns | |||||||
| Pulse freq.: 1 Hz Pulse N: 400 | N: 10 M:F: 25:75% * Age: mean 52 | 5-HT | ns | |||||
| 5-HIAA | ns | |||||||
| Niimi et al., 2020 [66] | parallel | Site: primary motor cortex of the unaffected hemisphere Pulse freq.: 1 Hz Intensity: 90% MT Pulse N: 1200 Session N: 22 Session freq.: 2/day | stroke | Exp. group N: 62 M:F: 66:34% Age: 62.3 ± 11.0 Control group N: 33 M:F: 52:48% Age: 66.2 ± 10.8 | serum | - | TRP | ns |
| KYN | ns | |||||||
| KYN/TRP | ns | |||||||
| Sibon et al., 2007 [67] | crossover | Site: left dorsolateral prefrontal cortex Pulse freq.: 10 Hz Intensity: 90% MT Pulse N: 450 Session N: 1 | healthy | N: 10 M:F: 50:50% Age: 24.7 ± 5.14, range 18–40 | plasma | - | TRP | ns |
| free TRP | ns | |||||||
| Tateishi et al., 2021 [68] | pretest-posttest | Site: left dorsolateral prefrontal cortex Pulse freq.: 10 Hz Intensity: 100% MT Pulse N: 1600 Session N: 30 Session freq.: 5/week | TRD (unipolar) | N: 13 M:F: 31:69% Age: 54.9 ± 14.3 | plasma | - | TRP | ↑ |
| oxitriptan | ns | |||||||
| 5-HT | ↓ | |||||||
| melatonin | ns | |||||||
| KYN | ns | |||||||
| KA | ns | |||||||
| 3-HK | ns | |||||||
| KYN/TRP | ns | |||||||
| Tateishi et al., 2022 [69] | pretest-posttest | Site: left dorsolateral prefrontal cortex Pulse freq.: 10 Hz Intensity: 100% MT Pulse N: 1600 Session N: 30 Session freq.: 5/week | TRD (unipolar) | N: 5 Age: 48.0 ± 13.9, range 30–72 | CSF | - | TRP | ns |
| 5-HT | ns | |||||||
| KYN | ↑ | |||||||
| KA | ns | |||||||
| 3-HK | ns | |||||||
| tDCS | ||||||||
| Hadoush et al., 2021 [70] | pretest-posttest | Site: bilateral primary motor cortex and bilateral dorsolateral prefrontal cortex Polarity: anodal Electrode size: 25 cm2 Intensity: 1 mA Duration: 20 min Session N: 10 Session freq.: 5/week | Parkinson’s disease | N: 25 M:F: 76:24% Age: mean 61.5, range 30–80 | serum | - | melatonin | ↓ |
| Study | Design | Protocol | Subjects | Demographics | Source | Timing of Post-NIBS Sampling | Biomarker | Result |
|---|---|---|---|---|---|---|---|---|
| ECT | ||||||||
| Evans et al., 1976 [71] | parallel | Site: ear clips Session N: 1 | healthy Sprague-Dawley rats | Exp. group N: - all male Control group N: - all male | brain tissue | 30 min after the session | TRP | ns (posttest) |
| 5-HT | ns (posttest) | |||||||
| 5-HIAA | ns (posttest) | |||||||
| Exp. group N: 5 Control group N: 5 | 1 h after the session | 5-HT | ns (posttest) | |||||
| Exp. group N: 6 Control group N: 5 | 3 h after the session | TRP | ns (posttest) | |||||
| Exp. group N: 14 Control group N: 14 | 5-HT | ns (posttest) * | ||||||
| 5-HIAA | ↑ (posttest) | |||||||
| Exp. group N: 3 Control group N: 3 | 6 h after the session | 5-HT | ns (posttest) | |||||
| Exp. group N: 4 Control group N: 5 | 24 h after the session | TRP | ns (posttest) | |||||
| 5-HT | ns (posttest) | |||||||
| 5-HIAA | ns (posttest) | |||||||
| Gur et al., 2002 [72] | parallel | Site: ear clips Session N: 10 Session freq.: 1/day | healthy Albino rats | Exp. group N: 13 all male Control group N: 16 all male | microdialysis (ventral hippocampus) | 48 h after the last session | 5-HT | ns (posttest) |
| microdialysis (anterior hypothalamus) | 24 h after the last session | ns (posttest) | ||||||
| Juckel et al., 1999 [73] | pretest-posttest | Site: left medial prefrontal cortex Session N: 1 | healthy, anesthetized Sprague-Dawley rats | N: 6 all male | microdialysis (left amygdala) | during the session | 5-HT | ↑ |
| Site: left medial prefrontal cortex | healthy, anesthetized Sprague-Dawley rats | N: 6 | microdialysis (left ventral hippocampus) | ↑ | ||||
| Site: left medial prefrontal cortex | healthy, behaving Sprague-Dawley rats | N: 3 | microdialysis (left ventral hippocampus) | ↑ | ||||
| Site: right medial prefrontal cortex | healthy, anesthetized Sprague-Dawley rats | N: 4 | microdialysis (left ventral hippocampus) | ↑ | ||||
| Site: right medial prefrontal cortex | healthy, anesthetized Sprague-Dawley rats | N: 3 | microdialysis (right ventral hippocampus) | ↑ | ||||
| Karoum et al., 1986 [74] | pretest-posttest | Site: ear clips Session N: 10 Session freq.: 1/day | healthy Sprague-Dawley rats | N: 5 all male | brain tissue (caudate nucleus) | 20 h after the last session | 5-HT | ns |
| 5-HIAA | ns | |||||||
| 5-HIAA/5-HT | ns | |||||||
| 1 week after the last session | 5-HT | ns | ||||||
| 5-HIAA | ns | |||||||
| 5-HIAA/5-HT | ns | |||||||
| brain tissue (frontal cortex) | 20 h after the last session | 5-HT | ns | |||||
| 5-HIAA | ns | |||||||
| 5-HIAA/5-HT | ns | |||||||
| 1 week after the last session | 5-HT | ↑ | ||||||
| 5-HIAA | ns | |||||||
| 5-HIAA/5-HT | ns | |||||||
| urine | nights between sessions | 5-HIAA | ↓ | |||||
| nights in the first week after the last session | ↓ | |||||||
| Khanna et al.,, 1971 [75] | parallel | Site: temples Session N: 15 Session freq.: 1/day | healthy dogs later with ECT-induced cardiac abnormalities | Exp. group N: 19 Control group N: 10 | myocardium tissue | the day after the last session | 5-HT | ↑ (posttest) |
| healthy dogs later without ECT-induced cardiac abnormalities | Exp. group N: 11 Control group N: 10 | ns (posttest) | ||||||
| Madhav et al., 2000 [76] | parallel | Site: ear clips Session N: 5 Session freq.: every other day | Sprague-Dawley rats with serotonergic lesion in the right cingulum bundle (via which the hippocampus receives serotonergic innervation) | Exp. group N: 4 all male Control group N: 4 all male | brain tissue (right hippocampus) | 18 days after the last session | 5-HT | ns (posttest) |
| 5-HIAA | ↑ (posttest) | |||||||
| 5-HIAA/5-HT | ns (posttest) | |||||||
| McIntyre and Oxenkrug, 1984 [77] | parallel | Site: ear clips Seizure length: 20–25 s Session N: 7 Session freq.: 1/day | healthy Sprague-Dawley rats | Exp. group N: 14 all male Control group N: 7 all male | brain tissue (hypothalamus) | 9 pm of the day of the last session | TRP | ns (posttest) |
| 5-HT | ↓ (posttest) | |||||||
| 5-HIAA | ns (posttest) | |||||||
| Exp. group N: 13 Control group N: 7 | brain tissue (pineal gland) | TRP | ns (posttest) | |||||
| 5-HT | ↓ (posttest) | |||||||
| 5-HIAA | ns (posttest) | |||||||
| N-acetyl-5-HT | ns (posttest) | |||||||
| melatonin | ns (posttest) | |||||||
| Session N: 1 | Exp. group N: 8 Control group N: 7 | brain tissue (hypothalamus) | TRP | ns (posttest) | ||||
| 5-HT | ns (posttest) | |||||||
| 5-HIAA | ↓ (posttest) | |||||||
| Exp. group N: 7 Control group N: 7 | brain tissue (pineal gland) | TRP | ns (posttest) | |||||
| 5-HT | ns (posttest) | |||||||
| 5-HIAA | ns (posttest) | |||||||
| N-acetyl-5-HT | ns (posttest) | |||||||
| melatonin | ns (posttest) | |||||||
| Shields, 1972 [78] | parallel | Session N: 8 | healthy rats | Exp. group N: 8 Control group N: 8 | brain tissue | 24 h after the last session | 5-HT | ns (posttest) |
| 5-HIAA | ns (posttest) | |||||||
| Exp. group N: 8 Control group N: 7 | 5-HT | ns (posttest) | ||||||
| 5-HIAA | ns (posttest) | |||||||
| Session N: 12 | Exp. group N: 7 Control group N: 8 | 5-HT | ns (posttest) | |||||
| 5-HIAA | ns (posttest) | |||||||
| Session N: 16 | Exp. group N: 6 Control group N: 8 | 5-HT | ns (posttest) | |||||
| 5-HIAA | ns (posttest) | |||||||
| Session N: 1 | Exp. group N: 8 Control group N: 8 | 3 h after the session | TRP | ns (posttest) | ||||
| 5-HT | ns (posttest) | |||||||
| 5-HIAA | ↑ (posttest) * | |||||||
| Sugrue, 1983 [79] | parallel | Site: ear clips Session N: 10 Session freq.: 1/day | healthy Sprague-Dawley rats | Exp. group N: at least 5 all male Control group N: 40–48 all male | brain tissue (cortex) | 6.5 h after the last session | 5-HT | ns (posttest) |
| 5-HIAA | ↑ (posttest) | |||||||
| Tagliamonte et al., 1972 [80] | parallel | Site: ear clips Seizure length: 15 s Session N: 2 Session freq.: 30 min interval | healthy Wistar rats | Exp. group N: 24 all male Control group N: 150 all male | plasma | 1 h after the first session | TRP | ns (posttest) |
| brain tissue | TRP | ↑ (posttest) | ||||||
| 5-HT | ns (posttest) | |||||||
| 5-HIAA | ↑ (posttest) | |||||||
| Session N: 1 | Exp. group N: 21 Control group N: 150 | plasma | TRP | ns (posttest) | ||||
| brain tissue | TRP | ↑ (posttest) | ||||||
| 5-HT | ns (posttest) | |||||||
| 5-HIAA | ↑ (posttest) | |||||||
| Yoshida et al., 1997 [81] | parallel | Site: ear clips Seizure length: 20–25 s Session N: 8 Session freq.: 1/day | healthy Wistar rats | Exp. group N: 6 all male Control group N: 6 all male | microdialysis (striatum) | 0–180 after the first session | 5-HIAA | ↑ (posttest/pretest) |
| immediately before the last session | ↑ (posttest) | |||||||
| Yoshida et al., 1998 [82] | parallel | Site: ear clips Seizure length: 20–25 s Session N: 8 Session freq.: 1/day | healthy Wistar rats | Exp. group N: 6 all male Control group N: 6 all male | microdialysis (frontal cortex) | 0–180 after the first session | 5-HIAA | ↑ (posttest/pretest) |
| immediately before the last session | ↑ (posttest) | |||||||
| TMS | ||||||||
| Ben-Shachar et al., 1997 [83] | parallel | Pulse freq.: 25 Hz Intensity: 2.3 T Pulse N: 50 Session N: 1 | healthy Sprague-Dawley rats | Exp. group N: 16–20 all male Control group N: 16–20 all male | brain tissue (frontal cortex) | 10 s after the session | 5-HT | ns (posttest) |
| 5-HIAA | ns (posttest) | |||||||
| 5-HIAA/5-HT | ns (posttest) | |||||||
| brain tissue (hippocampus) | 5-HT | ↑ (posttest) | ||||||
| 5-HIAA | ↑ (posttest) | |||||||
| 5-HIAA/5-HT | ns (posttest) | |||||||
| brain tissue (striatum) | 5-HT | ns (posttest) | ||||||
| 5-HIAA | ns (posttest) | |||||||
| 5-HIAA/5-HT | ns (posttest) | |||||||
| brain tissue (midbrain) | 5-HT | ns (posttest) | ||||||
| 5-HIAA | ns (posttest) | |||||||
| 5-HIAA/5-HT | ns (posttest) | |||||||
| Ben-Shachar et al., 1999 [84] | parallel | Pulse freq.: 15 Hz Intensity: 2 T Pulse N: 52 Session N: 10 Session freq.: 1/day | healthy Sprague-Dawley rats | Exp. group N: 18–20 all male Control group N: 18–20 all male | brain tissue (frontal cortex) | 4 h after the last session | 5-HT | ns (posttest) |
| brain tissue (hippocampus) | ns (posttest) | |||||||
| brain tissue (striatum) | ns (posttest) | |||||||
| brain tissue (midbrain) | ns (posttest) | |||||||
| El Arfani et al., 2017 [85] | parallel | Site: prefrontal cortex Pulse freq.: 20 Hz Intensity: 110% MT Pulse N: 1560 Session N: 20 Session freq.: 5/day | healthy Sprague-Dawley rats | Exp. group N: 6 all male Control group N: 6 all male | brain tissue (striatum) | the day after the last session | 5-HT | ns (posttest) |
| 5-HIAA | ↓ (posttest) | |||||||
| Gur et al., 2000 [86] | parallel | Pulse freq.: 15 Hz Intensity: 1.12 T Pulse N: 600 Session N: 10 Session freq.: 1/day | healthy Albino rats | Exp. group N: 10 all male Control group N: 10 all male | microdialysis (left prefrontal cortex) | the morning after the last session | 5-HT | ns (posttest) |
| Heath et al., 2018 [87] | parallel | Site: bifrontal cortex Pulse freq.: 10 Hz Intensity: 12 mT Pulse N: 1800 Session N: 20 Session freq.: 5/week | C57BL/6J mice with olfactory bulbectomy (modelling agitated depression) | Exp. group N: 11 all male Control group N: 9 all male | plasma | 24 h after the last session | TRP | ns (posttest) |
| plasma | 5-HT | ns (posttest) | ||||||
| Intensity: 90 mT | Exp. group N: 5 Control group N: 3 | brain tissue (frontal cortex) | 5-HT | ns (posttest) | ||||
| Exp. group N: 10 Control group N: 9 | plasma | TRP | ns (posttest) | |||||
| plasma | 5-HT | ↓ (posttest) | ||||||
| Intensity: 1.2 T | Exp. group N: 9 Control group N: 9 | plasma | TRP | ns (posttest) | ||||
| plasma | 5-HT | ns (posttest) | ||||||
| Kanno et al., 2003 [88] | parallel | Site: frontal brain Pulse freq.: 25 Hz Intensity: 0.6 T Pulse N: 125 Session N: 3 Session freq.: 1/day | healthy Wistar rats | Exp. group N: 8 all male Control group N: 7 all male | microdialysis (prefrontal cortex) | - | 5-HT | ns (posttest) |
| Kanno et al., 2003 [89] | parallel | Site: frontal brain Pulse freq.: 25 Hz Intensity: 0.6 T Pulse N: 500 Session N: 1 | healthy Wistar rats | Exp. group N: 6 all male Control group N: 6 all male | microdialysis (right prefrontal cortex) | during and 0–160 min after the session | 5-HT | ↓ (posttest) |
| Kanno et al., 2004 [90] | parallel | Site: frontal brain Pulse freq.: 25 Hz Intensity: 0.6 T Pulse N: 500 Session N: 1 | healthy Wistar rats | Exp. group N: 6 all male Control group N: 6 all male | microdialysis (right dorsolateral striatum) | during and 0–160 min after the session | 5-HT | ns (posttest) |
| Keck et al., 2000 [91] | parallel | Site: left frontal cortex Pulse freq.: 20 Hz Intensity: 130% MT Pulse N: 1000 Session N: 1 | healthy Wistar rats | Exp. group N: 8 all male Control group N: 6 all male | microdialysis (right dorsal hippocampus) | during and 0–30 and 30–60 min after the session | 5-HT | ns (group x time) |
| 5-HIAA | ns (group x time) | |||||||
| Kim et al., 2016 [92] | parallel | Site: right prefrontal cortex Pulse freq.: 10 Hz Intensity: 100% MT Pulse N: 1000 Session N: 15 Session freq.: 5/week | SHR/Izm rats (spontaneously hypertensive, modelling ADHD) | Exp. group N: 9 all male Control group N: 8 all male | brain tissue (prefrontal cortex) | 7 h 50 min after the last session | 5-HT | ns (posttest) |
| Löffler et al., 2012 [93] | parallel | Site: cerebral cortex Pulse freq.: 20 Hz Intensity: 130% MT Pulse N: 300 Session N: 1 | healthy Wistar rats | Exp. group N: 8 all male Control group N: 6 all male | microdialysis (nucleus accumbens shell) | 0–160 min after the session | 5-HT | ↑ (posttest/pretest) |
| 5-HIAA | ns (posttest/pretest) | |||||||
| Peng et al., 2018 [94] | parallel | Site: vertex Pulse freq.: 1 Hz Intensity: 0.84 T Session N: 7 Session freq.: 1/day | Sprague-Dawley rats with chronic unpredictable stress (modelling depression) | Exp. group N: 10 all male Control group N: 10 all male | brain tissue (prefrontal cortex) | 24 h after the last session | 5-HT | ns (posttest) |
| 5-HIAA | ns (posttest) | |||||||
| Intensity: 1.26 T | Exp. group N: 10 Control group N: 10 | 5-HT | ns (posttest) | |||||
| 5-HIAA | ns (posttest) | |||||||
| Pulse freq.: 5 Hz Intensity: 0.84 T | Exp. group N: 10 Control group N: 10 | 5-HT | ↑ (posttest) | |||||
| 5-HIAA | ↓ (posttest) | |||||||
| Intensity: 1.26 T | Exp. group N: 10 Control group N: 10 | 5-HT | ↑ (posttest) | |||||
| 5-HIAA | ↓ (posttest) | |||||||
| Pulse freq.: 10 Hz Intensity: 0.84 T | Exp. group N: 10 Control group N: 10 | 5-HT | ↑ (posttest) | |||||
| 5-HIAA | ↓ (posttest) | |||||||
| Intensity: 1.26 T | Exp. group N: 10 Control group N: 10 | 5-HT | ↑ (posttest) | |||||
| 5-HIAA | ↓ (posttest) | |||||||
| Poh et al., 2019 [95] | parallel | Site: lambda Pulse freq.: 10 Hz Intensity: 12 mT Pulse N: 6000 Session N: 1 | healthy C57BL/6J mice | Exp. group N: 5 M:F: 60:40% Control group N: 5 M:F: 60:40% | brain tissue (cortex) | immediately after the session | 5-HT | ns (posttest) |
| 5-HIAA | ns (posttest) | |||||||
| 5-HIAA/5-HT | ↓ (posttest) | |||||||
| brain tissue (hippocampus) | 5-HT | ns (posttest) | ||||||
| 5-HIAA | ns (posttest) | |||||||
| 5-HIAA/5-HT | ns (posttest) | |||||||
| brain tissue (striatum) | 5-HT | ns (posttest) | ||||||
| 5-HIAA | ns (posttest) | |||||||
| 5-HIAA/5-HT | ns (posttest) | |||||||
| Intensity: 1.2 T Pulse N: 3600 | Exp. group N: 6 M:F: 50:50% Control group N: 5 M:F: 60:40% | brain tissue (cortex) | 5-HT | ns (posttest) | ||||
| 5-HIAA | ns (posttest) | |||||||
| 5-HIAA/5-HT | ns (posttest) | |||||||
| brain tissue (hippocampus) | 5-HT | ns (posttest) | ||||||
| 5-HIAA | ns (posttest) | |||||||
| 5-HIAA/5-HT | ns (posttest) | |||||||
| brain tissue (striatum) | 5-HT | ns (posttest) | ||||||
| 5-HIAA | ns (posttest) | |||||||
| 5-HIAA/5-HT | ns (posttest) | |||||||
| Wang et al., 2022 [96] | parallel | Site: center of skull Pulse freq.: 10 Hz Intensity: 90% MT Pulse N: 1000 Session N: 40 Session freq.: 5/week | Sprague-Dawley rats with spinal cord contusion injury | Exp. group N: 10 all female Control group N: 10 all female | ventral horn sections of the lumbar spinal cord | - | 5-HT | ns (posttest) |
| tDCS | ||||||||
| Tanaka et al., 2013 [97] | parallel | Site: cortex Polarity: cathodal Electrode size: 5 mm × 5 mm Intensity: 800 μA Duration: 10 min Session N: 1 | healthy Sprague-Dawley rats | Exp. group N: 7 all male Control group N: 7 all male | microdialysis (striatum) | during and 0–390 min after the session | 5-HT | ns (posttest/pretest) |
| Polarity: anodal | Exp. group N: 7 Control group N: 7 | ns (posttest/pretest) |
| Metabolite | Source | Studies | r | Effect BF10 | Heterogeneity BF10 | Publication Bias BF10 |
|---|---|---|---|---|---|---|
| ECT | ||||||
| TRP | plasma | N: 8 [35,39,43,48,52,53,56,58] | 0.5 | 0.216 | 10.191 | 0.645 |
| 0.7 | 0.278 | 39.36 | 0.891 | |||
| 0.9 | 0.183 | >100 | 7.014 | |||
| KA | plasma | N: 2 [35,52] | 0.5 | 0.174 | 0.568 | 0.656 |
| 0.7 | 0.174 | 0.629 | 0.978 | |||
| 0.9 | 0.269 | 2.267 | 1.015 | |||
| KA/KYN | plasma | N: 2 [35,52] | 0.5 | 0.174 | 0.468 | 0.461 |
| 0.7 | 0.178 | 0.46 | 0.461 | |||
| 0.9 | 0.309 | 0.782 | 0.517 | |||
| TMS | ||||||
| TRP | plasma | N: 2 [62,63] | 0.5 | 0.279 | 0.699 | 0.633 |
| 0.7 | 0.242 | 0.732 | 0.683 | |||
| 0.9 | 0.197 | 1.306 | 1.271 | |||
| 5-HT | serum | N: 2 [62,63]) | 0.5 | 5.46 | 0.804 | 1.598 |
| 0.7 | 5.377 | 0.777 | 1.678 | |||
| 0.9 | 9.232 | 0.79 | 1.504 |
Publisher’s Note: MDPI stays neutral with regard to jurisdictional claims in published maps and institutional affiliations. |
© 2022 by the authors. Licensee MDPI, Basel, Switzerland. This article is an open access article distributed under the terms and conditions of the Creative Commons Attribution (CC BY) license (https://creativecommons.org/licenses/by/4.0/).
Share and Cite
Giron, C.G.; Lin, T.T.Z.; Kan, R.L.D.; Zhang, B.B.B.; Yau, S.Y.; Kranz, G.S. Non-Invasive Brain Stimulation Effects on Biomarkers of Tryptophan Metabolism: A Scoping Review and Meta-Analysis. Int. J. Mol. Sci. 2022, 23, 9692. https://doi.org/10.3390/ijms23179692
Giron CG, Lin TTZ, Kan RLD, Zhang BBB, Yau SY, Kranz GS. Non-Invasive Brain Stimulation Effects on Biomarkers of Tryptophan Metabolism: A Scoping Review and Meta-Analysis. International Journal of Molecular Sciences. 2022; 23(17):9692. https://doi.org/10.3390/ijms23179692
Chicago/Turabian StyleGiron, Cristian G., Tim T. Z. Lin, Rebecca L. D. Kan, Bella B. B. Zhang, Suk Yu Yau, and Georg S. Kranz. 2022. "Non-Invasive Brain Stimulation Effects on Biomarkers of Tryptophan Metabolism: A Scoping Review and Meta-Analysis" International Journal of Molecular Sciences 23, no. 17: 9692. https://doi.org/10.3390/ijms23179692