
Predicting the Prognostic Value of POLI Expression in Different Cancers via a Machine Learning Approach


1
Division of Biology, Kansas State University, Manhattan, KS 66506, USA
2
1DATA Consortium, Kansas State University Olathe, Olathe, KS 66061, USA
3
Department of Mathematics, Kansas State University, Manhattan, KS 66506, USA
*
Authors to whom correspondence should be addressed.
Int. J. Mol. Sci. 2022, 23(15), 8571; https://doi.org/10.3390/ijms23158571
Submission received: 21 June 2022
/
Revised: 22 July 2022
/
Accepted: 25 July 2022
/
Published: 2 August 2022
(This article belongs to the Special Issue Bioinformatics in Genetic Diseases and Cancer)
Abstract
:Translesion synthesis (TLS) is a cell signaling pathway that facilitates the tolerance of replication stress. Increased TLS activity, the particularly elevated expression of TLS polymerases, has been linked to resistance to cancer chemotherapeutics and significantly altered patient outcomes. Building upon current knowledge, we found that the expression of one of these TLS polymerases (POLI) is associated with significant differences in cervical and pancreatic cancer survival. These data led us to hypothesize that POLI expression is associated with cancer survival more broadly. However, when cancers were grouped cancer type, POLI expression did not have a significant prognostic value. We presented a binary cancer random forest classifier using 396 genes that influence the prognostic characteristics of POLI in cervical and pancreatic cancer selected via graphical least absolute shrinkage and selection operator. The classifier was then used to cluster patients with bladder, breast, colorectal, head and neck, liver, lung, ovary, melanoma, stomach, and uterus cancer when high POLI expression was associated with worsened survival (Group I) or with improved survival (Group II). This approach allowed us to identify cancers where POLI expression is a significant prognostic factor for survival (p = 0.028 in Group I and p = 0.0059 in Group II). Multiple independent validation approaches, including the gene ontology enrichment analysis and visualization tool and network visualization support the classification scheme. The functions of the selected genes involving mitochondrial translational elongation, Wnt signaling pathway, and tumor necrosis factor-mediated signaling pathway support their association with TLS and replication stress. Our multidisciplinary approach provides a novel way of identifying tumors where increased TLS polymerase expression is associated with significant differences in cancer survival.
1. Introduction
Genotoxic chemotherapeutic agents (e.g., cisplatin) are commonly used to treat multiple different types of tumors. These drugs typically kill cancer cells by causing DNA lesions that lead to replication stress. This affords some level of specificity as, in general, transformed cells are more likely to be replicating than other cells in the body. Genotoxic agents are generally effective treatment options, but resistance remains a significant barrier to success [1,2,3]. There has been a sustained effort to identify the molecular mechanisms by which resistance can be acquired so that targeted therapies can be designed for these drug-resistant cancers. This information can also be used to identify markers of tumors that will be resistant to standard interventions, allowing alternative approaches to be used.
The translesion synthesis (TLS) pathway has recently been identified as a mediator of resistance to genotoxic chemotherapies [4,5,6,7,8]. TLS allows replication forks to bypass DNA lesions caused by drugs, such as cisplatin. This prevents their collapse and the resulting toxicity that allows cisplatin to kill replicating cells. Mechanistically, TLS accomplishes this bypass by promoting the exchange of high-fidelity replicative polymerases for an error-prone TLS polymerase (e.g., POLH, REV3L, POLI) [9,10,11]. Whereas replicative polymerases cannot synthesize DNA using damaged DNA as a template, TLS polymerases can incorporate an untemplated base, allowing them to move beyond a DNA lesion [12]. TLS polymerase abundance appears to be rate-limiting for the pathway as exogenous TLS polymerase expression results in a more efficient DNA lesion bypass [13].
Typically, tumors with elevated TLS polymerase expression are significantly less responsive to genotoxic therapies, resulting in worse prognoses for people with these tumors [1,14]. However, this is not universally true as in some tumor types increased TLS polymerase expression is associated with improved prognosis. Cervical cancers (CESC) are an example of a tumor type where increased expression of a TLS polymerase (REV1, POLH, or REV3L) is associated with reduced survival, while pancreatic cancers (PAAD) are an example of the opposite [13,15,16]. This implies that the tumor cell environment, most likely the transcriptome, dictates the prognostic value of TLS polymerase expression for cancer survival.
If whether TLS polymerase expression acts as a positive or negative prognostic factor is dictated by changes in the transcriptome of tumor cells, then identifying the gene (s) most responsible for driving these differences is important. Traditional molecular biology approaches manipulations can help find these genes, but it has limited scalability and is further hampered by the lack of validated reagents to detect most proteins. Machine learning algorithms (e.g., decision tree, neural network (NN)) are not limited by either of these restraints and have been used to identify other cancer prognostic factors at much lower costs than in vitro screening would have required [15,16,17,18]. There are advantages and disadvantages to each machine learning algorithm. For example, an NN approach based on multi-layer perceptrons includes more complexity but produces less interpretability [15,19]. Unlike the black box nature of NN, decision trees, such as random forest (RF) [20] and gradient boosting (GB) [21], embrace features of simplicity and the “easy-to-learn” nature of a tree-structure algorithm [17].
In this manuscript, we probe transcriptomic data from the cancer genome atlas (TCGA) to identify genes associated with POLI expression being a positive/negative prognostic factor. This allowed us to build a classification system that successfully predicted a group of tumors where POLI expression would be positively associated with survival and a group of tumors where the relationship would be the opposite. These relationships were independent of tumor type. We also determined the extent to which the genes used to categorize tumors were enriched in cell processes. To achieve these goals, we employed a variety of computational tools, including a statistical learning approach for gene selection, a machine learning method for a supervised classifier, and data-drive approaches for gene network association to eventually investigate the relationship among genes, cellular processes, and cancer progression. Previous studies have shown that the quantitative measurement of gene correlations can be associated with cellular functions [22,23]. This was our rationale for using the expression data of genes correlating with POLI expression as the input for a cancer classifier [22]. Further, because decision tree algorithms have been used to identify cancer biomarkers [22,24,25,26], we used RF in our analysis over GB and NN.
2. Results
2.1. Prognostic POLI Expression Signatures
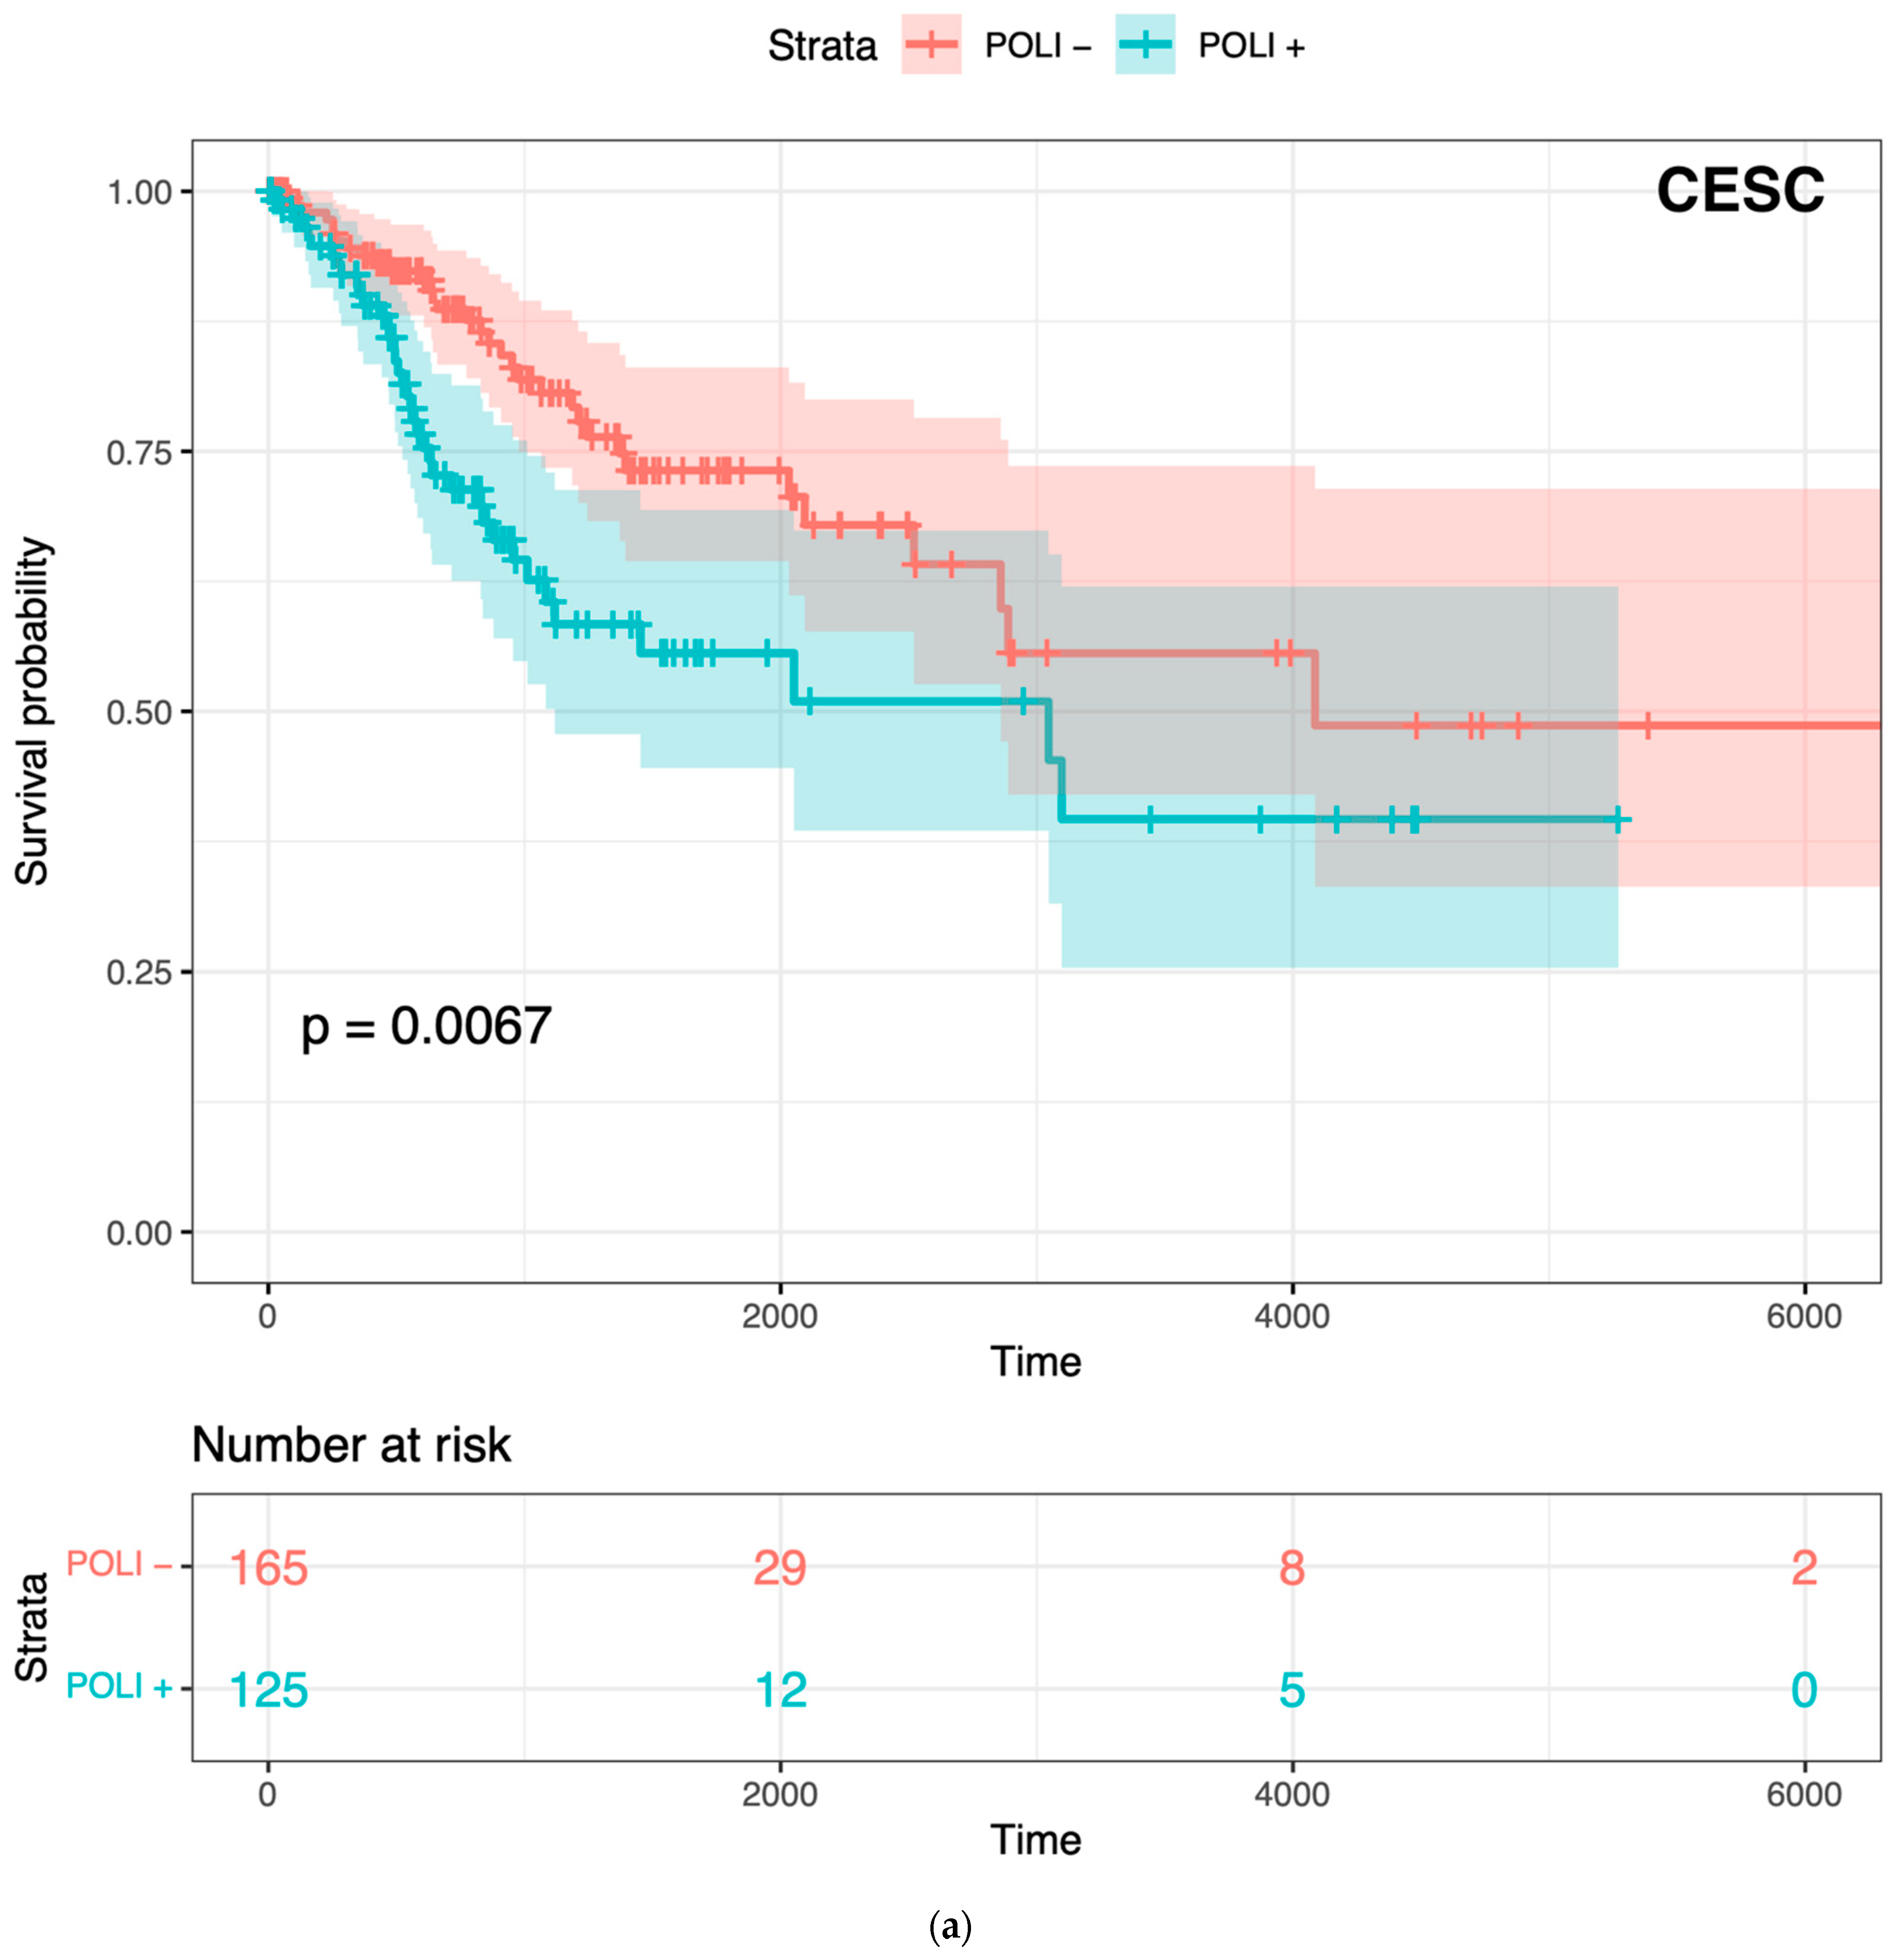
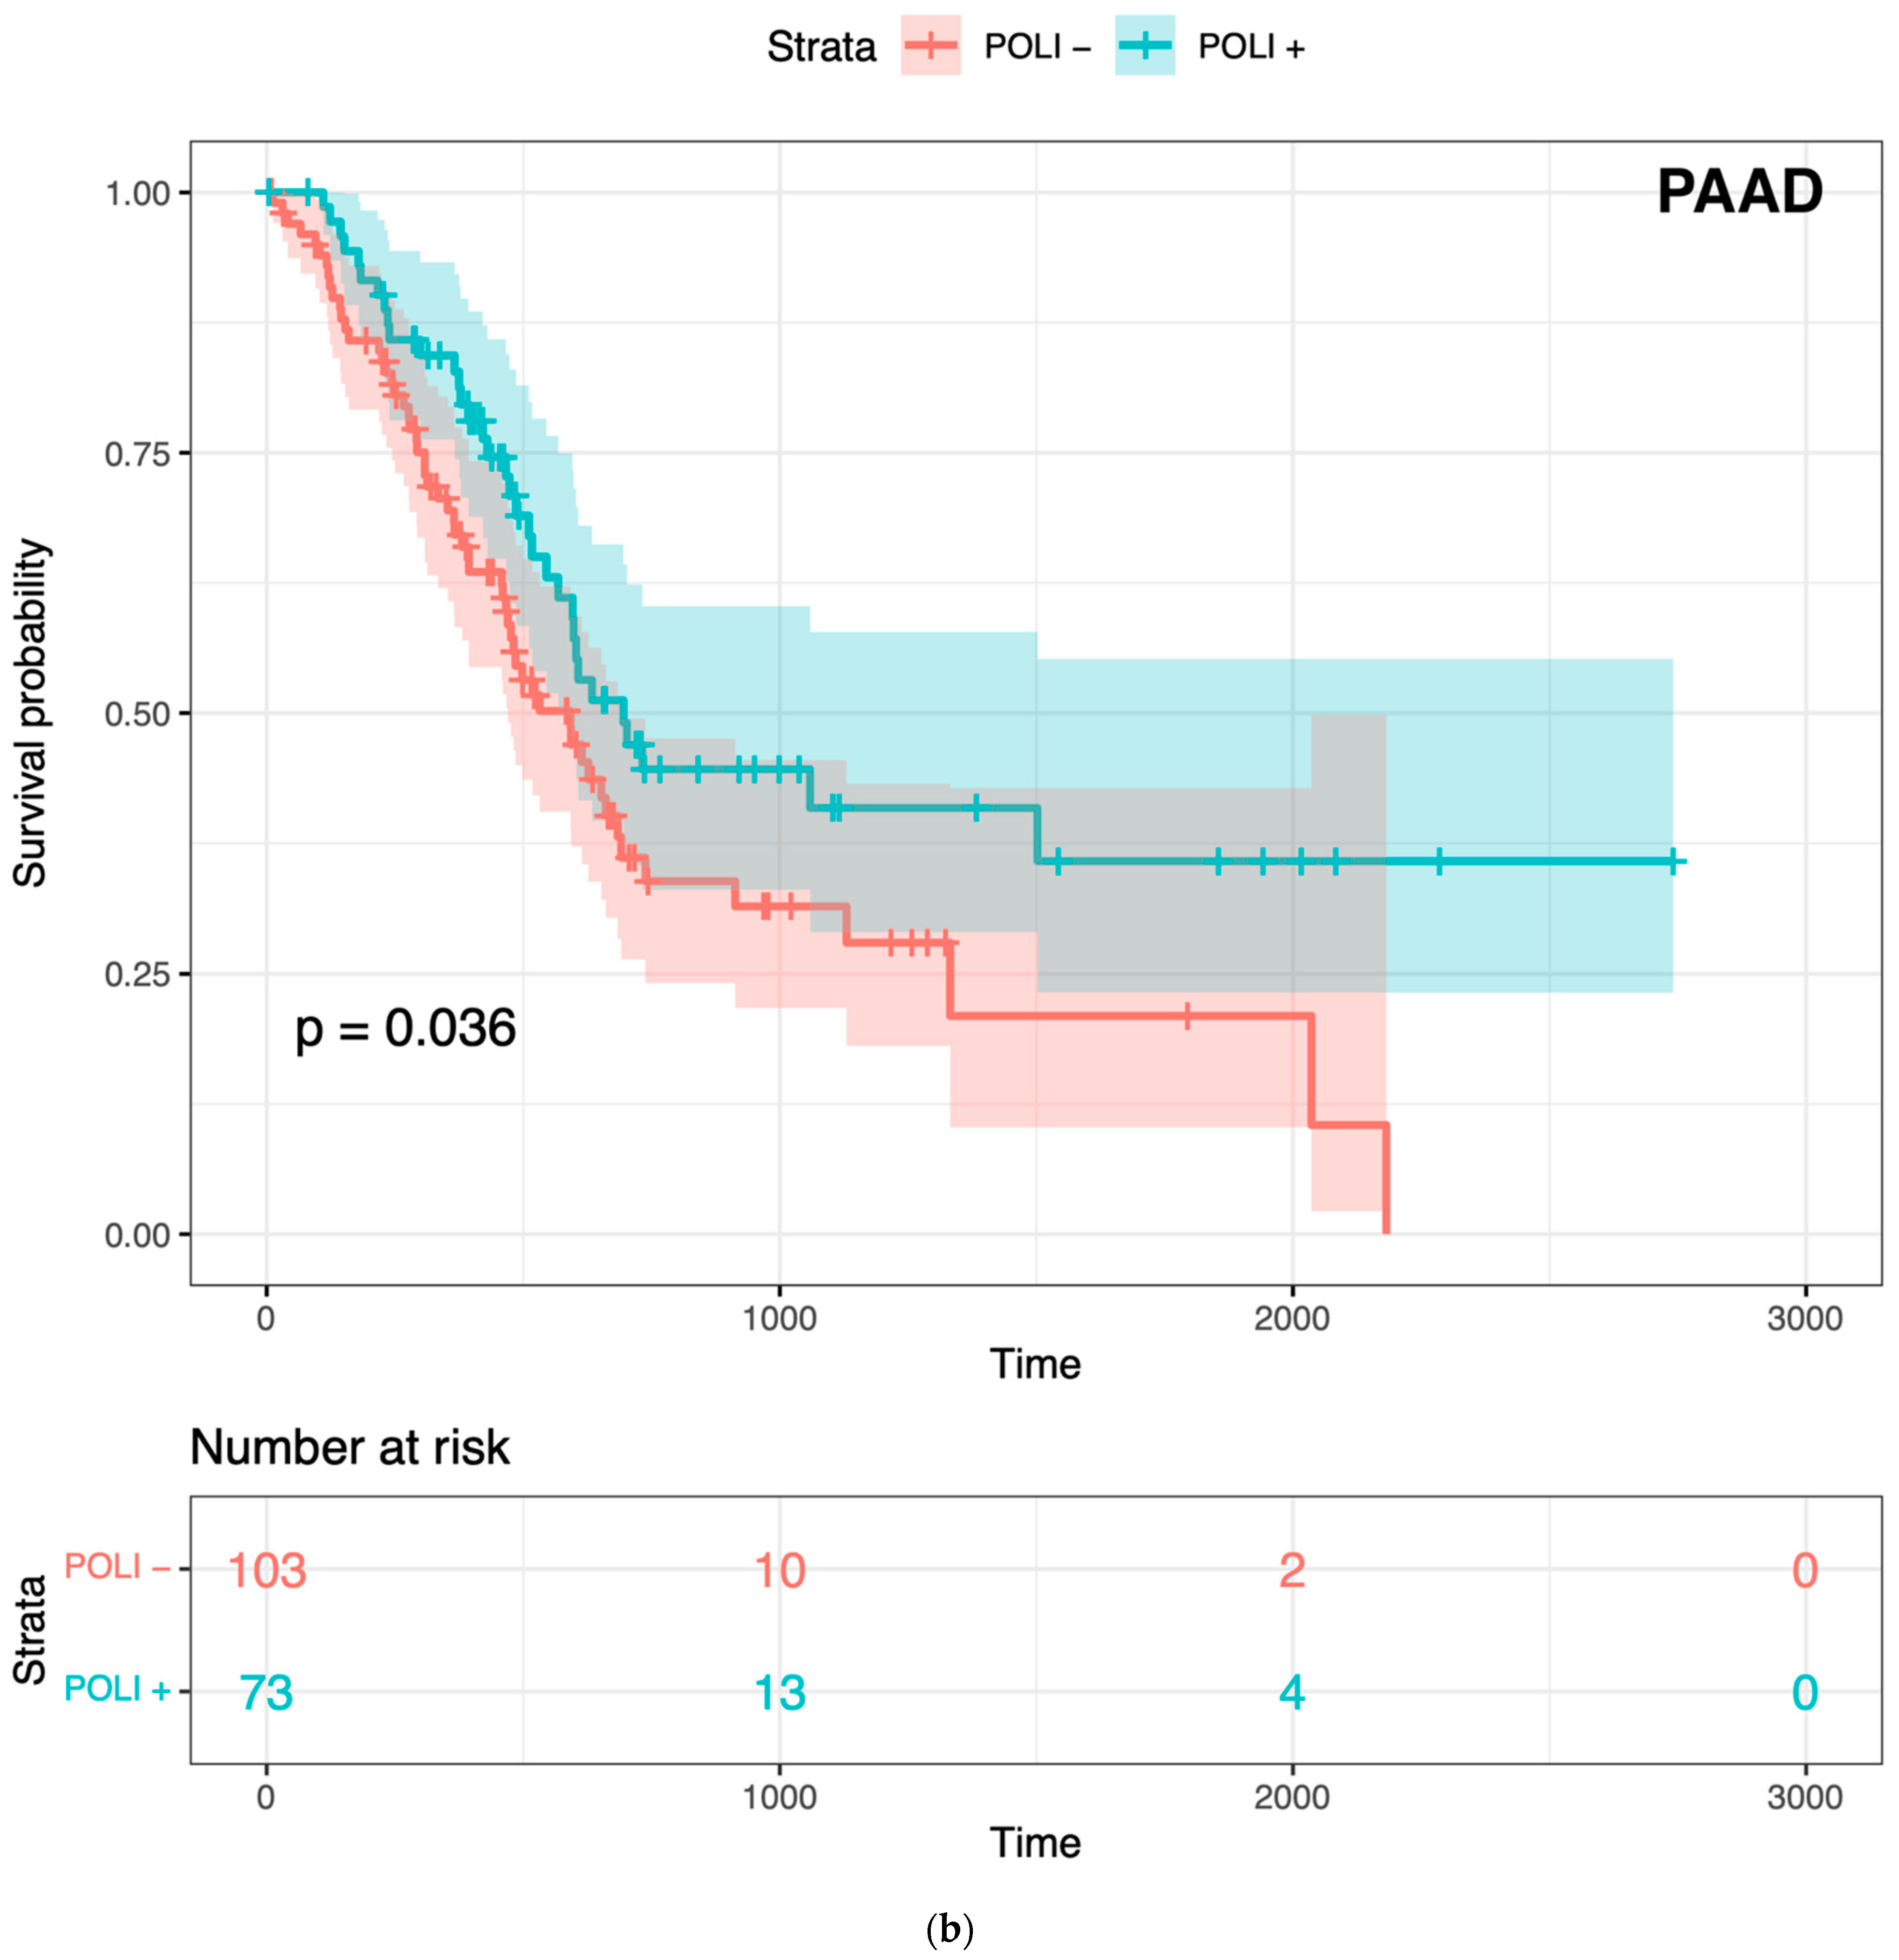
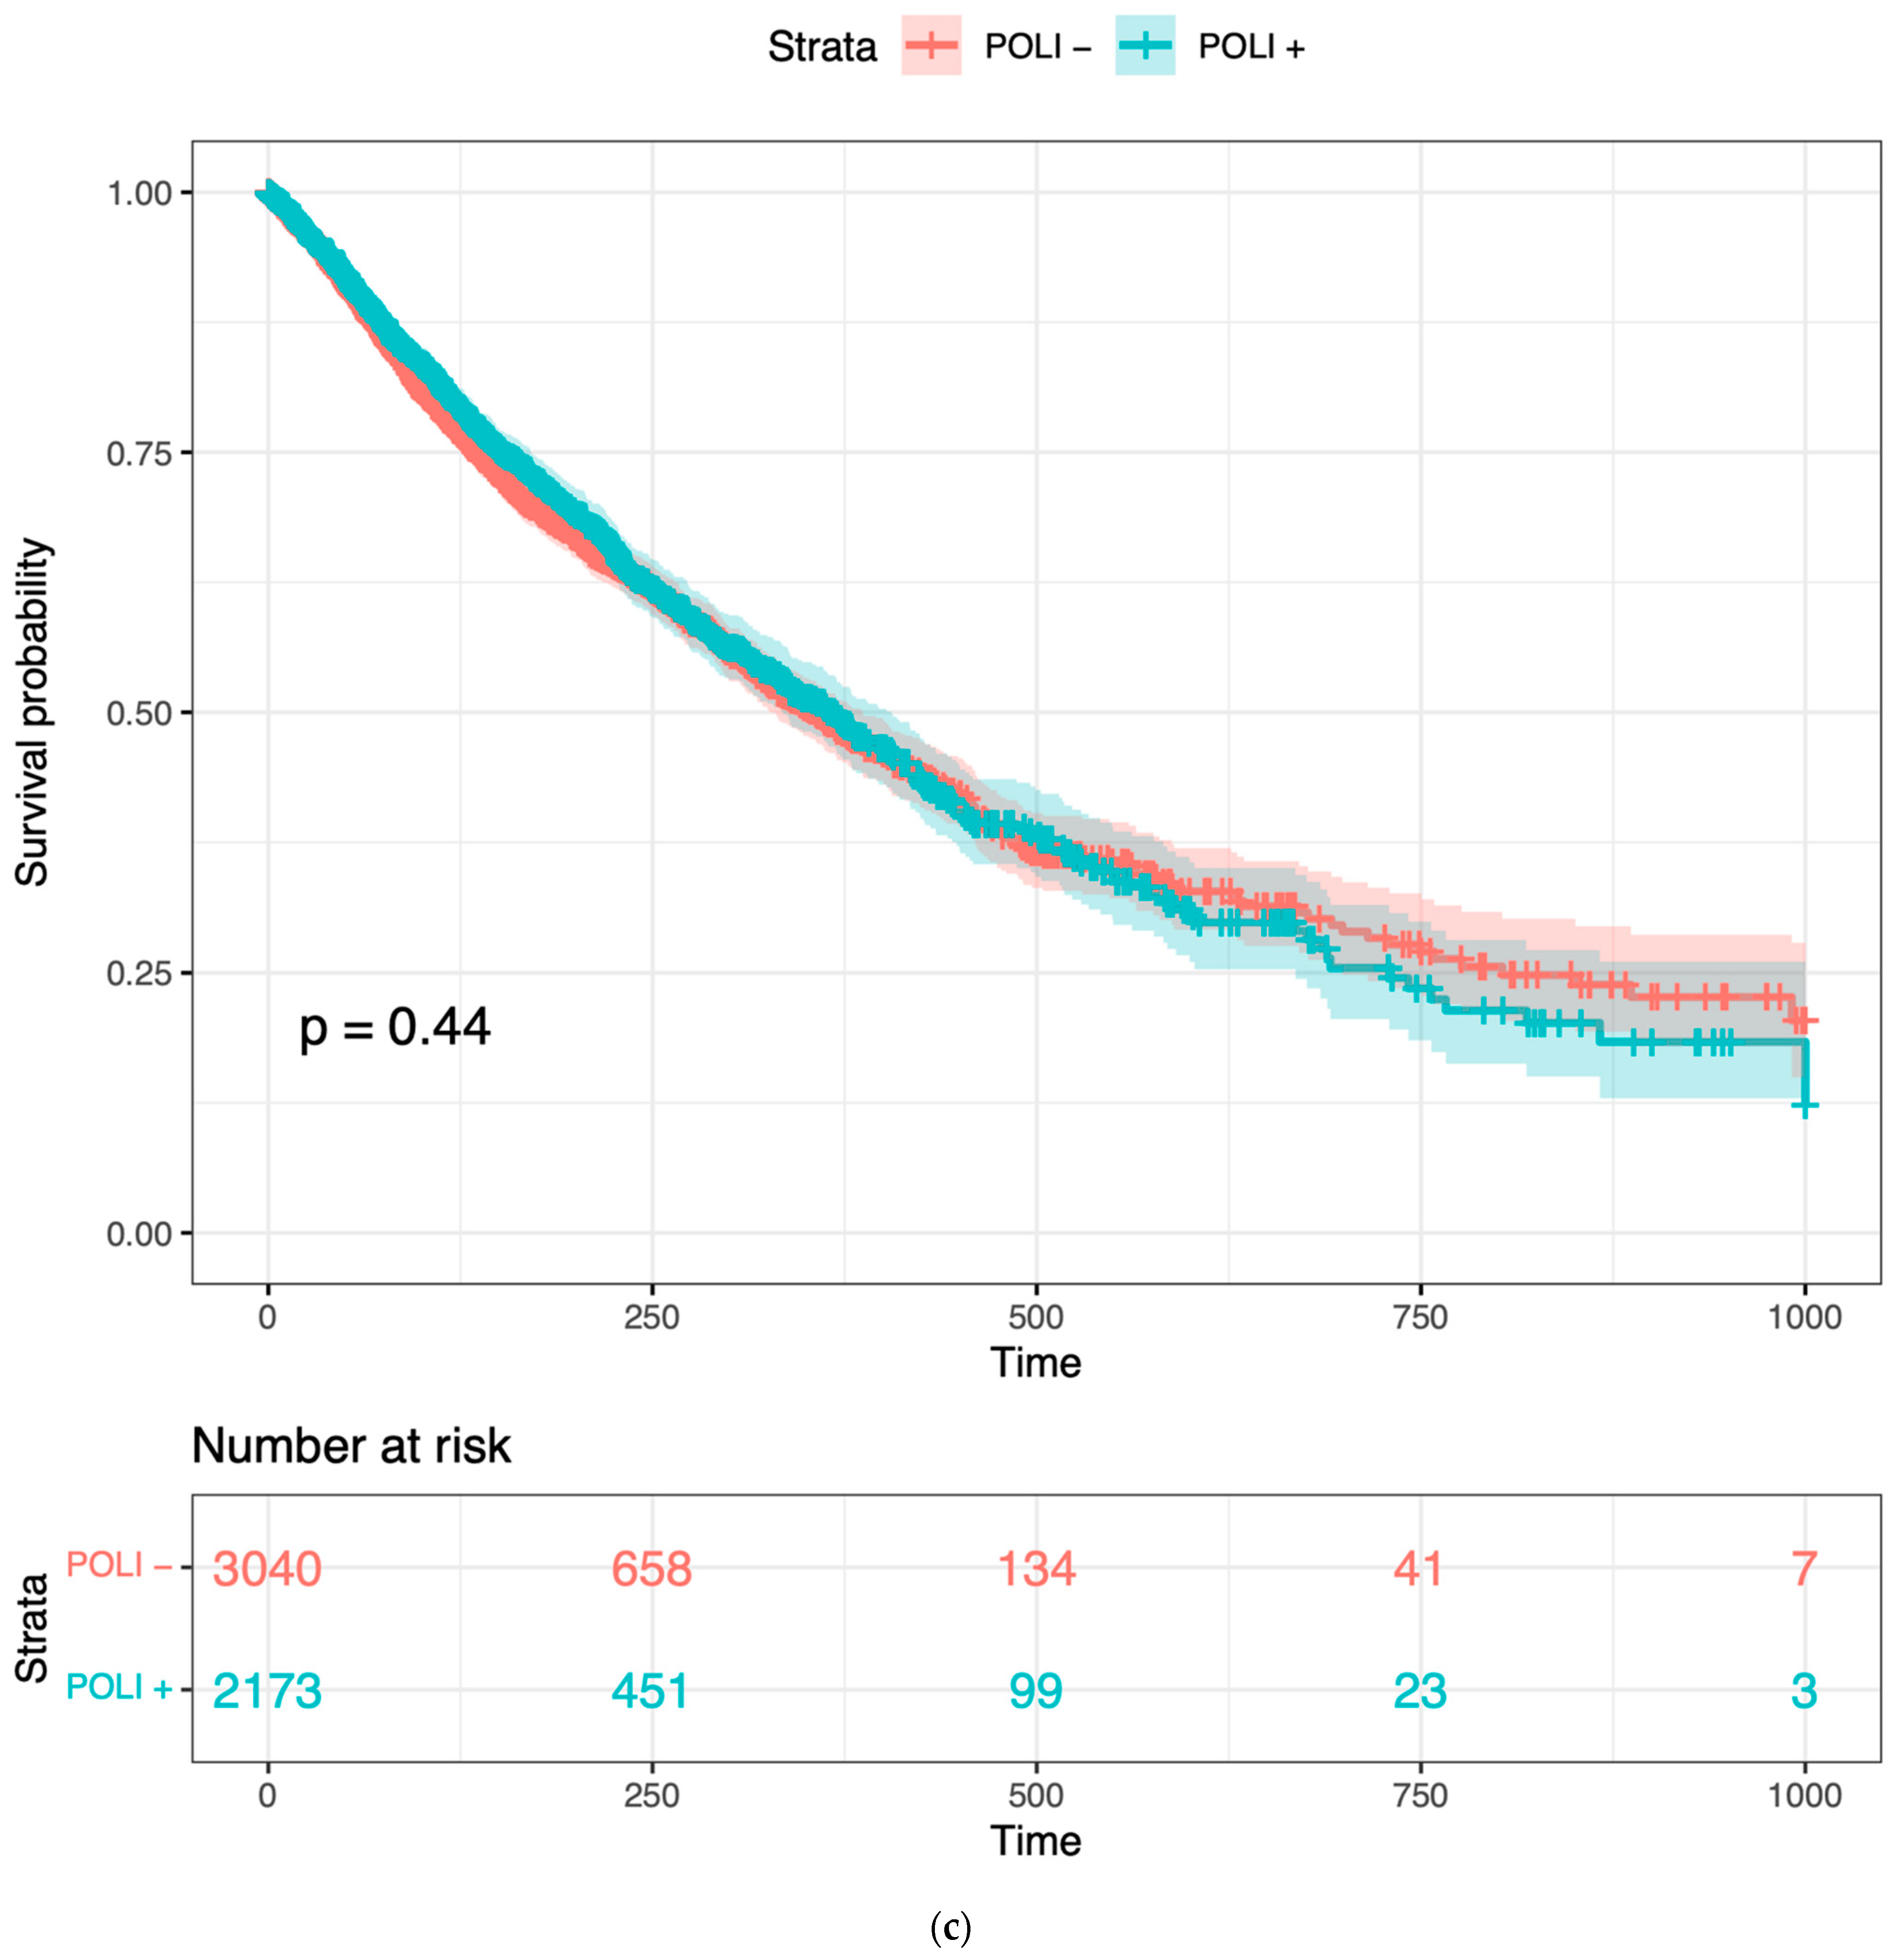
To confirm whether POLI was associated with both improved and worse outcomes varied by tumor type, we performed Kaplan–Meier (K–M) survival analysis on CESC and PAAD. POLI was a significant prognostic factor in both of these tumor types (Figure 1). However, we found that the increase in POLI expression was not always linked to a decrease in survival (Figure 1b). As a result, survival data of 11 other cancer types, including bladder (BLCA), breast (BRCA), colorectal (COADREAD), head and neck (HNSC), liver (LIHC), lung (LUAD and LUSC), ovarian (OV), melanoma (SKCM), stomach (STAD), and uterine (UCEC), were integrated and then standardized to determine the extent that POLI expression correlated with survival. We observed that POLI expression did not correlate with survival in these tumor types when combined (Figure 1c). The K–M analysis of individual cancer types also showed no prognostic value (Figure S1). These data show that the ability of POLI to act as a prognostic factor varies by tumor type.
2.2. POLI-Associated Genes
To investigate the regulation of POLI expression, associated genes were selected as the candidate variables according to the working hypothesis. We computed the pairwise Pearson correlation coefficient between POLI and the remaining genes for CESC and PAAD, respectively (Table 1). To determine the extent that these results were dependent on the manner in which correlations were determined, we repeated this analysis using a non-parametric method (Spearman’s rank correlation). This analysis produced a similar range of correlation values demonstrating that the analysis was largely independent of the correlation method employed (Table S1). The top positively and negatively correlated genes were collected for CESE and PAAD. Generally, a stronger association was observed in PAAD patients compared to CESC.
To refine and identify the list of most correlated genes to POLI expression, the graphical least absolute shrinkage and selection operator (GLASSO) was applied to the merged 1000 genes from the top positive and negative columns (Table 1) to encourage further sparsity. Due to the noise or weak signals in gene data, the tuning parameters of GLASSO were adjusted to select 200 genes from each cancer type, CESC, and PAAD, respectively. These 200 genes out of 1000 genes from either CESC or PAAD were considered as the most positively/negatively correlated genes potentially upregulating or downregulating POLI expression. The 2 sets of the 2 genes from the 2 cancers were merged forming 1 set of 396 unique genes, with only 4 genes overlapping in the 2 cancer types. This group of genes indicated the features of gene expression patterns influencing POLI in CESC and PAAD.
2.3. Random Forest Classifier for CESC and PAAD
After gene selection and dimension reduction, genes integrated from CESC and PAAD correlating to POLI were considered as the dependent variables for a supervised machine learning process. We performed a binary classification task via random forest classifier (RFC), based on selected genes with the contrary prognostic value of POLI in CESC and PAAD. Patients in CESC and PAAD were under-sampled to gain an unbiased classification of two cancer types. RFC reached 100% accuracy to differentiate CESC and PAAD on the 30% testing data using 396 gene variables.
For new testing patients with other cancer types, RFC calculated the similarity between Group 1, “CESC-like” containing potential signal of increase in POLI expression worsening survival, and Group 2, “PAAD-like” containing potential signal of increase POLI expression improving survival. Our RFC were extended to segregate people with 11 other cancers, based on whether their gene expression was more similar to “CESC” or “PAAD” (Table 2). An amount of 54% of patients were classified as group 1. In total, the classification yielded a balanced result for 11 cancers. However, individual cancer types showed varied preferences toward two predicted groups.
2.4. Identifying Tumors Where POLI Expression Will Correlate with Survival
After the classification of patients from other cancers, we asked whether the prognostic value of POLI existed in patients clustered in Group 1 and Group 2, respectively. Based on our previous results in CESC and PAAD. The distinct relationship between POLI expression and survival was expected to show in the two groups. The backward selection was performed to select cancer types that the prognosis of POLI expression would stand out from Group 1 and Group 2, respectively (Table 2). Patients with BRCA, STAD, and UCEC were classified into Group 1 and Group 2 regarding POLI as a prognostic factor. HNSC, LIHC, and SKCM from Group 1 when merged with BRCA, STAD and UCEC showed the pattern as we demonstrated in CESC that upregulated POLI expression worsened the survival. BLAC, COADREAD, LUAD, LUSC, and OV when integrated with BRCA, STAD and UCEC showed the pattern of POLI expression in PAAD, which was the opposite phenomenon (Figure 2). The gene expression signature and RFC parameters provided sound support for patient classification concerning POLI and TLS. To determine the extent that this classification was influenced by the method used to determine correlations, we repeated this analysis using genes selected via Spearman’s rank correlation (Figure S2). The results in selected Group 1 and Group 2 showed the same patterns in Figure 2, indicating the robust nature of our results. Further, we performed a comparative analysis of different machine learning approaches (RF, GB, and NN). These data demonstrated that RFC outperform the other classifiers, as BG and NN approaches were less capable of clustering patients with the same prognostic value of POLI (Figures S3 and S4).
2.5. Analysis of Gene Association Pattern
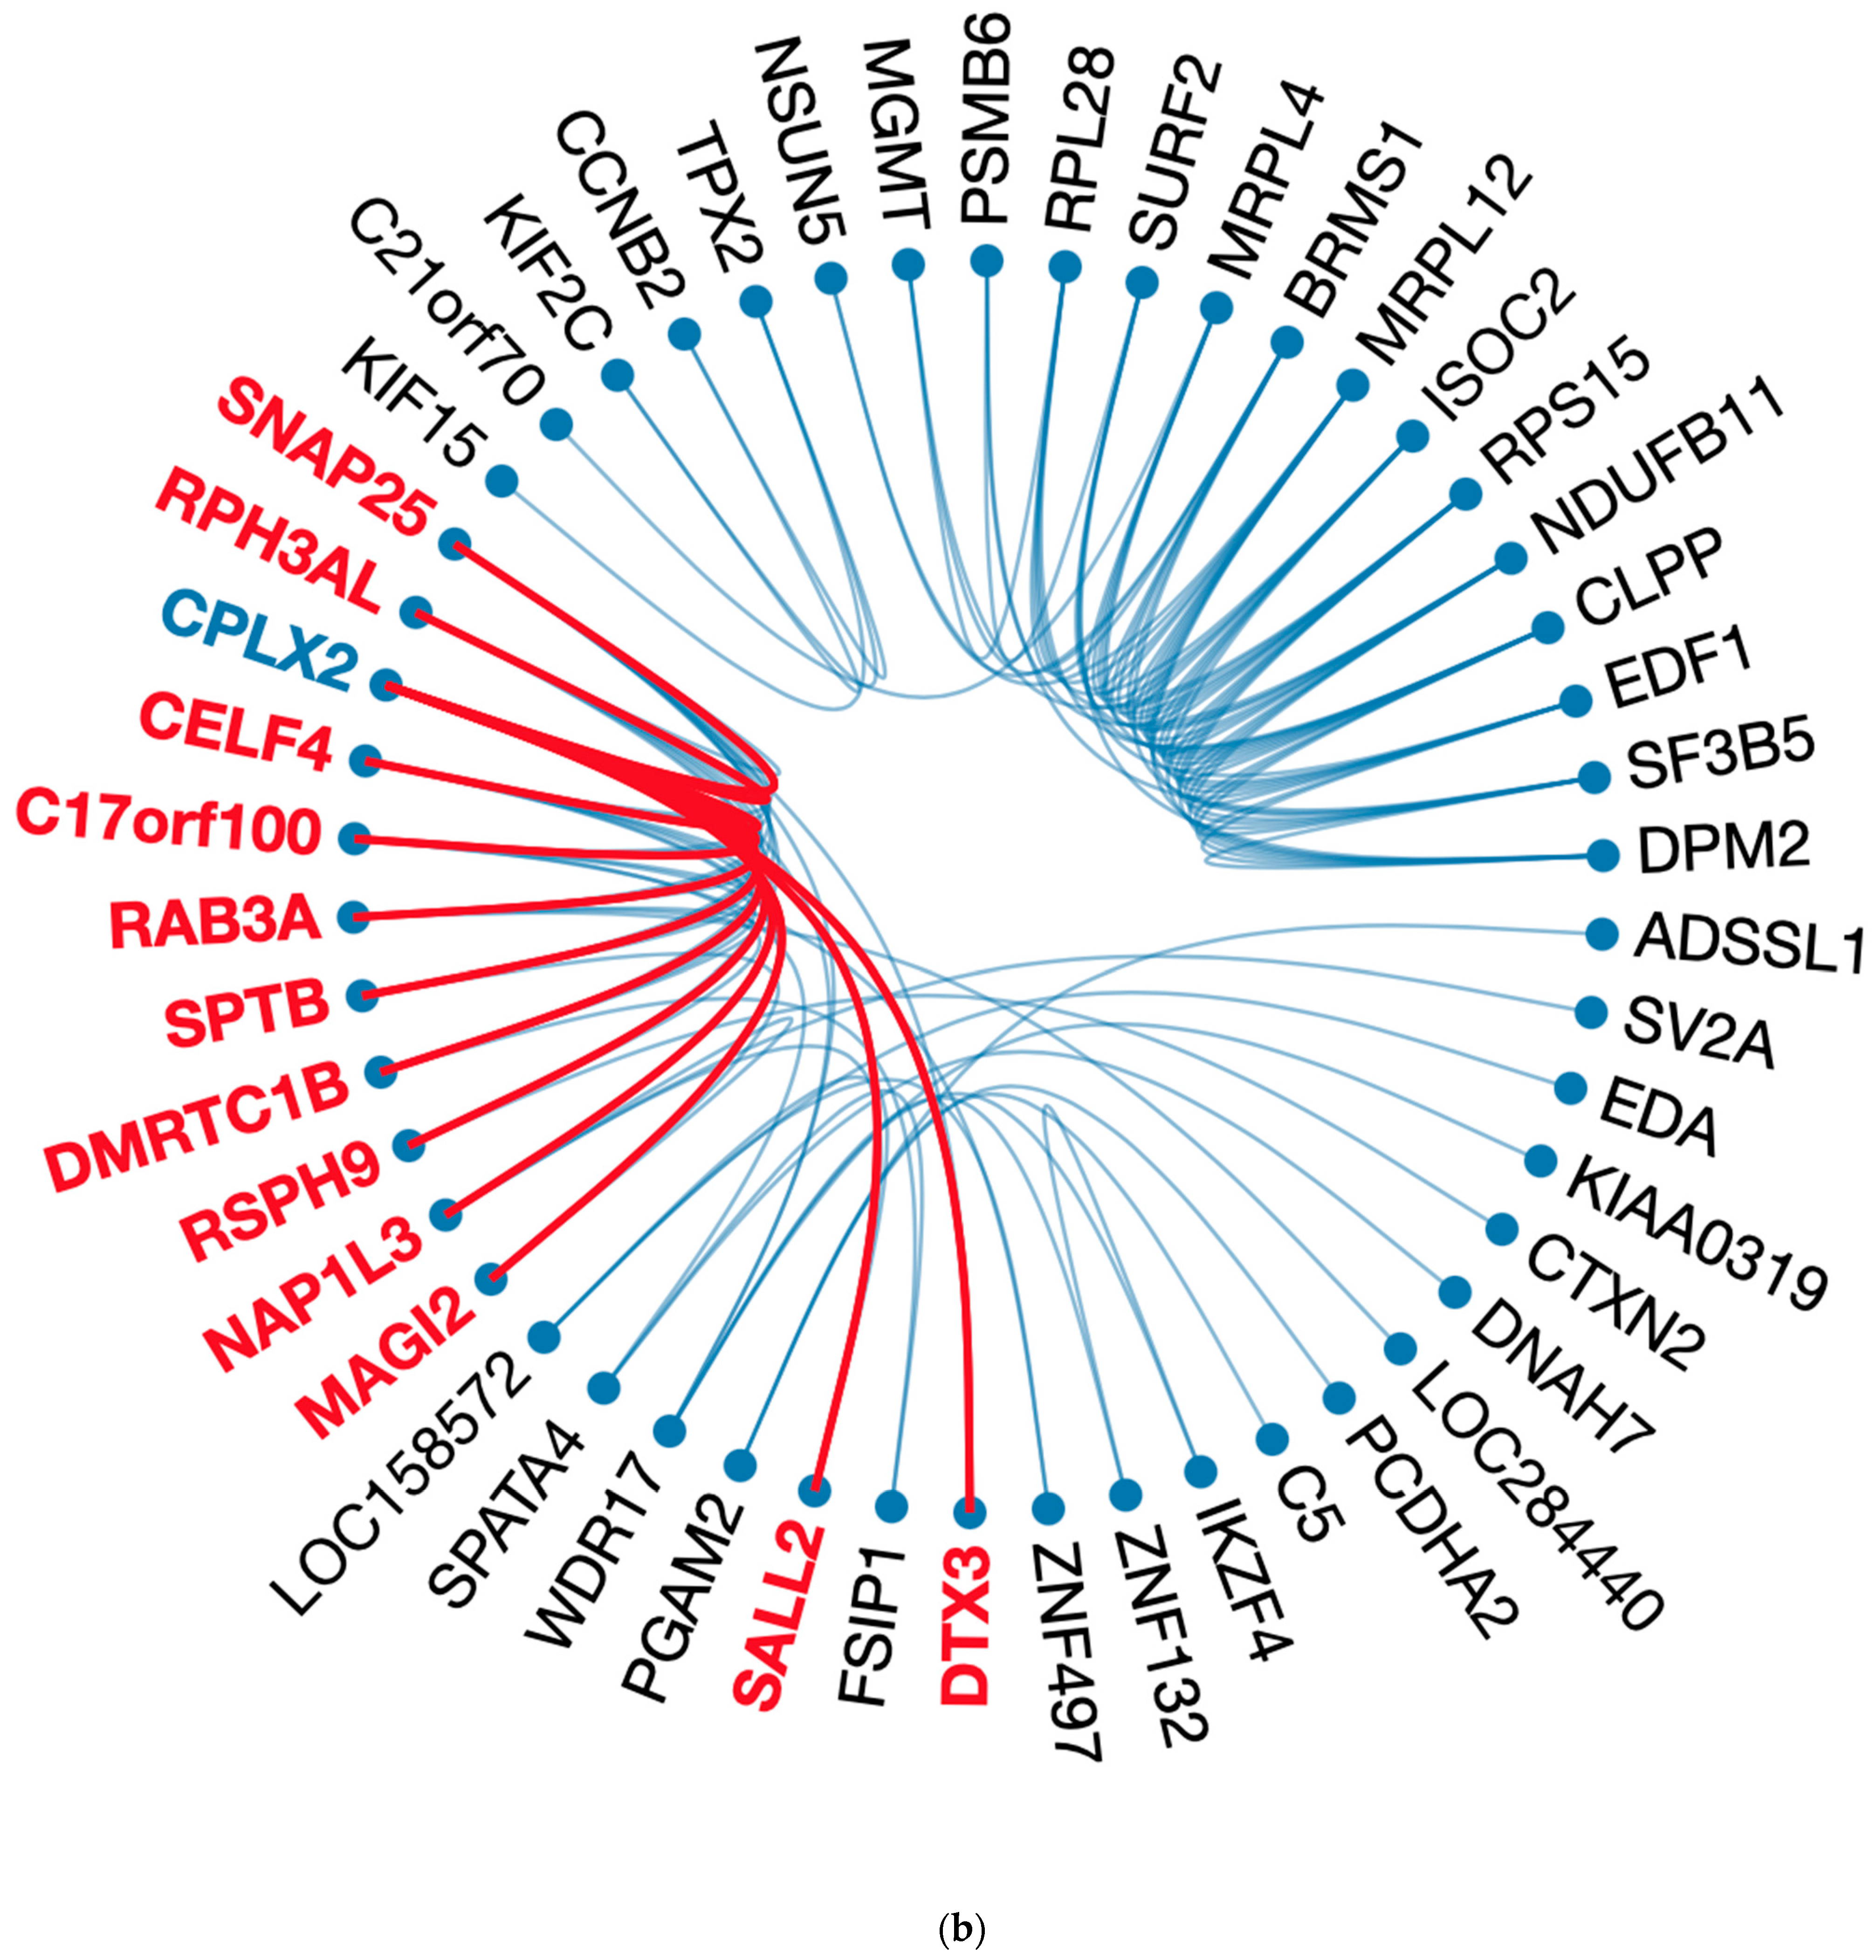
To determine and extract genes highly correlated, we performed statistical learning and visualization approaches to reduce the dimension and reveal gene patterns and associations integrating the analytical procedures from previous computational studies [27,28]. Gene importance in RFC was obtained first to get the top 100 genes, which accounted for 89% of input for our classification effort (Table S2). Then, genes were re-processed via GLASSO to reduce the size to 50 highly associated genes using the gene–gene correlation matrix of CESC and PAAD, respectively. We found that 22 genes existed in both cancer types. Fifty genes formed one large and six small clusters in CESC, and two large clusters in PAAD indicate gene–gene interaction conditioning on POLI expression and potential factors regulating POLI expression (Figure 3).
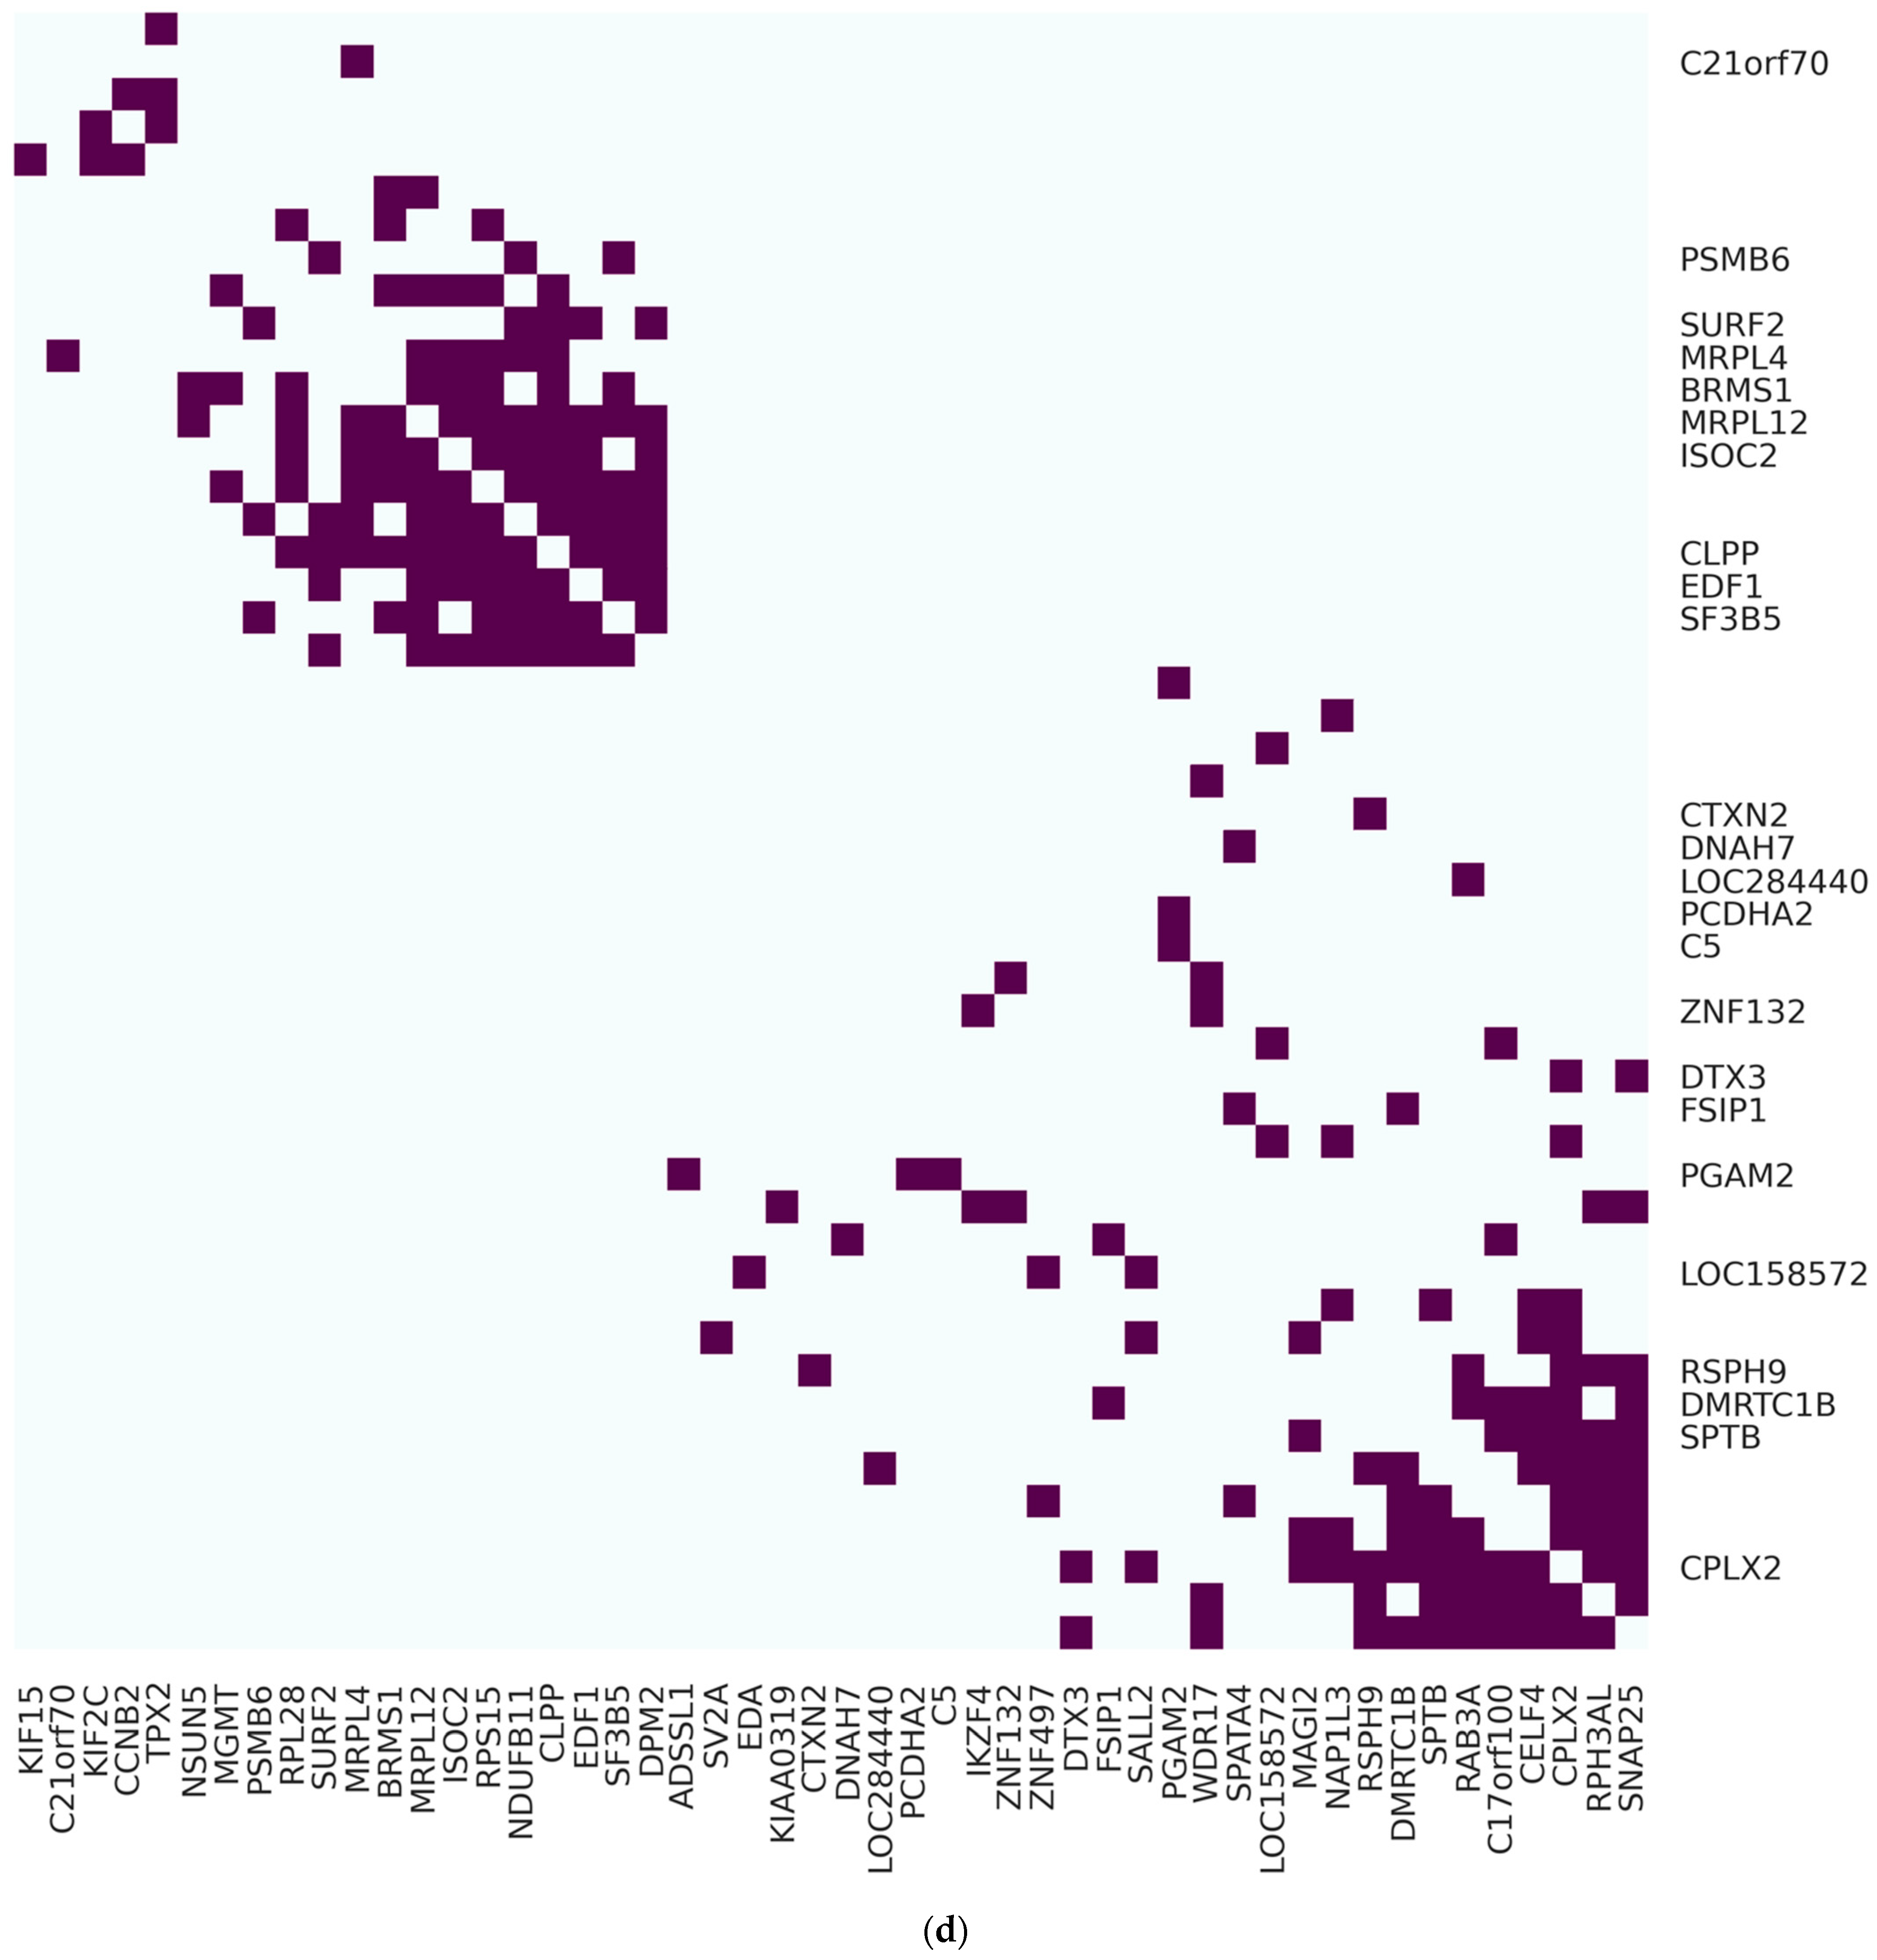
In CESC, AURKAIP1 was associated with 25 genes, forming an isolated cluster consisting of 36 genes. Other independent clusters contained two to four highly associated genes. In PAAD, CPLX2 was associated with 12 genes in one of the large clusters containing 30 genes in total. MRPL4, PSMB6, RSPH9, SURF2, CLPP, DNAH7, MRPL12, ISOC2, C21orf70, BRMS1, EDF1, SF3B5, NAP1L3, NSUN5, DPM2, SALL2, SPATA4, RPS15, MGMT, NDUFB11, SV2A, and RPL28 existed in CESC and PAAD regarding the top 50 highly associated genes. AURKAIP1 and CLPX2 existed in a much sparser gene network with a reduction to 25 vertices in CESC and PAAD (Figure S5).
We were also able to convert the circus plot to a heatmap layout, which showed gene-gene clusters and partitions in a comprehensive way. Vertical gene names were hidden when they were out of the top 50 genes in RFC. Almost half of the genes in CESC (28/50) and PAAD (24/50) were the top 50 genes evaluated by RFC.
2.6. Gene Ontology Enrichment Analysis
We next considered the known functional relationship among the genes selected from RFC using the gene ontology enrichment analysis and visualization tool (GOrilla) [29]. These ranked biological processes based on the extent that genes selected by RFC were enriched. The top five biological processes are summarized in Table 3, which also includes the ranking (by RFC) of the individual genes found to be enriched in each biological process. We also indicated whether these 100 genes were involved in the 50 most associated genes in CESC, PAAD, or not. This analysis identified enrichments in pathways linked with mitochondrial activities, Wnt signaling, and tumor necrosis factor-mediated (TNF-mediated) signaling pathways.
3. Discussion
Here, we describe our efforts to identify a subset of genes capable of classifying tumors into two groups; one where increased POLI expression will correlate with improved odds of survival (pancreatic-like or Group II) and the other with the opposite relationship between POLI expression and patient outcome (cervical-like or Group I). To achieve this goal, we applied multiple computational approaches combining supervised and unsupervised machine/statistical learning methods to address the classification, feature selection, and network analysis. This supports our hypothesis that the prognostic value of POLI expression is determined by the transcriptome of an individual tumor. Changes in the prognostic value of gene expression could be influenced by mutations in the gene that resulted in a different interactome. To determine the likelihood that the results reported here were driven by POLI mutations among tumor types, we determined the frequency of POLI mutations in each TCGA database used for this analysis. Specifically, POLI mutations were found in only 3.0% of these tumors overall and there were only small variations in POLI mutation frequency among the tumor types analyzed in this study (1.4–5.0%). Our analysis does not support the hypothesis that POLI mutations are a robust determinant of the prognostic value of POLI (not shown).
The insights provided here could serve as the basis for improving the use of biomarkers to guide cancer therapies. Currently, individual markers (or a panel of markers) are used to guide patient care. For example, platinum-based therapies (e.g., cisplatin) might not be used in someone with a high expression of POLI. However, our data suggest that elevated POLI expression does not always manifest in resistance to platinum-based drugs. Further, our work implies that it is possible to use transcriptomic data to predict when POLI will or will not be a useful indicator of resistance to therapy.
Computational cancer studies usually focus on a specific cancer type. We proposed a methodical way to merge and normalize patients with different cancers. Normally, clinical data, i.e., age, gender, diagnoses, and smoking history were considered as the input in Cox proportional hazard regression model for risk classification [30]. In this study, the prognostic value of POLI was not demonstrated in cancers other than CESC and PAAD before the binary classification. To avoid arbitrary diagnosis using data from a large population of specific cancers, varied gene signatures of patients should be taken into account. Our approach incorporated unsupervised learning on gene selection and supervised learning on classifying patients to build the classifier that can discriminate between a positive and negative prognosis value of POLI expression. This approach connected apparent randomness and sophisticated gene correlation. Previous studies have shown the success of connecting a subset of genes to survival [31].
There are gaps not addressed in our work. Most obviously, we do not directly consider resistance to platinum-based drugs in our analysis, using survival data as an indirect metric of responsiveness to therapy. Although platinum-based drugs are widely used, patient outcomes are influenced by a myriad of factors and our analysis does not address this nuance [32]. Further, the classification scheme described here was not able to segregate several types of cancers based on their ability to predict this prognostic value of POLI expression. Thus, there are several areas where our work can be refined through future efforts.
Another area where continued effort is warranted is in determining the biological mechanisms that dictate whether POLI is a positive or negative prognostic factor. This understanding could allow specific therapeutic targets to be identified with the potential to improve outcomes for all tumors with/without increased POLI expression. We began addressing the biological significance of the genes in our classifier in this study using GO enrichment analysis of the top 100 genes identified by RFC. This analysis linked the genes to several biological processes of known significance in tumorigenesis. For instance, there was a significant enrichment in genes involved in TNFα and WNT signaling. These pathways act as tumor suppressors. We also found enrichment in biological functions associated with cell metabolism (i.e., mitochondrial elongation and termination). AURKAIP1 has been identified as a valuable feature It has been shown that AURKAIP1 promotes Aurora-A, an oncogene, the overexpression of which attributes to aneuploidy and could lead to cancer potentially [33]. Unlike AURKAIP1, which was negatively associated with POLI expression in CESC and PAAD, CPLX2 only showed a significantly strong association with POLI expression in PAAD. Our survival analysis of patients in Group 2 included two lung cancer datasets, LUAD and LUSC (Figure 2b). It has been reported that CPLX2 could be a reasonable biomarker in high-grade lung cancer [34]. As the one highly associated with other genes in PAAD, for those patients clustered in Group 2, CPLX2 regulated POLI expression might mediate patient survival. It is notable that of many of the genes and biological processes that could have been included in our classification scheme, we found such an enrichment for those closely linked with tumorigenesis.
Finally, in this study, we have compared the feasibility of decision-tree based models (i.e., RF and GB) with NN for cancer patient classification. Results corroborate the robustness and flexibility of RFC over the other two algorithms for the given dataset and settings (Figures S3 and S4). Due to the capability of RF in handling a large set of gene features with a lot of background noise simultaneously without overfitting and massive hyperparameter tuning, RF outperforms NN. This suggests that RF is the better machine learning approach when identifying transcriptomic changes that influence the prognostic value of a gene of interest.
4. Materials and Methods
4.1. Data curation
RNA sequence data of 11 cancer types and clinical data were downloaded and integrate to 1DATA databank from the Broad GDAD Firehouse (http://gdac.broadinstitute.org, accessed on 20 June 2022), including CESC (309 patients) [35], PAAD (183 patients) [36], BLCA (427 patients) [37], BRCA (1212 patients) [38], COADREAD (433 patients) [39], HNSC (566 patients) [40], LIHC (423 patients) [41], LUAD (576 patients) [42,43], LUSC (552 patients) [42,43], OV (307 patients) [44], SKCM (473 patients) [45], STAD (450 patients) [46], and UCEC (201 patients) [47]. The number of fragments per kilobase of exon per million reads of POLI expression data was downloaded from the Human Protein Atlas (https://www.proteinatlas.org/ (accessed on 21 November 2021)). The different steps of data processing, filtering, and feature selection from curation to survival analysis via machine and statistical learning were described in the flowchart (Figure 4).
4.2. Genes Associated with POLI in CESC and PAAD
Genes used to build the classifier were selected from CESC and PAAD separately. A total of 1000 genes, which consisted of the top 500 positively associated with POLI and the top 500 negatively associated were combined for CESC and PAAD, respectively. GLASSO was applied to introduce the sparsity to the inverse covariance matrix for gene–gene correlation and select the highly associated 200 genes from 1000 merged genes [48]. A total of 200 genes from CESC and another 200 genes from PAAD were joined as the final gene list as the classifier features.
RNA sequence data were log-transformed to have the standardization for each gene and each cancer type, separately. The final size of gene variables was 396 after merging 200 genes from CESC and PAAD.
4.3. Random Forest Classifier
The opposite relationship between POLI and survival in CESC and PAAD was the basis that genes associated with POLI in two cancers would perform classification and can be extended to calculate the similarity in other cancer types as well. RFC was built using 396 genes selected previously to have the model and parameter. For this step, the under-sampling method was applied to eliminate the impact due to more patients in CESC that the classifier would not predict more testing data to CESC. An amount of 70% of CESC and PAAD were kept as the training data for the classifier. The other 30% of CESC and PAAD data were used to validate the performance of the classifier. The data of patients in 11 other cancers were then differentiated through a model based on CESC and PAAD.
4.4. Survival Analysis
For cancer data integration, survival time was divided by the max length of date in individual cancer type and multiplied by 1000. The K–M curve was used for the analysis of study groups with over-expression or under-expression POLI and survival time [49].
4.5. Gene Function Validation
GOrilla was used to identify enriched gene ontology terms regarding 396 genes built for the cancer classifier [29]. The top 100 genes from RFC via the feature importance method were tuned via GLASSO down to the 50 most associated genes focusing on the core regulating POLI in CESC and PAAD, respectively.
4.6. Visualization
The circus layout was set to show the association between 50 genes for pathway validation. The reverse Cuthill–Mckee (RCM) reordering method was employed to permute sparse matrices into a band matrix that associated genes were reordered toward the diagonal [50]. The connection between genes was encouraged to have less crossing in order to unmask the core circus plot of gene clustering.
4.7. Softwares
We performed K–M survival and gene network analysis using R version 4.1 and Python 3.9. RCM was implemented in MATLAB R2019b (version 9.7; MathWorks Inc., Natick, MA, USA; RRID: SCR_001622). GLASSO, K–M plots, and circos plots were generated using R package huge, survival, and edgebundleR. Heatmaps were generated Python module Seaborn.
Supplementary Materials
The following supporting information can be downloaded at: https://www.mdpi.com/article/10.3390/ijms23158571/s1.
Author Contributions
Conceptualization, X.X. and N.A.W.; methodology, X.X. and M.J.-D.; software, X.X.; validation, X.X., M.J.-D. and N.A.W.; formal analysis, X.X.; investigation, X.X. and N.A.W.; data curation, X.X.; writing—original draft preparation, X.X.; writing—review and editing, X.X., M.J.-D. and N.A.W.; visualization, X.X.; project administration, X.X. and N.A.W.; funding acquisition, X.X., M.J.-D. and N.A.W. All authors have read and agreed to the published version of the manuscript.
Funding
This research was funded by an Institutional Development Award (IDeA) from the National Institute of General Medical Sciences of the National Institutes of Health under grant number P20 GM103418 (NAW and XX) and BioNexus KC 20-7 Nexus of Animal and Human Health Research Grant (MJD). Research reported in this manuscript was supported by the National Institute of General Medical Sciences of the National Institutes of Health (P20GM130448) (NAW); National Cancer Institute of the National Institutes of Health (NCI R15 CA242057 01A1, NAW); Johnson Cancer Research Center in Kansas State University (NAW; and the U.S. Department of Defense (CMDRP PRCRP CA160224 (NAW)).
Institutional Review Board Statement
Not applicable.
Informed Consent Statement
Not applicable.
Data Availability Statement
All data analyzed in this report is publicly available. We include references to the original sources the data in the text.
Conflicts of Interest
The authors declare no conflict of interest.
References
- Srivastava, A.K.; Han, C.; Zhao, R.; Cui, T.; Dai, Y.; Mao, C.; Zhao, W.; Zhang, X.; Yu, J.; Wang, Q.-E. Enhanced Expression of DNA Polymerase Eta Contributes to Cisplatin Resistance of Ovarian Cancer Stem Cells. Proc. Natl. Acad. Sci. USA 2015, 112, 4411–4416. [Google Scholar] [CrossRef] [Green Version]
- Tchounwou, P.B.; Dasari, S.; Noubissi, F.K.; Ray, P.; Kumar, S. Advances in Our Understanding of the Molecular Mechanisms of Action of Cisplatin in Cancer Therapy. J. Exp. Pharmacol. 2021, 13, 303–328. [Google Scholar] [CrossRef] [PubMed]
- Xu, X.; Xie, K.; Zhang, X.-Q.; Pridgen, E.M.; Park, G.Y.; Cui, D.S.; Shi, J.; Wu, J.; Kantoff, P.W.; Lippard, S.J. Enhancing Tumor Cell Response to Chemotherapy through Nanoparticle-Mediated Codelivery of SiRNA and Cisplatin Prodrug. Proc. Natl. Acad. Sci. USA 2013, 110, 18638–18643. [Google Scholar] [CrossRef] [PubMed] [Green Version]
- Rose, P.G.; Bundy, B.N.; Watkins, E.B.; Thigpen, J.T.; Deppe, G.; Maiman, M.A.; Clarke-Pearson, D.L.; Insalaco, S. Concurrent Cisplatin-Based Radiotherapy and Chemotherapy for Locally Advanced Cervical Cancer. N. Engl. J. Med. 1999, 340, 1144–1153. [Google Scholar] [CrossRef] [PubMed]
- McCulloch, S.D.; Kunkel, T.A. The Fidelity of DNA Synthesis by Eukaryotic Replicative and Translesion Synthesis Polymerases. Cell Res. 2008, 18, 148–161. [Google Scholar] [CrossRef] [PubMed] [Green Version]
- Bienko, M.; Green, C.M.; Crosetto, N.; Rudolf, F.; Zapart, G.; Coull, B.; Kannouche, P.; Wider, G.; Peter, M.; Lehmann, A.R.; et al. Ubiquitin-Binding Domains in Y-Family Polymerases Regulate Translesion Synthesis. Science 2005, 310, 1821–1824. [Google Scholar] [CrossRef]
- Rocha, C.R.R.; Silva, M.M.; Quinet, A.; Cabral-Neto, J.B.; Menck, C.F.M. DNA Repair Pathways and Cisplatin Resistance: An Intimate Relationship. Clinics 2018, 73, e478s. [Google Scholar] [CrossRef] [PubMed]
- Gomes, L.R.; Rocha, C.R.R.; Martins, D.J.; Fiore, A.P.Z.P.; Kinker, G.S.; Bruni-Cardoso, A.; Menck, C.F.M. ATR Mediates Cisplatin Resistance in 3D-Cultured Breast Cancer Cells via Translesion DNA Synthesis Modulation. Cell Death Dis. 2019, 10, 459. [Google Scholar] [CrossRef] [PubMed]
- Lange, S.S.; Takata, K.; Wood, R.D. DNA Polymerases and Cancer. Nat. Rev. Cancer 2011, 11, 96–110. [Google Scholar] [CrossRef] [PubMed] [Green Version]
- Yuan, F.; Xu, Z.; Yang, M.; Wei, Q.; Zhang, Y.; Yu, J.; Zhi, Y.; Liu, Y.; Chen, Z.; Yang, J. Overexpressed DNA Polymerase Iota Regulated by JNK/c-Jun Contributes to Hypermutagenesis in Bladder Cancer. PLoS ONE 2013, 8, e69317. [Google Scholar] [CrossRef]
- Makridakis, N.; Reichardt, J. Translesion DNA Polymerases and Cancer. Front. Genet. 2012, 3, 174. [Google Scholar] [CrossRef] [PubMed] [Green Version]
- Zhao, Y.; Biertümpfel, C.; Gregory, M.T.; Hua, Y.-J.; Hanaoka, F.; Yang, W. Structural Basis of Human DNA Polymerase η-Mediated Chemoresistance to Cisplatin. Proc. Natl. Acad. Sci. USA 2012, 109, 7269–7274. [Google Scholar] [CrossRef] [PubMed] [Green Version]
- Wendel, S.O.; Snow, J.A.; Bastian, T.; Brown, L.; Hernandez, C.; Burghardt, E.; Kahn, A.; Murthy, V.; Neill, D.; Smith, Z.C.; et al. High Risk α-HPV E6 Impairs Translesion Synthesis by Blocking POLη Induction. Cancers 2021, 13, 28. [Google Scholar] [CrossRef]
- Xie, K.; Doles, J.; Hemann, M.T.; Walker, G.C. Error-Prone Translesion Synthesis Mediates Acquired Chemoresistance. Proc. Natl. Acad. Sci. USA 2010, 107, 20792–20797. [Google Scholar] [CrossRef] [PubMed] [Green Version]
- Agajanian, S.; Oluyemi, O.; Verkhivker, G.M. Integration of Random Forest Classifiers and Deep Convolutional Neural Networks for Classification and Biomolecular Modeling of Cancer Driver Mutations. Front. Mol. Biosci. 2019, 6, 44. [Google Scholar] [CrossRef]
- Zhu, W.; Xie, L.; Han, J.; Guo, X. The Application of Deep Learning in Cancer Prognosis Prediction. Cancers 2020, 12, 603. [Google Scholar] [CrossRef] [PubMed] [Green Version]
- Kourou, K.; Exarchos, T.P.; Exarchos, K.P.; Karamouzis, M.V.; Fotiadis, D.I. Machine Learning Applications in Cancer Prognosis and Prediction. Comput. Struct. Biotechnol. J. 2015, 13, 8–17. [Google Scholar] [CrossRef] [PubMed] [Green Version]
- Cruz, J.A.; Wishart, D.S. Applications of Machine Learning in Cancer Prediction and Prognosis. Cancer Inform. 2006, 2, 117693510600200030. [Google Scholar] [CrossRef]
- Bishop, C.M.; Nasrabadi, N.M. Pattern Recognition and Machine Learning; Springer: Berlin, Germany, 2006; Volume 4. [Google Scholar]
- Breiman, L. Random Forests. Mach. Learn. 2001, 45, 5–32. [Google Scholar] [CrossRef] [Green Version]
- Friedman, J.H. Greedy Function Approximation: A Gradient Boosting Machine. Ann. Stat. 2001, 29, 1189–1232. [Google Scholar] [CrossRef]
- Tan, A.C.; Gilbert, D. Ensemble Machine Learning on Gene Expression Data for Cancer Classification. Appl. Bioinform. 2003, 2, S75–S83. [Google Scholar]
- Costanzo, M.; VanderSluis, B.; Koch, E.N.; Baryshnikova, A.; Pons, C.; Tan, G.; Wang, W.; Usaj, M.; Hanchard, J.; Lee, S.D.; et al. A Global Genetic Interaction Network Maps a Wiring Diagram of Cellular Function. Science 2016, 353, aaf1420. [Google Scholar] [CrossRef]
- Qu, Y.; Adam, B.-L.; Yasui, Y.; Ward, M.D.; Cazares, L.H.; Schellhammer, P.F.; Feng, Z.; Semmes, O.J.; Wright, G.L. Boosted Decision Tree Analysis of Surface-Enhanced Laser Desorption/Ionization Mass Spectral Serum Profiles Discriminates Prostate Cancer from Noncancer Patients. Clin. Chem. 2002, 48, 1835–1843. [Google Scholar] [CrossRef] [PubMed] [Green Version]
- Ludwig, S.A.; Picek, S.; Jakobovic, D. Classification of Cancer Data: Analyzing Gene Expression Data Using a Fuzzy Decision Tree Algorithm. In Operations Research Applications in Health Care Management; Kahraman, C., Topcu, Y.I., Eds.; International Series in Operations Research & Management Science; Springer International Publishing: Cham, UK, 2018; pp. 327–347. ISBN 9783319654553. [Google Scholar]
- Su, Y.; Shen, J.; Qian, H.; Ma, H.; Ji, J.; Ma, H.; Ma, L.; Zhang, W.; Meng, L.; Li, Z.; et al. Diagnosis of Gastric Cancer Using Decision Tree Classification of Mass Spectral Data. Cancer Sci. 2007, 98, 37–43. [Google Scholar] [CrossRef] [PubMed]
- Xu, X.; Kawakami, J.; Gedara, N.I.M.; Riviere, J.E.; Meyer, E.; Wyckoff, G.J.; Jaberi-Douraki, M. Data Mining Methodology for Response to Hypertension Symptomology—Application to COVID-19-Related Pharmacovigilance. Elife 2021, 10, e70734. [Google Scholar] [CrossRef] [PubMed]
- Millagaha Gedara, N.I.; Xu, X.; DeLong, R.; Aryal, S.; Jaberi-Douraki, M. Global Trends in Cancer Nanotechnology: A Qualitative Scientific Mapping Using Content-Based and Bibliometric Features for Machine Learning Text Classification. Cancers 2021, 13, 4417. [Google Scholar] [CrossRef] [PubMed]
- Eden, E.; Navon, R.; Steinfeld, I.; Lipson, D.; Yakhini, Z. GOrilla: A Tool for Discovery and Visualization of Enriched GO Terms in Ranked Gene Lists. BMC Bioinform. 2009, 10, 48. [Google Scholar] [CrossRef] [PubMed] [Green Version]
- Chen, Y.-C.; Ke, W.-C.; Chiu, H.-W. Risk Classification of Cancer Survival Using ANN with Gene Expression Data from Multiple Laboratories. Comput. Biol. Med. 2014, 48, 1–7. [Google Scholar] [CrossRef] [PubMed]
- Ein-Dor, L.; Kela, I.; Getz, G.; Givol, D.; Domany, E. Outcome Signature Genes in Breast Cancer: Is There a Unique Set? Bioinformatics 2005, 21, 171–178. [Google Scholar] [CrossRef] [PubMed] [Green Version]
- Vasan, N.; Baselga, J.; Hyman, D.M. A View on Drug Resistance in Cancer. Nature 2019, 575, 299–309. [Google Scholar] [CrossRef] [PubMed] [Green Version]
- Lim, S.K.; Gopalan, G. Aurora-A Kinase Interacting Protein 1 (AURKAIP1) Promotes Aurora-A Degradation through an Alternative Ubiquitin-Independent Pathway. Biochem. J. 2007, 403, 119–127. [Google Scholar] [CrossRef] [PubMed] [Green Version]
- Komatsu, H.; Kakehashi, A.; Nishiyama, N.; Izumi, N.; Mizuguchi, S.; Yamano, S.; Inoue, H.; Hanada, S.; Chung, K.; Wei, M. Complexin-2 (CPLX2) as a Potential Prognostic Biomarker in Human Lung High Grade Neuroendocrine Tumors. Cancer Biomark. 2013, 13, 171–180. [Google Scholar] [CrossRef] [PubMed]
- Cancer Genome Atlas Research Network. Integrated Genomic and Molecular Characterization of Cervical Cancer. Nature 2017, 543, 378. [Google Scholar] [CrossRef] [PubMed]
- Raphael, B.J.; Hruban, R.H.; Aguirre, A.J.; Moffitt, R.A.; Yeh, J.J.; Stewart, C.; Robertson, A.G.; Cherniack, A.D.; Gupta, M.; Getz, G. Integrated Genomic Characterization of Pancreatic Ductal Adenocarcinoma. Cancer Cell 2017, 32, 185–203. [Google Scholar] [CrossRef] [PubMed] [Green Version]
- Robertson, A.G.; Kim, J.; Al-Ahmadie, H.; Bellmunt, J.; Guo, G.; Cherniack, A.D.; Hinoue, T.; Laird, P.W.; Hoadley, K.A.; Akbani, R. Comprehensive Molecular Characterization of Muscle-Invasive Bladder Cancer. Cell 2017, 171, 540–556. [Google Scholar] [CrossRef] [Green Version]
- Koboldt, D.C.; Fulton, R.S.; McLellan, M.D.; Schmidt, H.; Kalicki-Veizer, J.; McMichael, J.F.; Fulton, L.L.; Dooling, D.J.; Ding, L.; Mardis, E.R.; et al. Comprehensive Molecular Portraits of Human Breast Tumours. Nature 2012, 490, 61–70. [Google Scholar] [CrossRef] [Green Version]
- Muzny, D.M.; Bainbridge, M.N.; Chang, K.; Dinh, H.H.; Drummond, J.A.; Fowler, G.; Kovar, C.L.; Lewis, L.R.; Morgan, M.B.; Newsham, I.F.; et al. Comprehensive Molecular Characterization of Human Colon and Rectal Cancer. Nature 2012, 487, 330–337. [Google Scholar] [CrossRef] [Green Version]
- Lawrence, M.S.; Sougnez, C.; Lichtenstein, L.; Cibulskis, K.; Lander, E.; Gabriel, S.B.; Getz, G.; Ally, A.; Balasundaram, M.; Birol, I.; et al. Comprehensive Genomic Characterization of Head and Neck Squamous Cell Carcinomas. Nature 2015, 517, 576–582. [Google Scholar] [CrossRef] [Green Version]
- Ally, A.; Balasundaram, M.; Carlsen, R.; Chuah, E.; Clarke, A.; Dhalla, N.; Holt, R.A.; Jones, S.J.; Lee, D.; Ma, Y. Comprehensive and Integrative Genomic Characterization of Hepatocellular Carcinoma. Cell 2017, 169, 1327–1341. [Google Scholar] [CrossRef] [Green Version]
- Collisson, E.A.; Campbell, J.D.; Brooks, A.N.; Berger, A.H.; Lee, W.; Chmielecki, J.; Beer, D.G.; Cope, L.; Creighton, C.J.; Danilova, L.; et al. Comprehensive Molecular Profiling of Lung Adenocarcinoma. Nature 2014, 511, 543–550. [Google Scholar] [CrossRef]
- Campbell, J.D.; Alexandrov, A.; Kim, J.; Wala, J.; Berger, A.H.; Pedamallu, C.S.; Shukla, S.A.; Guo, G.; Brooks, A.N.; Murray, B.A. Distinct Patterns of Somatic Genome Alterations in Lung Adenocarcinomas and Squamous Cell Carcinomas. Nat. Genet. 2016, 48, 607–616. [Google Scholar] [CrossRef] [PubMed] [Green Version]
- Cancer Genome Atlas Research Network. Integrated Genomic Analyses of Ovarian Carcinoma. Nature 2011, 474, 609. [Google Scholar] [CrossRef] [PubMed]
- Akbani, R.; Akdemir, K.C.; Aksoy, B.A.; Albert, M.; Ally, A.; Amin, S.B.; Arachchi, H.; Arora, A.; Auman, J.T.; Ayala, B. Genomic Classification of Cutaneous Melanoma. Cell 2015, 161, 1681–1696. [Google Scholar] [CrossRef] [PubMed] [Green Version]
- Cancer Genome Atlas Research Network. Comprehensive Molecular Characterization of Gastric Adenocarcinoma. Nature 2014, 513, 202. [Google Scholar] [CrossRef] [PubMed] [Green Version]
- Levine, D.A. Integrated Genomic Characterization of Endometrial Carcinoma. Nature 2013, 497, 67–73. [Google Scholar] [CrossRef] [Green Version]
- Meinshausen, N.; Bühlmann, P. High-Dimensional Graphs and Variable Selection with the Lasso. Ann. Stat. 2006, 34, 1436–1462. [Google Scholar] [CrossRef] [Green Version]
- Efron, B. Logistic Regression, Survival Analysis, and the Kaplan-Meier Curve. J. Am. Stat. Assoc. 1988, 83, 414–425. [Google Scholar] [CrossRef]
- Liu, W.-H.; Sherman, A.H. Comparative Analysis of the Cuthill–McKee and the Reverse Cuthill–McKee Ordering Algorithms for Sparse Matrices. SIAM J. Numer. Anal. 1976, 13, 198–213. [Google Scholar] [CrossRef]
Figure 1.
Prognostic value of POLI in CESC, PADD, and combined cancers: (a) Survival analysis of 291 patients in CESC vs. POLI expression; (b) Survival analysis of 176 patients in PAAD vs. POLI expression; (c) Survival analysis of 5213 patients in 11 cancer types.
Figure 1.
Prognostic value of POLI in CESC, PADD, and combined cancers: (a) Survival analysis of 291 patients in CESC vs. POLI expression; (b) Survival analysis of 176 patients in PAAD vs. POLI expression; (c) Survival analysis of 5213 patients in 11 cancer types.


Figure 2.
Reoccurrence of the prognostic value of POLI expression in regrouped cancer types: (a) K-M plot of POLI expression for patients in BRCA, HNSC, LIHC, SKCM, STAD, and UCEC from Group 1; (b) K–M plot of POLI expression for patients in BLCA, BRCA, COADREAD, LUAD, LUSC, OV, STAD, and UCEC from Group 2.


Figure 3.
Visualization for most correlated genes regarding POLI expression in network and heatmap layouts: (a) Circosplot for 50 most POLI-related genes from 100 genes returned by RFC in CESC; (b) Circosplot for 50 most POLI-related genes from 100 genes returned by RFC in PAAD; (c) heatmap layout of 50 genes in (a); (d) heatmap layout of 50 genes in (b). For (c,d) on the y-axis locations, labels of the POLI-related genes were removed when they were not the top 50 important variables in RFC.


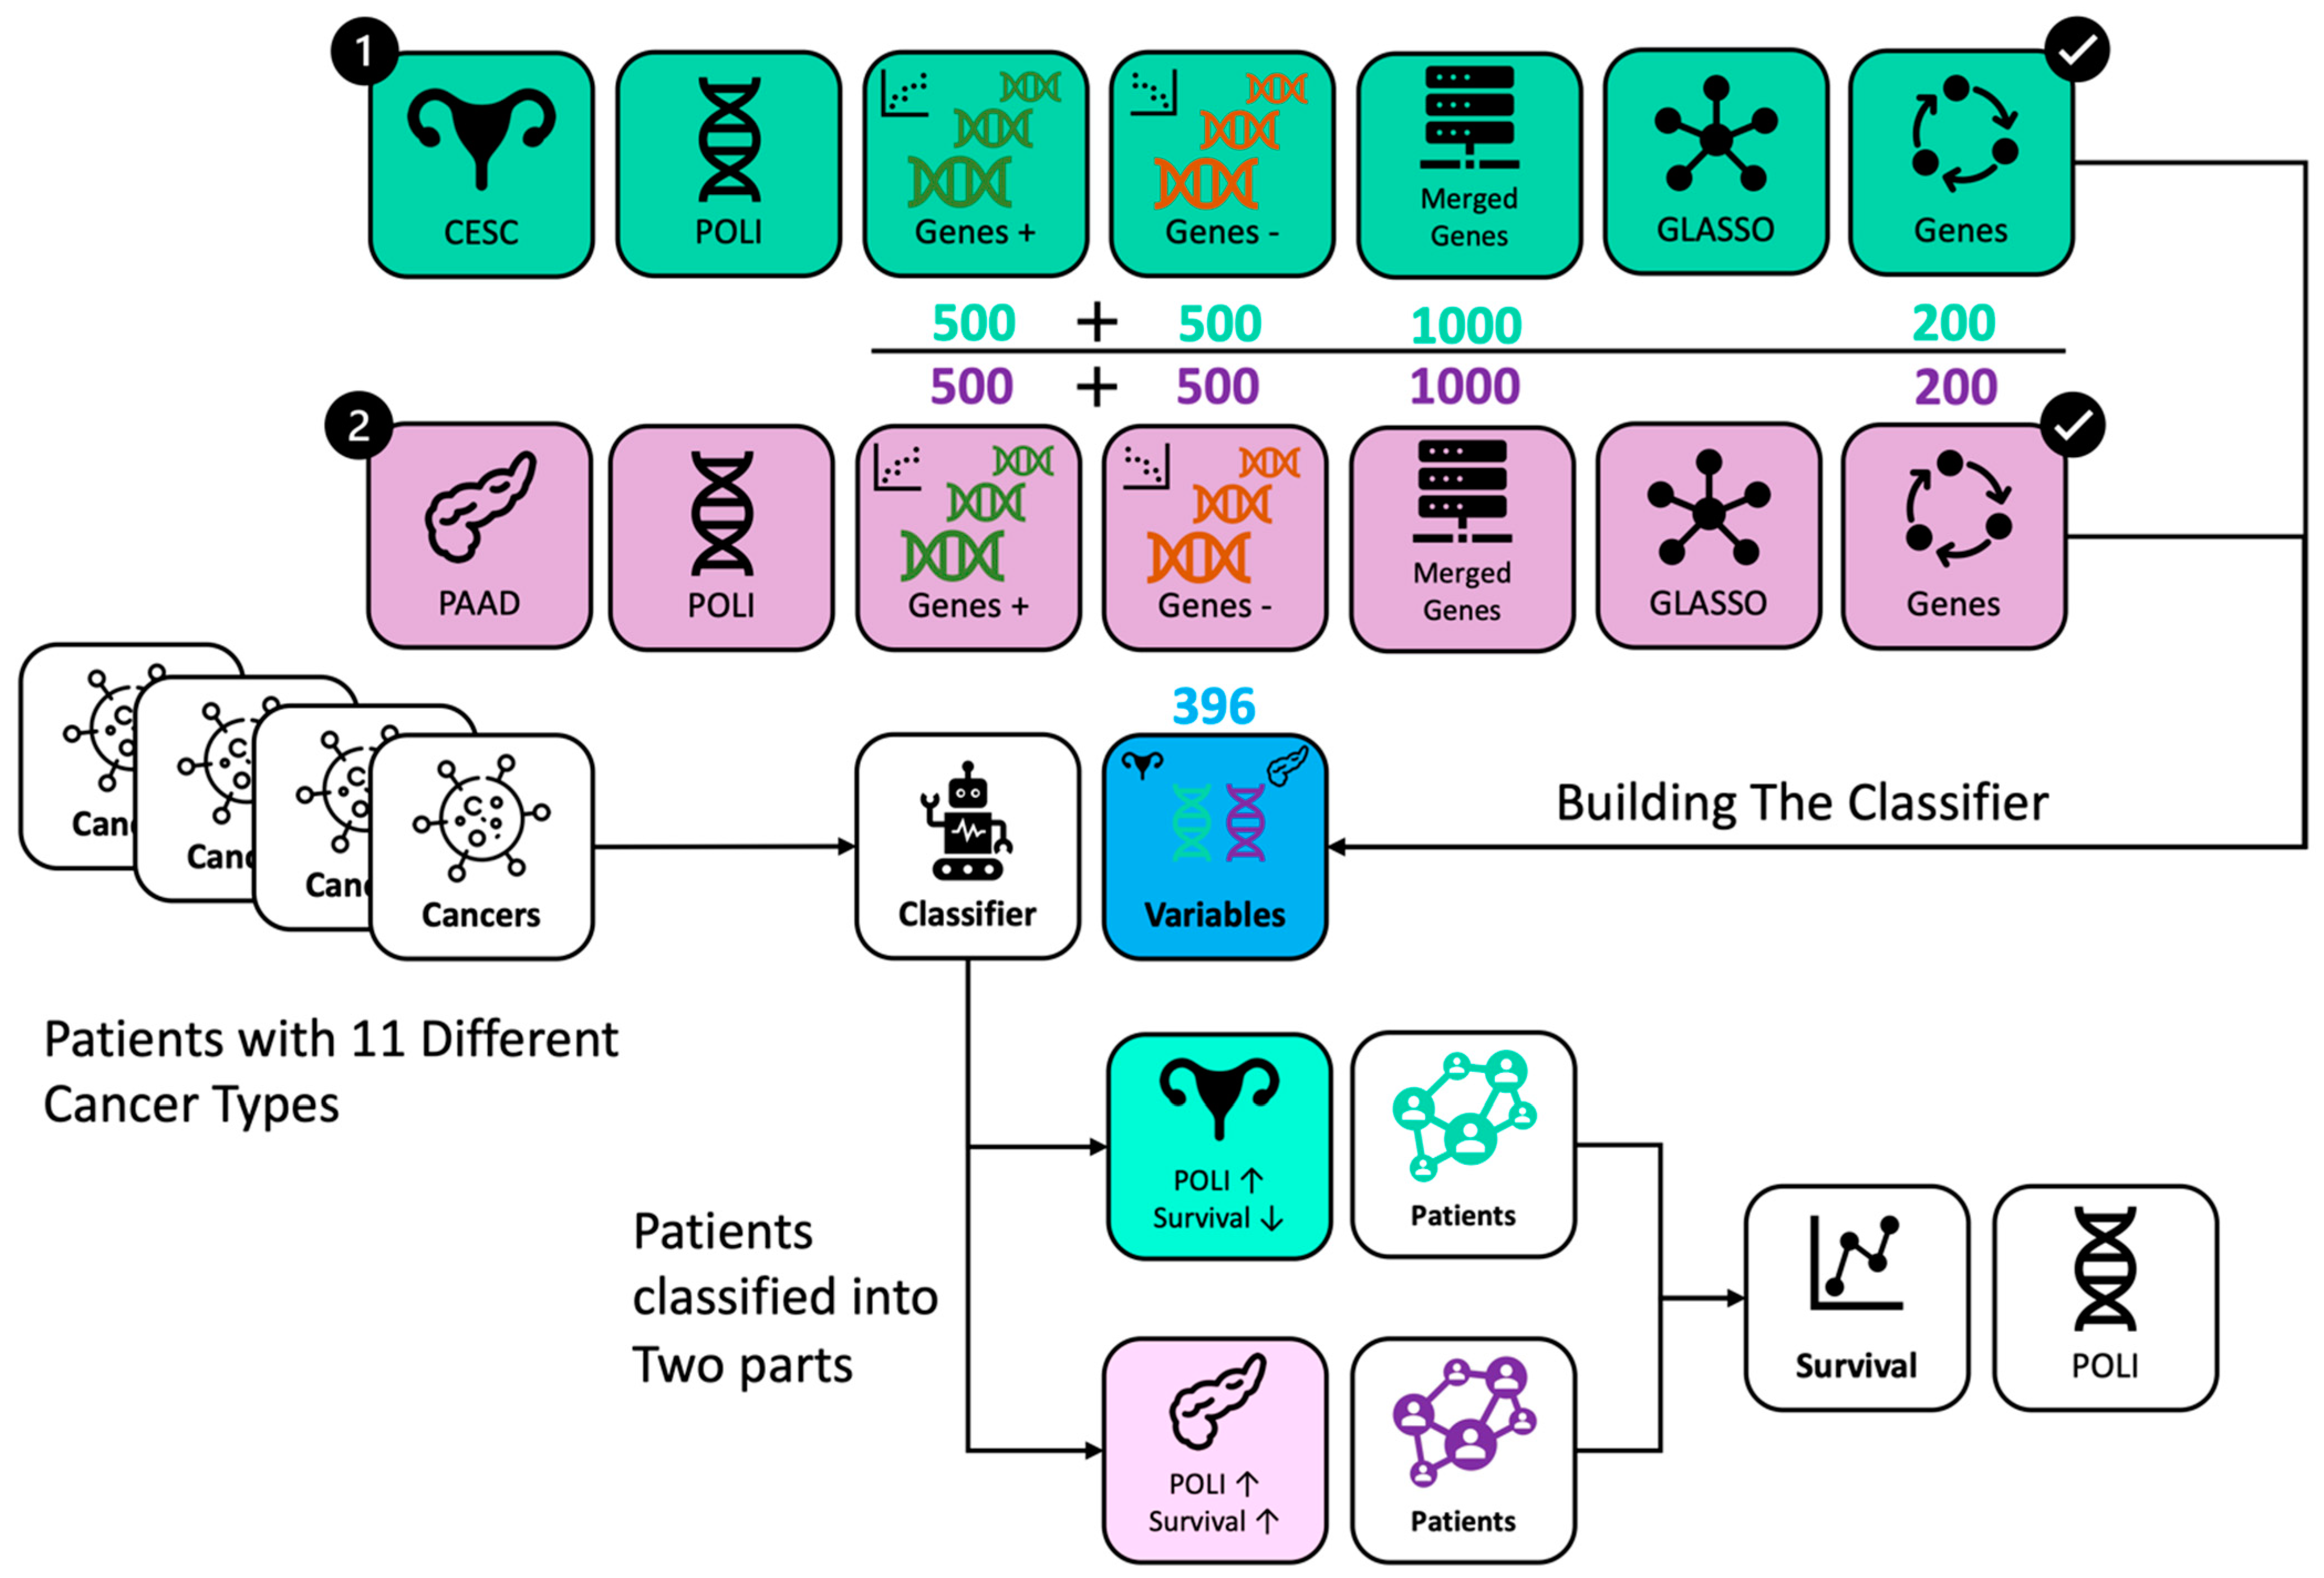
Figure 4.
Workflow of data processing and analysis. Genes were selected from CESC in green and PAAD in purple, respectively. RFC incorporated 396 genes from CESC and PAAD. Patients with different cancer types were classified into two groups with the same POLI signature on survival as in CESC and PAAD.


Table 1.
POLI vs. other gene correlation ranges in CESC and PAAD.
| Caner | Top 500 Positive | Top 500 Negative | ||
|---|---|---|---|---|
| Max | Min | Min | Max | |
| CESC | 0.563 1 | 0.311 | −0.369 | −0.225 |
| PAAD | 0.741 | 0.520 | −0.577 | −0.373 |
1 Each value indicates the Pearson correlation coefficient between POLI and another gene.
Table 2.
The binary classification for 11 cancers based on the prognostic value of POLI-associated genes in CESC and PAAD.
Table 2.
The binary classification for 11 cancers based on the prognostic value of POLI-associated genes in CESC and PAAD.
| Prediction | Cancer | Number |
|---|---|---|
| Group 1, Potentially POLI ↑ Survival ↓ 1 | BLCA | 291 |
| BRCA | 483 | |
| COADREAD | 299 | |
| HNSC | 460 | |
| LIHC | 59 | |
| LUAD | 142 | |
| LUSC | 420 | |
| OV | 189 | |
| SKCM | 299 | |
| STAD | 258 | |
| UCEC | 134 | |
| Group 2, Potentially POLI ↑ Survival ↑ 2 | BLCA | 136 |
| BRCA | 729 | |
| COADREAD | 134 | |
| HNSC | 106 | |
| LIHC | 364 | |
| LUAD | 434 | |
| LUSC | 132 | |
| OV | 118 | |
| SKCM | 174 | |
| STAD | 192 | |
| UCEC | 67 |
1 Group 1, when the result from RFC was CESC. 2 Group 2, when the result from RFC was PAAD. Arrows indicate that in group 1 when POLI expression is increased survival decreased and that in Group 2 when POLI expressing is increased survival increased.
Table 3.
Gene components for enriched biological processes.
| Biological Process | Gene 1 | Rank in RFC 2 |
|---|---|---|
| Mitochondrial translational elongation | MRPL4 MRPL14 MRPL17 MRPL12 MRPL37 MRPL52 AURKAIP1 | 5 6 8 27 63 86 92 |
| Protein-containing complex subunit organization | UBE2S MRPL4 MRPL14 MRPL17 DNAH7 MRPL12 AP2S1 SDHAF2 NAP1L3 IKZF4 MRPL37 NDUFAB1 CENPF MX1 RPS15 KIF2C HMGA1 MRPL52 NDUFB11 CELF4 AURKAIP1 SNAP25 SV2A ADRM1 | 3 5 6 8 24 27 29 38 52 56 63 71 72 79 81 84 85 86 87 90 92 95 97 99 |
| Wnt signaling pathway, planar cell polarity pathway | PSMB8 PSMA7 PSMB6 AP2S1 PSME2 MAGI2 | 1 2 10 29 31 77 |
| Tumor necrosis factor-mediated signaling pathway | PSMB8 PSMA7 PSMB6 KRT8 PSME2 EDA | 1 2 10 23 31 91 |
| Exocytic process | CPLX2 RAB3A SNAP25 SV2A | 28 62 95 97 |
1 Color in the gene column. Gene in three different backgrounds means they were involved in 50 genes that were selected by GLASSO in CESC (green), PAAD (purple), or both (blue). 2 Rank in RFC, the importance of genes in RFC.
Publisher’s Note: MDPI stays neutral with regard to jurisdictional claims in published maps and institutional affiliations. |
© 2022 by the authors. Licensee MDPI, Basel, Switzerland. This article is an open access article distributed under the terms and conditions of the Creative Commons Attribution (CC BY) license (https://creativecommons.org/licenses/by/4.0/).
Share and Cite
MDPI and ACS Style
Xu, X.; Jaberi-Douraki, M.; Wallace, N.A. Predicting the Prognostic Value of POLI Expression in Different Cancers via a Machine Learning Approach. Int. J. Mol. Sci. 2022, 23, 8571. https://doi.org/10.3390/ijms23158571
AMA Style
Xu X, Jaberi-Douraki M, Wallace NA. Predicting the Prognostic Value of POLI Expression in Different Cancers via a Machine Learning Approach. International Journal of Molecular Sciences. 2022; 23(15):8571. https://doi.org/10.3390/ijms23158571
Chicago/Turabian StyleXu, Xuan, Majid Jaberi-Douraki, and Nicholas A. Wallace. 2022. "Predicting the Prognostic Value of POLI Expression in Different Cancers via a Machine Learning Approach" International Journal of Molecular Sciences 23, no. 15: 8571. https://doi.org/10.3390/ijms23158571
Note that from the first issue of 2016, this journal uses article numbers instead of page numbers. See further details here.