
Neuroimaging Modalities in Alzheimer’s Disease: Diagnosis and Clinical Features


Abstract
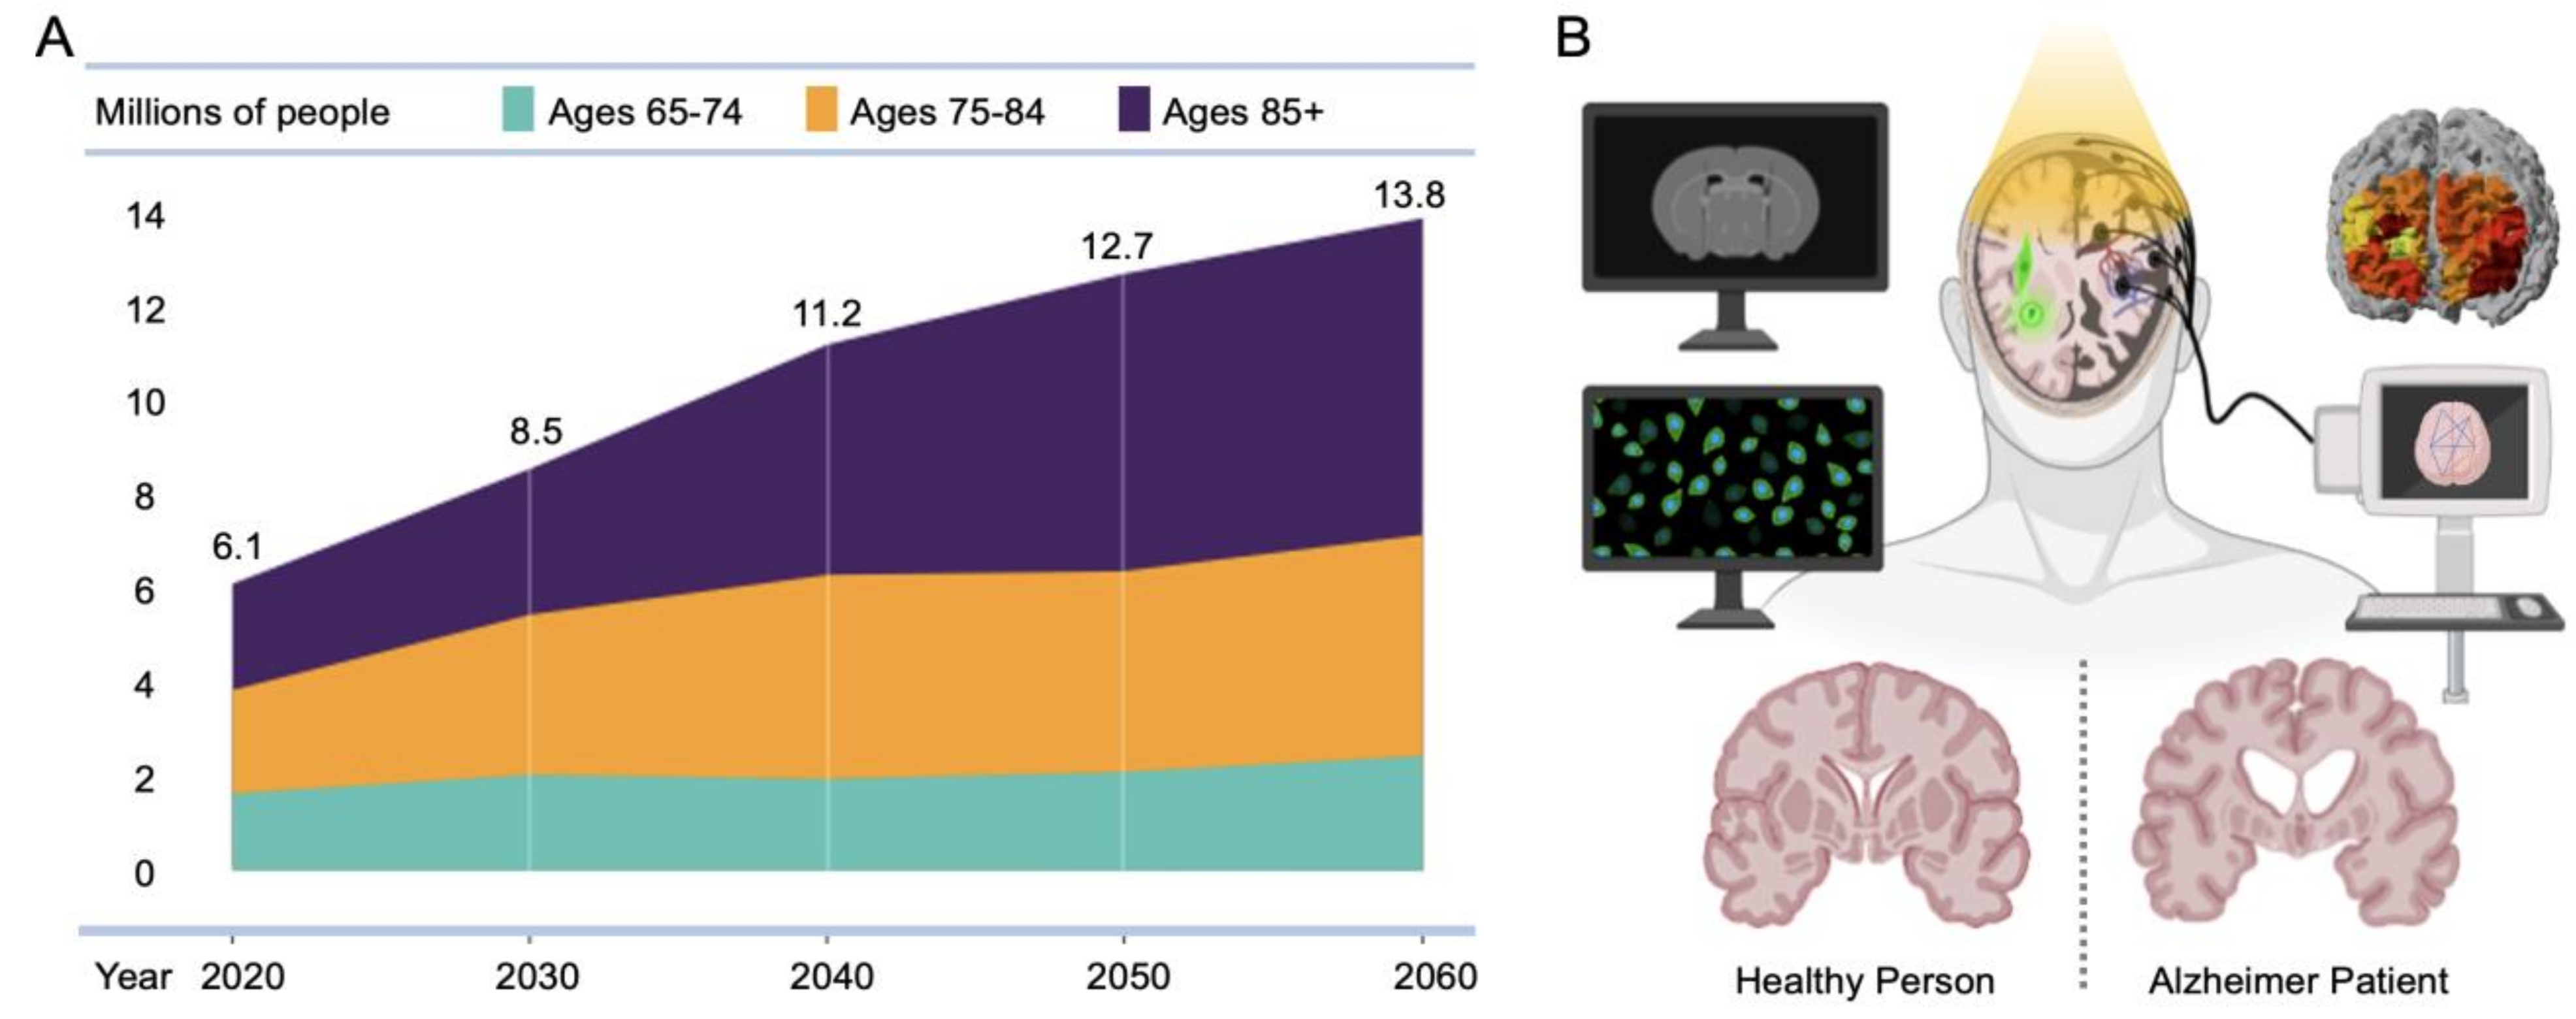
:1. Introduction
2. Neuroimaging Modalities in AD
2.1. Structural MRI
2.1.1. Basic Principles
2.1.2. Applications in AD Diagnosis
2.1.3. Pros and Cons of Using MRI in AD

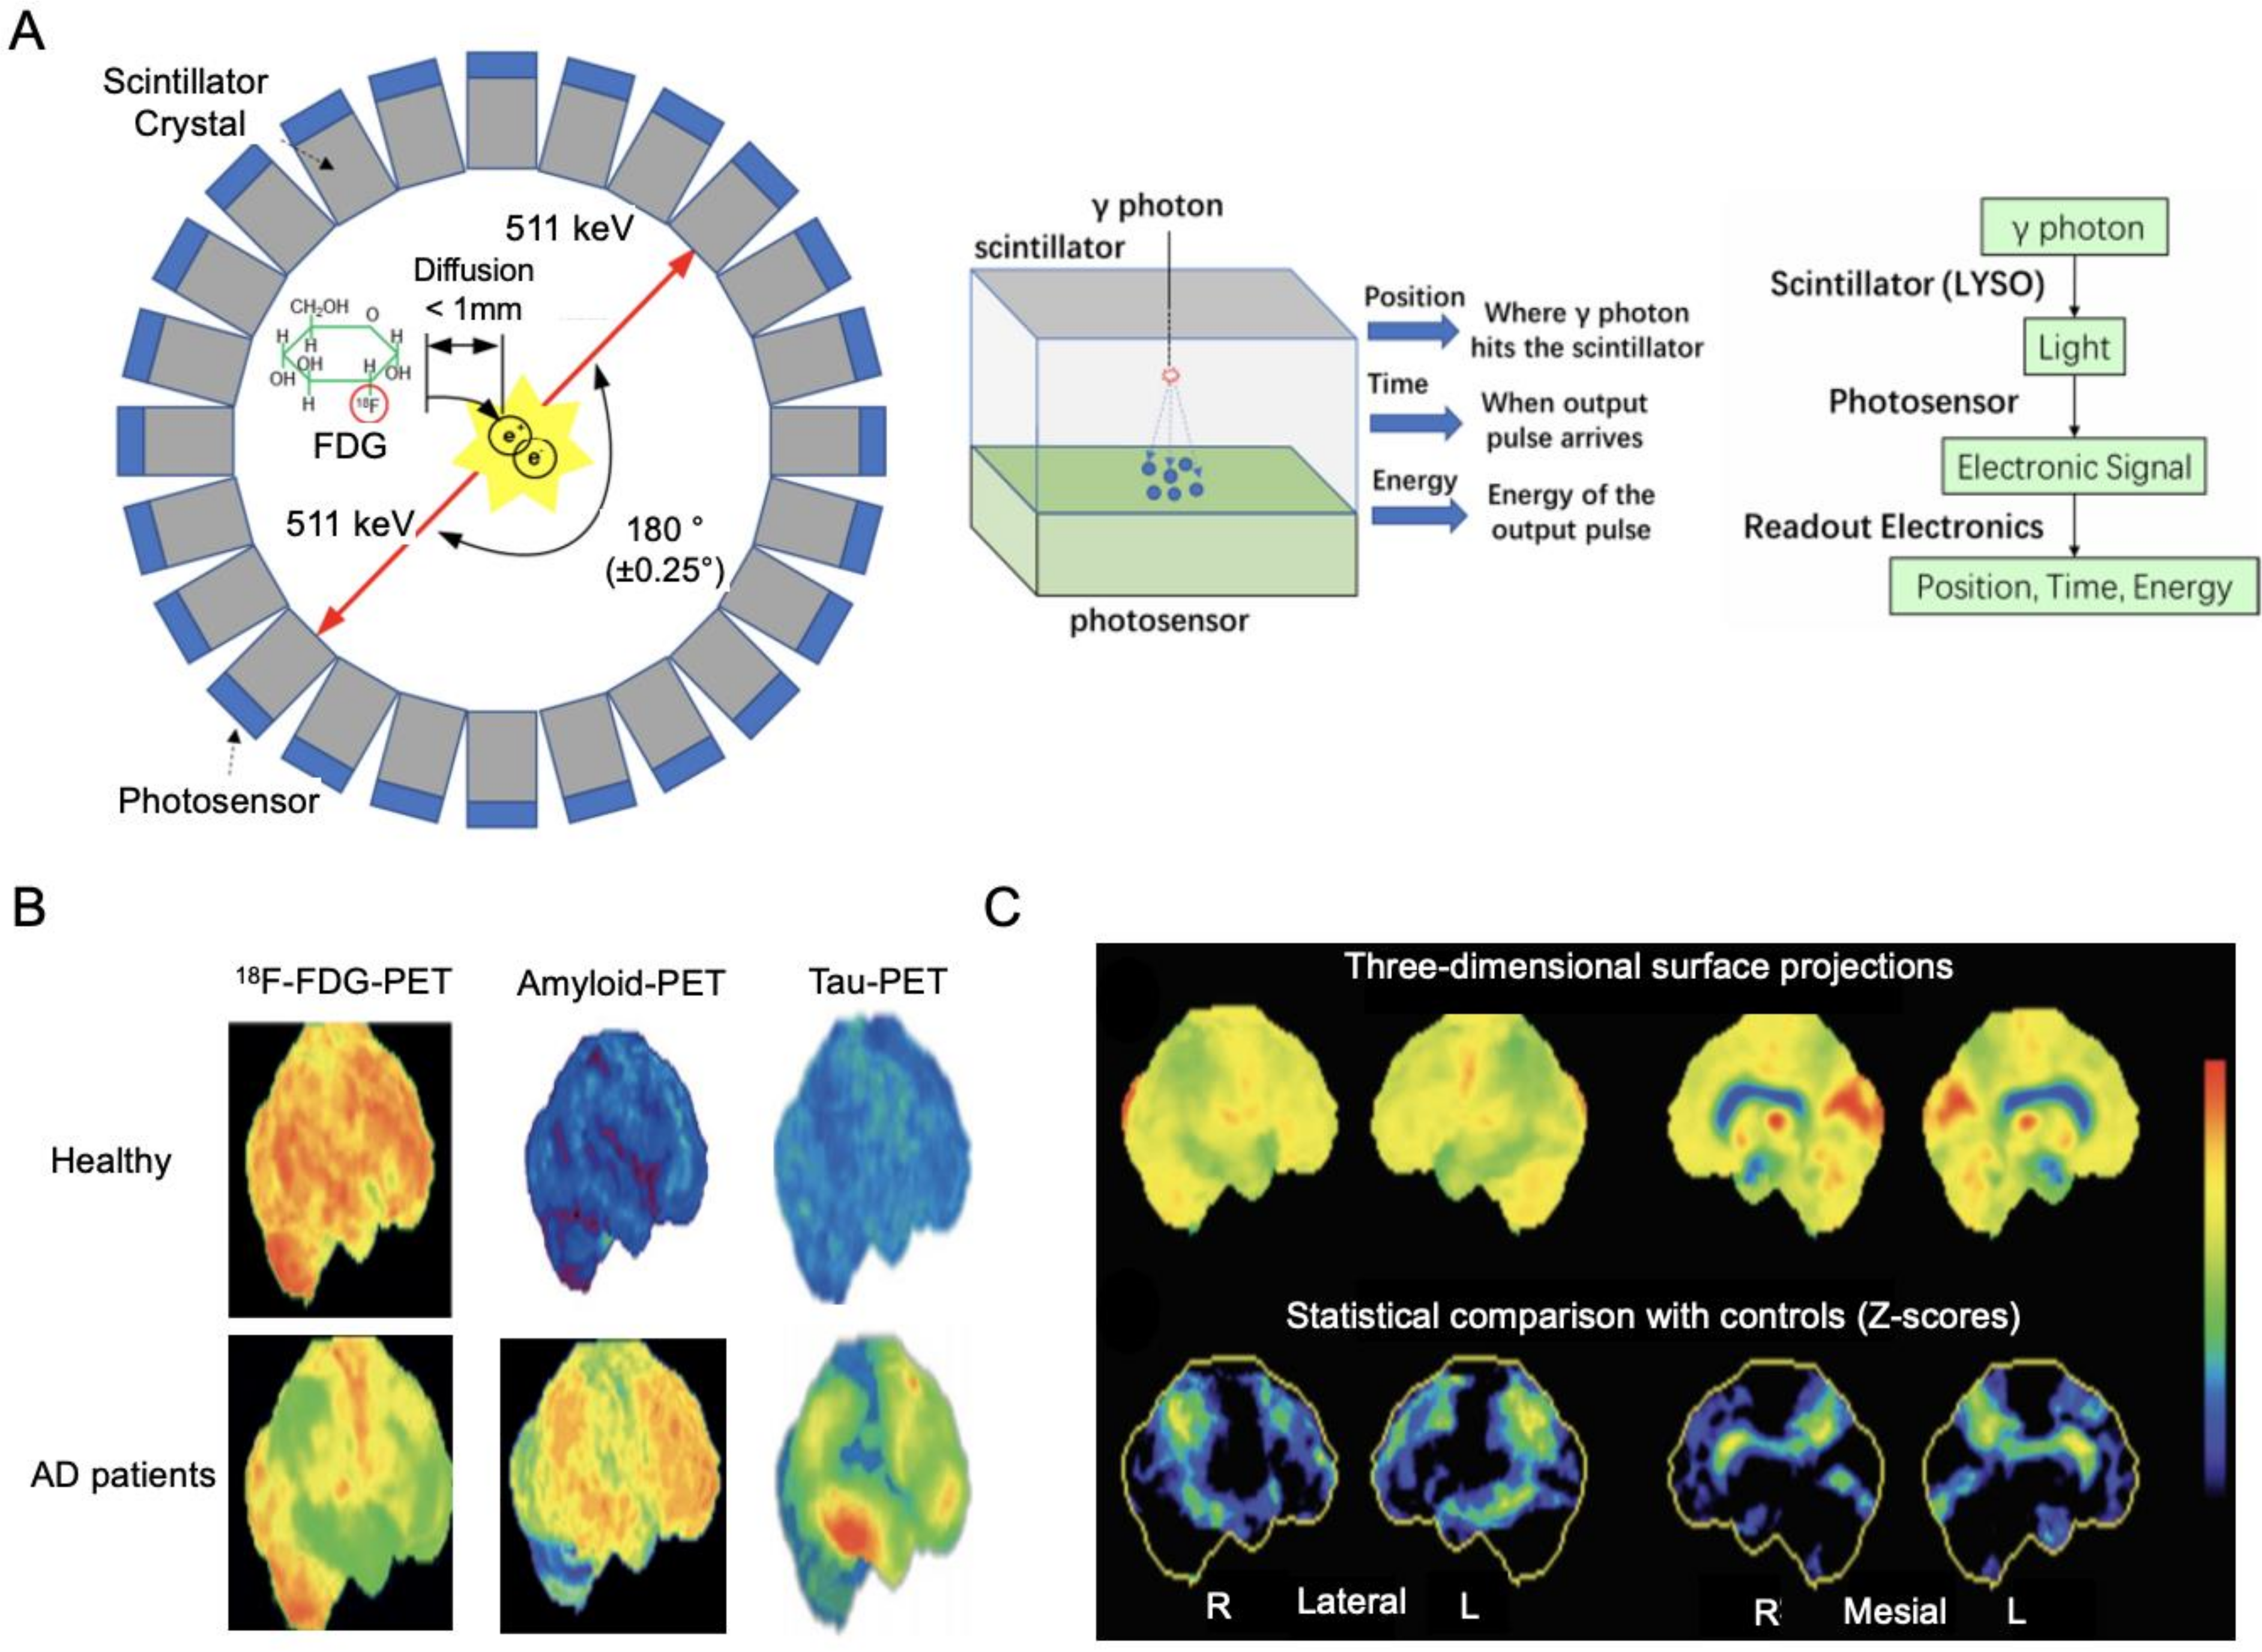
2.2. FDG-PET
2.2.1. Basic Principles
2.2.2. Applications in AD Diagnosis
2.2.3. Pros and Cons of Using FDG-PET in AD

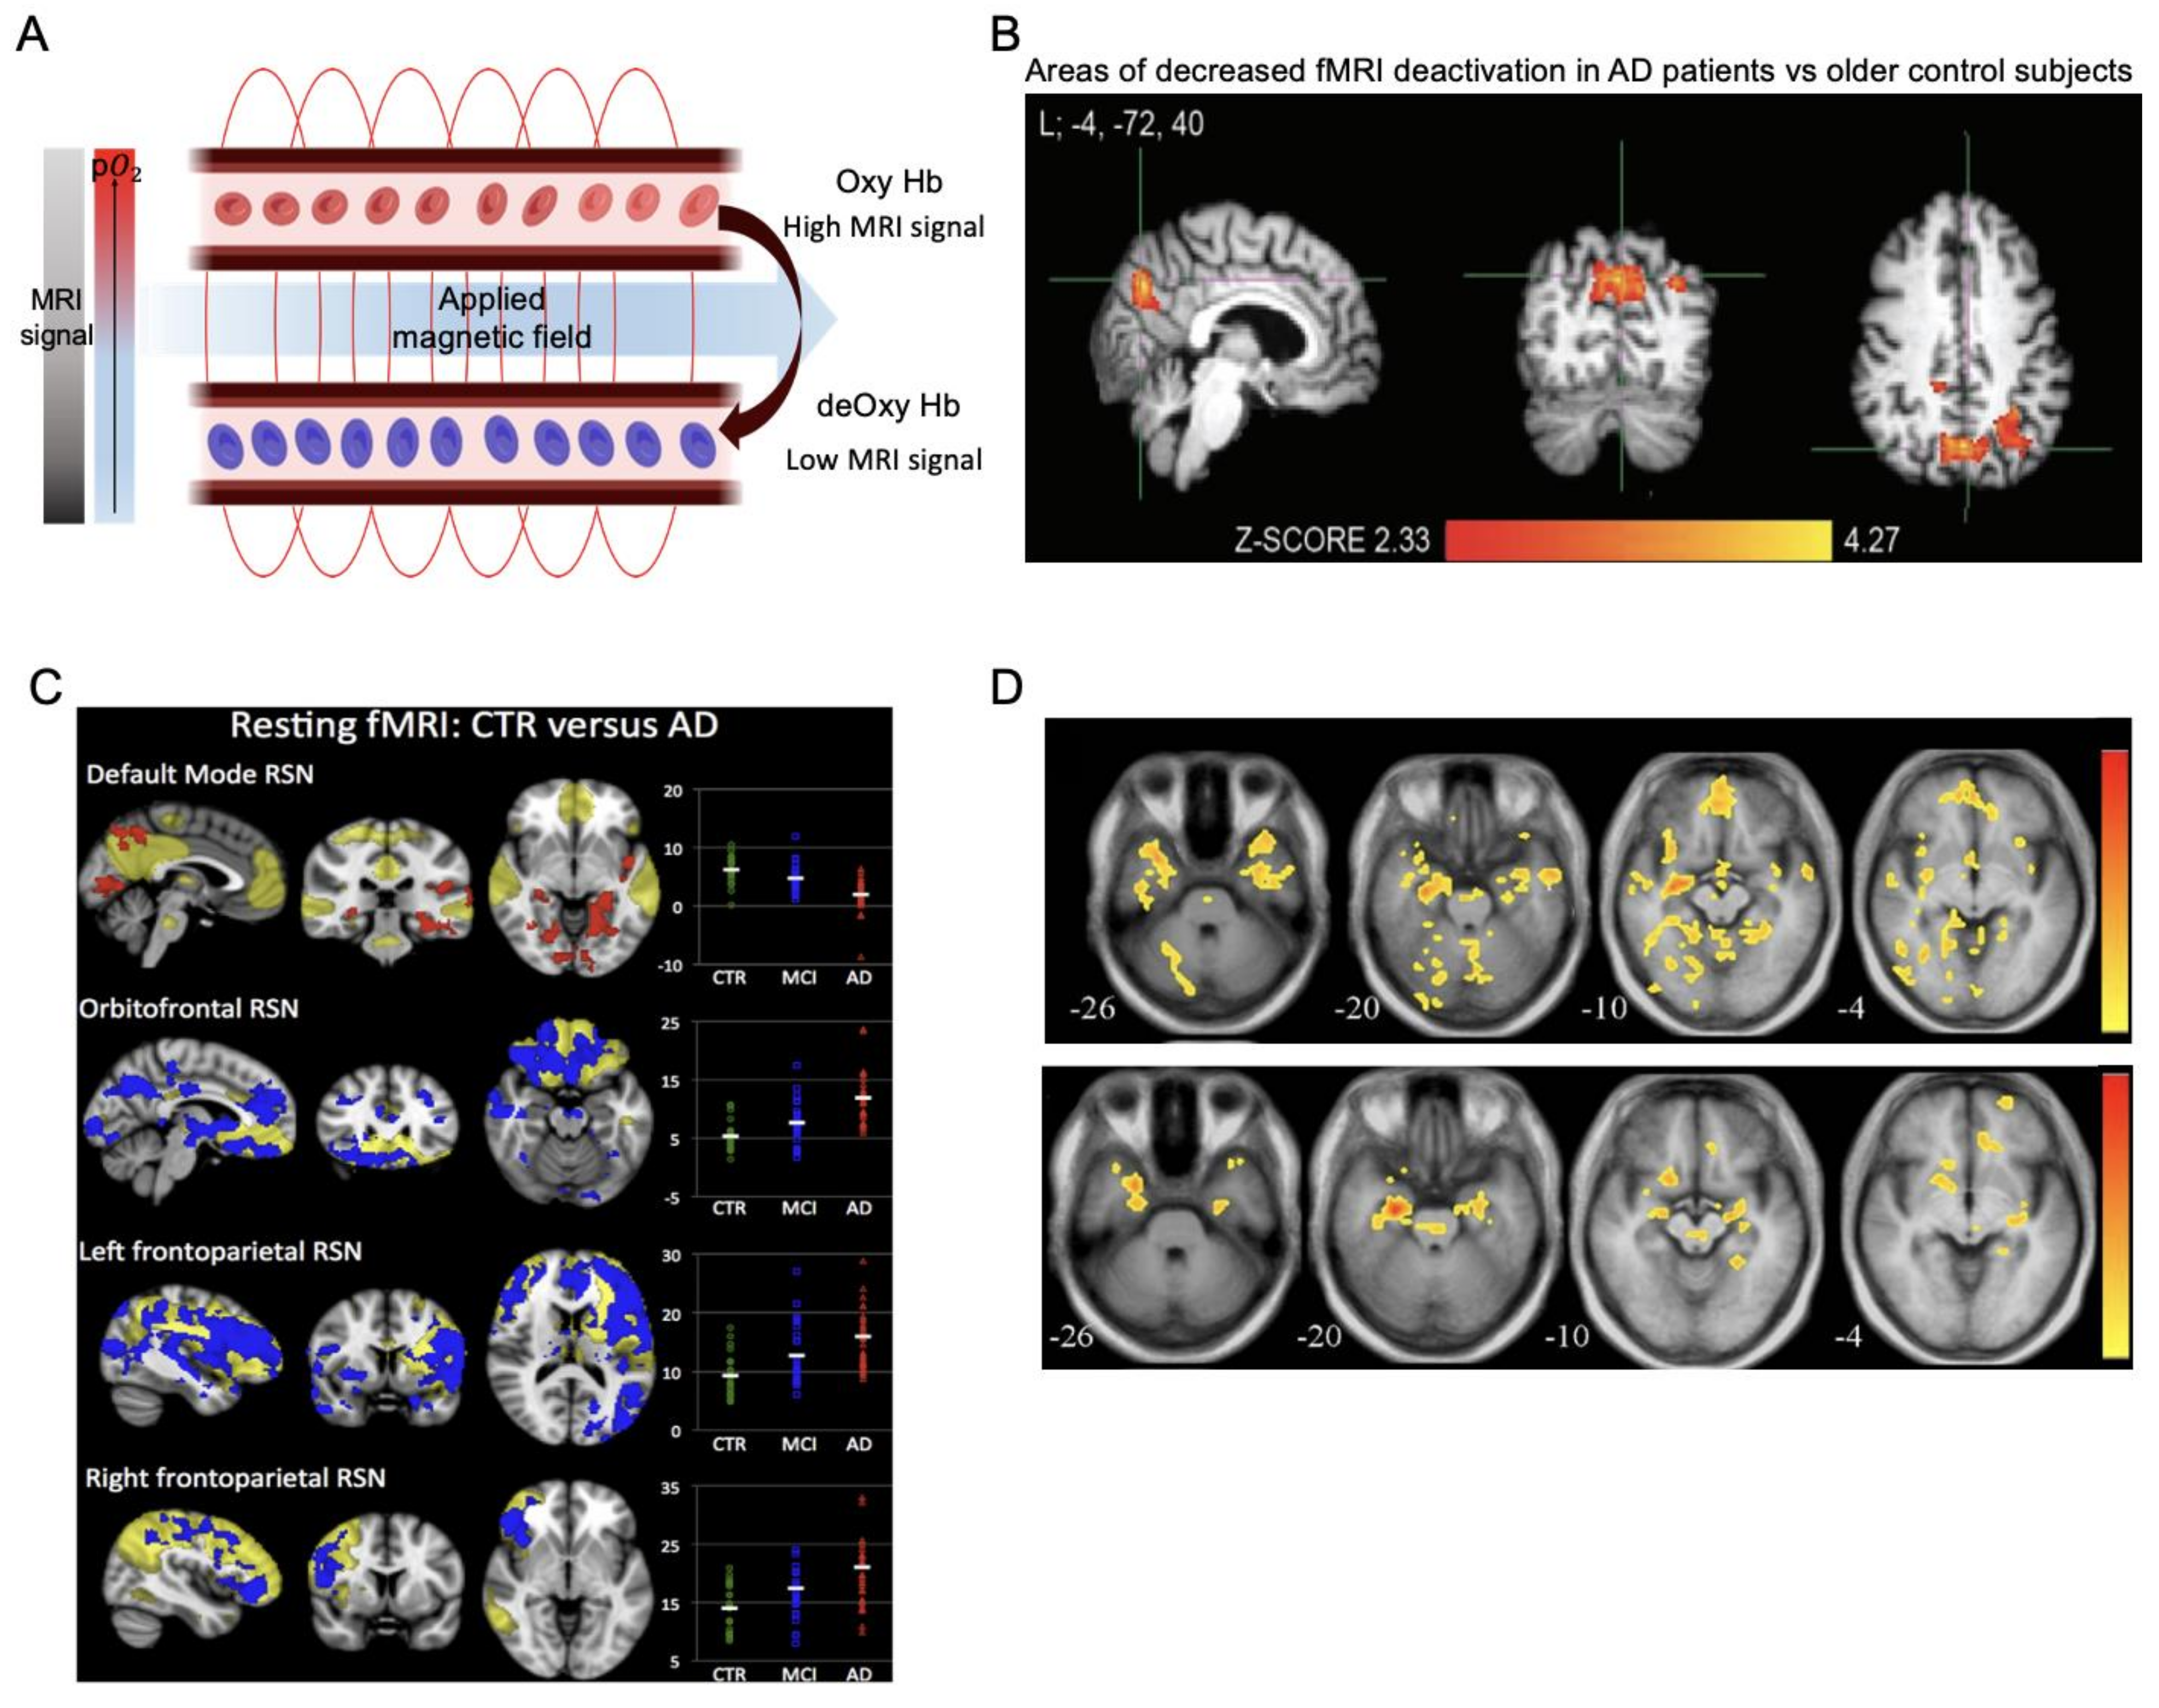
2.3. Functional MRI
2.3.1. Basic Principles
2.3.2. Applications in AD Diagnosis
2.3.3. Pros and Cons of Using fMRI in AD

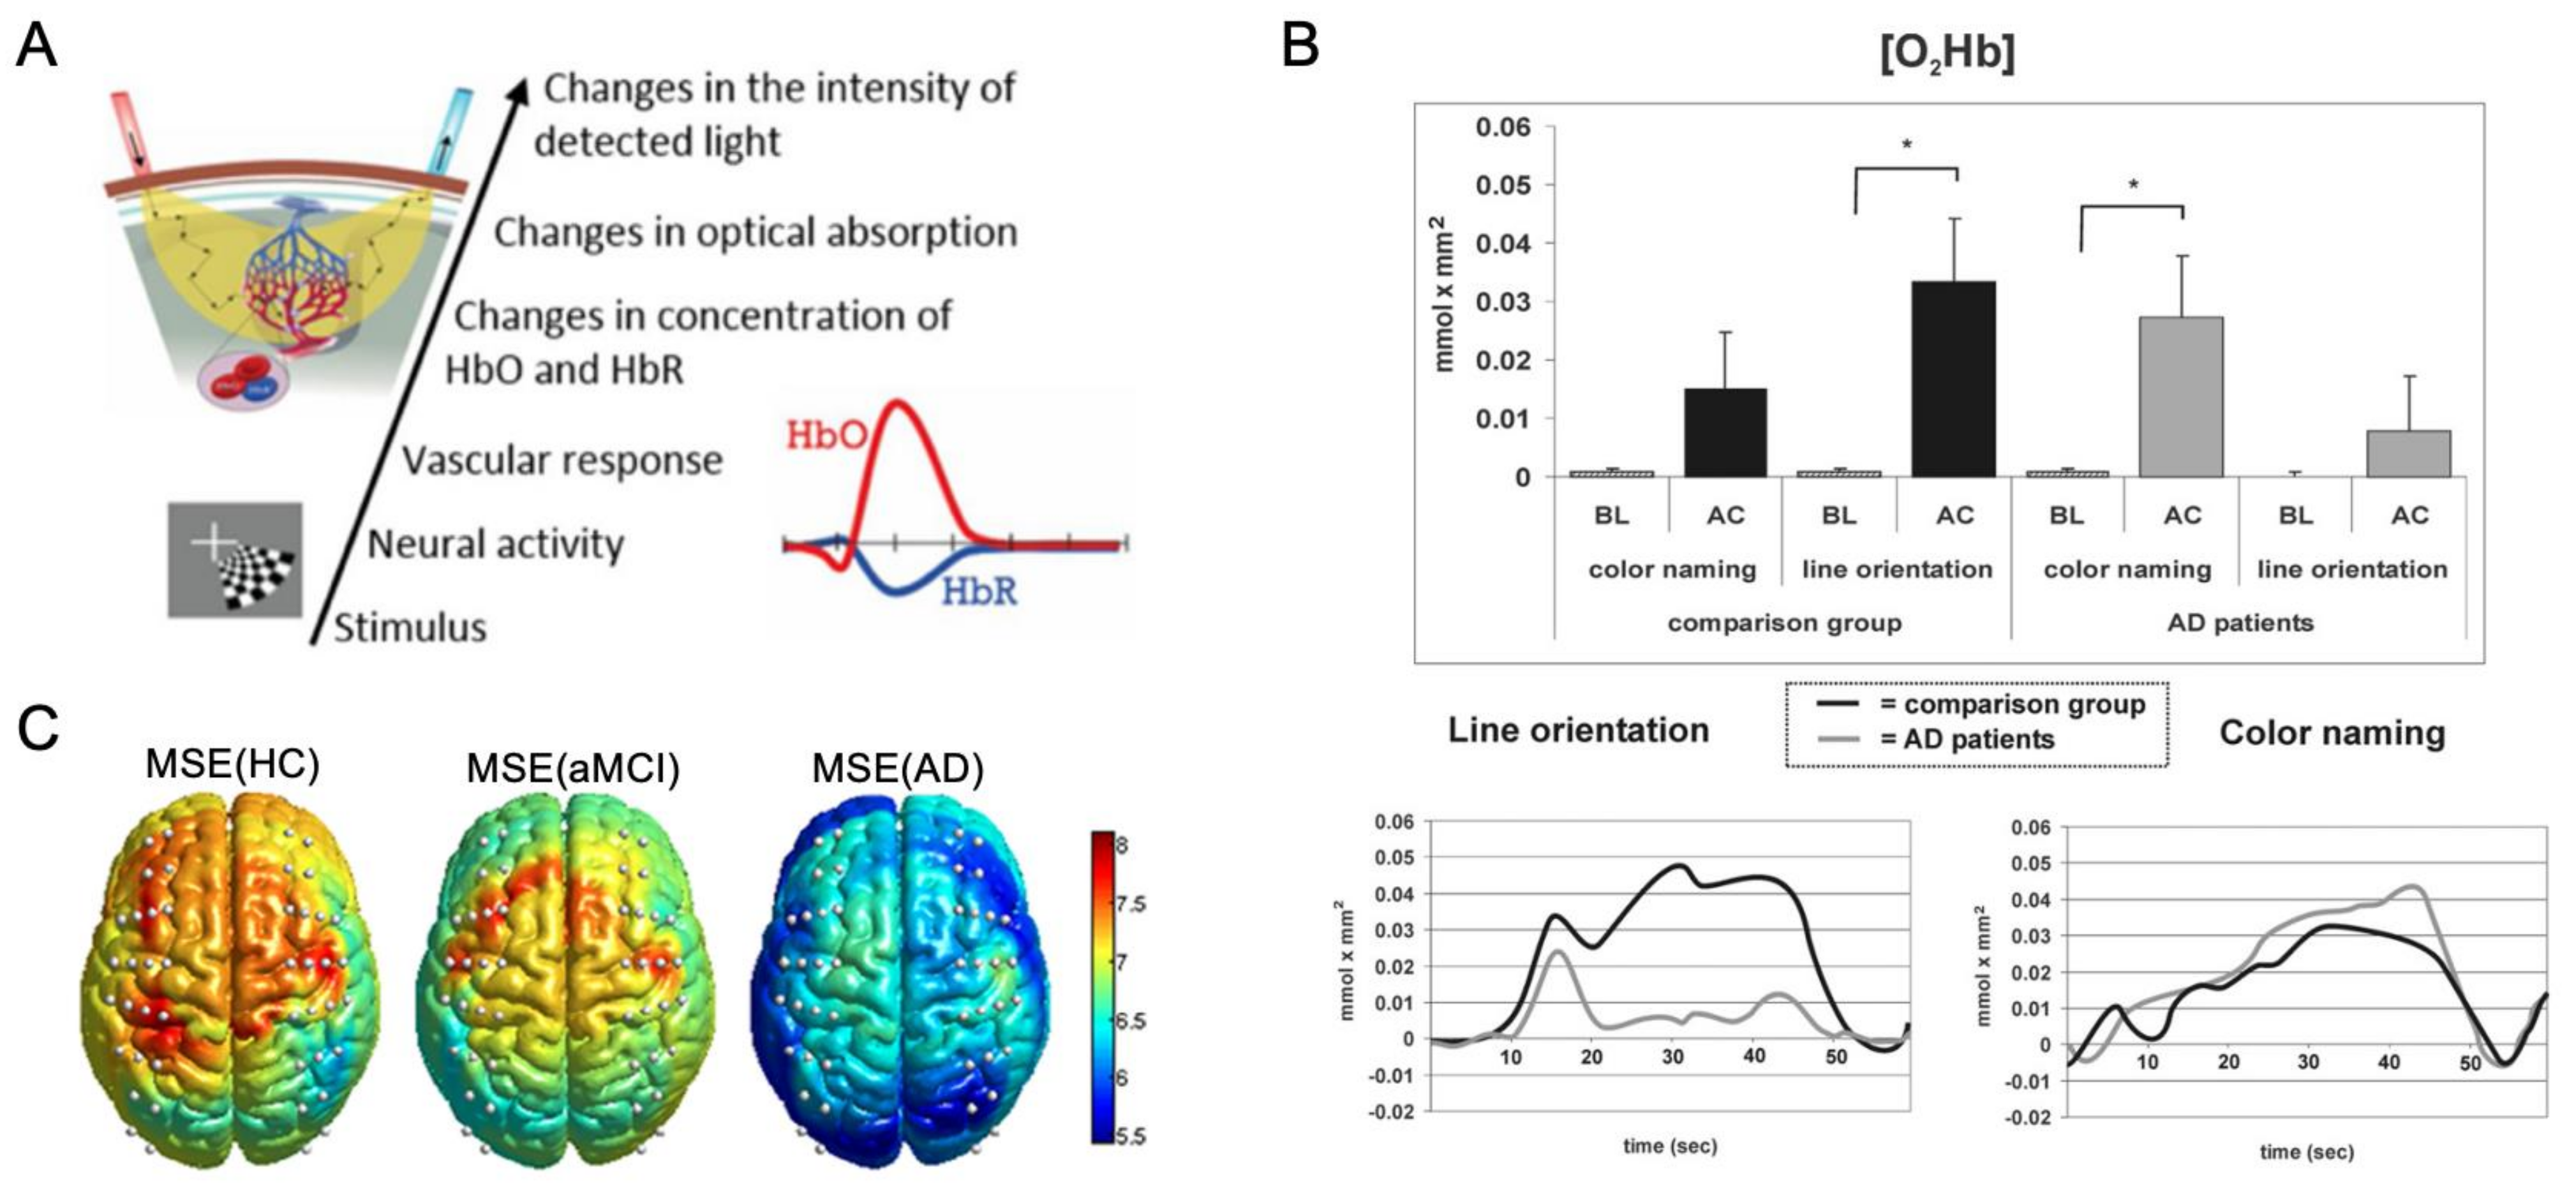
2.4. fNIRS
2.4.1. Basic Principles
2.4.2. Applications in AD Diagnosis
2.4.3. Pros and Cons of Using fNIRS in AD

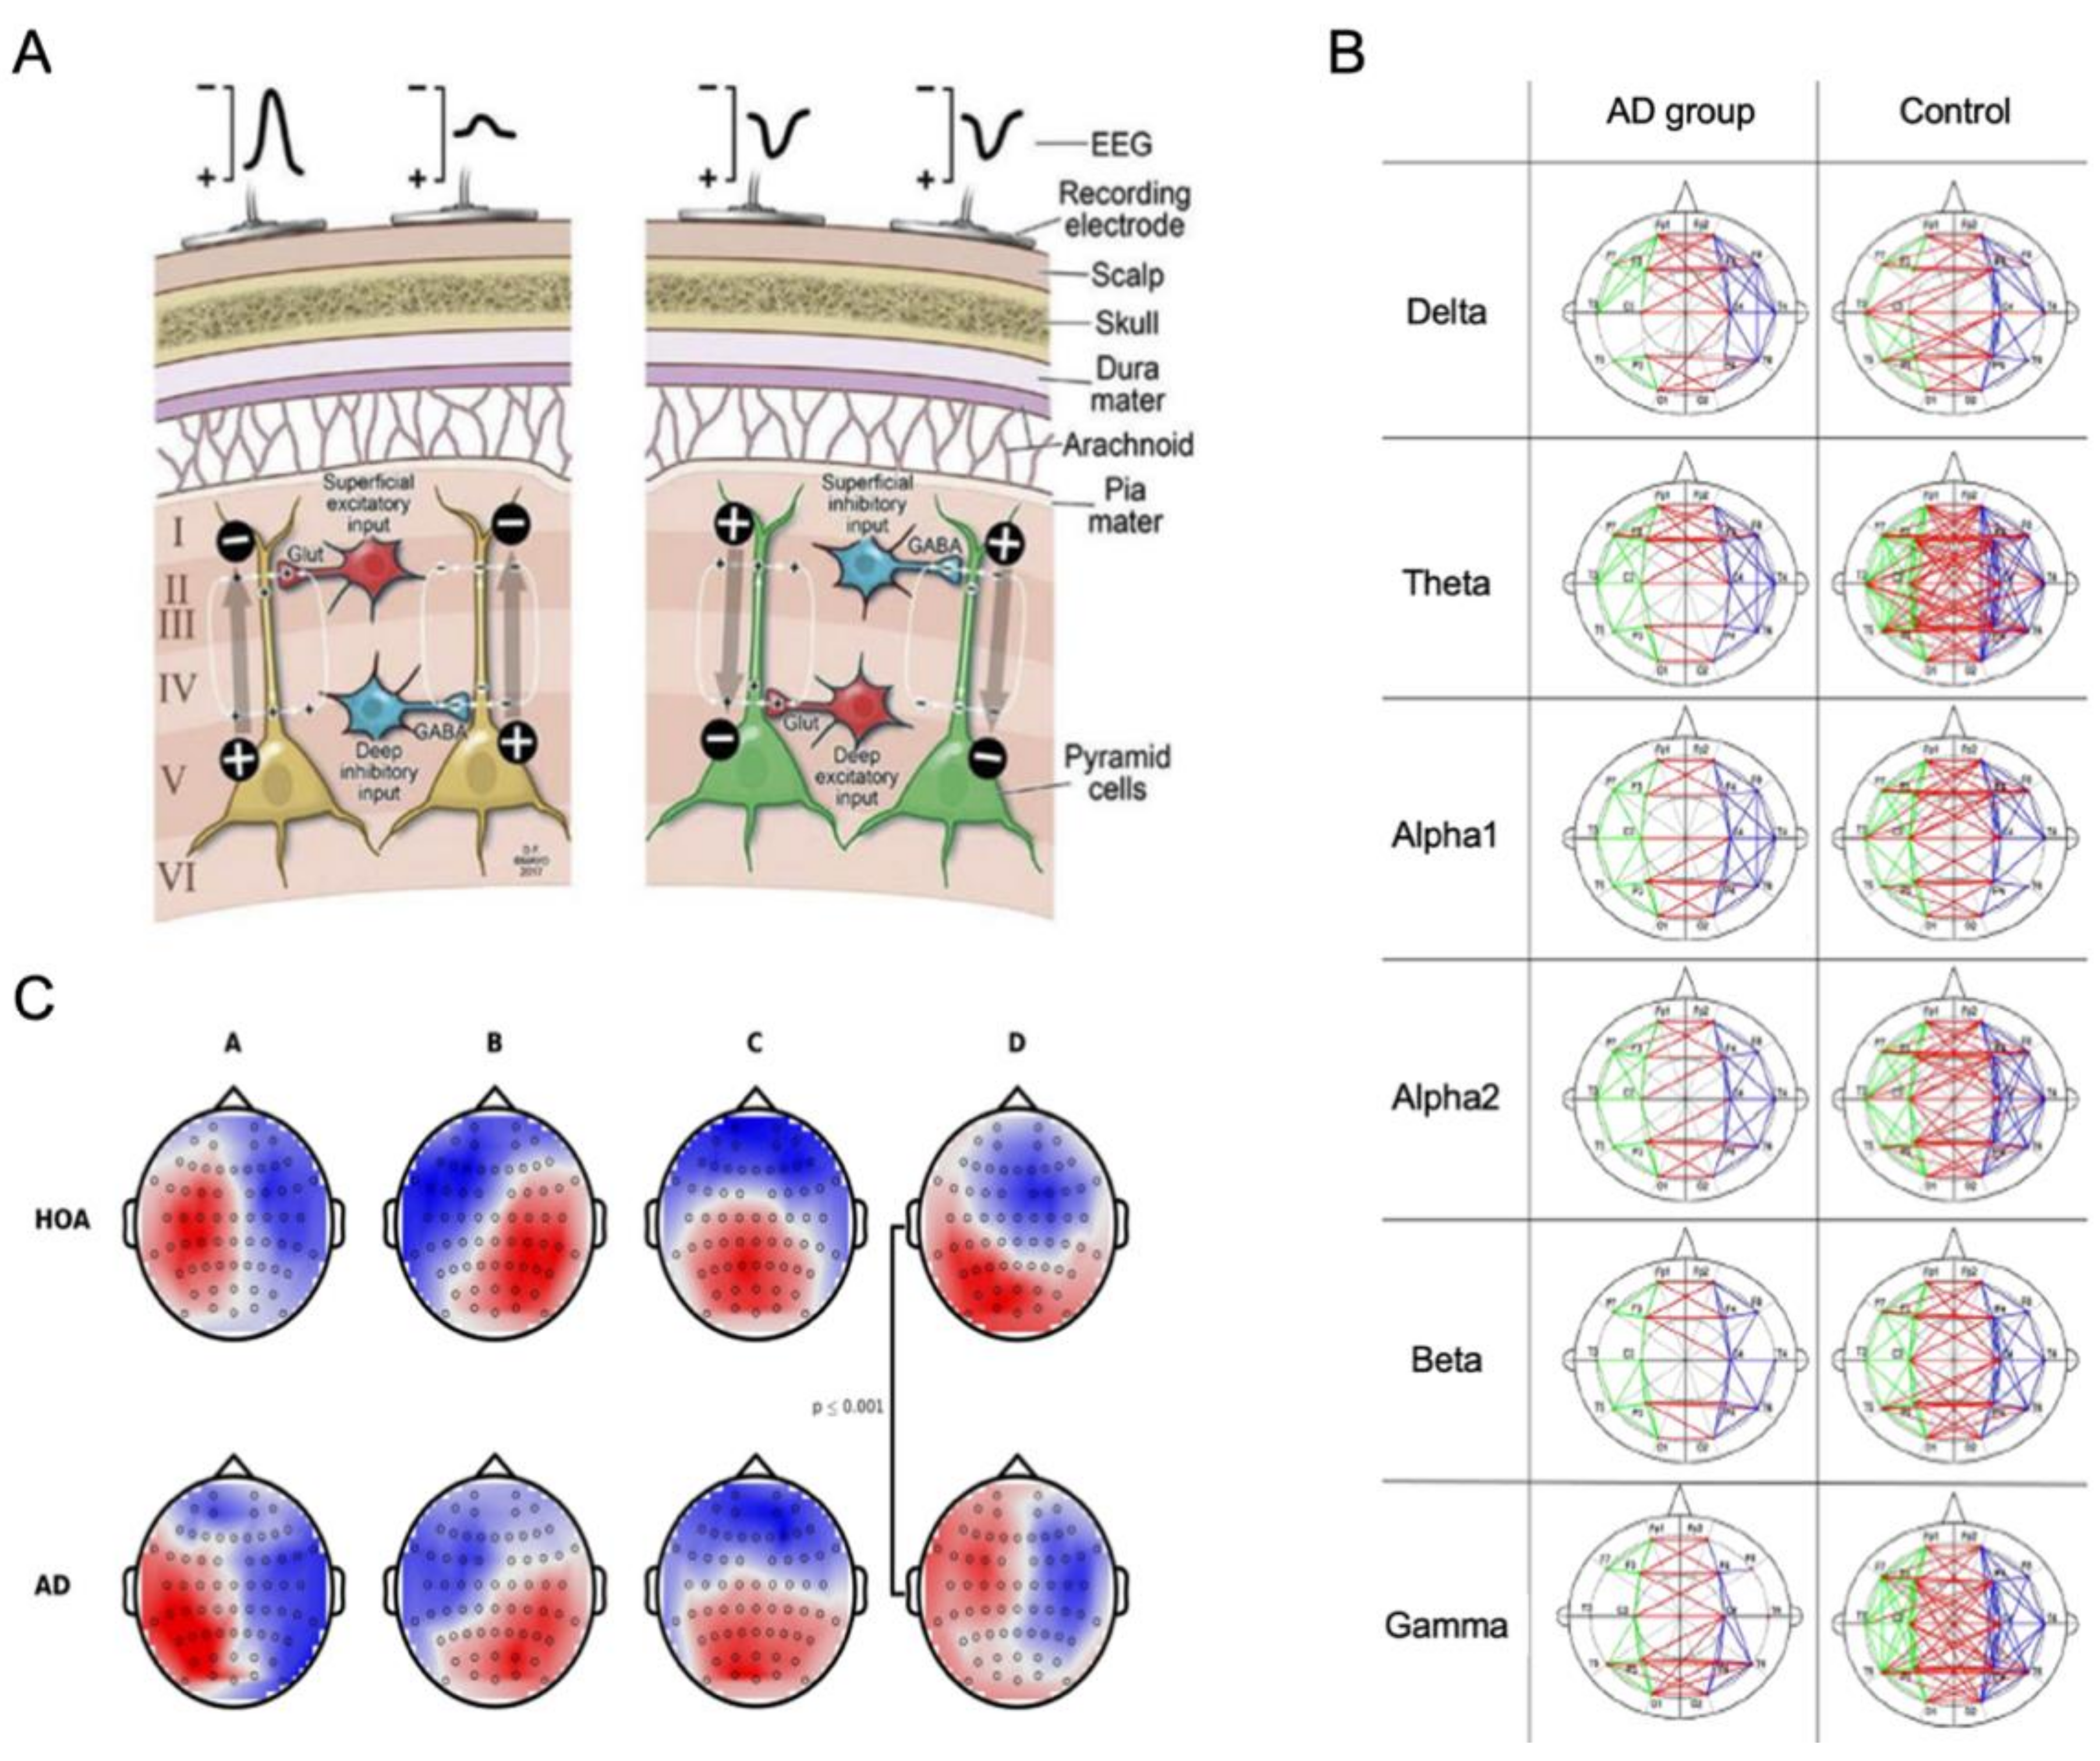
2.5. EEG
2.5.1. Basic Principles
2.5.2. Applications in AD Diagnosis
2.5.3. Pros and Cons of Using EEG in AD

3. New Approaches of Neuroimaging in AD Research
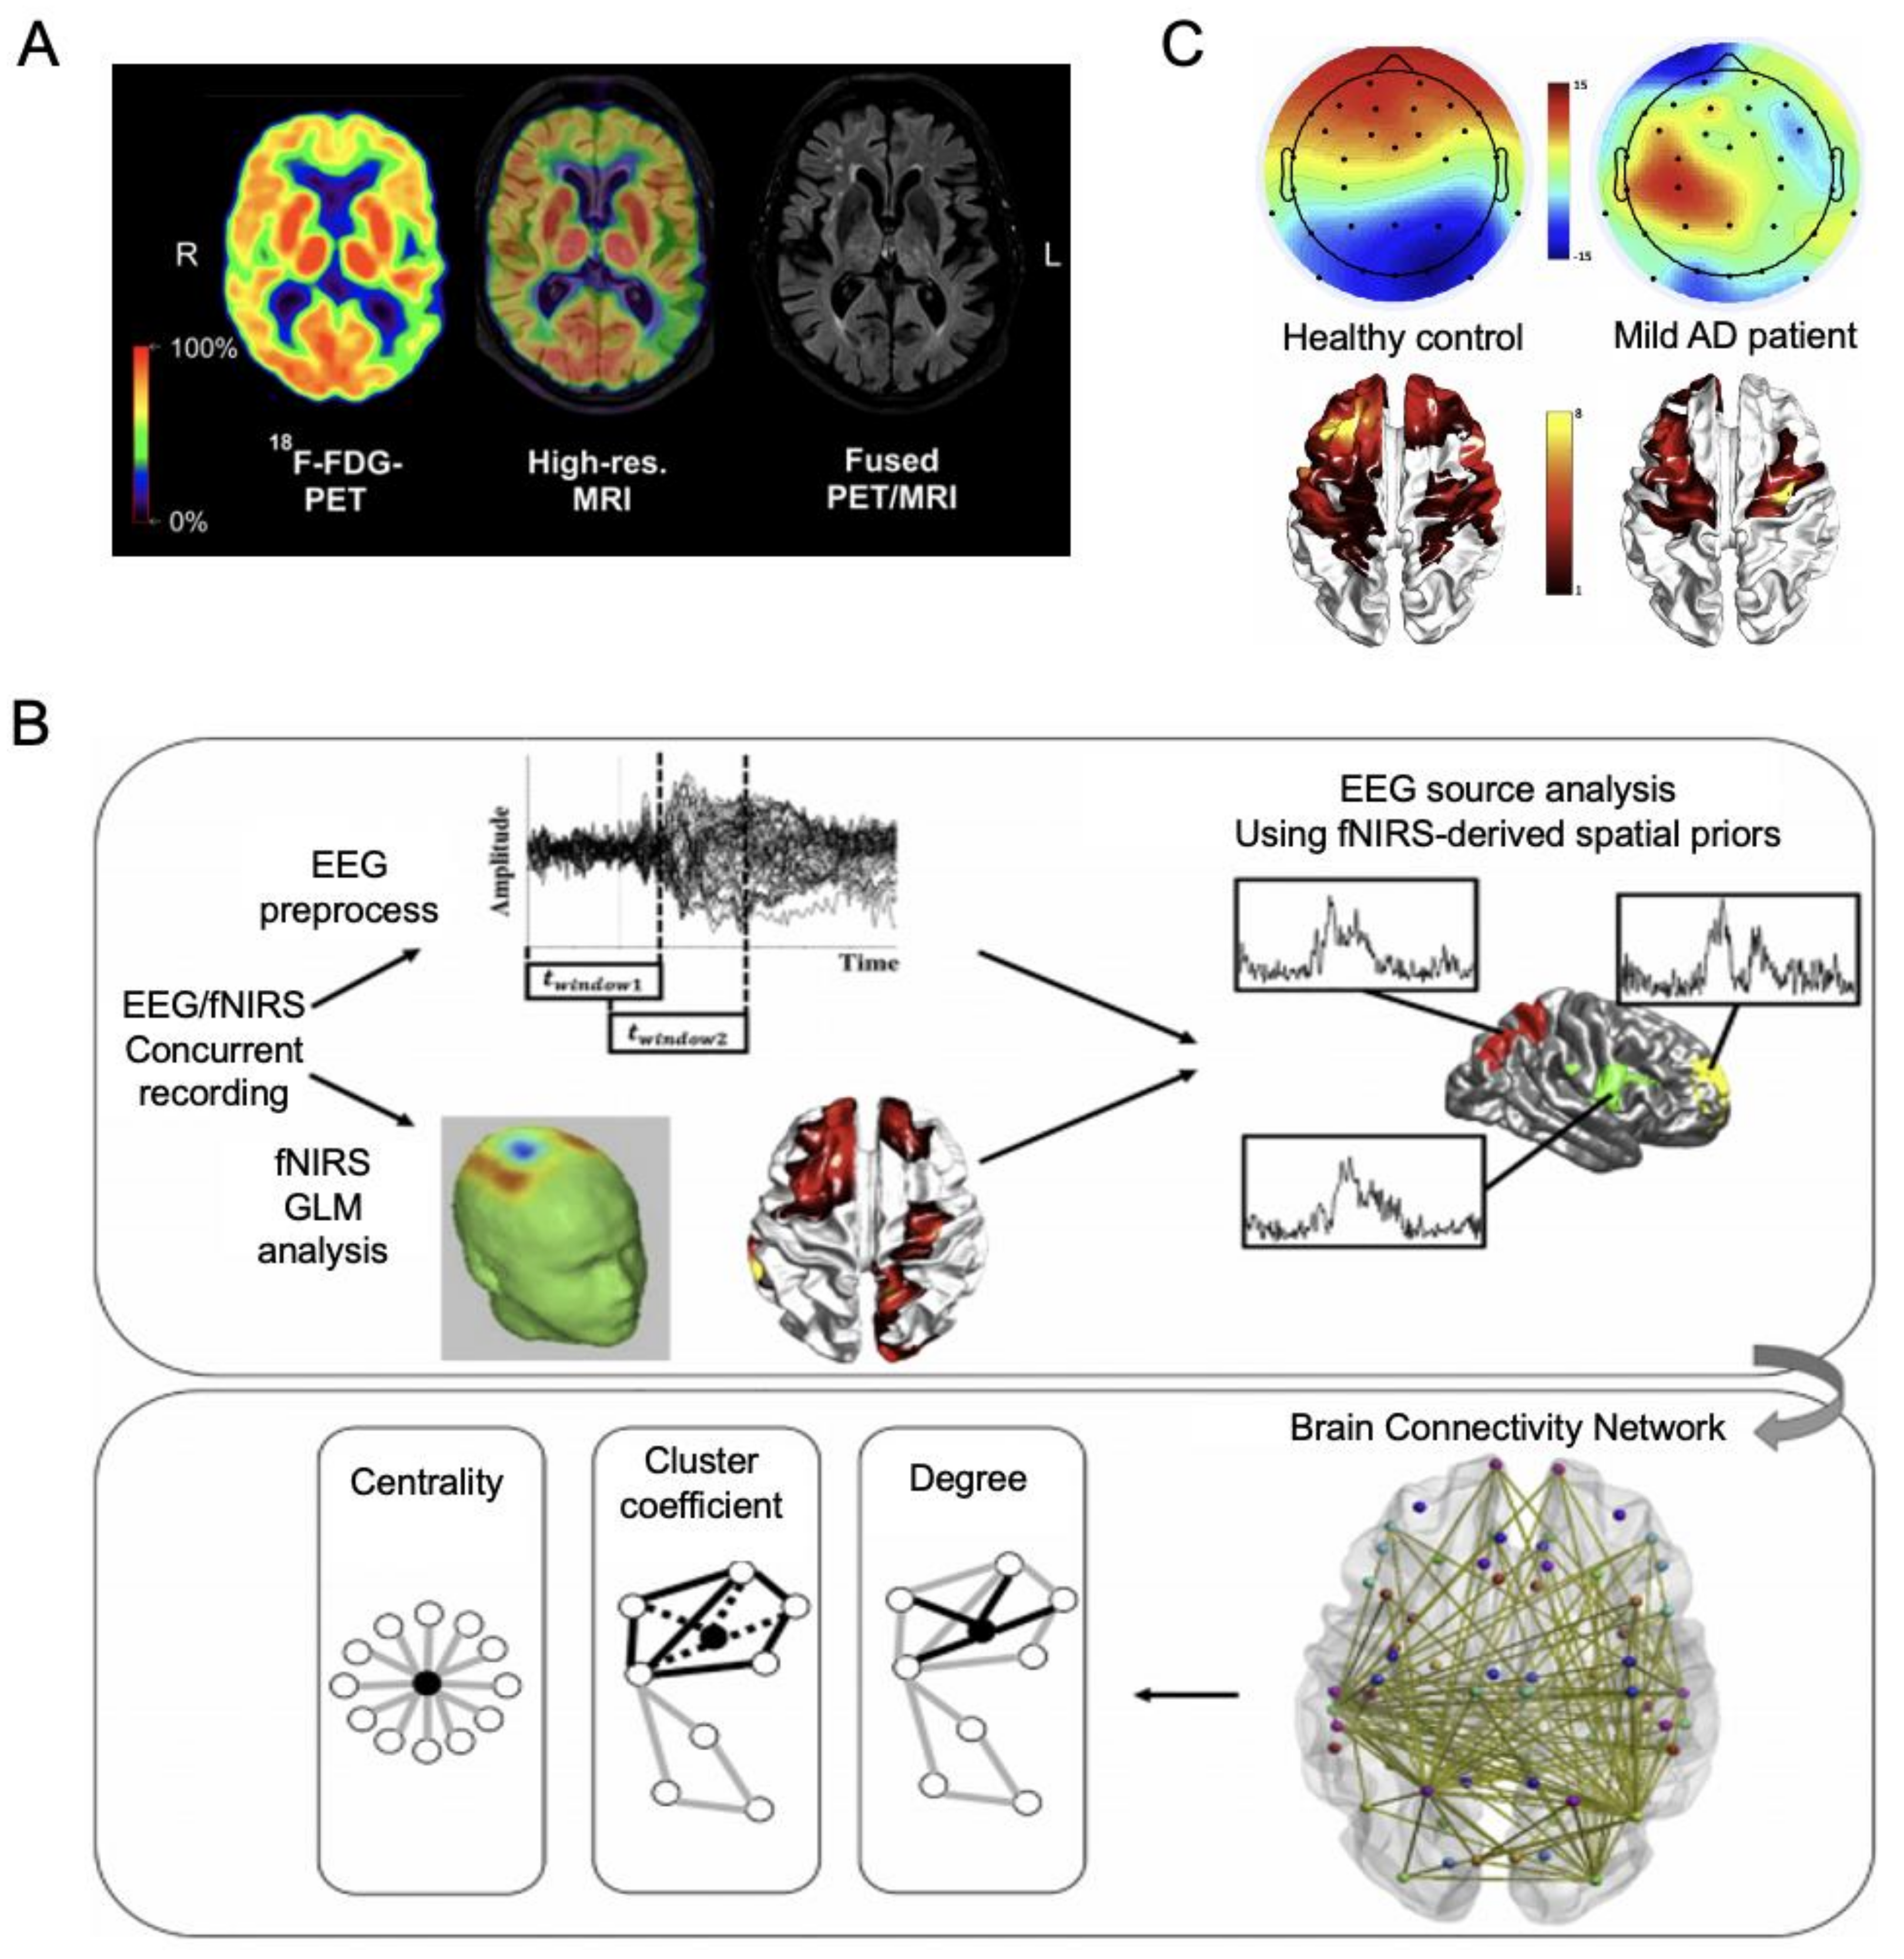
3.1. Multimodal Imaging
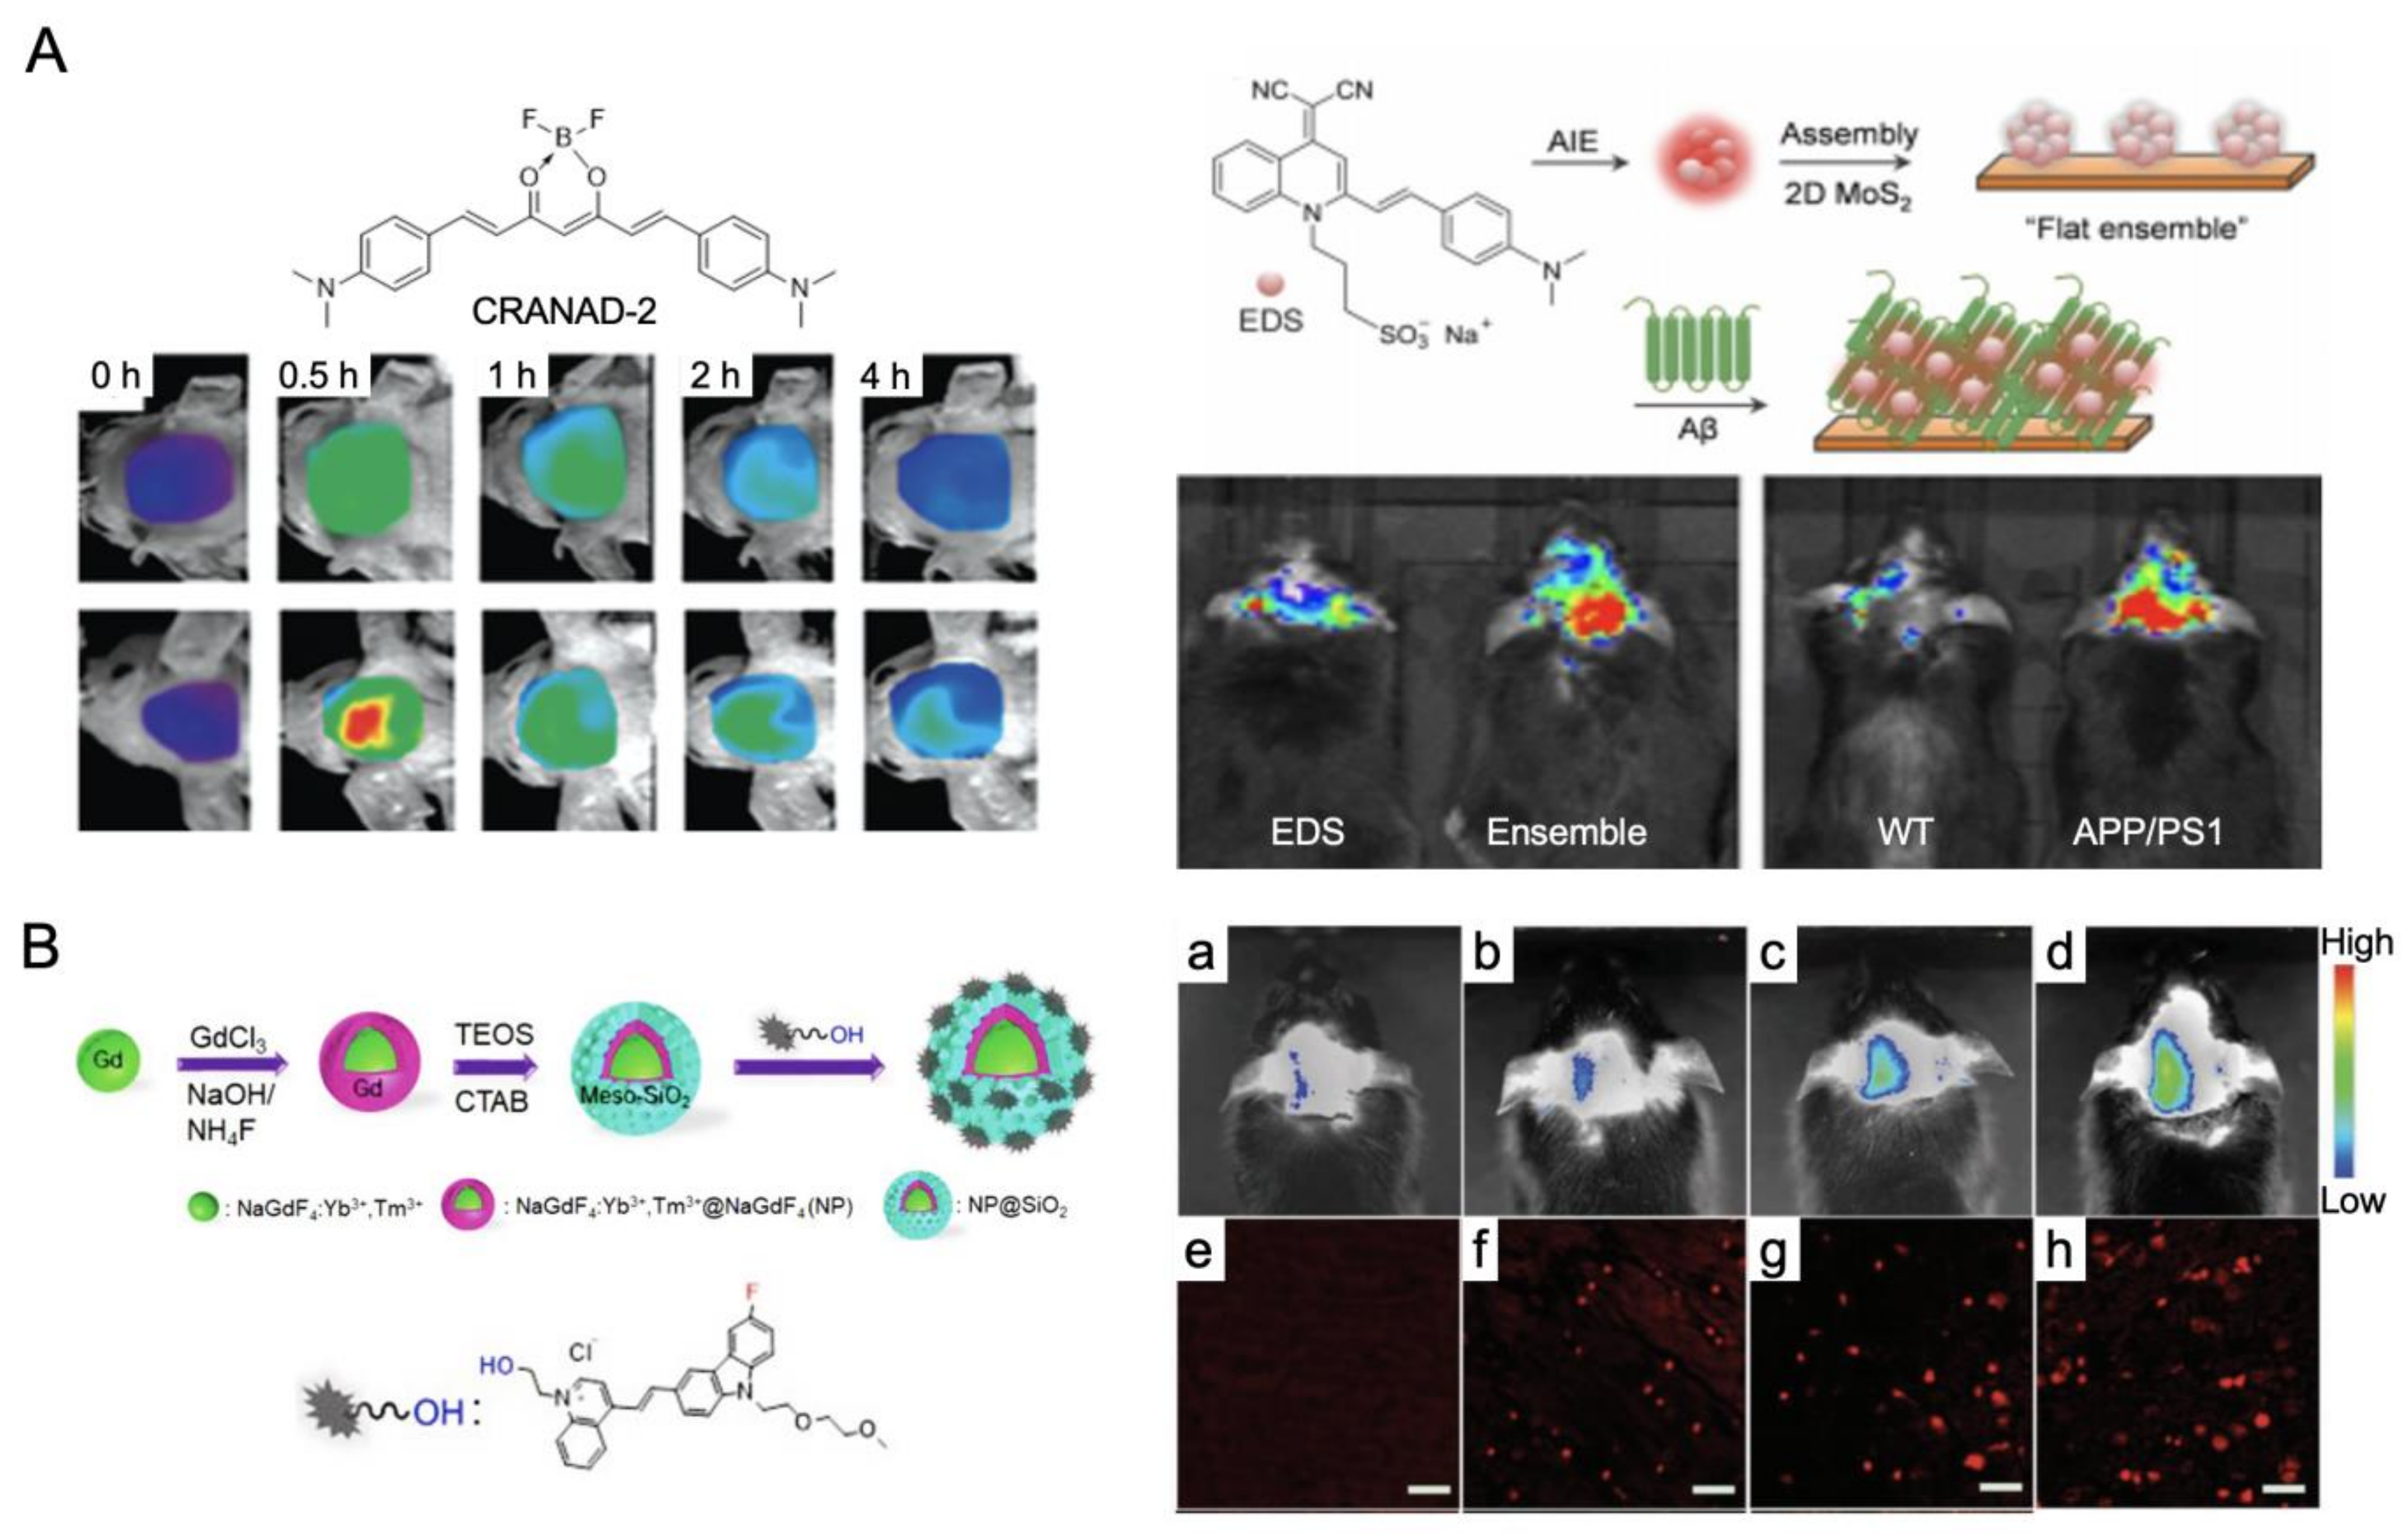
3.2. Noninvasive Fluorescence Imaging

4. Summary and Conclusions
5. Limitations and Future Directions
Author Contributions
Funding
Institutional Review Board Statement
Informed Consent Statement
Data Availability Statement
Conflicts of Interest
Abbreviations
| AD | Alzheimer’s disease |
| APP | amyloid precursor protein |
| Aβ | amyloid-β |
| APOE | apolipoprotein E gene |
| BOLD | blood oxygenation level-dependent |
| BBB | blood–brain barrier |
| BODIPY | boron dipyrromethene |
| CBF | cerebral blood flow |
| CBV | cerebral blood volume |
| CTR | control subjects |
| CNN | convolutional neural network |
| DMN | default-mode network |
| HbR | deoxy-hemoglobin |
| FLIM | fluorescence lifetime imaging |
| HC | healthy control |
| HOA | healthy older adults |
| MCI | mild cognitive impairment |
| MSE | multiscale entropy |
| NPs | nanoparticles |
| HbO | oxy-hemoglobin |
| PCC | posterior cingulate cortex |
| ROI | region of interest |
| RSNs | resting-state networks |
| TPSA | topological polar surface areas |
References
- Alzheimer’s Association. 2019 Alzheimer’s disease facts and figures. Alzheimer’s Dement. 2019, 15, 321–387. [Google Scholar] [CrossRef]
- Caselli, R.J.; Beach, T.G.; Knopman, D.S.; Graff-Radford, N.R. Alzheimer Disease: Scientific Breakthroughs and Translational Challenges. Mayo Clin. Proc. 2017, 92, 978–994. [Google Scholar] [CrossRef] [Green Version]
- DeTure, M.A.; Dickson, D.W. The neuropathological diagnosis of Alzheimer’s disease. Mol. Neurodegener. 2019, 14, 32. [Google Scholar] [CrossRef] [PubMed] [Green Version]
- Braak, H.; Braak, E. Neuropathological stageing of Alzheimer-related changes. Acta Neuropathol. 1991, 82, 239–259. [Google Scholar] [CrossRef] [PubMed]
- Tanaka, M.; Toldi, J.; Vecsei, L. Exploring the Etiological Links behind Neurodegenerative Diseases: Inflammatory Cytokines and Bioactive Kynurenines. Int. J. Mol. Sci. 2020, 21, 2431. [Google Scholar] [CrossRef] [PubMed] [Green Version]
- Battaglia, S.; Garofalo, S.; di Pellegrino, G. Context-dependent extinction of threat memories: Influences of healthy aging. Sci. Rep. 2018, 8, 12592. [Google Scholar] [CrossRef] [PubMed]
- Jack, C.R. Comparison of different MRI brain atrophy rate measures with clinical disease progression in AD. Neurology 2004, 62, 591–600. [Google Scholar] [CrossRef]
- Gosche, K.M.; Mortimer, J.A.; Smith, C.D.; Markesbery, W.R.; Snowdon, D.A. Hippocampal volume as an index of Alzheimer neuropathology: Findings from the Nun Study. Neurology 2002, 58, 1476–1482. [Google Scholar] [CrossRef]
- Schuff, N.; Woerner, N.; Boreta, L.; Kornfield, T.; Shaw, L.M.; Trojanowski, J.Q.; Thompson, P.M.; Jack, C.R., Jr.; Weiner, M.W.; Alzheimer’s Disease Neuroimaging, I. MRI of hippocampal volume loss in early Alzheimer’s disease in relation to ApoE genotype and biomarkers. Brain 2009, 132 Pt 4, 1067–1077. [Google Scholar] [CrossRef] [Green Version]
- Nestor, S.M.; Rupsingh, R.; Borrie, M.; Smith, M.; Accomazzi, V.; Wells, J.L.; Fogarty, J.; Bartha, R.; Alzheimer’s Disease Neuroimaging, I. Ventricular enlargement as a possible measure of Alzheimer’s disease progression validated using the Alzheimer’s disease neuroimaging initiative database. Brain 2008, 131 Pt 9, 2443–2454. [Google Scholar] [CrossRef] [Green Version]
- Alexander, G.E.; Chen, K.; Pietrini, P.; Rapoport, S.I.; Reiman, E.M. Longitudinal PET Evaluation of Cerebral Metabolic Decline in Dementia: A Potential Outcome Measure in Alzheimer’s Disease Treatment Studies. Am. J. Psychiatry 2002, 159, 738–745. [Google Scholar] [CrossRef] [PubMed]
- Mosconi, L.; Mistur, R.; Switalski, R.; Tsui, W.H.; Glodzik, L.; Li, Y.; Pirraglia, E.; De Santi, S.; Reisberg, B.; Wisniewski, T.; et al. FDG-PET changes in brain glucose metabolism from normal cognition to pathologically verified Alzheimer’s disease. Eur. J. Nucl. Med. Mol. Imaging 2009, 36, 811–822. [Google Scholar] [CrossRef] [PubMed] [Green Version]
- Li, R.; Rui, G.; Chen, W.; Li, S.; Schulz, P.E.; Zhang, Y. Early Detection of Alzheimer’s Disease Using Non-invasive Near-Infrared Spectroscopy. Front. Aging Neurosci. 2018, 10, 366. [Google Scholar] [CrossRef]
- Adamczuk, K.; De Weer, A.S.; Nelissen, N.; Dupont, P.; Sunaert, S.; Bettens, K.; Sleegers, K.; Van Broeckhoven, C.; Van Laere, K.; Vandenberghe, R. Functional Changes in the Language Network in Response to Increased Amyloid beta Deposition in Cognitively Intact Older Adults. Cereb. Cortex 2016, 26, 358–373. [Google Scholar] [CrossRef] [PubMed] [Green Version]
- Chen, C.J.; Chen, C.C.; Wu, D.; Chi, N.F.; Chen, P.C.; Liao, Y.P.; Chiu, H.W.; Hu, C.J. Effects of the apolipoprotein E epsilon4 allele on functional MRI during n-back working memory tasks in healthy middle-aged adults. AJNR Am. J. Neuroradiol. 2013, 34, 1197–1202. [Google Scholar] [CrossRef] [Green Version]
- Corriveau-Lecavalier, N.; Duchesne, S.; Gauthier, S.; Hudon, C.; Kergoat, M.J.; Mellah, S.; Belleville, S. Consortium for the Early Identification of Alzheimer’s, D.-Q. A quadratic function of activation in individuals at risk of Alzheimer’s disease. Alzheimers Dement. 2020, 12, e12139. [Google Scholar] [CrossRef] [PubMed]
- Foster, C.M.; Kennedy, K.M.; Horn, M.M.; Hoagey, D.A.; Rodrigue, K.M. Both hyper- and hypo-activation to cognitive challenge are associated with increased beta-amyloid deposition in healthy aging: A nonlinear effect. Neuroimage 2018, 166, 285–292. [Google Scholar] [CrossRef]
- Gordon, B.A.; Zacks, J.M.; Blazey, T.; Benzinger, T.L.; Morris, J.C.; Fagan, A.M.; Holtzman, D.M.; Balota, D.A. Task-evoked fMRI changes in attention networks are associated with preclinical Alzheimer’s disease biomarkers. Neurobiol. Aging 2015, 36, 1771–1779. [Google Scholar] [CrossRef] [Green Version]
- Huijbers, W.; Schultz, A.P.; Papp, K.V.; LaPoint, M.R.; Hanseeuw, B.; Chhatwal, J.P.; Hedden, T.; Johnson, K.A.; Sperling, R.A. Tau Accumulation in Clinically Normal Older Adults Is Associated with Hippocampal Hyperactivity. J. Neurosci. 2019, 39, 548–556. [Google Scholar] [CrossRef] [Green Version]
- Kennedy, K.M.; Foster, C.M.; Rodrigue, K.M. Increasing beta-amyloid deposition in cognitively healthy aging predicts nonlinear change in BOLD modulation to difficulty. Neuroimage 2018, 183, 142–149. [Google Scholar] [CrossRef]
- Oh, H.; Steffener, J.; Razlighi, Q.R.; Habeck, C.; Stern, Y. beta-Amyloid Deposition Is Associated with Decreased Right Prefrontal Activation during Task Switching among Cognitively Normal Elderly. J. Neurosci. 2016, 36, 1962–1970. [Google Scholar] [CrossRef] [PubMed] [Green Version]
- Quiroz, Y.T.; Budson, A.E.; Celone, K.; Ruiz, A.; Newmark, R.; Castrillon, G.; Lopera, F.; Stern, C.E. Hippocampal hyperactivation in presymptomatic familial Alzheimer’s disease. Ann. Neurol. 2010, 68, 865–875. [Google Scholar] [CrossRef] [PubMed] [Green Version]
- Agosta, F.; Pievani, M.; Geroldi, C.; Copetti, M.; Frisoni, G.B.; Filippi, M. Resting state fMRI in Alzheimer’s disease: Beyond the default mode network. Neurobiol. Aging 2012, 33, 1564–1578. [Google Scholar] [CrossRef]
- Binnewijzend, M.A.; Schoonheim, M.M.; Sanz-Arigita, E.; Wink, A.M.; van der Flier, W.M.; Tolboom, N.; Adriaanse, S.M.; Damoiseaux, J.S.; Scheltens, P.; van Berckel, B.N.; et al. Resting-state fMRI changes in Alzheimer’s disease and mild cognitive impairment. Neurobiol. Aging 2012, 33, 2018–2028. [Google Scholar] [CrossRef] [PubMed]
- Palmqvist, S.; Scholl, M.; Strandberg, O.; Mattsson, N.; Stomrud, E.; Zetterberg, H.; Blennow, K.; Landau, S.; Jagust, W.; Hansson, O. Earliest accumulation of beta-amyloid occurs within the default-mode network and concurrently affects brain connectivity. Nat. Commun. 2017, 8, 1214. [Google Scholar] [CrossRef] [PubMed] [Green Version]
- Schultz, A.P.; Chhatwal, J.P.; Hedden, T.; Mormino, E.C.; Hanseeuw, B.J.; Sepulcre, J.; Huijbers, W.; LaPoint, M.; Buckley, R.F.; Johnson, K.A.; et al. Phases of Hyperconnectivity and Hypoconnectivity in the Default Mode and Salience Networks Track with Amyloid and Tau in Clinically Normal Individuals. J. Neurosci. 2017, 37, 4323–4331. [Google Scholar] [CrossRef]
- Smith, R.X.; Strain, J.F.; Tanenbaum, A.; Fagan, A.M.; Hassenstab, J.; McDade, E.; Schindler, S.E.; Gordon, B.A.; Xiong, C.; Chhatwal, J.; et al. Resting-State Functional Connectivity Disruption as a Pathological Biomarker in Autosomal Dominant Alzheimer Disease. Brain Connect. 2021, 11, 239–249. [Google Scholar] [CrossRef]
- Gouw, A.A.; Alsema, A.M.; Tijms, B.M.; Borta, A.; Scheltens, P.; Stam, C.J.; van der Flier, W.M. EEG spectral analysis as a putative early prognostic biomarker in nondemented, amyloid positive subjects. Neurobiol. Aging 2017, 57, 133–142. [Google Scholar] [CrossRef]
- Gutierrez-de Pablo, V.; Gomez, C.; Poza, J.; Maturana-Candelas, A.; Martins, S.; Gomes, I.; Lopes, A.M.; Pinto, N.; Hornero, R. Relationship between the Presence of the ApoE epsilon4 Allele and EEG Complexity along the Alzheimer’s Disease Continuum. Sensors 2020, 20, 3849. [Google Scholar] [CrossRef]
- Tait, L.; Tamagnini, F.; Stothart, G.; Barvas, E.; Monaldini, C.; Frusciante, R.; Volpini, M.; Guttmann, S.; Coulthard, E.; Brown, J.T.; et al. EEG microstate complexity for aiding early diagnosis of Alzheimer’s disease. Sci. Rep. 2020, 10, 17627. [Google Scholar] [CrossRef]
- Grover, V.P.; Tognarelli, J.M.; Crossey, M.M.; Cox, I.J.; Taylor-Robinson, S.D.; McPhail, M.J. Magnetic Resonance Imaging: Principles and Techniques: Lessons for Clinicians. J. Clin. Exp. Hepatol. 2015, 5, 246–255. [Google Scholar] [CrossRef] [PubMed] [Green Version]
- van Geuns, R.J.; Wielopolski, P.A.; de Bruin, H.G.; Rensing, B.J.; van Ooijen, P.M.; Hulshoff, M.; Oudkerk, M.; de Feyter, P.J. Basic principles of magnetic resonance imaging. Prog. Cardiovasc. Dis. 1999, 42, 149–156. [Google Scholar] [CrossRef]
- Johnson, K.A.; Fox, N.C.; Sperling, R.A.; Klunk, W.E. Brain imaging in Alzheimer disease. Cold Spring Harb. Perspect. Med. 2012, 2, a006213. [Google Scholar] [CrossRef] [PubMed]
- Marquez, F.; Yassa, M.A. Neuroimaging Biomarkers for Alzheimer’s Disease. Mol. Neurodegener. 2019, 14, 21. [Google Scholar] [CrossRef] [PubMed] [Green Version]
- Vemuri, P.; Jack, C.R., Jr. Role of structural MRI in Alzheimer’s disease. Alzheimers Res. 2010, 2, 23. [Google Scholar] [CrossRef] [Green Version]
- Frisoni, G.B.; Fox, N.C.; Jack, C.R., Jr.; Scheltens, P.; Thompson, P.M. The clinical use of structural MRI in Alzheimer disease. Nat. Rev. Neurol. 2010, 6, 67–77. [Google Scholar] [CrossRef] [Green Version]
- Dickerson, B.C.; Stoub, T.R.; Shah, R.C.; Sperling, R.A.; Killiany, R.J.; Albert, M.S.; Hyman, B.T.; Blacker, D.; Detoledo-Morrell, L. Alzheimer-signature MRI biomarker predicts AD dementia in cognitively normal adults. Neurology 2011, 76, 1395–1402. [Google Scholar] [CrossRef] [Green Version]
- Sabuncu, M.R.; Desikan, R.S.; Sepulcre, J.; Yeo, B.T.; Liu, H.; Schmansky, N.J.; Reuter, M.; Weiner, M.W.; Buckner, R.L.; Sperling, R.A.; et al. The dynamics of cortical and hippocampal atrophy in Alzheimer disease. Arch Neurol. 2011, 68, 1040–1048. [Google Scholar] [CrossRef] [Green Version]
- Lerch, J.P.; Pruessner, J.C.; Zijdenbos, A.; Hampel, H.; Teipel, S.J.; Evans, A.C. Focal decline of cortical thickness in Alzheimer’s disease identified by computational neuroanatomy. Cereb. Cortex 2005, 15, 995–1001. [Google Scholar] [CrossRef]
- Silbert, L.C.; Quinn, J.F.; Moore, M.M.; Corbridge, E.; Ball, M.J.; Murdoch, G.; Sexton, G.; Kaye, J.A. Changes in premorbid brain volume predict Alzheimer’s disease pathology. Neurology 2003, 61, 487–492. [Google Scholar] [CrossRef]
- Ledig, C.; Schuh, A.; Guerrero, R.; Heckemann, R.A.; Rueckert, D. Structural brain imaging in Alzheimer’s disease and mild cognitive impairment: Biomarker analysis and shared morphometry database. Sci. Rep. 2018, 8, 11258. [Google Scholar] [CrossRef] [PubMed] [Green Version]
- Kapoor, V.; McCook, B.M.; Torok, F.S. An introduction to PET-CT imaging. Radiographics 2004, 24, 523–543. [Google Scholar] [CrossRef] [PubMed]
- Omami, G.; Tamimi, D.; Branstetter, B.F. Basic principles and applications of18F-FDG-PET/CT in oral and maxillofacial imaging: A pictorial essay. Imaging Sci. Dent. 2014, 44, 325–332. [Google Scholar] [CrossRef] [PubMed] [Green Version]
- Chételat, G.; Arbizu, J.; Barthel, H.; Garibotto, V.; Law, I.; Morbelli, S.; van de Giessen, E.; Agosta, F.; Barkhof, F.; Brooks, D.J.; et al. Amyloid-PET and 18F-FDG-PET in the diagnostic investigation of Alzheimer’s disease and other dementias. Lancet Neurol. 2020, 19, 951–962. [Google Scholar] [CrossRef]
- Jiang, W.; Chalich, Y.; Deen, M.J. Sensors for Positron Emission Tomography Applications. Sensors 2019, 19, 5019. [Google Scholar] [CrossRef] [Green Version]
- Spanoudaki, V.; Levin, C.S. Photo-detectors for time of flight positron emission tomography (ToF-PET). Sensors 2010, 10, 10484–10505. [Google Scholar] [CrossRef]
- Mosconi, L.; Sorbi, S.; de Leon, M.J.; Li, Y.; Nacmias, B.; Myoung, P.S.; Tsui, W.; Ginestroni, A.; Bessi, V.; Fayyazz, M.; et al. Hypometabolism exceeds atrophy in presymptomatic early-onset familial Alzheimer’s disease. J. Nucl. Med. 2006, 47, 1778–1786. [Google Scholar]
- Jack, C.R., Jr.; Knopman, D.S.; Jagust, W.J.; Petersen, R.C.; Weiner, M.W.; Aisen, P.S.; Shaw, L.M.; Vemuri, P.; Wiste, H.J.; Weigand, S.D.; et al. Tracking pathophysiological processes in Alzheimer’s disease: An updated hypothetical model of dynamic biomarkers. Lancet Neurol. 2013, 12, 207–216. [Google Scholar] [CrossRef] [Green Version]
- Yuan, Y.; Gu, Z.X.; Wei, W.S. Fluorodeoxyglucose-positron-emission tomography, single-photon emission tomography, and structural MR imaging for prediction of rapid conversion to Alzheimer disease in patients with mild cognitive impairment: A meta-analysis. AJNR Am. J. Neuroradiol. 2009, 30, 404–410. [Google Scholar] [CrossRef] [Green Version]
- Ossenkoppele, R.; Tolboom, N.; Foster-Dingley, J.C.; Adriaanse, S.F.; Boellaard, R.; Yaqub, M.; Windhorst, A.D.; Barkhof, F.; Lammertsma, A.A.; Scheltens, P.; et al. Longitudinal imaging of Alzheimer pathology using [11C]PIB, [18F]FDDNP and [18F]FDG PET. Eur. J. Nucl. Med. Mol. Imaging 2012, 39, 990–1000. [Google Scholar] [CrossRef]
- Shen, X.; Liu, H.; Hu, Z.; Hu, H.; Shi, P. The relationship between cerebral glucose metabolism and age: Report of a large brain PET data set. PLoS ONE 2012, 7, e51517. [Google Scholar] [CrossRef] [PubMed]
- Yoshizawa, H.; Gazes, Y.; Stern, Y.; Miyata, Y.; Uchiyama, S. Characterizing the normative profile of 18F-FDG PET brain imaging: Sex difference, aging effect, and cognitive reserve. Psychiatry Res. 2014, 221, 78–85. [Google Scholar] [CrossRef] [PubMed]
- Teipel, S.; Drzezga, A.; Grothe, M.J.; Barthel, H.; Chetelat, G.; Schuff, N.; Skudlarski, P.; Cavedo, E.; Frisoni, G.B.; Hoffmann, W.; et al. Multimodal imaging in Alzheimer’s disease: Validity and usefulness for early detection. Lancet Neurol. 2015, 14, 1037–1053. [Google Scholar] [CrossRef]
- Mosconi, L.; De Santi, S.; Li, J.; Tsui, W.H.; Li, Y.; Boppana, M.; Laska, E.; Rusinek, H.; de Leon, M.J. Hippocampal hypometabolism predicts cognitive decline from normal aging. Neurobiol. Aging 2008, 29, 676–692. [Google Scholar] [CrossRef] [PubMed] [Green Version]
- Mosconi, L. Brain glucose metabolism in the early and specific diagnosis of Alzheimer’s disease. FDG-PET studies in MCI and AD. Eur. J. Nucl. Med. Mol. Imaging 2005, 32, 486–510. [Google Scholar] [CrossRef]
- Zhang, S.; Han, D.; Tan, X.; Feng, J.; Guo, Y.; Ding, Y. Diagnostic accuracy of 18 F-FDG and 11 C-PIB-PET for prediction of short-term conversion to Alzheimer’s disease in subjects with mild cognitive impairment. Int. J. Clin. Pract. 2012, 66, 185–198. [Google Scholar] [CrossRef]
- Ding, Y.; Sohn, J.H.; Kawczynski, M.G.; Trivedi, H.; Harnish, R.; Jenkins, N.W.; Lituiev, D.; Copeland, T.P.; Aboian, M.S.; Mari Aparici, C.; et al. A Deep Learning Model to Predict a Diagnosis of Alzheimer Disease by Using (18)F-FDG PET of the Brain. Radiology 2019, 290, 456–464. [Google Scholar] [CrossRef]
- Van Oostveen, W.M.; de Lange, E.C.M. Imaging Techniques in Alzheimer’s Disease: A Review of Applications in Early Diagnosis and Longitudinal Monitoring. Int. J. Mol. Sci. 2021, 22, 2110. [Google Scholar] [CrossRef]
- Nugent, S.; Croteau, E.; Potvin, O.; Castellano, C.A.; Dieumegarde, L.; Cunnane, S.C.; Duchesne, S. Selection of the optimal intensity normalization region for FDG-PET studies of normal aging and Alzheimer’s disease. Sci. Rep. 2020, 10, 9261. [Google Scholar] [CrossRef]
- Battaglia, S. Neurobiological advances of learned fear in humans. Adv. Clin. Exp. Med. 2022, 31, 217–221. [Google Scholar] [CrossRef]
- Spekker, E.; Tanaka, M.; Szabo, A.; Vecsei, L. Neurogenic Inflammation: The Participant in Migraine and Recent Advancements in Translational Research. Biomedicines 2021, 10, 76. [Google Scholar] [CrossRef] [PubMed]
- Tanaka, M.; Vecsei, L. Editorial of Special Issue “Crosstalk between Depression, Anxiety, and Dementia: Comorbidity in Behavioral Neurology and Neuropsychiatry”. Biomedicines 2021, 9, 517. [Google Scholar] [CrossRef] [PubMed]
- Drzezga, A.; Altomare, D.; Festari, C.; Arbizu, J.; Orini, S.; Herholz, K.; Nestor, P.; Agosta, F.; Bouwman, F.; Nobili, F.; et al. Diagnostic utility of 18F-Fluorodeoxyglucose positron emission tomography (FDG-PET) in asymptomatic subjects at increased risk for Alzheimer’s disease. Eur. J. Nucl. Med. Mol. Imaging 2018, 45, 1487–1496. [Google Scholar] [CrossRef] [Green Version]
- Thulborn, K.R.; Waterton, J.C.; Styles, P.; Radda, G.K. Rapid measurement of blood oxygenation and flow by high-field 1H n.m.r. Biochem. Soc. Trans. 1981, 9, 233–234. [Google Scholar] [CrossRef]
- Wright, M.E.; Wise, R.G. Can Blood Oxygenation Level Dependent Functional Magnetic Resonance Imaging Be Used Accurately to Compare Older and Younger Populations? A Mini Literature Review. Front. Aging Neurosci. 2018, 10, 371. [Google Scholar] [CrossRef] [PubMed] [Green Version]
- Gore, J.C. Principles and practice of functional MRI of the human brain. J. Clin. Investig. 2003, 112, 4–9. [Google Scholar] [CrossRef] [PubMed]
- Pihlajamaki, M.; Sperling, R.A. Functional MRI assessment of task-induced deactivation of the default mode network in Alzheimer’s disease and at-risk older individuals. Behav. Neurol. 2009, 21, 77–91. [Google Scholar] [CrossRef]
- Machulda, M.M.; Ward, H.A.; Borowski, B.; Gunter, J.L.; Cha, R.H.; O’Brien, P.C.; Petersen, R.C.; Boeve, B.F.; Knopman, D.; Tang-Wai, D.F.; et al. Comparison of memory fMRI response among normal, MCI, and Alzheimer’s patients. Neurology 2003, 61, 500–506. [Google Scholar] [CrossRef]
- Sperling, R. Functional MRI studies of associative encoding in normal aging, mild cognitive impairment, and Alzheimer’s disease. Ann. New York Acad. Sci. 2007, 1097, 146–155. [Google Scholar] [CrossRef]
- O’Brien, J.L.; O’Keefe, K.M.; LaViolette, P.S.; DeLuca, A.N.; Blacker, D.; Dickerson, B.C.; Sperling, R.A. Longitudinal fMRI in elderly reveals loss of hippocampal activation with clinical decline. Neurology 2010, 74, 1969–1976. [Google Scholar] [CrossRef] [Green Version]
- Huijbers, W.; Mormino, E.C.; Wigman, S.E.; Ward, A.M.; Vannini, P.; McLaren, D.G.; Becker, J.A.; Schultz, A.P.; Hedden, T.; Johnson, K.A.; et al. Amyloid deposition is linked to aberrant entorhinal activity among cognitively normal older adults. J. Neurosci. 2014, 34, 5200–5210. [Google Scholar] [CrossRef] [PubMed] [Green Version]
- Lv, H.; Wang, Z.; Tong, E.; Williams, L.M.; Zaharchuk, G.; Zeineh, M.; Goldstein-Piekarski, A.N.; Ball, T.M.; Liao, C.; Wintermark, M. Resting-State Functional MRI: Everything That Nonexperts Have Always Wanted to Know. AJNR Am. J. Neuroradiol. 2018, 39, 1390–1399. [Google Scholar] [CrossRef] [PubMed] [Green Version]
- Mevel, K.; Chetelat, G.; Eustache, F.; Desgranges, B. The default mode network in healthy aging and Alzheimer’s disease. Int. J. Alzheimers Dis. 2011, 2011, 535816. [Google Scholar] [CrossRef] [PubMed] [Green Version]
- Greicius, M.D.; Srivastava, G.; Reiss, A.L.; Menon, V. Default-mode network activity distinguishes Alzheimer’s disease from healthy aging: Evidence from functional MRI. Proc. Natl. Acad. Sci. USA 2004, 101, 4637–4642. [Google Scholar] [CrossRef] [Green Version]
- Wang, K.; Liang, M.; Wang, L.; Tian, L.; Zhang, X.; Li, K.; Jiang, T. Altered functional connectivity in early Alzheimer’s disease: A resting-state fMRI study. Hum. Brain Mapp. 2007, 28, 967–978. [Google Scholar] [CrossRef]
- Zamboni, G.; Wilcock, G.K.; Douaud, G.; Drazich, E.; McCulloch, E.; Filippini, N.; Tracey, I.; Brooks, J.C.; Smith, S.M.; Jenkinson, M.; et al. Resting functional connectivity reveals residual functional activity in Alzheimer’s disease. Biol. Psychiatry 2013, 74, 375–383. [Google Scholar] [CrossRef]
- Wang, L.; Zang, Y.; He, Y.; Liang, M.; Zhang, X.; Tian, L.; Wu, T.; Jiang, T.; Li, K. Changes in hippocampal connectivity in the early stages of Alzheimer’s disease: Evidence from resting state fMRI. Neuroimage 2006, 31, 496–504. [Google Scholar] [CrossRef]
- Guo, H.; Zhang, F.; Chen, J.; Xu, Y.; Xiang, J. Machine Learning Classification Combining Multiple Features of A Hyper-Network of fMRI Data in Alzheimer’s Disease. Front. Neurosci. 2017, 11, 615. [Google Scholar] [CrossRef]
- Amini, M.; Pedram, M.; Moradi, A.; Ouchani, M. Diagnosis of Alzheimer’s Disease Severity with fMRI Images Using Robust Multitask Feature Extraction Method and Convolutional Neural Network (CNN). Comput. Math. Methods Med. 2021, 2021, 5514839. [Google Scholar] [CrossRef]
- Guo, H.; Liu, L.; Chen, J.; Xu, Y.; Jie, X. Alzheimer Classification Using a Minimum Spanning Tree of High-Order Functional Network on fMRI Dataset. Front. Neurosci. 2017, 11, 639. [Google Scholar] [CrossRef] [Green Version]
- Ramzan, F.; Khan, M.U.G.; Rehmat, A.; Iqbal, S.; Saba, T.; Rehman, A.; Mehmood, Z. A Deep Learning Approach for Automated Diagnosis and Multi-Class Classification of Alzheimer’s Disease Stages Using Resting-State fMRI and Residual Neural Networks. J. Med. Syst. 2019, 44, 37. [Google Scholar] [CrossRef] [PubMed]
- Yang, Y.; Zha, X.; Zhang, X.; Ke, J.; Hu, S.; Wang, X.; Su, Y.; Hu, C. Dynamics and Concordance Abnormalities Among Indices of Intrinsic Brain Activity in Individuals with Subjective Cognitive Decline: A Temporal Dynamics Resting-State Functional Magnetic Resonance Imaging Analysis. Front. Aging Neurosci. 2020, 12, 584863. [Google Scholar] [CrossRef] [PubMed]
- Scarapicchia, V.; Brown, C.; Mayo, C.; Gawryluk, J.R. Functional Magnetic Resonance Imaging and Functional Near-Infrared Spectroscopy: Insights from Combined Recording Studies. Front. Hum. Neurosci. 2017, 11, 419. [Google Scholar] [CrossRef] [PubMed]
- Chou, P.-H.; Lan, T.-H. The role of near-infrared spectroscopy in Alzheimer’s disease. J. Clin. Gerontol. Geriatr. 2013, 4, 33–36. [Google Scholar] [CrossRef] [Green Version]
- Mohammadi-Nejad, A.R.; Mahmoudzadeh, M.; Hassanpour, M.S.; Wallois, F.; Muzik, O.; Papadelis, C.; Hansen, A.; Soltanian-Zadeh, H.; Gelovani, J.; Nasiriavanaki, M. Neonatal brain resting-state functional connectivity imaging modalities. Photoacoustics 2018, 10, 1–19. [Google Scholar] [CrossRef]
- Zeller, J.B.; Herrmann, M.J.; Ehlis, A.C.; Polak, T.; Fallgatter, A.J. Altered parietal brain oxygenation in Alzheimer’s disease as assessed with near-infrared spectroscopy. Am. J. Geriatr. Psychiatry 2010, 18, 433–441. [Google Scholar] [CrossRef]
- Fallgatter, A.J.; Roesler, M.; Sitzmann, L.; Heidrich, A.; Mueller, T.J.; Strik, W.K. Loss of functional hemispheric asymmetry in Alzheimer’s dementia assessed with near-infrared spectroscopy. Brain Res. Cogn. Brain Res. 1997, 6, 67–72. [Google Scholar] [CrossRef]
- Perpetuini, D.; Bucco, R.; Zito, M.; Merla, A. Study of memory deficit in Alzheimer’s disease by means of complexity analysis of fNIRS signal. Neurophotonics 2018, 5, 011010. [Google Scholar] [CrossRef]
- Li, X.; Zhu, Z.; Zhao, W.; Sun, Y.; Wen, D.; Xie, Y.; Liu, X.; Niu, H.; Han, Y. Decreased resting-state brain signal complexity in patients with mild cognitive impairment and Alzheimer’s disease: A multiscale entropy analysis. Biomed. Opt. Express 2018, 9, 1916–1929. [Google Scholar] [CrossRef] [Green Version]
- Tang, T.B.; Chan, Y.L. Functional Connectivity Analysis on Mild Alzheimer’s Disease, Mild Cognitive Impairment and Normal Aging using fNIRS. In Proceedings of the 2018 40th Annual International Conference of the IEEE Engineering in Medicine and Biology Society (EMBC), Honolulu, HI, USA, 17–22 July 2018; Volume 2018, pp. 17–20. [Google Scholar]
- Yang, D.; Huang, R.; Yoo, S.H.; Shin, M.J.; Yoon, J.A.; Shin, Y.I.; Hong, K.S. Detection of Mild Cognitive Impairment Using Convolutional Neural Network: Temporal-Feature Maps of Functional Near-Infrared Spectroscopy. Front. Aging Neurosci. 2020, 12, 141. [Google Scholar] [CrossRef]
- Arenth, P.M.; Ricker, J.H.; Schultheis, M.T. Applications of functional near-infrared spectroscopy (fNIRS) to Neurorehabilitation of cognitive disabilities. Clin. Neuropsychol. 2007, 21, 38–57. [Google Scholar] [CrossRef] [PubMed]
- Skrandies, W. EEG/EP: New techniques. Brain Topogr. 1993, 5, 347–350. [Google Scholar] [CrossRef] [PubMed]
- Tatum, W.O.; Rubboli, G.; Kaplan, P.W.; Mirsatari, S.M.; Radhakrishnan, K.; Gloss, D.; Caboclo, L.O.; Drislane, F.W.; Koutroumanidis, M.; Schomer, D.L.; et al. Clinical utility of EEG in diagnosing and monitoring epilepsy in adults. Clin. Neurophysiol. 2018, 129, 1056–1082. [Google Scholar] [CrossRef] [PubMed]
- Liu, J.; Xu, J.; Zou, G.; He, Y.; Zou, Q.; Gao, J.H. Reliability and Individual Specificity of EEG Microstate Characteristics. Brain Topogr. 2020, 33, 438–449. [Google Scholar] [CrossRef]
- Cassani, R.; Estarellas, M.; San-Martin, R.; Fraga, F.J.; Falk, T.H. Systematic Review on Resting-State EEG for Alzheimer’s Disease Diagnosis and Progression Assessment. Dis. Markers 2018, 2018, 5174815. [Google Scholar] [CrossRef] [Green Version]
- Wallstrom, G.L.; Kass, R.E.; Miller, A.; Cohn, J.F.; Fox, N.A. Automatic correction of ocular artifacts in the EEG: A comparison of regression-based and component-based methods. Int. J. Psychophysiol. 2004, 53, 105–119. [Google Scholar] [CrossRef]
- Hata, M.; Kazui, H.; Tanaka, T.; Ishii, R.; Canuet, L.; Pascual-Marqui, R.D.; Aoki, Y.; Ikeda, S.; Kanemoto, H.; Yoshiyama, K.; et al. Functional connectivity assessed by resting state EEG correlates with cognitive decline of Alzheimer’s disease—An eLORETA study. Clin. Neurophysiol. 2016, 127, 1269–1278. [Google Scholar] [CrossRef] [Green Version]
- Houmani, N.; Vialatte, F.; Gallego-Jutgla, E.; Dreyfus, G.; Nguyen-Michel, V.H.; Mariani, J.; Kinugawa, K. Diagnosis of Alzheimer’s disease with Electroencephalography in a differential framework. PLoS ONE 2018, 13, e0193607. [Google Scholar] [CrossRef] [Green Version]
- Meghdadi, A.H.; Stevanovic Karic, M.; McConnell, M.; Rupp, G.; Richard, C.; Hamilton, J.; Salat, D.; Berka, C. Resting state EEG biomarkers of cognitive decline associated with Alzheimer’s disease and mild cognitive impairment. PLoS ONE 2021, 16, e0244180. [Google Scholar] [CrossRef]
- Tzimourta, K.D.; Giannakeas, N.; Tzallas, A.T.; Astrakas, L.G.; Afrantou, T.; Ioannidis, P.; Grigoriadis, N.; Angelidis, P.; Tsalikakis, D.G.; Tsipouras, M.G. EEG Window Length Evaluation for the Detection of Alzheimer’s Disease over Different Brain Regions. Brain Sci. 2019, 9, 81. [Google Scholar] [CrossRef] [Green Version]
- Wang, R.; Wang, J.; Yu, H.; Wei, X.; Yang, C.; Deng, B. Decreased coherence and functional connectivity of electroencephalograph in Alzheimer’s disease. Chaos 2014, 24, 033136. [Google Scholar] [CrossRef] [PubMed]
- Han, Y.; Wang, K.; Jia, J.; Wu, W. Changes of EEG Spectra and Functional Connectivity during an Object-Location Memory Task in Alzheimer’s Disease. Front. Behav Neurosci. 2017, 11, 107. [Google Scholar] [CrossRef] [Green Version]
- Gaubert, S.; Raimondo, F.; Houot, M.; Corsi, M.C.; Naccache, L.; Diego Sitt, J.; Hermann, B.; Oudiette, D.; Gagliardi, G.; Habert, M.O.; et al. EEG evidence of compensatory mechanisms in preclinical Alzheimer’s disease. Brain 2019, 142, 2096–2112. [Google Scholar] [CrossRef] [PubMed]
- Brickman, A.M.; Tosto, G.; Gutierrez, J.; Andrews, H.; Gu, Y.; Narkhede, A.; Rizvi, B.; Guzman, V.; Manly, J.J.; Vonsattel, J.P.; et al. An MRI measure of degenerative and cerebrovascular pathology in Alzheimer disease. Neurology 2018, 91, e1402–e1412. [Google Scholar] [CrossRef] [PubMed]
- Long, X.; Chen, L.; Jiang, C.; Zhang, L.; Alzheimer’s Disease Neuroimaging, I. Prediction and classification of Alzheimer disease based on quantification of MRI deformation. PLoS ONE 2017, 12, e0173372. [Google Scholar] [CrossRef] [PubMed]
- Mehmood, A.; Yang, S.; Feng, Z.; Wang, M.; Ahmad, A.S.; Khan, R.; Maqsood, M.; Yaqub, M. A Transfer Learning Approach for Early Diagnosis of Alzheimer’s Disease on MRI Images. Neuroscience 2021, 460, 43–52. [Google Scholar] [CrossRef]
- Wolz, R.; Julkunen, V.; Koikkalainen, J.; Niskanen, E.; Zhang, D.P.; Rueckert, D.; Soininen, H.; Lotjonen, J.; Alzheimer’s Disease Neuroimaging, I. Multi-method analysis of MRI images in early diagnostics of Alzheimer’s disease. PLoS ONE 2011, 6, e25446. [Google Scholar] [CrossRef] [Green Version]
- Kim, K.; Ko, W.S.; Kim, S.J. Diagnostic test accuracies of F-18 FDG PET for characterization of cardiac masses compared to conventional imaging techniques: Systematic review and Meta-analysis. Br. J. Radiol. 2022, 20210263. [Google Scholar] [CrossRef]
- Nakamura, S.; Yomota, S.; Ito, H.; Akinaga, N.; Hori, A.; Chinomi, K.; Suzuki, H.; Uchida, K.; Asada, T. A Novel Cognitive Function Scale Using Functional Near-Infrared Spectroscopy for Evaluating Cognitive Dysfunction. J. Alzheimers Dis. 2021, 81, 1579–1588. [Google Scholar] [CrossRef]
- Niu, H.; Zhu, Z.; Wang, M.; Li, X.; Yuan, Z.; Sun, Y.; Han, Y. Abnormal dynamic functional connectivity and brain states in Alzheimer’s diseases: Functional near-infrared spectroscopy study. Neurophotonics 2019, 6, 025010. [Google Scholar] [CrossRef]
- Tuovinen, T.; Kananen, J.; Rajna, Z.; Lieslehto, J.; Korhonen, V.; Rytty, R.; Mattila, H.; Huotari, N.; Raitamaa, L.; Helakari, H.; et al. The variability of functional MRI brain signal increases in Alzheimer’s disease at cardiorespiratory frequencies. Sci. Rep. 2020, 10, 21559. [Google Scholar] [CrossRef] [PubMed]
- Simpraga, S.; Alvarez-Jimenez, R.; Mansvelder, H.D.; van Gerven, J.M.A.; Groeneveld, G.J.; Poil, S.S.; Linkenkaer-Hansen, K. EEG machine learning for accurate detection of cholinergic intervention and Alzheimer’s disease. Sci. Rep. 2017, 7, 5775. [Google Scholar] [CrossRef] [PubMed]
- Poil, S.S.; de Haan, W.; van der Flier, W.M.; Mansvelder, H.D.; Scheltens, P.; Linkenkaer-Hansen, K. Integrative EEG biomarkers predict progression to Alzheimer’s disease at the MCI stage. Front. Aging Neurosci. 2013, 5, 58. [Google Scholar] [CrossRef] [PubMed] [Green Version]
- Zhang, X.Y.; Yang, Z.L.; Lu, G.M.; Yang, G.F.; Zhang, L.J. PET/MR Imaging: New Frontier in Alzheimer’s Disease and Other Dementias. Front. Mol. Neurosci. 2017, 10, 343. [Google Scholar] [CrossRef] [PubMed]
- Catana, C.; Drzezga, A.; Heiss, W.D.; Rosen, B.R. PET/MRI for neurologic applications. J. Nucl. Med. 2012, 53, 1916–1925. [Google Scholar] [CrossRef] [PubMed] [Green Version]
- Li, R.; Nguyen, T.; Potter, T.; Zhang, Y. Dynamic cortical connectivity alterations associated with Alzheimer’s disease: An EEG and fNIRS integration study. Neuroimage Clin. 2019, 21, 101622. [Google Scholar] [CrossRef]
- Perpetuini, D.; Chiarelli, A.M.; Filippini, C.; Cardone, D.; Croce, P.; Rotunno, L.; Anzoletti, N.; Zito, M.; Zappasodi, F.; Merla, A. Working Memory Decline in Alzheimer’s Disease Is Detected by Complexity Analysis of Multimodal EEG-fNIRS. Entropy 2020, 22, 1380. [Google Scholar] [CrossRef]
- Cicalese, P.A.; Li, R.; Ahmadi, M.B.; Wang, C.; Francis, J.T.; Selvaraj, S.; Schulz, P.E.; Zhang, Y. An EEG-fNIRS hybridization technique in the four-class classification of alzheimer’s disease. J. Neurosci. Methods 2020, 336, 108618. [Google Scholar] [CrossRef]
- Lu, D.; Popuri, K.; Ding, G.W.; Balachandar, R.; Beg, M.F.; Alzheimer’s Disease Neuroimaging, I. Multimodal and Multiscale Deep Neural Networks for the Early Diagnosis of Alzheimer’s Disease using structural MR and FDG-PET images. Sci. Rep. 2018, 8, 5697. [Google Scholar] [CrossRef] [Green Version]
- Tong, T.; Gray, K.; Gao, Q.; Chen, L.; Rueckert, D. Multi-modal classification of Alzheimer’s disease using nonlinear graph fusion. Pattern Recognit. 2017, 63, 171–181. [Google Scholar] [CrossRef]
- Choi, H.S.; Kim, H.K. Multispectral image-guided surgery in patients. Nat. Biomed. Eng. 2020, 4, 245–246. [Google Scholar] [CrossRef] [PubMed]
- Owens, E.A.; Henary, M.; El Fakhri, G.; Choi, H.S. Tissue-specific near-infrared fluorescence imaging. Acc. Chem. Res. 2016, 49, 1731–1740. [Google Scholar] [CrossRef] [PubMed] [Green Version]
- Son, J.; Yi, G.; Yoo, J.; Park, C.; Koo, H.; Choi, H.S. Light-responsive nanomedicine for biophotonic imaging and targeted therapy. Adv. Drug Deliv. Rev. 2019, 138, 133–147. [Google Scholar] [CrossRef] [PubMed]
- Owens, E.A.; Hyun, H.; Dost, T.L.; Lee, J.H.; Park, G.; Pham, D.H.; Park, M.H.; Choi, H.S.; Henary, M. Near-infrared illumination of native tissues for image-guided surgery. J. Med. Chem. 2016, 59, 5311–5323. [Google Scholar] [CrossRef] [PubMed] [Green Version]
- Kim, T.; O’Brien, C.; Choi, H.S.; Jeong, M.Y. Fluorescence molecular imaging systems for intraoperative image-guided surgery. Appl. Spectrosc. Rev. 2018, 53, 349–359. [Google Scholar] [CrossRef]
- Sajedi, S.; Sabet, H.; Choi, H.S. Intraoperative biophotonic imaging systems for image-guided interventions. Nanophotonics 2019, 8, 99–116. [Google Scholar] [CrossRef] [PubMed]
- Tong, H.; Lou, K.; Wang, W. Near-infrared fluorescent probes for imaging of amyloid plaques in Alzheimers disease. Acta Pharm. Sin. B 2015, 5, 25–33. [Google Scholar] [CrossRef] [Green Version]
- Zhang, X.; Tian, Y.; Zhang, C.; Tian, X.; Ross, A.W.; Moir, R.D.; Sun, H.; Tanzi, R.E.; Moore, A.; Ran, C. Near-infrared fluorescence molecular imaging of amyloid beta species and monitoring therapy in animal models of Alzheimer’s disease. Proc. Natl. Acad. Sci. USA 2015, 112, 9734–9739. [Google Scholar] [CrossRef] [Green Version]
- Dou, W.T.; Zhang, J.J.; Li, Q.; Guo, Z.; Zhu, W.; Chen, G.R.; Zhang, H.Y.; He, X.P. Fluorescence Imaging of Alzheimer’s Disease with a Flat Ensemble Formed between a Quinoline-Malononitrile AIEgen and Thin-Layer Molybdenum Disulfide. ChemBioChem 2019, 20, 1856–1860. [Google Scholar] [CrossRef]
- Wang, C.; Wang, X.; Chan, H.N.; Liu, G.; Wang, Z.; Li, H.W.; Wong, M.S. Amyloid-β Oligomer-Targeted Gadolinium-Based NIR/MR Dual-Modal Theranostic Nanoprobe for Alzheimer’s Disease. Adv. Funct. Mater. 2020, 30, 1909529. [Google Scholar] [CrossRef]
- Hou, S.S.; Yang, J.; Lee, J.H.; Calvo-Rodriguez, M.; Bao, K.; Kashiwagi, S.; Kumar, A.T.N.; Bacskai, B.J.; Choi, H.S. Zwitterionic near-Infrared probe enables noninvasive fluorescence lifetime imaging of Amyloid-β aggregates and tau fibrils. Nat. Biomed. Eng. 2022, in press. [Google Scholar]
- Choi, H.S.; Nasr, K.; Alyabyev, S.; Feith, D.; Lee, J.H.; Kim, S.H.; Ashitate, Y.; Hyun, H.; Patonay, G.; Strekowski, L.; et al. Synthesis and in vivo fate of zwitterionic near-infrared fluorophores. Angew. Chem. Int. Ed. Engl. 2011, 50, 6258–6263. [Google Scholar] [CrossRef] [PubMed] [Green Version]
- Hyun, H.; Bordo, M.W.; Nasr, K.; Feith, D.; Lee, J.H.; Kim, S.H.; Ashitate, Y.; Moffitt, L.A.; Rosenberg, M.; Henary, M.; et al. cGMP-Compatible preparative scale synthesis of near-infrared fluorophores. Contrast Media Mol. Imaging 2012, 7, 516–524. [Google Scholar] [CrossRef] [PubMed]
- Hyun, H.; Owens, E.A.; Narayana, L.; Wada, H.; Gravier, J.; Bao, K.; Frangioni, J.V.; Choi, H.S.; Henary, M. Central C-C Bonding Increases Optical and Chemical Stability of NIR Fluorophores. RSC Adv. 2014, 4, 58762–58768. [Google Scholar] [CrossRef] [Green Version]
- Yang, C.; Wang, H.; Yokomizo, S.; Hickey, M.; Chang, H.; Kang, H.; Fukuda, T.; Song, M.Y.; Lee, S.Y.; Park, J.W.; et al. ZW800-PEG: A Renal Clearable Zwitterionic Near-Infrared Fluorophore for Potential Clinical Translation. Angew Chem. Int. Ed Engl 2021, 60, 13847–13852. [Google Scholar] [CrossRef]


| Imaging Method | Principle | Main Findings | Refs. |
|---|---|---|---|
| Structural MRI | MR with hydrogen | Cerebral atrophy, ventricular enlargement | [7,8,9,10] |
| FDG-PET | Radioluminescence of FDG, amyloid, tau, etc. | Reduced cerebral glucose metabolism | [11,12] |
| fNIRS | NIR light for hemodynamics | Reduction in HbO concentration | [13] |
| fMRI | MR for hemodynamics | Hyper- and hypo-activation in the task-related regions | [14,15,16,17,18,19,20,21,22] |
| EEG | Electrical signal of brain | Altered functional connectivity pattern, slowing, decrease in complexity, alterations in microstate | [23,24,25,26,27,28,29,30] |
| Method | Sensitivity | Specificity | Accuracy | Pros | Cons | Refs. |
|---|---|---|---|---|---|---|
| MRI | 80–95% | 55–98% | 89–97% | Spatial resolution | Temporal resolution, MR exposure | [36,105,106,107,108] |
| FDG-PET | 43–100% | 57–100% | 50–100% | Clear image | FDG injection | [44,47,57,63,109] |
| fNIRS | 82–94% | 72–88% | 50–90% | High speed, portability | Spatial resolution | [110,111] |
| fMRI | 84–94% | 68–91% | 75–93% | Spatial resolution | Not portable/Expose MR | [78,80,112] |
| EEG | 35–88% | 82–100% | 62–92% | High speed, portability | Spatial resolution | [99,101,103,113,114] |
Publisher’s Note: MDPI stays neutral with regard to jurisdictional claims in published maps and institutional affiliations. |
© 2022 by the authors. Licensee MDPI, Basel, Switzerland. This article is an open access article distributed under the terms and conditions of the Creative Commons Attribution (CC BY) license (https://creativecommons.org/licenses/by/4.0/).
Share and Cite
Kim, J.; Jeong, M.; Stiles, W.R.; Choi, H.S. Neuroimaging Modalities in Alzheimer’s Disease: Diagnosis and Clinical Features. Int. J. Mol. Sci. 2022, 23, 6079. https://doi.org/10.3390/ijms23116079
Kim J, Jeong M, Stiles WR, Choi HS. Neuroimaging Modalities in Alzheimer’s Disease: Diagnosis and Clinical Features. International Journal of Molecular Sciences. 2022; 23(11):6079. https://doi.org/10.3390/ijms23116079
Chicago/Turabian StyleKim, JunHyun, Minhong Jeong, Wesley R. Stiles, and Hak Soo Choi. 2022. "Neuroimaging Modalities in Alzheimer’s Disease: Diagnosis and Clinical Features" International Journal of Molecular Sciences 23, no. 11: 6079. https://doi.org/10.3390/ijms23116079