Nutritional Indices for Assessing Fatty Acids: A Mini-Review

Abstract
: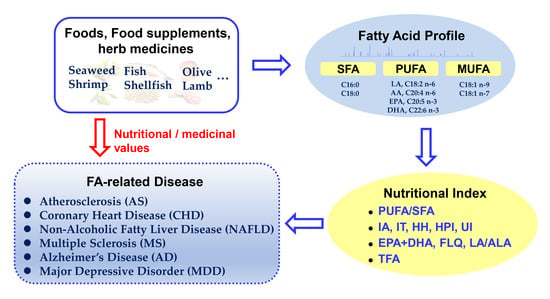
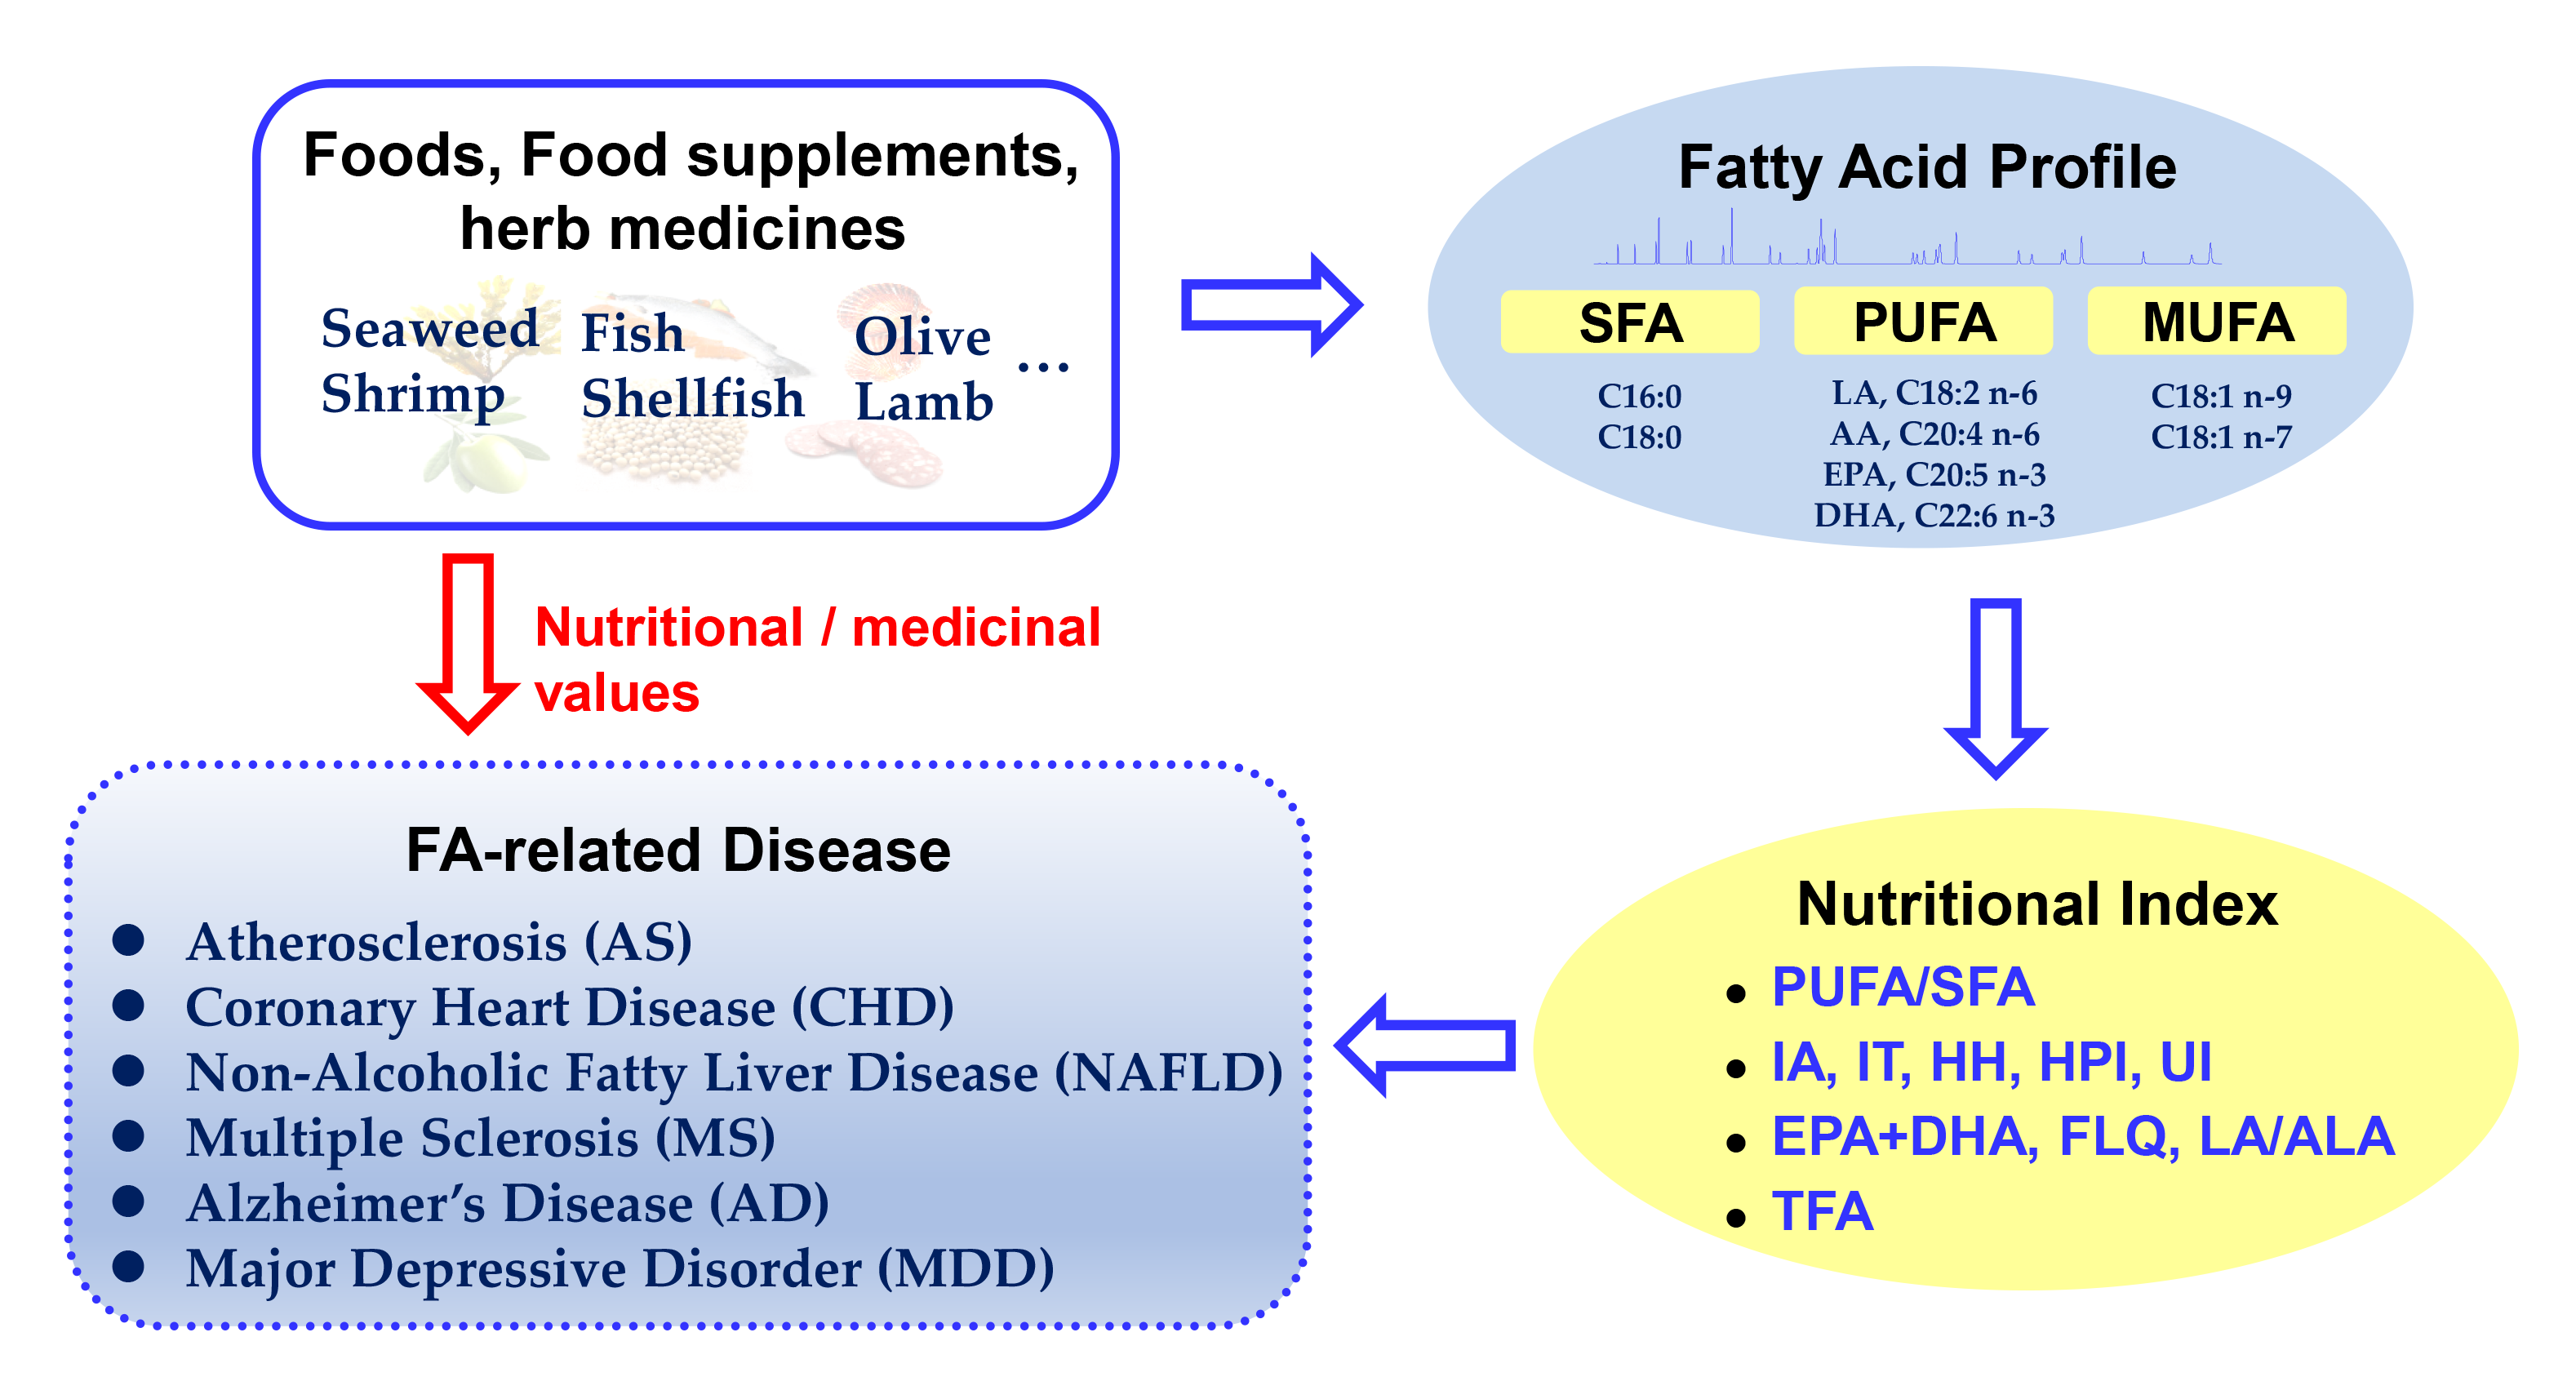
1. Introduction
2. Nutritional Indices
2.1. Polyunsaturated Fatty Acid/Saturated Fatty Acid (PUFA/SFA)
2.2. Index of Atherogenicity (IA)
2.3. Index of Thrombogenicity (IT)
2.4. Hypocholesterolemic/Hypercholesterolemic (HH) Ratio
2.5. Health-Promoting Index (HPI)
2.6. Unsaturation Index (UI)
2.7. Sum of Eicosapentaenoic Acid and Docosahexaenoic Acid (EPA + DHA)
2.8. Fish Lipid Quality/Flesh Lipid Quality (FLQ)
2.9. The Linoleic Acid/α-Linolenic Acid (LA/ALA) Ratio
2.10. Trans Fatty Acid (TFA)
3. Conclusions
Author Contributions
Funding
Conflicts of Interest
Abbreviations
| ALA | α-linolenic acid |
| AS | Atherosclerosis |
| CHD | Coronary heart disease |
| CLA | Conjugated fatty acids |
| CVD | Cardiovascular disease |
| CVH | Cardiovascular health |
| DHA | Docosahexaenoic acid |
| EFSA | European Food Safety Authority |
| EPA | Eicosapentaenoic acid |
| FA | Fatty acid |
| FAO | Food and Agriculture Organization |
| FDA | Food and Drug Administration |
| FLQ | Fish lipid quality/flesh lipid quality |
| FSANZ | Food Standards Australia New Zealand |
| HH | Hypocholesterolemic/hypercholesterolemic ratio |
| HPI | Health-promoting index |
| IA | Index of atherogenicity |
| IT | Index of thrombogenicity |
| LA | Linoleic acid |
| LDL-C | Low-density lipoprotein cholesterol |
| LDLR | Low-density lipoprotein receptors |
| MS | Multiple sclerosis |
| MUFA | Monounsaturated fatty acid |
| PPAR-γ | Peroxisome proliferators-activated receptor-gamma |
| PUFA | Polyunsaturated fatty acid |
| SFA | Saturated fatty acid |
| TFA | Trans fatty acid |
| TG | Triglycerides |
| UFA | Unsaturated fatty acid |
| UI | Unsaturation index |
| WHO | World Health Organization |
References
- Rimm, E.B.; Appel, L.J.; Chiuve, S.E.; Djoussé, L.; Engler, M.B.; Kris-Etherton, P.M.; Mozaffarian, D.; Siscovick, D.S.; Lichtenstein, A.H. Seafood long-chain n-3 polyunsaturated fatty acids and cardiovascular disease: A science advisory from the American Heart Association. Circulation 2018, 138, 35–47. [Google Scholar] [CrossRef] [PubMed]
- Wu, H.; Xu, L.; Ballantyne, C.M. Dietary and pharmacological fatty acids and cardiovascular health. J. Clin. Endocrinol. Metab. 2020, 105, 1030–1045. [Google Scholar] [CrossRef] [PubMed]
- Marangoni, F.; Agostoni, C.; Borghi, C.; Catapano, A.L.; Cena, H.; Ghiselli, A.; La Vecchia, C.; Lercker, G.; Manzato, E.; Pirillo, A. Dietary linoleic acid and human health: Focus on cardiovascular and cardiometabolic effects. Atherosclerosis 2020, 292, 90–98. [Google Scholar] [CrossRef] [PubMed] [Green Version]
- Naeini, Z.; Toupchian, O.; Vatannejad, A.; Sotoudeh, G.; Teimouri, M.; Ghorbani, M.; Nasli-Esfahani, E.; Koohdani, F. Effects of DHA-enriched fish oil on gene expression levels of p53 and NF-κB and PPAR-γ activity in PBMCs of patients with T2DM: A randomized, double-blind, clinical trial. Nutr. Metab. Cardiovasc. 2020, 30, 441–447. [Google Scholar] [CrossRef]
- Bird, J.K.; Calder, P.C.; Eggersdorfer, M. The role of n-3 long chain polyunsaturated fatty acids in cardiovascular disease prevention, and interactions with statins. Nutrients 2018, 10, 775. [Google Scholar] [CrossRef] [Green Version]
- Tomata, Y.; Larsson, S.C.; Hägg, S. Polyunsaturated fatty acids and risk of Alzheimer’s disease: A Mendelian randomization study. Eur. J. Nutr. 2020, 59, 1763–1766. [Google Scholar] [CrossRef] [Green Version]
- Langley, M.R.; Triplet, E.M.; Scarisbrick, I.A. Dietary influence on central nervous system myelin production, injury, and regeneration. BBA-Mol. Basis Dis. 2020, 1866, 165779. [Google Scholar] [CrossRef]
- Zhou, Y.; Tao, X.; Wang, Z.; Feng, L.; Wang, L.; Liu, X.; Pan, R.; Liao, Y.; Chang, Q. Hippocampus metabolic disturbance and autophagy deficiency in olfactory bulbectomized rats and the modulatory effect of fluoxetine. Int. J. Mol. Sci. 2019, 20, 4282. [Google Scholar] [CrossRef] [Green Version]
- Chang, J.P.; Chang, S.; Yang, H.; Chen, H.; Chien, Y.; Yang, B.; Su, H.; Su, K. Omega-3 polyunsaturated fatty acids in cardiovascular diseases comorbid major depressive disorder-results from a randomized controlled trial. Brain Behav. Immun. 2020, 85, 14–20. [Google Scholar] [CrossRef]
- Konstantynowicz-Nowicka, K.; Berk, K.; Chabowski, A.; Kasacka, I.; Bielawiec, P.; Łukaszuk, B.; Harasim-Symbor, E. High-fat feeding in time-dependent manner affects metabolic routes leading to nervonic acid synthesis in NAFLD. Int. J. Mol. Sci. 2019, 20, 3829. [Google Scholar] [CrossRef] [Green Version]
- Chen, L.; Wang, Y.; Xu, Q.; Chen, S. Omega-3 fatty acids as a treatment for non-alcoholic fatty liver disease in children: A systematic review and meta-analysis of randomized controlled trials. Clin. Nutr. 2018, 37, 516–521. [Google Scholar] [CrossRef] [PubMed]
- Chen, Y.; Chen, H.; Huang, B.; Chen, Y.; Chang, C. Polyphenol rich extracts from Toona sinensis bark and fruit ameliorate free fatty acid-induced lipogenesis through AMPK and LC3 pathways. J. Clin. Med. 2019, 8, 1664. [Google Scholar] [CrossRef] [PubMed] [Green Version]
- Wu, K.; Zhao, T.; Hogstrand, C.; Xu, Y.; Ling, S.; Chen, G.; Luo, Z. FXR-mediated inhibition of autophagy contributes to FA-induced TG accumulation and accordingly reduces FA-induced lipotoxicity. Cell Commun. Signal. 2020, 18, 1–16. [Google Scholar] [CrossRef] [PubMed] [Green Version]
- Tobias, T.A.; Wood, L.G.; Rastogi, D. Carotenoids, fatty acids and disease burden in obese minority adolescents with asthma. Clin. Exp. Allergy 2019, 49, 838–846. [Google Scholar] [CrossRef]
- Monga, N.; Sethi, G.S.; Kondepudi, K.K.; Naura, A.S. Lipid mediators and asthma: Scope of therapeutics. Biochem. Pharmacol. 2020, in press. [Google Scholar] [CrossRef]
- Magnusson, J.; Ekström, S.; Kull, I.; Håkansson, N.; Nilsson, S.; Wickman, M.; Melén, E.; Risérus, U.; Bergström, A. Polyunsaturated fatty acids in plasma at 8 years and subsequent allergic disease. J. Allergy Clin. Immunol. 2018, 142, 510–516. [Google Scholar] [CrossRef] [Green Version]
- Miranda-Gonçalves, V.; Lameirinhas, A.; Henrique, R.; Baltazar, F.; Jerónimo, C. The metabolic landscape of urological cancers: New therapeutic perspectives. Cancer Lett. 2020, 477, 76–87. [Google Scholar] [CrossRef]
- Tripathi, R.K.P. A perspective review on fatty acid amide hydrolase (FAAH) inhibitors as potential therapeutic agents. Eur. J. Med. Chem. 2020, 188, 111953. [Google Scholar] [CrossRef]
- Vadell, A.K.; Bärebring, L.; Hulander, E.; Gjertsson, I.; Lindqvist, H.M.; Winkvist, A. Anti-inflammatory diet in rheumatoid arthritis (ADIRA)-a randomized, controlled crossover trial indicating effects on disease activity. Am. J. Clin. Nutr. 2020, 111, 1203–1213. [Google Scholar] [CrossRef] [Green Version]
- Dos Santos Simon, M.I.S.; Dalle Molle, R.; Silva, F.M.; Rodrigues, T.W.; Feldmann, M.; Forte, G.C.; Marostica, P.J.C. Antioxidant micronutrients and essential fatty acids supplementation on cystic fibrosis outcomes: A systematic review. J. Acad. Nutr. Diet. 2020, 120, 1016–1033. [Google Scholar] [CrossRef]
- Kjølbæk, L.; Benítez-Páez, A.; Del Pulgar, E.M.G.; Brahe, L.K.; Liebisch, G.; Matysik, S.; Rampelli, S.; Vermeiren, J.; Brigidi, P.; Larsen, L.H. Arabinoxylan oligosaccharides and polyunsaturated fatty acid effects on gut microbiota and metabolic markers in overweight individuals with signs of metabolic syndrome: A randomized cross-over trial. Clin. Nutr. 2020, 39, 67–79. [Google Scholar] [CrossRef] [PubMed]
- Song, Y.; Hogstrand, C.; Ling, S.; Chen, G.; Luo, Z. Creb-Pgc1α pathway modulates the interaction between lipid droplets and mitochondria and influences high fat diet-induced changes of lipid metabolism in the liver and isolated hepatocytes of yellow catfish. J. Nutr. Biochem. 2020, 80, 108364. [Google Scholar] [CrossRef] [PubMed]
- Mozaffari, H.; Daneshzad, E.; Larijani, B.; Bellissimo, N.; Azadbakht, L. Dietary intake of fish, n-3 polyunsaturated fatty acids, and risk of inflammatory bowel disease: A systematic review and meta-analysis of observational studies. Eur. J. Nutr. 2020, 59, 1–17. [Google Scholar] [CrossRef] [PubMed]
- Min, S.Y.; Learnard, H.; Kant, S.; Gealikman, O.; Rojas-Rodriguez, R.; DeSouza, T.; Desai, A.; Keaney, J.F.; Corvera, S.; Craige, S.M. Exercise rescues gene pathways involved in vascular expansion and promotes functional angiogenesis in subcutaneous white adipose tissue. Int. J. Mol. Sci. 2019, 20, 2046. [Google Scholar] [CrossRef] [Green Version]
- Syren, M.; Turolo, S.; Marangoni, F.; Milani, G.P.; Edefonti, A.; Montini, G.; Agostoni, C. The polyunsaturated fatty acid balance in kidney health and disease: A review. Clin. Nutr. 2018, 37, 1829–1839. [Google Scholar] [CrossRef]
- Khalid, A.; Siddiqui, A.J.; Huang, J.; Shamsi, T.; Musharraf, S.G. Alteration of serum free fatty acids are indicators for progression of pre-leukaemia diseases to leukaemia. Sci. Rep. 2018, 8, 1–10. [Google Scholar] [CrossRef]
- Kumar, M.; Kumari, P.; Trivedi, N.; Shukla, M.K.; Gupta, V.; Reddy, C.; Jha, B. Minerals, PUFAs and antioxidant properties of some tropical seaweeds from Saurashtra coast of India. J. Appl. Phycol. 2011, 23, 797–810. [Google Scholar] [CrossRef]
- Chan, P.T.; Matanjun, P. Chemical composition and physicochemical properties of tropical red seaweed, Gracilaria changii. Food Chem. 2017, 221, 302–310. [Google Scholar] [CrossRef]
- Chen, Z.; Xu, Y.; Liu, T.; Zhang, L.; Liu, H.; Guan, H. Comparative studies on the characteristic fatty acid profiles of four different Chinese medicinal Sargassum seaweeds by GC-MS and chemometrics. Mar. Drugs 2016, 14, 68. [Google Scholar] [CrossRef]
- Calabrò, S.; Cutrignelli, M.I.; Lo Presti, V.; Tudisco, R.; Chiofalo, V.; Grossi, M.; Infascelli, F.; Chiofalo, B. Characterization and effect of year of harvest on the nutritional properties of three varieties of white lupine (Lupinus albus L.). J. Sci. Food Agric. 2015, 95, 3127–3136. [Google Scholar] [CrossRef]
- Chiofalo, B.; Lo Presti, V.; D’Agata, A.; Rao, R.; Ceravolo, G.; Gresta, F. Qualitative profile of degummed guar (Cyamopsis tetragonoloba L.) seeds grown in a Mediterranean area for use as animal feed. J. Anim. Physiol. Anim. Nutr. 2018, 102, 260–267. [Google Scholar] [CrossRef] [PubMed] [Green Version]
- Farajzadeh Alan, D.; Naeli, M.H.; Naderi, M.; Jafari, S.M.; Tavakoli, H.R. Production of trans-free fats by chemical interesterified blends of palm stearin and sunflower oil. Food Sci. Nutr. 2019, 7, 3722–3730. [Google Scholar] [CrossRef] [PubMed] [Green Version]
- Filip, S.; Hribar, J.; Vidrih, R. Influence of natural antioxidants on the formation of trans fatty acid isomers during heat treatment of sunflower oil. Eur. J. Lipid Sci. Technol. 2011, 113, 224–230. [Google Scholar] [CrossRef]
- Rincón-Cervera, M.Á.; González-Barriga, V.; Romero, J.; Rojas, R.; López-Arana, S. Quantification and distribution of omega-3 fatty acids in south pacific fish and shellfish species. Foods 2020, 9, 233. [Google Scholar] [CrossRef] [PubMed] [Green Version]
- Skałecki, P.; Kaliniak-Dziura, A.; Domaradzki, P.; Florek, M.; Kępka, M. Fatty acid composition and oxidative stability of the lipid fraction of skin-on and skinless fillets of prussian carp (Carassius gibelio). Animals 2020, 10, 778. [Google Scholar] [CrossRef]
- Fernandes, C.E.; Da Silva Vasconcelos, M.A.; de Almeida Ribeiro, M.; Sarubbo, L.A.; Andrade, S.A.C.; de Melo Filho, A.B. Nutritional and lipid profiles in marine fish species from Brazil. Food Chem. 2014, 160, 67–71. [Google Scholar] [CrossRef]
- Hosseini, H.; Mahmoudzadeh, M.; Rezaei, M.; Mahmoudzadeh, L.; Khaksar, R.; Khosroshahi, N.K.; Babakhani, A. Effect of different cooking methods on minerals, vitamins and nutritional quality indices of kutum roach (Rutilus frisii kutum). Food Chem. 2014, 148, 86–91. [Google Scholar] [CrossRef]
- Sreelakshmi, K.R.; Rehana, R.; Renjith, R.K.; Sarika, K.; Greeshma, S.S.; Minimol, V.A.; Ashokkumar, K.; Ninan, G. Quality and shelf life assessment of puffer fish (Lagocephalus guentheri) fillets during chilled storage. J. Aquat. Food Prod. Technol. 2019, 28, 25–37. [Google Scholar] [CrossRef]
- Tonial, I.B.; Oliveira, D.F.; Coelho, A.R.; Matsushita, M.; Coró, F.A.G.; De Souza, N.E.; Visentainer, J.V. Quantification of essential fatty acids and assessment of the nutritional quality indexes of lipids in tilapia alevins and juvenile tilapia fish (Oreochromis niloticus). J. Food Res. 2014, 3, 105–114. [Google Scholar] [CrossRef]
- Rombenso, A.N.; Trushenski, J.T.; Schwarz, M.H. Fish oil replacement in feeds for juvenile Florida Pompano: Composition of alternative lipid influences degree of tissue fatty acid profile distortion. Aquaculture 2016, 458, 177–186. [Google Scholar] [CrossRef]
- Hao, L.; Xiang, Y.; Degen, A.; Huang, Y.; Niu, J.; Sun, L.; Chai, S.; Zhou, J.; Ding, L.; Long, R. Adding heat-treated rapeseed to the diet of yak improves growth performance and tenderness and nutritional quality of the meat. Anim. Sci. J. 2019, 90, 1177–1184. [Google Scholar] [CrossRef] [PubMed]
- Castro, T.; Cabezas, A.; De la Fuente, J.; Isabel, B.; Manso, T.; Jimeno, V. Animal performance and meat characteristics in steers reared in intensive conditions fed with different vegetable oils. Animal 2016, 10, 520–530. [Google Scholar] [CrossRef] [Green Version]
- Majdoub-Mathlouthi, L.; Saïd, B.; Kraiem, K. Carcass traits and meat fatty acid composition of Barbarine lambs reared on rangelands or indoors on hay and concentrate. Animal 2015, 9, 2065–2071. [Google Scholar] [CrossRef] [Green Version]
- Realini, C.E.; Pérez-Juan, M.; Gou, P.; Díaz, I.; Sárraga, C.; Gatellier, P.; García-Regueiro, J.A. Characterization of Longissimus thoracis, Semitendinosus and Masseter muscles and relationships with technological quality in pigs. 2. Composition of muscles. Meat Sci. 2013, 94, 417–423. [Google Scholar] [CrossRef] [PubMed]
- Brogna, D.M.; Nasri, S.; Salem, H.B.; Mele, M.; Serra, A.; Bella, M.; Priolo, A.; Makkar, H.; Vasta, V. Effect of dietary saponins from Quillaja saponaria L. on fatty acid composition and cholesterol content in muscle Longissimus dorsi of lambs. Animal 2011, 5, 1124–1130. [Google Scholar] [CrossRef] [PubMed] [Green Version]
- Correa, L.B.; Zanetti, M.A.; Del Claro, G.R.; de Melo, M.P.; Rosa, A.F.; Netto, A.S. Effect of supplementation of two sources and two levels of copper on lipid metabolism in Nellore beef cattle. Meat Sci. 2012, 91, 466–471. [Google Scholar] [CrossRef] [PubMed]
- Fernández, M.; Ordóñez, J.A.; Cambero, I.; Santos, C.; Pin, C.; de la Hoz, L. Fatty acid compositions of selected varieties of Spanish dry ham related to their nutritional implications. Food Chem. 2007, 101, 107–112. [Google Scholar] [CrossRef]
- Winiarska-Mieczan, A.; Kwiecień, M.; Kwiatkowska, K.; Baranowska-Wójcik, E.; Szwajgier, D.; Zaricka, E. Fatty acid profile, antioxidative status and dietary value of the breast muscle of broiler chickens receiving glycine-Zn chelates. Anim. Prod. Sci. 2020, 60, 1095–1102. [Google Scholar] [CrossRef]
- Alvarenga, A.; Sousa, R.V.; Parreira, G.G.; Chiarini-Garcia, H.; Almeida, F. Fatty acid profile, oxidative stability of pork lipids and meat quality indicators are not affected by birth weight. Animal 2014, 8, 660–666. [Google Scholar] [CrossRef] [Green Version]
- Mir, N.A.; Tyagi, P.K.; Biswas, A.K.; Tyagi, P.K.; Mandal, A.B.; Kumar, F.; Sharma, D.; Biswas, A.; Verma, A.K. Inclusion of flaxseed, broken rice, and distillers dried grains with solubles (DDGS) in broiler chicken ration alters the fatty acid profile, oxidative stability, and other functional properties of meat. Eur. J. Lipid Sci. Technol. 2018, 120, 1700470. [Google Scholar] [CrossRef]
- Turner, T.; Hessle, A.; Lundström, K.; Pickova, J. Silage-concentrate finishing of bulls versus silage or fresh forage finishing of steers: Effects on fatty acids and meat tenderness. Acta Agric. Scand. 2011, 61, 103–113. [Google Scholar] [CrossRef]
- Lorenzo, J.M.; Crecente, S.; Franco, D.; Sarriés, M.V.; Gómez, M. The effect of livestock production system and concentrate level on carcass traits and meat quality of foals slaughtered at 18 months of age. Animal 2014, 8, 494–503. [Google Scholar] [CrossRef] [PubMed] [Green Version]
- Pires, M.A.; Rodrigues, I.; Barros, J.C.; Carnauba, G.; de Carvalho, F.A.; Trindade, M.A. Partial replacement of pork fat by Echium oil in reduced sodium bologna sausages: Technological, nutritional and stability implications. J. Sci. Food Agric. 2020, 100, 410–420. [Google Scholar] [CrossRef] [PubMed]
- Sinanoglou, V.J.; Koutsouli, P.; Fotakis, C.; Sotiropoulou, G.; Cavouras, D.; Bizelis, I. Assessment of lactation stage and breed effect on sheep milk fatty acid profile and lipid quality indices. Dairy Sci. Technol. 2015, 95, 509–531. [Google Scholar] [CrossRef] [Green Version]
- Mierliță, D. Effects of diets containing hemp seeds or hemp cake on fatty acid composition and oxidative stability of sheep milk. S. Afr. J. Anim. Sci. 2018, 48, 504–515. [Google Scholar] [CrossRef]
- Nantapo, C.; Muchenje, V.; Hugo, A. Atherogenicity index and health-related fatty acids in different stages of lactation from Friesian, Jersey and Friesian × Jersey cross cow milk under a pasture-based dairy system. Food Chem. 2014, 146, 127–133. [Google Scholar] [CrossRef]
- Bonanno, A.; Di Grigoli, A.; Mazza, F.; De Pasquale, C.; Giosuè, C.; Vitale, F.; Alabiso, M. Effects of ewes grazing sulla or ryegrass pasture for different daily durations on forage intake, milk production and fatty acid composition of cheese. Animal 2016, 10, 2074–2082. [Google Scholar] [CrossRef] [Green Version]
- Otero, P.; López-Martínez, M.I.; García-Risco, M.R. Application of pressurized liquid extraction (PLE) to obtain bioactive fatty acids and phenols from Laminaria ochroleuca collected in Galicia (NW Spain). J. Pharm. Biomed. 2019, 164, 86–92. [Google Scholar] [CrossRef]
- Dellatorre, F.G.; Avaro, M.G.; Commendatore, M.G.; Arce, L.; de Vivar, M.E.D. The macroalgal ensemble of Golfo Nuevo (Patagonia, Argentina) as a potential source of valuable fatty acids for nutritional and nutraceutical purposes. Algal Res. 2020, 45, 101726. [Google Scholar] [CrossRef]
- Rahmouni, N.; Pinto, D.C.; Santos, S.A.; Beghidja, N.; Silva, A.M. Lipophilic composition of Scabiosa stellata L.: An underexploited plant from Batna (Algeria). Chem. Pap. 2018, 72, 753–762. [Google Scholar] [CrossRef]
- Pandey, S.; Patel, M.K.; Mishra, A.; Jha, B. Physio-biochemical composition and untargeted metabolomics of cumin (Cuminum cyminum L.) make it promising functional food and help in mitigating salinity stress. PLoS ONE 2015, 10, e0144469. [Google Scholar] [CrossRef] [Green Version]
- Ratusz, K.; Symoniuk, E.; Wroniak, M.; Rudzińska, M. Bioactive Compounds, nutritional quality and oxidative stability of cold-pressed Camelina (Camelina sativa L.) oils. Appl. Sci. 2018, 8, 2606. [Google Scholar] [CrossRef] [Green Version]
- Wu, Z.X.; Hu, X.P.; Zhou, D.Y.; Tan, Z.F.; Liu, Y.X.; Xie, H.K.; Rakariyatham, K.; Shahidi, F. Seasonal variation of proximate composition and lipid nutritional value of two species of scallops (Chlamys farreri and Patinopecten yessoensis). Eur. J. Lipid Sci. Technol. 2019, 121, 1800493. [Google Scholar] [CrossRef]
- Akintola, S.L. Effects of smoking and sun-drying on proximate, fatty and amino acids compositions of southern pink shrimp (Penaeus notialis). J. Food Sci. Technol. 2015, 52, 2646–2656. [Google Scholar] [CrossRef] [PubMed] [Green Version]
- Łuczyńska, J.; Paszczyk, B. Health risk assessment of heavy metals and lipid quality indexes in freshwater fish from lakes of Warmia and Mazury region, Poland. Int. J. Environ. Res. Public Health 2019, 16, 3780. [Google Scholar] [CrossRef] [Green Version]
- Łuczyńska, J.; Paszczyk, B.; Nowosad, J.; Łuczyński, M.J. Mercury, fatty acids content and lipid quality indexes in muscles of freshwater and marine fish on the polish market. Risk assessment of fish consumption. Int. J. Environ. Res. Public Health 2017, 14, 1120. [Google Scholar] [CrossRef]
- González-Félix, M.L.; Maldonado-Othón, C.A.; Perez-Velazquez, M. Effect of dietary lipid level and replacement of fish oil by soybean oil in compound feeds for the shortfin corvina (Cynoscion parvipinnis). Aquaculture 2016, 454, 217–228. [Google Scholar] [CrossRef]
- Monteiro, M.; Matos, E.; Ramos, R.; Campos, I.; Valente, L.M. A blend of land animal fats can replace up to 75% fish oil without affecting growth and nutrient utilization of European seabass. Aquaculture 2018, 487, 22–31. [Google Scholar] [CrossRef]
- Benhissi, H.; García-Rodríguez, A.; de Heredia, I.B. The effects of rapeseed cake intake during the finishing period on the fatty-acid composition of the longissimus muscle of Limousin steers and changes in meat colour and lipid oxidation during storage. Anim. Prod. Sci. 2020, 60, 1103–1110. [Google Scholar] [CrossRef]
- Subhadra, B.; Lochmann, R.; Rawles, S.; Chen, R. Effect of dietary lipid source on the growth, tissue composition and hematological parameters of largemouth bass (Micropterus salmoides). Aquaculture 2006, 255, 210–222. [Google Scholar] [CrossRef]
- Bouzgarrou, O.; El Mzougui, N.; Sadok, S. Smoking and polyphenols’ addition to improve freshwater mullet (Mugil cephalus) fillets’ quality attributes during refrigerated storage. Int. J. Food Sci. Technol. 2016, 51, 268–277. [Google Scholar] [CrossRef]
- Dal Bosco, A.; Mugnai, C.; Roscini, V.; Castellini, C. Fillet fatty acid composition, estimated indexes of lipid metabolism and oxidative status of wild and farmed brown trout (Salmo trutta L.). Ital. J. Food Sci. 2013, 25, 83–89. [Google Scholar]
- Senso, L.; Suárez, M.D.; Ruiz-Cara, T.; García-Gallego, M. On the possible effects of harvesting season and chilled storage on the fatty acid profile of the fillet of farmed gilthead sea bream (Sparus aurata). Food Chem. 2007, 101, 298–307. [Google Scholar] [CrossRef]
- Ghafari, H.; Rezaeian, M.; Sharifi, S.D.; Khadem, A.A.; Afzalzadeh, A. Effects of dietary sesame oil on growth performance and fatty acid composition of muscle and tail fat in fattening Chaal lambs. Anim. Feed. Sci. Technol. 2016, 220, 216–225. [Google Scholar] [CrossRef]
- Peiretti, P.G.; Masoero, G.; Meineri, G. Effects of replacing palm oil with maize oil and Curcuma longa supplementation on the performance, carcass characteristics, meat quality and fatty acid profile of the perirenal fat and muscle of growing rabbits. Animal 2011, 5, 795–801. [Google Scholar] [CrossRef] [Green Version]
- Salvatori, G.; Pantaleo, L.; Di Cesare, C.; Maiorano, G.; Filetti, F.; Oriani, G. Fatty acid composition and cholesterol content of muscles as related to genotype and vitamin E treatment in crossbred lambs. Meat Sci. 2004, 67, 45–55. [Google Scholar] [CrossRef]
- Wójciak, K.M.; Stasiak, D.M.; Ferysiuk, K.; Solska, E. The influence of sonication on the oxidative stability and nutritional value of organic dry-fermented beef. Meat Sci. 2019, 148, 113–119. [Google Scholar] [CrossRef]
- Ivanova, S.; Angelov, L. Assessment of the content of dietary trans fatty acids and biologically active substances in cow’s milk and curd. Generations 2017, 4, 5. [Google Scholar]
- Bodas, R.; Manso, T.; Mantecon, A.R.; Juarez, M.; De la Fuente, M.A.; Gómez-Cortés, P. Comparison of the fatty acid profiles in cheeses from ewes fed diets supplemented with different plant oils. J. Agric. Food Chem. 2010, 58, 10493–10502. [Google Scholar] [CrossRef]
- Casamassima, D.; Nardoia, M.; Palazzo, M.; Vizzarri, F.; D Alessandro, A.G.; Corino, C. Effect of dietary extruded linseed, verbascoside and vitamin E supplements on yield and quality of milk in Lacaune ewes. J. Dairy Res. 2014, 81, 485–493. [Google Scholar] [CrossRef]
- Kholif, A.E.; Morsy, T.A.; Abd El Tawab, A.M.; Anele, U.Y.; Galyean, M.L. Effect of supplementing diets of Anglo-Nubian goats with soybean and flaxseed oils on lactational performance. J. Agric. Food Chem. 2016, 64, 6163–6170. [Google Scholar] [CrossRef] [PubMed]
- Kholif, A.E.; Gouda, G.A.; Olafadehan, O.A.; Abdo, M.M. Effects of replacement of Moringa oleifera for berseem clover in the diets of Nubian goats on feed utilisation, and milk yield, composition and fatty acid profile. Animal 2018, 12, 964–972. [Google Scholar] [CrossRef] [PubMed]
- Rutkowska, J.; Białek, M.; Bagnicka, E.; Jarczak, J.; Tambor, K.; Strzałkowska, N.; Jóźwik, A.; Krzyżewski, J.; Adamska, A.; Rutkowska, E. Effects of replacing extracted soybean meal with rapeseed cake in corn grass silage-based diet for dairy cows. J. Dairy Res. 2015, 82, 161–168. [Google Scholar] [CrossRef] [PubMed]
- Esposito, G.; Masucci, F.; Napolitano, F.; Braghieri, A.; Romano, R.; Manzo, N.; Di Francia, A. Fatty acid and sensory profiles of Caciocavallo cheese as affected by management system. J. Dairy Sci. 2014, 97, 1918–1928. [Google Scholar] [CrossRef] [PubMed] [Green Version]
- Yurchenko, S.; Sats, A.; Tatar, V.; Kaart, T.; Mootse, H.; Jõudu, I. Fatty acid profile of milk from Saanen and Swedish Landrace goats. Food Chem. 2018, 254, 326–332. [Google Scholar] [CrossRef] [PubMed]
- Ahmad, N.; Manzoor, M.F.; Shabbir, U.; Ahmed, S.; Ismail, T.; Saeed, F.; Nisa, M.; Anjum, F.M.; Hussain, S. Health lipid indices and physicochemical properties of dual fortified yogurt with extruded flaxseed omega fatty acids and fibers for hypercholesterolemic subjects. Food Sci. Nutr. 2019, 8, 273–280. [Google Scholar] [CrossRef] [Green Version]
- Salles, M.S.; D Abreu, L.F.; Júnior, L.C.R.; César, M.C.; Guimarães, J.G.; Segura, J.G.; Rodrigues, C.; Zanetti, M.A.; Pfrimer, K.; Netto, A.S. Inclusion of sunflower oil in the bovine diet improves milk nutritional profile. Nutrients 2019, 11, 481. [Google Scholar] [CrossRef] [Green Version]
- Vargas-Bello-Pérez, E.; Íñiguez-González, G.; Fehrmann-Cartes, K.; Toro-Mujica, P.; Garnsworthy, P.C. Influence of fish oil alone or in combination with hydrogenated palm oil on sensory characteristics and fatty acid composition of bovine cheese. Anim. Feed Sci. Technol. 2015, 205, 60–68. [Google Scholar] [CrossRef]
- Pittau, D.; Panzalis, R.; Spanu, C.; Scarano, C.; De Santis, E.P. Survey on the fatty acids profile of fluid goat milk. Ital. J. Food Saf. 2013, 2, 33. [Google Scholar] [CrossRef] [Green Version]
- Paiva, L.; Lima, E.; Neto, A.I.; Marcone, M.; Baptista, J. Health-promoting ingredients from four selected Azorean macroalgae. Food Res. Int. 2016, 89, 432–438. [Google Scholar] [CrossRef]
- Santos-Silva, J.; Bessa, R.; Santos-Silva, F. Effect of genotype, feeding system and slaughter weight on the quality of light lambs: II. Fatty acid composition of meat. Livest. Prod. Sci. 2002, 77, 187–194. [Google Scholar] [CrossRef]
- Bonanno, A.; Di Grigoli, A.; Vitale, F.; Alabiso, M.; Giosuè, C.; Mazza, F.; Todaro, M. Legume grain-based supplements in dairy sheep diet: Effects on milk yield, composition and fatty acid profile. Anim. Prod. Sci. 2016, 56, 130–140. [Google Scholar] [CrossRef] [Green Version]
- Bobe, G.; Zimmerman, S.; Hammond, E.G.; Freeman, A.E.; Porter, P.A.; Luhman, C.M.; Beitz, D.C. Butter composition and texture from cows with different milk fatty acid compositions fed fish oil or roasted soybeans. J. Dairy Sci. 2007, 90, 2596–2603. [Google Scholar] [CrossRef] [PubMed] [Green Version]
- Chen, S.; Bobe, G.; Zimmerman, S.; Hammond, E.G.; Luhman, C.M.; Boylston, T.D.; Freeman, A.E.; Beitz, D.C. Physical and sensory properties of dairy products from cows with various milk fatty acid compositions. J. Agric. Food Chem. 2004, 52, 3422–3428. [Google Scholar] [CrossRef] [PubMed]
- Giorgio, D.; Di Trana, A.; Di Napoli, M.A.; Sepe, L.; Cecchini, S.; Rossi, R.; Claps, S. Comparison of cheeses from goats fed 7 forages based on a new health index. J. Dairy Sci. 2019, 102, 6790–6801. [Google Scholar] [CrossRef]
- Colombo, M.L.; Rise, P.; Giavarini, F.; De Angelis, L.; Galli, C.; Bolis, C.L. Marine macroalgae as sources of polyunsaturated fatty acids. Plant Foods Hum. Nutr. 2006, 61, 64–69. [Google Scholar] [CrossRef]
- Poerschmann, J.; Spijkerman, E.; Langer, U. Fatty acid patterns in Chlamydomonas sp. as a marker for nutritional regimes and temperature under extremely acidic conditions. Microb. Ecol. 2004, 48, 78–89. [Google Scholar] [CrossRef]
- Kumari, P.; Kumar, M.; Gupta, V.; Reddy, C.; Jha, B. Tropical marine macroalgae as potential sources of nutritionally important PUFAs. Food Chem. 2010, 120, 749–757. [Google Scholar] [CrossRef]
- Ghassemi-Golezani, K.; Farhangi-Abriz, S. Changes in oil accumulation and fatty acid composition of soybean seeds under salt stress in response to salicylic acid and jasmonic acid. Russ. J. Plant Physiol. 2018, 65, 229–236. [Google Scholar] [CrossRef]
- Gomes-Laranjo, J.; Peixoto, F.; Sang, H.W.W.F.; Torres-Pereira, J. Study of the temperature effect in three chestnut (Castanea sativa Mill.) cultivars’ behaviour. J. Plant Physiol. 2006, 163, 945–955. [Google Scholar] [CrossRef]
- Segura, J.; Escudero, R.; de Ávila, M.R.; Cambero, M.I.; López-Bote, C.J. Effect of fatty acid composition and positional distribution within the triglyceride on selected physical properties of dry-cured ham subcutaneous fat. Meat Sci. 2015, 103, 90–95. [Google Scholar] [CrossRef] [PubMed]
- Rodríguez, M.; García-García, R.M.; Arias-Álvarez, M.; Millán, P.; Febrel, N.; Formoso-Rafferty, N.; López-Tello, J.; Lorenzo, P.L.; Rebollar, P.G. Improvements in the conception rate, milk composition and embryo quality of rabbit does after dietary enrichment with n-3 polyunsaturated fatty acids. Animal 2018, 12, 2080–2088. [Google Scholar] [CrossRef] [PubMed] [Green Version]
- Lin, H.Z.; Liu, Y.J.; He, J.G.; Zheng, W.H.; Tian, L.X. Alternative vegetable lipid sources in diets for grouper, Epinephelus coioides (Hamilton): Effects on growth, and muscle and liver fatty acid composition. Aquac. Res. 2007, 38, 1605–1611. [Google Scholar] [CrossRef]
- Larsson, T.; Koppang, E.O.; Espe, M.; Terjesen, B.F.; Krasnov, A.; Moreno, H.M.; Rørvik, K.; Thomassen, M.; Mørkøre, T. Fillet quality and health of Atlantic salmon (Salmo salar L.) fed a diet supplemented with glutamate. Aquaculture 2014, 426, 288–295. [Google Scholar] [CrossRef]
- Mozanzadeh, M.T.; Marammazi, J.G.; Yavari, V.; Agh, N.; Mohammadian, T.; Gisbert, E. Dietary n-3 LC-PUFA requirements in silvery-black porgy juveniles (Sparidentex hasta). Aquaculture 2015, 448, 151–161. [Google Scholar] [CrossRef]
- Xu, W.; Qian, Y.; Li, X.; Li, J.; Li, P.; Cai, D.; Liu, W. Effects of dietary biotin on growth performance and fatty acids metabolism in blunt snout bream, Megalobrama amblycephala fed with different lipid levels diets. Aquaculture 2017, 479, 790–797. [Google Scholar] [CrossRef]
- Abrami, G.; Natiello, F.; Bronzi, P.; McKenzie, D.; Bolis, L.; Agradi, E. A comparison of highly unsaturated fatty acid levels in wild and farmed eels (Anguilla anguilla). Comp. Biochem. Physiol. 1992, 101, 79–81. [Google Scholar] [CrossRef]
- Krajnović-Ozretic, M.; Najdek, M.; Ozretić, B. Fatty acids in liver and muscle of farmed and wild sea bass (Dicentrarchus labrax L.). Comp. Biochem. Physiol. 1994, 109, 611–617. [Google Scholar] [CrossRef]
- Sharma, R.; Ahlawat, S.; Aggarwal, R.; Dua, A.; Sharma, V.; Tantia, M.S. Comparative milk metabolite profiling for exploring superiority of indigenous Indian cow milk over exotic and crossbred counterparts. J. Food Sci. Technol. 2018, 55, 4232–4243. [Google Scholar] [CrossRef]
- Mishra, R.; Sharma, H.K. Effect of frying conditions on the physico-chemical properties of rice bran oil and its blended oil. J. Food Sci. Technol. 2014, 51, 1076–1084. [Google Scholar] [CrossRef] [Green Version]
- Dietschy, J.M. Dietary fatty acids and the regulation of plasma low density lipoprotein cholesterol concentrations. J. Nutr. 1998, 128, 444–448. [Google Scholar] [CrossRef] [PubMed] [Green Version]
- Ulbricht, T.; Southgate, D. Coronary heart disease: Seven dietary factors. Lancet 1991, 338, 985–992. [Google Scholar] [CrossRef]
- Omri, B.; Chalghoumi, R.; Izzo, L.; Ritieni, A.; Lucarini, M.; Durazzo, A.; Abdouli, H.; Santini, A. Effect of dietary incorporation of linseed alone or together with tomato-red pepper mix on laying hens’ egg yolk fatty acids profile and health lipid indexes. Nutrients 2019, 11, 813. [Google Scholar] [CrossRef] [PubMed] [Green Version]
- Logue, J.A.; De Vries, A.L.; Fodor, E.; Cossins, A.R. Lipid compositional correlates of temperature-adaptive interspecific differences in membrane physical structure. J. Exp. Biol. 2000, 203, 2105–2115. [Google Scholar] [PubMed]
- Burdge, G.C.; Jones, A.E.; Wootton, S.A. Eicosapentaenoic and docosapentaenoic acids are the principal products of α-linolenic acid metabolism in young men. Br. J. Nutr. 2002, 88, 355–363. [Google Scholar] [CrossRef] [PubMed] [Green Version]
- Johnson, E.J.; Schaefer, E.J. Potential role of dietary n-3 fatty acids in the prevention of dementia and macular degeneration. Am. J. Clin. Nutr. 2006, 83, 1494–1498. [Google Scholar] [CrossRef]
- Brenna, J.T.; Salem, N., Jr.; Sinclair, A.J.; Cunnane, S.C. α-Linolenic acid supplementation and conversion to n-3 long-chain polyunsaturated fatty acids in humans. Prostaglandins Leukot. Essent. Fat. Acids 2009, 80, 85–91. [Google Scholar] [CrossRef]
- Wayland, M.M. Final determination regarding partially hydrogenated oils. Fed. Regist. 2015, 80, 116. [Google Scholar]
- Food and Drug Administration, H. Final Determination Regarding Partially Hydrogenated Oils. Notification; declaratory order; extension of compliance date. Fed. Regist. 2018, 83, 23358–233589. [Google Scholar]
- Lock, A.L.; Corl, B.A.; Barbano, D.M.; Bauman, D.E.; Ip, C. The anticarcinogenic effect of trans-11 18: 1 is dependent on its conversion to cis-9, trans-11 CLA by Δ9-desaturase in rats. J. Nutr. 2004, 134, 2698–2704. [Google Scholar] [CrossRef] [Green Version]
- Corl, B.A.; Barbano, D.M.; Bauman, D.E.; Ip, C. cis-9, trans-11 CLA derived endogenously from trans-11 18: 1 reduces cancer risk in rats. J. Nutr. 2003, 133, 2893–2900. [Google Scholar] [CrossRef] [PubMed] [Green Version]
- Kritchevsky, D.; Tepper, S.A.; Wright, S.; Czarnecki, S.K.; Wilson, T.A.; Nicolosi, R.J. Conjugated linoleic acid isomer effects in atherosclerosis: Growth and regression of lesions. Lipids 2004, 39, 611. [Google Scholar] [CrossRef] [PubMed]
- European Food Safety Authority (EFSA). Scientific opinion on dietary reference values for fats, including saturated fatty acids, polyunsaturated fatty acids, monounsaturated fatty acids, trans fatty acids, and cholesterol. EFSA J. 2010, 8, 1461. [Google Scholar]
- European Food Safety Authority (EFSA). Opinion of the scientific panel on dietetic products, nutrition and allergies on a request from the commission related to the presence of trans fatty acids in foods and the effect on human health of the consumption of trans fatty acids. EFSA J. 2004, 81, 1–49. [Google Scholar]
- Raff, M.; Tholstrup, T.; Sejrsen, K.; Straarup, E.M.; Wiinberg, N. Diets rich in conjugated linoleic acid and vaccenic acid have no effect on blood pressure and isobaric arterial elasticity in healthy young men. J. Nutr. 2006, 136, 992–997. [Google Scholar] [CrossRef] [PubMed] [Green Version]

| No. | Index | Full Name | Calculation Formula | Application |
|---|---|---|---|---|
| 1 | PUFA/SFA | Polyunsaturated fatty acid/saturated fatty acid ratio | ΣPUFA/ΣSFA | Seaweeds [27,28,29], crops [30,31], plant oil [32,33], shellfish [34], fish [34,35,36,37,38,39,40], meat [41,42,43,44,45,46,47,48,49,50,51,52,53], and dairy products [54,55,56,57] |
| 2 | IA | Index of atherogenicity | [C12:0 + (4 × C14:0) + C16:0]/ΣUFA | Seaweeds [27,28,29,58,59], crops [30,31,60,61], plant oil [33,62], shellfish [63], shrimp [64], fish [36,37,38,39,65,66,67,68,69,70,71,72,73], meat [41,42,43,48,49,50,52,53,74,75,76,77], and dairy products [54,55,56,78,79,80,81,82,83,84,85,86,87,88,89] |
| 3 | IT | Index of thrombogenicity | (C14:0 + C16:0 + C18:0)/[(0.5 ×ΣMUFA) + (0.5 ×Σn-6 PUFA) + (3 ×Σn-3 PUFA) + (n-3/n-6)] | Seaweeds [27,28,29,58,59], crops [30,31,60,61], plant oil [62], shellfish [63], shrimp [64], fish [36,37,38,39,65,66,67,68,70,71,72,73], meat [43,48,50,52,53,75,77], and dairy products [54,55,78,80,86,87,88,89] |
| 4 | HH | Hypocholesterolemic /hypercholesterolemic ratio | (cis-C18:1 + ΣPUFA)/(C12:0 + C14:0 + C16:0) | Seaweeds [90], plant oil [62], shellfish [34], fish [34,36,37,38,39,72], meat [46,47,48,52,77,91], and dairy products [54,55,78,86,87] |
| 5 | HPI | Health-promoting index | ΣUFA/[C12:0+(4 × C14:0) + C16:0] | Milk [92,93,94] and cheese [57,94,95] |
| 6 | UI | Unsaturation index | 1 × (% monoenoics) + 2 × (% dienoics) + 3 × (% trienoics) + 4 × (% tetraenoics) + 5 × (% pentaenoics) + 6 × (% hexaenoics) | Seaweeds [27,28,29,59,96,97,98], crops [61,99,100], meat [44,101], and milk [102] |
| 7 | EPA + DHA | Sum of eicosapentaenoic acid and docosahexaenoic acid | C22:6 n-3 + C20:5 n-3 | Shellfish [34] and fish [34,36,37,40,68,103,104,105,106] |
| 8 | FLQ | Fish lipid quality/flesh Lipid quality | 100 × (C22:6 n-3 + C20:5 n-3)/ΣFA | Fish [65,66,73,107,108] |
| 9 | LA/ALA | Linoleic acid /α-linolenic acid ratio | C18:2 n-6/C18:3 n-3 | Lamb [43] and milk [55,109] |
| 10 | TFA | Trans fatty acid | ΣTFA | Seaweeds [90], plant oil [32,33,110], fish [35], lamb [45], and milk [78] |
| Materials | PUFA/SFA Value | Reference | |
|---|---|---|---|
| Red seaweed | Amphiora anceps | 0.42 | [27] |
| Kappaphycus alvarezii | 0.57 | [27] | |
| Gelidiella acerosa | 0.84 | [27] | |
| Gelidium micropterum | 0.30 | [27] | |
| Gracilaria changii | 6.96 ± 0.98 | [28] | |
| Gracilaria corticata | 2.12 | [27] | |
| Gracilaria dura | 1.89 | [27] | |
| Gracilaria debilis | 1.17 | [27] | |
| Gracilaria fergusonii | 0.58 | [27] | |
| Gracilaria salicornia | 0.14 | [27] | |
| Laurencia cruciata | 0.79 | [27] | |
| Sarconema filiforme | 1.71 | [27] | |
| Brown seaweed | Cystoseira indica | 1.17 | [27] |
| Padina tetrastromatica | 0.85 | [27] | |
| Sargassum fusiforme | 0.67 ± 0.31 | [29] | |
| Sargassum horneri | 0.56 ± 0.06 | [29] | |
| Sargassum pallidum | 0.20 ± 0.09 | [29] | |
| Sargassum swartzii | 1.15 | [27] | |
| Sargassum tenerrimum | 1.18 | [27] | |
| Sargassum thunbergii | 0.39 ± 0.05 | [29] | |
| Spatoglossum asperum | 1.38 | [27] | |
| Green seaweed | Caulerpa racemosa | 0.44 | [27] |
| Caulerpa scalpeliformis | 0.88 | [27] | |
| Caulerpa veravalnensis | 0.73 | [27] | |
| Ulva fasciata | 0.42 | [27] | |
| Ulva reticulata | 0.23 | [27] | |
| Ulva rigida | 0.33 | [27] | |
| Crops | Cyamopsis tetragonolobaL. | 1.71 | [31] |
| Lupinus albus | 1.53–1.97 | [30] | |
| Plant oil | Palm stearin | 0.13 | [32] |
| Sunflower oil | 4.75–4.94 | [32,33] | |
| Shellfish | Cancer edwardsi | 2.10 | [34] |
| Cervimunida johni | 1.81 | [34] | |
| Concholepas concholepas | 1.16 | [34] | |
| Heterocarpus reedi | 1.47 | [34] | |
| Loxechinus albus | 0.20 | [34] | |
| Mesodesma donacium | 1.34 | [34] | |
| Pleuroncodes monodon | 1.68 | [34] | |
| Pyura chilensis | 1.31 | [34] | |
| Venus antiqua | 1.06 | [34] | |
| Fish | Carassius gibelio | 1.62–1.70 | [35] |
| Cilus gilberti | 1.15 | [34] | |
| Genypterus chilensis | 1.60 | [34] | |
| Hemiramphus brasiliensis | 1.09 | [36] | |
| Hyporhamphus unifasciatus | 1.11 | [36] | |
| Kutum roach | 1.02–1.79 | [37] | |
| Lagocephalus guentheri | 1.3 | [38] | |
| Merluccius gayi | 1.52 | [34] | |
| Opisthonema oglinum | 1.47 | [36] | |
| Orechromis niloticus | 0.51–0.56 | [39] | |
| Pinguipes chilensis | 0.80 | [34] | |
| Scomber japonicus | 0.92 | [34] | |
| Scomberomorus cavalla | 1.18 | [36] | |
| Seriola lalandi | 0.92 | [34] | |
| Seriolella violacea | 0.95 | [34] | |
| Trachinotus carolinus | 0.5–1.1 | [40] | |
| Trachurus murphyi | 0.95 | [34] | |
| Meat | Chicken (Caribro Vishal) | 0.308–2.042 | [50] |
| Chicken (purchased from a hatchery and poultry farm) | 0.926–0.945 | [48] | |
| Pig (DanBred × PIC terminal line) | 0.46–0.48 | [49] | |
| Pig (Pietrain × (Duroc × Landrace)) | 0.85–1.29 | [44] | |
| Lamb (Barbarine lamb) | 0.13–0.37 | [43,45] | |
| Steer (Blonded Aquitaine steer) | 0.29–0.58 | [42] | |
| Calve (75% Charolais breeds) | 0.13–0.34 | [51] | |
| Cattle (Nellore cattle) | 0.11–0.20 | [46] | |
| Yak (Phoephagus grunniens) | 0.37–0.55 | [41] | |
| Foal (Galician Mountain × Hispano-Bretón) | 0.44–1.06 | [52] | |
| Spanish dry-cured ham | 0.19–0.30 | [47] | |
| Bologna sausages | 0.27–1.17 | [53] | |
| Dairy products | Cheese of Comisana ewe | 0.086–0.173 | [57] |
| Milk of Chios sheep | 0.06–0.08 | [54] | |
| Milk of Karagouniko sheep | 0.06–0.09 | [54] | |
| Milk of Turcana dairy ewe | 0.106–0.175 | [55] | |
| Milk of Friesian × Jersey cow | 0.02–0.04 | [56] | |
| Materials | IA Value | Reference | |
|---|---|---|---|
| Red seaweed | Amphiora anceps | 1.52 | [27] |
| Ceramium virgatum | 0.37 ± 0.027 | [59] | |
| Corallina officinalis | 0.48 ± 0.039 | [59] | |
| Gelidiella acerosa | 0.80 | [27] | |
| Gelidium micropterum | 1.61 | [27] | |
| Gracilaria changii | 0.03 ± 0.003 | [28] | |
| Gracilaria corticata | 0.38 | [27] | |
| Gracilaria debilis | 0.69 | [27] | |
| Gracilaria dura | 0.45 | [27] | |
| Gracilaria fergusonii | 1.34 | [27] | |
| Gracilaria salicornia | 2.87 | [27] | |
| Hymenena sp. | 3.58 | [59] | |
| Kappaphycus alvarezii | 0.77 | [27] | |
| Laurencia cruciata | 0.84 | [27] | |
| Lomentaria clavellosa | 3.06 ± 0.611 | [59] | |
| Polysiphonia sp. | 1.35 ± 0.206 | [59] | |
| Sarconema filiforme | 0.49 | [27] | |
| Brown seaweed | Cystoseira indica | 0.66 | [27] |
| Dictyota dichotoma | 0.29 ± 0.041 | [59] | |
| Laminaria ochroleuca | 1.18–1.57 | [58] | |
| Leathesia difformis | 0.48 ± 0.021 | [59] | |
| Myriogloea major | 0.21 ± 0.019 | [59] | |
| Padina tetrastromatica | 0.81 | [27] | |
| Sargassum fusiforme | 0.94 ± 0.28 | [29] | |
| Sargassum horneri | 1.06 ± 0.06 | [29] | |
| Sargassum pallidum | 1.99 ± 0.45 | [29] | |
| Sargassum swartzii | 0.61 | [27] | |
| Sargassum tenerrimum | 0.66 | [27] | |
| Sargassum thunbergii | 1.16 ± 0.10 | [29] | |
| Spatoglossum asperum | 0.53 | [27] | |
| Undaria pinnatifida | 0.17–0.35 | [59] | |
| Green seaweed | Caulerpa racemosa | 1.61 | [27] |
| Caulerpa scalpeliformis | 0.86 | [27] | |
| Caulerpa veravalnensis | 1.17 | [27] | |
| Cladophora falklandica | 0.50 ± 0.062 | [59] | |
| Codium decorticatum | 0.22 ± 0.002 | [59] | |
| Codium fragile | 0.29 ± 0.020 | [59] | |
| Codium vermilara | 0.40 ± 0.086 | [59] | |
| Ulva fasciata | 1.37 | [27] | |
| Ulva reticulata | 1.54 | [27] | |
| Ulva rigida | 1.22 | [27] | |
| Ulva sp.1 | 0.20 ± 0.055 | [59] | |
| Ulva sp.2 | 0.08 ± 0.004 | [59] | |
| Crops | Cumin (Cuminum cyminum) | 0.46–0.53 | [61] a |
| Guar seed (Cyamopsis tetragonoloba) | 0.22 | [31] | |
| White lupine (Lupinus albus) | 0.084–0.107 | [30] | |
| Scabiosa stellata | 0.55 | [60] | |
| Plant oil | Camelina oil (Camelina sativa) | 0.05–0.07 | [62] |
| Sunflower oil | 0.09–0.11 | [33] | |
| Shellfish | Chlamys farreri | 0.31–0.37 | [63] |
| Patinopecten yessoensis | 0.29–0.35 | [63] | |
| Shrimp | Penaeus notialis | 0.71–0.82 | [64] |
| Fish | Abramis brama | 0.37–0.42 | [65,66] |
| Clupea harengus | 0.70 ± 0.10 | [66] | |
| Cynoscion parvipinnis | 1.07–1.16 | [67] | |
| Cyprinus carpio | 0.36 ± 0.03 | [66] | |
| Dicentrarchus labrax | 0.40–0.42 | [68] | |
| Esox lucius | 0.43 | [65] | |
| Hemiramphus brasiliensis | 0.26 | [36] | |
| Hyporhamphus unifasciatus | 0.26 | [36] | |
| Kutum roach | 0.58–1.41 | [37] | |
| Lagocephalus guentheri | 0.43 | [38] | |
| Leuciscus idus | 0.36 ± 0.02 | [66] | |
| Limousin steers | 0.70–1.14 | [69] | |
| Micropterus salmoides | 0.29–0.68 | [70] | |
| Mugil cephalus | 0.91–1.22 | [71] | |
| Oncorhynchus mykiss | 0.33 ± 0.01 | [66] | |
| Opisthonema oglinum | 0.60 | [36] | |
| Oreochromis niloticus | 0.55–0.60 | [39] | |
| Perca fluviatilis | 0.37–0.44 | [65,66] | |
| Platichthys flesus | 0.41 ± 0.03 | [66] | |
| Rutilus rutilus | 0.40 | [65] | |
| Salmo trutta | 0.64–0.72 | [72] | |
| Scomberomorus cavalla | 0.48 | [36] | |
| Sparus aurata | 0.21–0.29 | [73] | |
| Meat | Chicken (Caribro Vishal) | 0.165–0.634 | [50] |
| Chicken (purchased from a hatchery and poultry farm) | 0.372–0.390 | [48] | |
| Rabbit (Curcuma longa) | 0.55–0.69 | [75] | |
| Pig (DanBred × PIC terminal line) | 0.27–0.31 | [49] | |
| Lamb (Barbarine lamb) | 0.49–0.52 | [43] | |
| Lamb (Gentile di Puglia × Sopravissana) | 0.99–1.32 | [76] | |
| Lamb (Ile de France × Pagliarola) | 0.71–1.06 | [76] | |
| Lamb (Iranian fat-tailed breed) | 0.53–0.77 | [74] | |
| Heifer (Limousin heifer) | 0.50–0.57 | [77] | |
| Steer (Blonded Aquitaine steer) | 0.51–0.63 | [42] | |
| Yak (Phoephagus grunniens) | 0.37–0.43 | [41] | |
| Foal (Galician Mountain × Hispano-Bretón) | 0.59–0.62 | [52] | |
| Bologna sausages | 0.33–0.60 | [53] | |
| Dairy products | Cheese of Churra ewe | 1.61–3.61 | [79] |
| Cheese of Holstein cow | 2.38–3.72 | [88] | |
| Cheese of Italian Friesian and Italian Red Pied cattle (Caciocavallo cheese) | 2.43–2.94 | [84] | |
| Curd of cow (Middle Rhodopes) | 1.94–5.02 | [78] | |
| Milk of Anglo-Nubian goat | 1.89–2.48 | [81] | |
| Milk of goat (market of Sardinia) | 2.27–2.91 | [89] | |
| Milk of Nubian goat | 1.91–2.32 | [82] | |
| Milk of Saanen goat | 2.77 ± 0.08 | [85] | |
| Milk of Swedish Landrace goat | 2.47 ± 0.07 | [85] | |
| Milk of Chios sheep | 2.00–2.72 | [54] | |
| Milk of Karagouniko sheep | 1.76–2.57 | [54] | |
| Milk of Churra ewe | 1.71–3.39 | [79] | |
| Milk of Lacaune ewe | 1.94–2.53 | [80] | |
| Milk of Turcana dairy ewe | 1.42–1.95 | [55] | |
| Milk of cow (Middle Rhodopes) | 1.88–4.18 | [78] | |
| Milk of Friesian × Jersey cow | 4.08–5.13 | [56] | |
| Milk of Holstein cow | 1.83–2.63 | [88] | |
| Milk of Holstein–Friesian cow | 1.60–3.79 | [83,109] a | |
| Milk of indigenous Indian cow | 1.37 | [109] a | |
| Milk of Jersey cow | 2.4823–3.4360 | [87] | |
| Milk of Sahiwal cow | 2.01 | [109] a | |
| Milk of Sahiwal × Holstein–Friesian cow | 3.14 | [109] a | |
| Milk of Italian Friesian and Italian Red Pied cattle | 2.49–2.99 | [84] | |
| Yogurt of cow milk (market of Faisalabad) | 1.48–2.74 | [86] | |
| Yogurt of sheep milk (market of Faisalabad) | 1.42–2.31 | [86] | |
| Materials | IT Value | Reference | |
|---|---|---|---|
| Red seaweed | Amphiora anceps | 2.07 | [27] |
| Ceramium virgatum | 0.12 ± 0.005 | [59] | |
| Corallina officinalis | 0.28 ± 0.045 | [59] | |
| Gelidiella acerosa | 0.52 | [27] | |
| Gelidium micropterum | 1.83 | [27] | |
| Gracilaria changii | 0.04 ± 0.01 | [28] | |
| Gracilaria corticata | 0.63 | [27] | |
| Gracilaria debilis | 1.25 | [27] | |
| Gracilaria dura | 0.88 | [27] | |
| Gracilaria fergusonii | 2.66 | [27] | |
| Gracilaria salicornia | 5.75 | [27] | |
| Hymenena sp | 2.66 | [59] | |
| Kappaphycus alvarezii | 1.17 | [27] | |
| Laurencia cruciata | 0.71 | [27] | |
| Lomentaria clavellosa | 2.94 ± 1.000 | [59] | |
| Polysiphonia sp | 0.61 ± 0.114 | [59] | |
| Sarconema filiforme | 0.55 | [27] | |
| Brown seaweed | Cystoseira indica | 0.87 | [27] |
| Dictyota dichotoma | 0.09 ± 0.013 | [59] | |
| Laminaria ochroleuca | 1.06–1.89 | [58] | |
| Leathesia difformis | 0.14 ± 0.006 | [59] | |
| Myriogloea major | 0.09 ± 0.006 | [59] | |
| Padina tetrastromatica | 1.20 | [27] | |
| Sargassum fusiforme | 0.46 ± 0.21 | [29] | |
| Sargassum horneri | 0.65 ± 0.07 | [29] | |
| Sargassum pallidum | 1.60 ± 0.56 | [29] | |
| Sargassum swartzii | 0.75 | [27] | |
| Sargassum tenerrimum | 0.90 | [27] | |
| Sargassum thunbergii | 0.76 ± 0.14 | [29] | |
| Spatoglossum asperum | 0.50 | [27] | |
| Undaria pinnatifida | 0.08–0.26 | [59] | |
| Green seaweed | Caulerpa racemosa | 1.50 | [27] |
| Caulerpa scalpeliformis | 1.38 | [27] | |
| Caulerpa veravalnensis | 1.28 | [27] | |
| Cladophora falklandica | 0.16 ± 0.048 | [59] | |
| Codium decorticatum | 0.12 ± 0.002 | [59] | |
| Codium fragile | 0.14 ± 0.013 | [59] | |
| Codium vermilara | 0.30 ± 0.080 | [59] | |
| Ulva fasciata | 1.56 | [27] | |
| Ulva reticulata | 2.90 | [27] | |
| Ulva rigida | 1.78 | [27] | |
| Ulva sp.1 | 0.09 ± 0.028 | [59] | |
| Ulva sp.2 | 0.04 ± 0.002 | [59] | |
| Crops | Cumin (Cuminum cyminum) | 0.46–0.56 | [61] a |
| Guar seed (Cyamopsis tetragonoloba) | 0.53 | [31] | |
| Scabiosa stellata | 0.23 | [60] | |
| White lupine (Lupinus albus) | 0.139–0.180 | [30] | |
| Plant oil | Camelina oil (Camelina sativa) | 0.1 | [62] |
| Shellfish | Chlamys farreri | 0.13–0.17 | [63] |
| Patinopecten yessoensis | 0.09–0.15 | [63] | |
| Shrimp | Penaeus notialis | 0.21–0.30 | [64] |
| Fish | Abramis brama | 0.23–0.24 | [65,66] |
| Clupea harengus | 0.26 ± 0.04 | [66] | |
| Cynoscion parvipinnis | 0.18–0.29 | [67] | |
| Cyprinus carpio | 0.31 ± 0.03 | [66] | |
| Dicentrarchus labrax | 0.191–0.63 | [68] | |
| Esox lucius | 0.18 | [65] | |
| Hemiramphus brasiliensis | 0.21 | [36] | |
| Hyporhamphus unifasciatus | 0.44 | [36] | |
| Kutum roach | 0.16–0.24 | [37] | |
| Lagocephalus guentheri | 0.29 | [38] | |
| Leuciscus idus | 0.22 ± 0.05 | [66] | |
| Micropterus salmoides | 0.31–0.53 | [70] | |
| Mugil cephalus | 0.43–0.58 | [71] | |
| Oncorhynchus mykiss | 0.16 ± 0.01 | [66] | |
| Opisthonema oglinum | 0.20 | [36] | |
| Oreochromis niloticus | 0.82–0.87 | [39] | |
| Perca fluviatilis | 0.20–0.21 | [65,66] | |
| Platichthys flesus | 0.22 ± 0.02 | [66] | |
| Rutilus rutilus | 0.21 | [65] | |
| Salmo trutta | 0.21–0.30 | [72] | |
| Scomberomorus cavalla | 0.24 | [36] | |
| Sparus aurata | 0.14–0.19 | [73] | |
| Meat | Chicken (purchased from a hatchery and poultry farm) | 0.755–0.784 | [48] |
| Chicken (Caribro Vishal) | 0.288–1.694 | [50] | |
| Rabbit (Curcuma longa) | 0.83–1.12 | [75] | |
| Lamb (Barbarine lamb) | 1.1–1.15 | [43] | |
| Heifer (Limousin heifer) | 1.10–1.34 | [77] | |
| Foal (Galician Mountain × Hispano-Bretón) | 0.44–0.80 | [52] | |
| Bologna sausages | 0.39–1.55 | [53] | |
| Dairy products | Cheese of Holstein cow | 3.22–5.04 | [88] |
| Curd of cow (Middle Rhodopes) | 2.02–4.35 | [78] | |
| Milk of goat (market of Sardinia) | 2.70–3.20 | [89] | |
| Milk of Chios sheep | 1.24–1.46 | [54] | |
| Milk of Karagouniko sheep | 1.00–1.47 | [54] | |
| Milk of Lacaune ewe | 2.20–2.72 | [80] | |
| Milk of Turcana dairy ewe | 1.22–1.76 | [55] | |
| Milk of Holstein cow | 2.23–2.90 | [88] | |
| Milk of Jersey cow | 3.9813–4.6558 | [87] | |
| Milk of cow (Middle Rhodopes) | 2.05–4.03 | [78] | |
| Yogurt of cow milk (market of Faisalabad) | 0.39–1.84 | [86] | |
| Yogurt of sheep milk (market of Faisalabad) | 0.65–1.68 | [86] | |
| Materials | HH Value | Reference | |
|---|---|---|---|
| Red seaweed | Gelidium microdon | 4.22 | [90] |
| Pterocladiella capillacea | 2.09 | [90] | |
| Brown seaweed | Ulva compressa | 1.90 | [90] |
| Ulva rigida | 1.26 | [90] | |
| Plant oil | Camelina oil (Camelina sativa) | 11.2–15.0 | [62] |
| Shellfish | Cancer edwardsi | 4.75 | [34] |
| Cervimunida johni | 3.48 | [34] | |
| Concholepas | 2.52 | [34] | |
| Heterocarpus reedi | 2.91 | [34] | |
| Loxechinus albus | 0.21 | [34] | |
| Mesodesma donacium | 2.15 | [34] | |
| Pleuroncodes monodon | 3.68 | [34] | |
| Pyura chilensis | 1.73 | [34] | |
| Venus antiqua | 1.90 | [34] | |
| Fish | Cilus gilberti | 1.86 | [34] |
| Genypterus chilensis | 2.93 | [34] | |
| Hemiramphus brasiliensis | 2.46 | [36] | |
| Hyporhamphus unifasciatus | 2.43 | [36] | |
| Kutum roach | 2.04–4.83 | [37] | |
| Lagocephalus guentheri | 2.68 | [38] | |
| Merluccius gayi | 2.23 | [34] | |
| Opisthonema oglinum | 0.87 | [36] | |
| Oreochromis niloticus | 1.56–1.63 | [39] | |
| Pinguipes chilensis | 1.54 | [34] | |
| Salmo trutta | 1.88–2.16 | [72] | |
| Scomber japonicus | 2.00 | [34] | |
| Scomberomorus cavalla | 1.56 | [36] | |
| Seriola lalandi | 2.14 | [34] | |
| Seriolella violacea | 2.10 | [34] | |
| Trachurus murphyi | 1.73 | [34] | |
| Meat | Chicken (purchased from a hatchery and poultry farm) | 2.658–2.786 | [48] |
| Lamb (Merino Branco) | 1.92 | [91] | |
| Lamb (Ile de France × Merino Branco) | 2.01 | [91] | |
| Cattle (Nellore cattle) | 1.56–2.08 | [46] | |
| Heifer (Limousin heifer) | 1.27–1.87 | [77] | |
| Foal (Galician Mountain × Hispano-Bretón) | 1.76–1.98 | [52] | |
| Spanish dry-cured ham | 2.0–2.67 | [47] | |
| Dairy products | Curd of cow (Middle Rhodopes) | 0.32–0.74 | [78] |
| Milk of Chios sheep | 0.50–0.61 | [54] | |
| Milk of Karagouniko sheep | 0.50–0.68 | [54] | |
| Milk of Turcana dairy ewe | 0.88–1.29 | [55] | |
| Milk of cow (Middle Rhodopes) | 0.34–0.75 | [78] | |
| Milk of Jersey cow | 0.4067–0.5732 | [87] | |
| Yogurt of cow milk (market of Faisalabad) | 0.54–1.12 | [86] | |
| Yogurt of sheep milk (market of Faisalabad) | 0.82–1.29 | [86] | |
| Materials | HPI Value | Reference | |
|---|---|---|---|
| Dairy products | Butter of Holstein cow | 0.37–0.66 | [93,94] |
| Cheese of Red Syrian goat | 0.37–0.68 | [95] | |
| Cheese of Comisana ewe | 0.42–0.50 | [57] | |
| Cheese (Cheddar cheese) of Holstein cow | 0.29–0.46 | [94] | |
| Cheese (Provolone Cheese) of Holstein cow | 0.38–0.63 | [94] | |
| Cream of Holstein cow | 0.31–0.62 | [94] | |
| Milk of ewe (Comisana breed) | 0.16–0.28 | [92] | |
| Yogurt of Holstein cow | 0.30–0.62 | [94] | |
| Materials | UI Value | Reference | |
|---|---|---|---|
| Red seaweed | Ahnfeltia plicata | 250 ± 1.01 | [98] |
| Amphiora anceps | 98.01, 97.5 | [27,98] | |
| Callophylis sp | 117 | [96] | |
| Ceramium virgatum | 284 ± 7 | [59] | |
| Corallina officinalis | 202 ± 19 | [59] | |
| Gelidiella acerosa | 191.02 | [27] | |
| Gelidium micropterum | 98.80 | [27] | |
| Gloiopeltis furcata | 54 | [96] | |
| Gracilaria changii | 368.68 ± 20.01 | [28] | |
| Gracilaria corticata | 257.07 | [27] | |
| Gracilaria debilis | 204.85, 205 ± 3.07 | [27,98] | |
| Gracilaria dura | 249.10, 249 ± 3.66 | [27,98] | |
| Gracilaria fergusonii | 134.75, 135 ± 1.14 | [27,98] | |
| Gracilaria salicornia | 50.631 | [27] | |
| Grateloupia indica | 286 ± 5.91 | [98] | |
| Grateloupia wattii | 181 ± 3.77 | [98] | |
| Hymenena sp | 45 | [59] | |
| Hypnea esperi | 93.6 ± 4.63 | [98] | |
| Hypnea musciformis | 91.3 ± 4.11 | [98] | |
| Kappaphycus alvarezii | 140.94, 141 ± 4.05 | [27,98] | |
| Laurencia cruciata | 172.95, 173 ± 5.64 | [27,98] | |
| Laurencia papillosa | 213 ± 4.89 | [98] | |
| Lomentaria clavellosa | 76 ± 12 | [59] | |
| Polysiphonia sp. | 143 ± 15 | [59] | |
| Sarconema filiforme | 245.54, 246 ± 1.27 | [27,98] | |
| Soliera robusta | 77 | [96] | |
| Brown seaweed | Cystoseira indica | 195.44, 195 ± 4.21 | [27,98] |
| Dictyota dichotoma | 321 ± 10 | [59] | |
| Leathesia difformis | 272 ± 6 | [59] | |
| Myriogloea major | 266 ± 7 | [59] | |
| Padina tetrastromatica | 154.49, 155 ± 5.50 | [27,98] | |
| Sargassum fusiforme | 125.65 ± 32.25 | [29] | |
| Sargassum horneri | 116.16 ± 5.77 | [29] | |
| Sargassum pallidum | 62.27 ± 15.05 | [29] | |
| Sargassum swartzii | 182.02 | [27] | |
| Sargassum tenerrimum | 187.05, 187 ± 4.47 | [27,98] | |
| Sargassum thunbergii | 89.87 ± 7.44 | [29] | |
| Spatoglossum asperum | 202.83, 203 ± 3.06 | [27,98] | |
| Stoechospermum marginatum | 176 ± 3.56 | [98] | |
| Undaria pinnatifida | 260-318 | [59] | |
| Green seaweed | Caulerpa racemosa | 106.70, 107 ± 5.67 | [27,98] |
| Caulerpa scalpeliformis | 121.67 | [27] | |
| Caulerpa veravalnensis | 141.87, 142 ± 2.96 | [27,98] | |
| Cladophora falklandica | 215 ± 7 | [59] | |
| Codium decorticatum | 219 ± 2 | [59] | |
| Codium fragile | 179 ± 11 | [59] | |
| Codium vermilara | 135 ± 16 | [59] | |
| Ulva fasciata | 102.92, 103 ± 2.83 | [27,98] | |
| Ulva lactuca | 87.5 ± 5.76 | [98] | |
| Ulva linza | 124 ± 4.23 | [98] | |
| Ulva reticulata | 70.87, 70.9 ± 5.33 | [27,98] | |
| Ulva rigida | 93.96, 93.8 ± 5.31 | [27,98] | |
| Ulva tubulosa | 99.6 ± 3.23 | [98] | |
| Ulva sp. | 76.3 ± 5.40 | [98] | |
| Ulva sp.1 | 209 ± 20 | [59] | |
| Ulva sp.2 | 288 ± 10 | [59] | |
| Crops | Cumin (Cuminum cyminum) | 125.21–133.10 | [61] |
| Soybean (Glycine max) | 148–155 | [99] | |
| Meat | Pig (Pietrain × (Duroc × Landrace)) | 111–124 | [44] |
| Dry-cured ham (Landrace × Large White (25% Pietrain) pig) | 73 ± 6 | [101] | |
| Dairy products | Milk of (New Zealand × California) white rabbit | 86–120 | [102] |
| Materials | EPA + DHA Value | Reference | |
|---|---|---|---|
| Shellfish | Cancer edwardsi | 205.62 ± 6.19 mg/100 g | [34] |
| Cervimunida johni | 162.90 ± 2.83 mg/100 g | [34] | |
| Concholepas concholepas | 63.61 ± 0.42 mg/100 g | [34] | |
| Heterocarpus reedi | 186.98 ± 3.88 mg/100 g | [34] | |
| Loxechinus albus | 208.55 ± 10.28 mg/100 g | [34] | |
| Mesodesma donacium | 216.96 ± 9.76 mg/100 g | [34] | |
| Pleuroncodes monodon | 189.83 ± 3.74 mg/100 g | [34] | |
| Pyura chilensis | 522.68 ± 28.02 mg/100 g | [34] | |
| Venus antiqua | 214.34 ± 7.52 mg/100 g | [34] | |
| Fish | Cilus gilberti | 294.57 ± 8.76 mg/100 g | [34] |
| Dicentrarchus labrax | 270–480 mg/100 g | [68] | |
| Genypterus chilensis | 115.15 ± 6.16 mg/100 g | [34] | |
| Kutum roach | 96–250 mg/100 g | [61] a | |
| Merluccius gayi gayi | 309.38 ± 6.81 mg/100 g | [34] | |
| Pinguipes chilensis | 507.60 ± 25.32 mg/100 g | [34] | |
| Scomber japonicus | 1370.67 ± 55.79 mg/100 g | [34] | |
| Seriola lalandi | 915.76 ± 19.68 mg/100 g | [34] | |
| Seriolella violacea | 304.04 ± 14.15 mg/100 g | [34] | |
| Trachinotus carolinus | 621–941 mg/100 g | [40] | |
| Trachurus murphyi | 786.90 ± 11.44 mg/100 g | [34] | |
| Epinephelus coioides | 19.9–25.4% | [103] | |
| Hemiramphus brasiliensis | 16.71% ± 0.07% | [36] | |
| Hyporhamphus unifasciatus | 15.53% ± 0.07% | [36] | |
| Megalobrama amblycephala | 5.52–7.36% | [106] | |
| Opisthonema oglinum | 40.86% ± 0.07% | [36] | |
| Salmo salar | 11.80–11.81% | [104] | |
| Scomberomorus cavalla | 35.06% ± 0.07% | [36] | |
| Sparidentex hasta | 45.8–230.4 mg/g lipid | [105] | |
| Materials | FLQ Value | Reference | |
|---|---|---|---|
| Fish | Abramis brama | 24.46–30.14 | [65,66] |
| Clupea harengus | 13.01 ± 0.77 | [66] | |
| Cyprinus carpio | 13.99 ± 2.15 | [66] | |
| Esox Lucius | 36.37 | [65] | |
| Leuciscus idus | 24.32 ± 2.47 | [66] | |
| Oncorhynchus mykiss | 17.97 ± 2.46 | [66] | |
| Perca fluviatilis | 30.14–33.22 | [65,66] | |
| Platichthys flesus | 20.25 ± 2.30 | [66] | |
| Rutilus | 28.41 | [65] | |
| Sparus aurata | 19.35–31.27 | [73] | |
| Materials | LA/ALA Value | Reference | |
|---|---|---|---|
| Meat | Lamb (Barbarine lamb) | 6.78–10.05 | [43] |
| Dairy products | Milk of Turcana dairy ewe | 0.98–1.36 | [55] |
| Milk of Sahiwal cow | 3.313 ± 0.262 | [109] | |
| Milk of Holstein–Friesian cow | 3.446 ± 0.196 | [109] | |
| Milk of Sahiwal × Holstein–Friesian cow | 3.065 ± 0.093 | [109] | |
| Milk of indigenous Indian cow | 2.464 ± 0.147 | [109] | |
| Materials | TFA Value | Reference | |
|---|---|---|---|
| Red seaweed | Gelidium microdon | 1.34% ± 0.20% | [90] |
| Pterocladiella capillacea | 1.47% ± 0.09% | [90] | |
| Brown seaweed | Ulva compressa | 7.35% ± 0.63% | [90] |
| Ulva rigida | 4.89% ± 0.26% | [90] | |
| Plant oil | Palm stearin | 0.6% | [32] |
| Rice bran oil | 1.27–2.91% | [110] | |
| Sunflower oil | 0.2%, 0.84–1.71% | [32,33] | |
| Fish | Carassius gibelio | 1.06% ± 0.06%, 10.58–37.15 mg/100 g | [35] |
| Meat | Lamb (Barbarine lamb) | 2.23–2.83% | [45] |
| Dairy products | Curd of cow (Middle Rhodopes) | 340–1090 mg/100 g | [78] |
| Milk of cow (Middle Rhodopes) | 110–210 mg/100 g | [78] | |
© 2020 by the authors. Licensee MDPI, Basel, Switzerland. This article is an open access article distributed under the terms and conditions of the Creative Commons Attribution (CC BY) license (http://creativecommons.org/licenses/by/4.0/).
Share and Cite
Chen, J.; Liu, H. Nutritional Indices for Assessing Fatty Acids: A Mini-Review. Int. J. Mol. Sci. 2020, 21, 5695. https://doi.org/10.3390/ijms21165695
Chen J, Liu H. Nutritional Indices for Assessing Fatty Acids: A Mini-Review. International Journal of Molecular Sciences. 2020; 21(16):5695. https://doi.org/10.3390/ijms21165695
Chicago/Turabian StyleChen, Jiapeng, and Hongbing Liu. 2020. "Nutritional Indices for Assessing Fatty Acids: A Mini-Review" International Journal of Molecular Sciences 21, no. 16: 5695. https://doi.org/10.3390/ijms21165695