
Theoretical–Computational Modeling of CD Spectra of Aqueous Monosaccharides by Means of Molecular Dynamics Simulations and Perturbed Matrix Method

Abstract
:1. Introduction
- First of all, it is essential to use accurate electronic structure theory calculations for determining the objects of interest, which, in this case, are the excitation energies and the associated electric and magnetic transition moments. Therefore, time dependent density functional theory [10] using exchange-correlated functionals, such as B3LYP [11], or range-separated functionals, such as CAM-B3LYP [12], or other related approaches [13,14,15] revealed a suitable and computationally affordable tool, though alternative and possibly more accurate strategies have emerged [16,17].
- Secondly, it is well known that the morphological features of the ECD signal is extremely sensitive to chromophore conformational transitions [1] and possibly to quantum vibronic coupling [18,19]. For this reason, particularly when non-rigid species are concerned, modeling of this kind of spectroscopy requires an accurate and exhaustive conformational analysis of the chromophore, prior to the electronic structure calculations (see previous item) by means of molecular dynamics (MD) simulations.
- Finally, and related to the previous item, the presence of the explicit solvent in the model is of primary importance because of its influence on the conformational repertoire of the chromophore and, most importantly, because of its possible direct perturbing effects on the chromophore’s electronic properties underlying the ECD signal [1,3,20].
2. Results
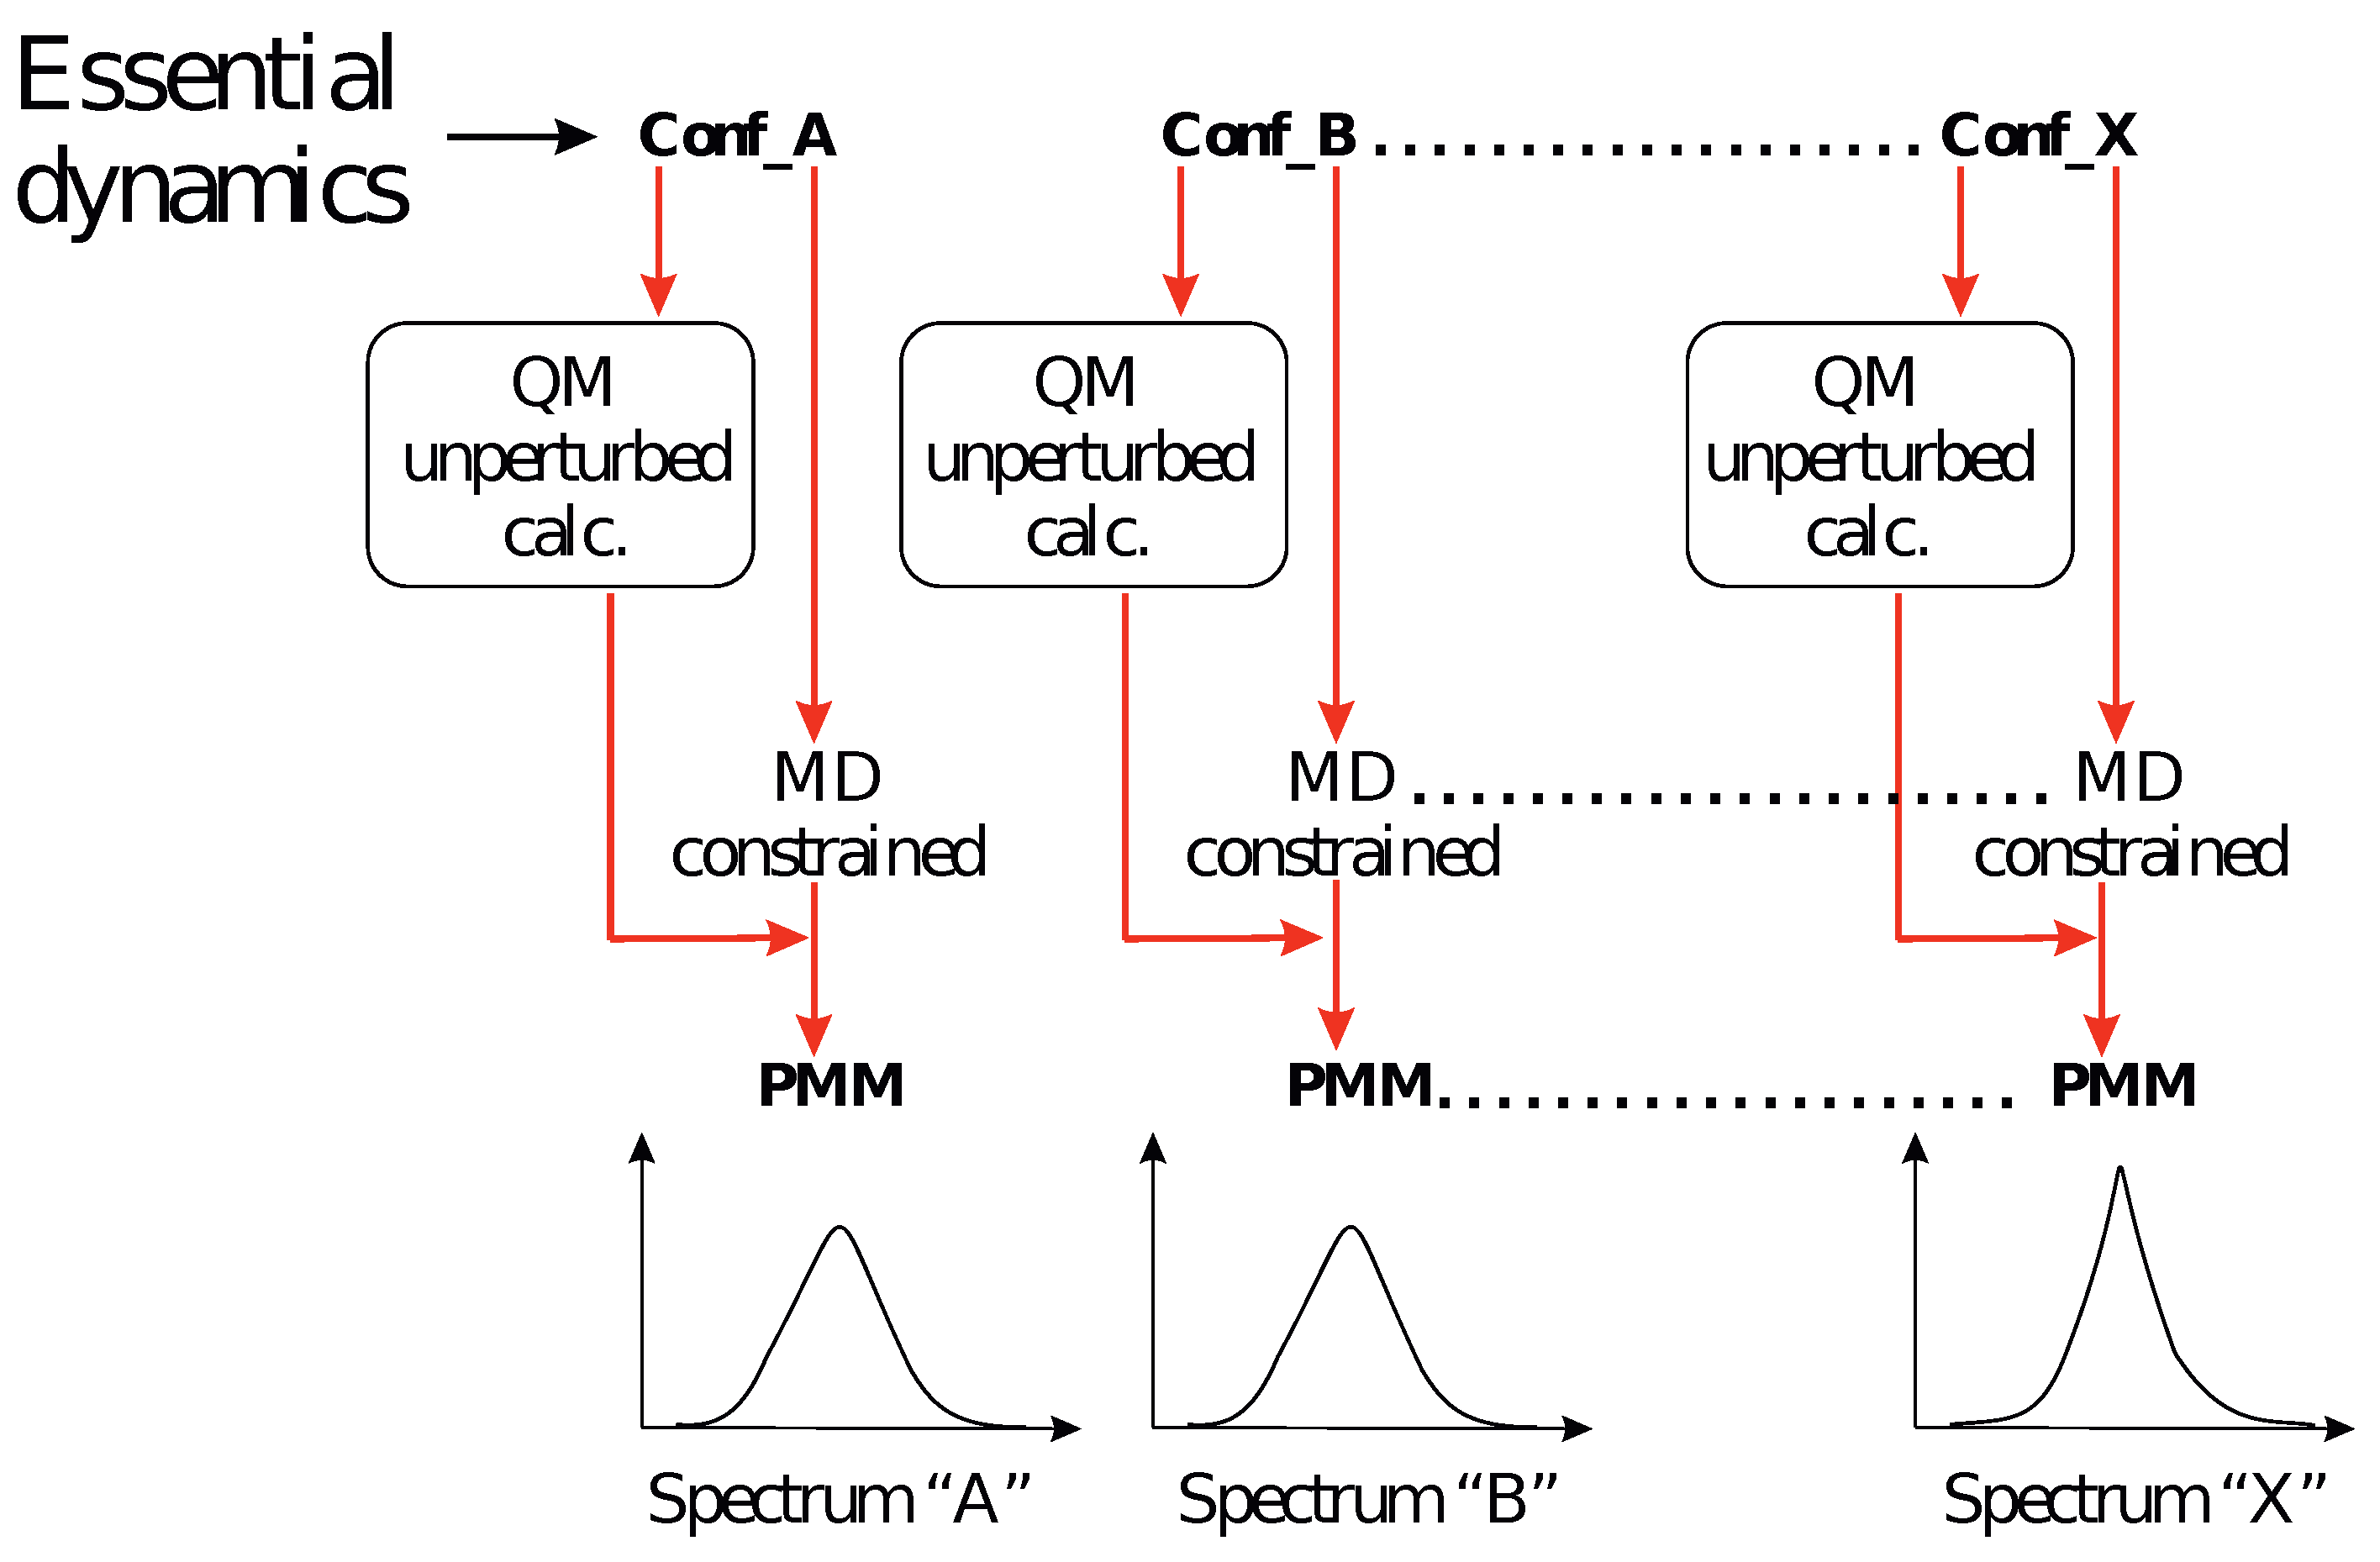
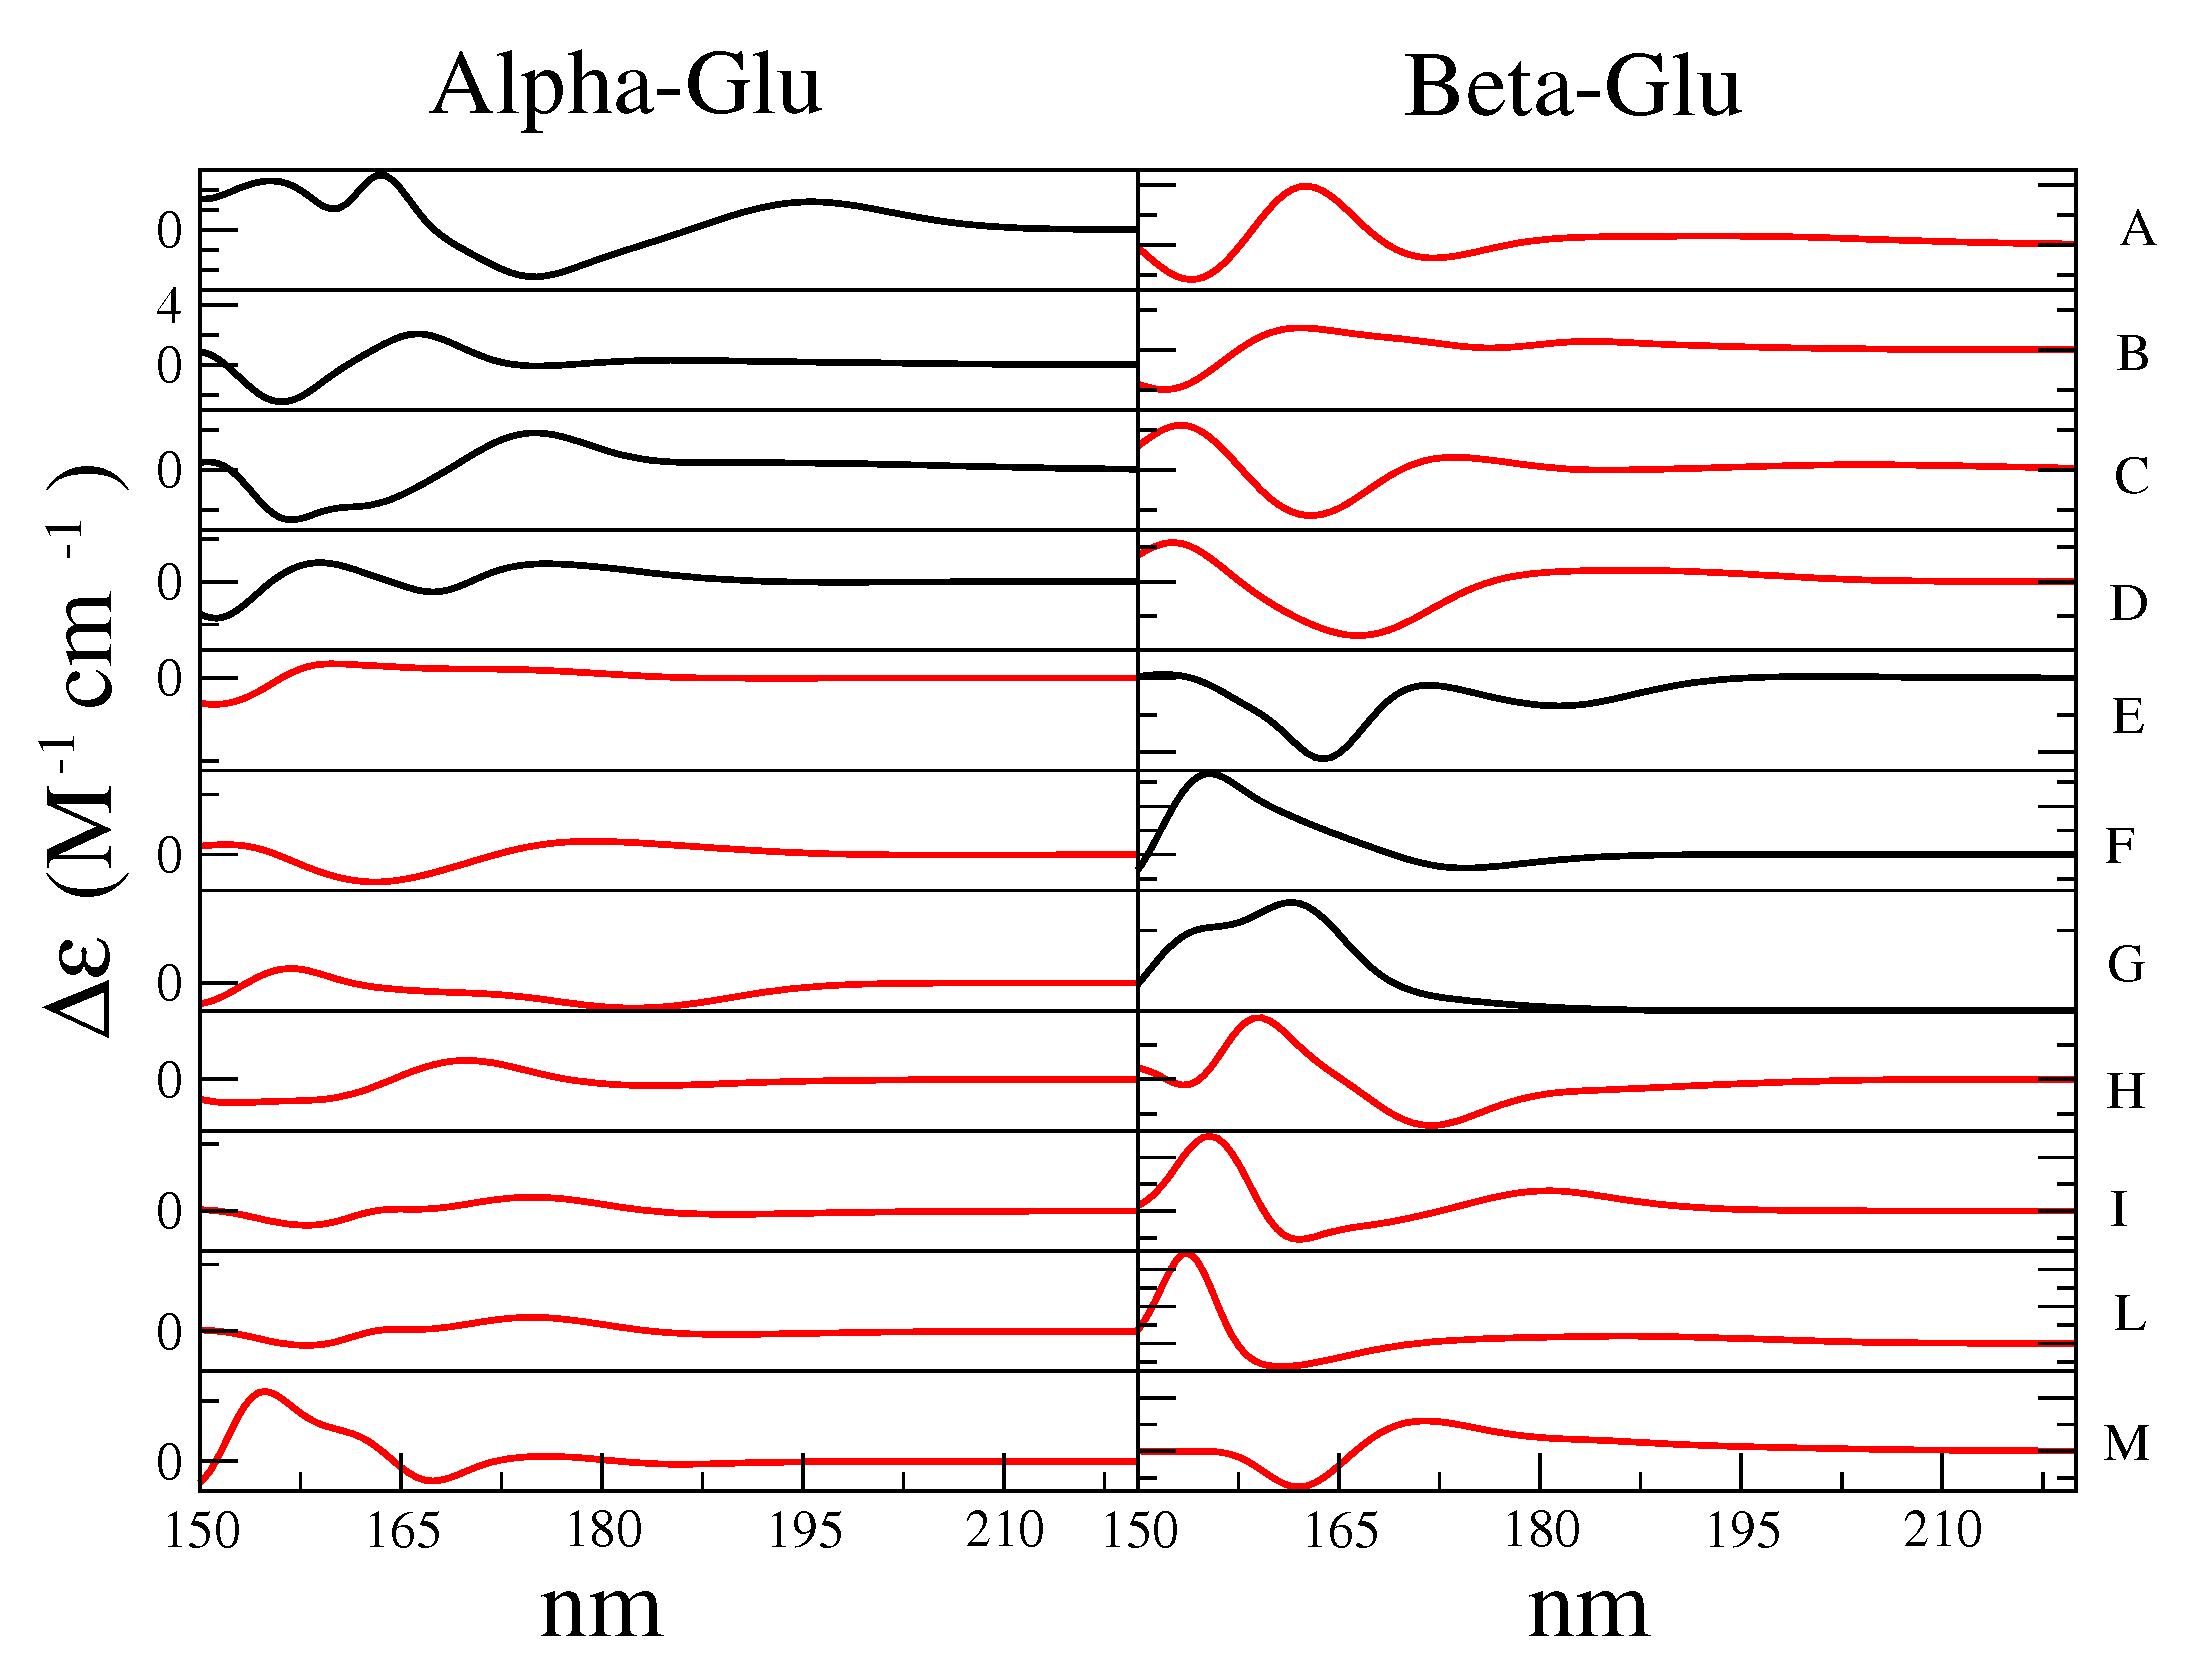
- The investigation was initiated by simulating the monosaccharides (i.e., the chromophore) in the alpha and beta configurations separately, in a box filled with water molecules. These simulations (four in total) are hereafter termed as MD-free.
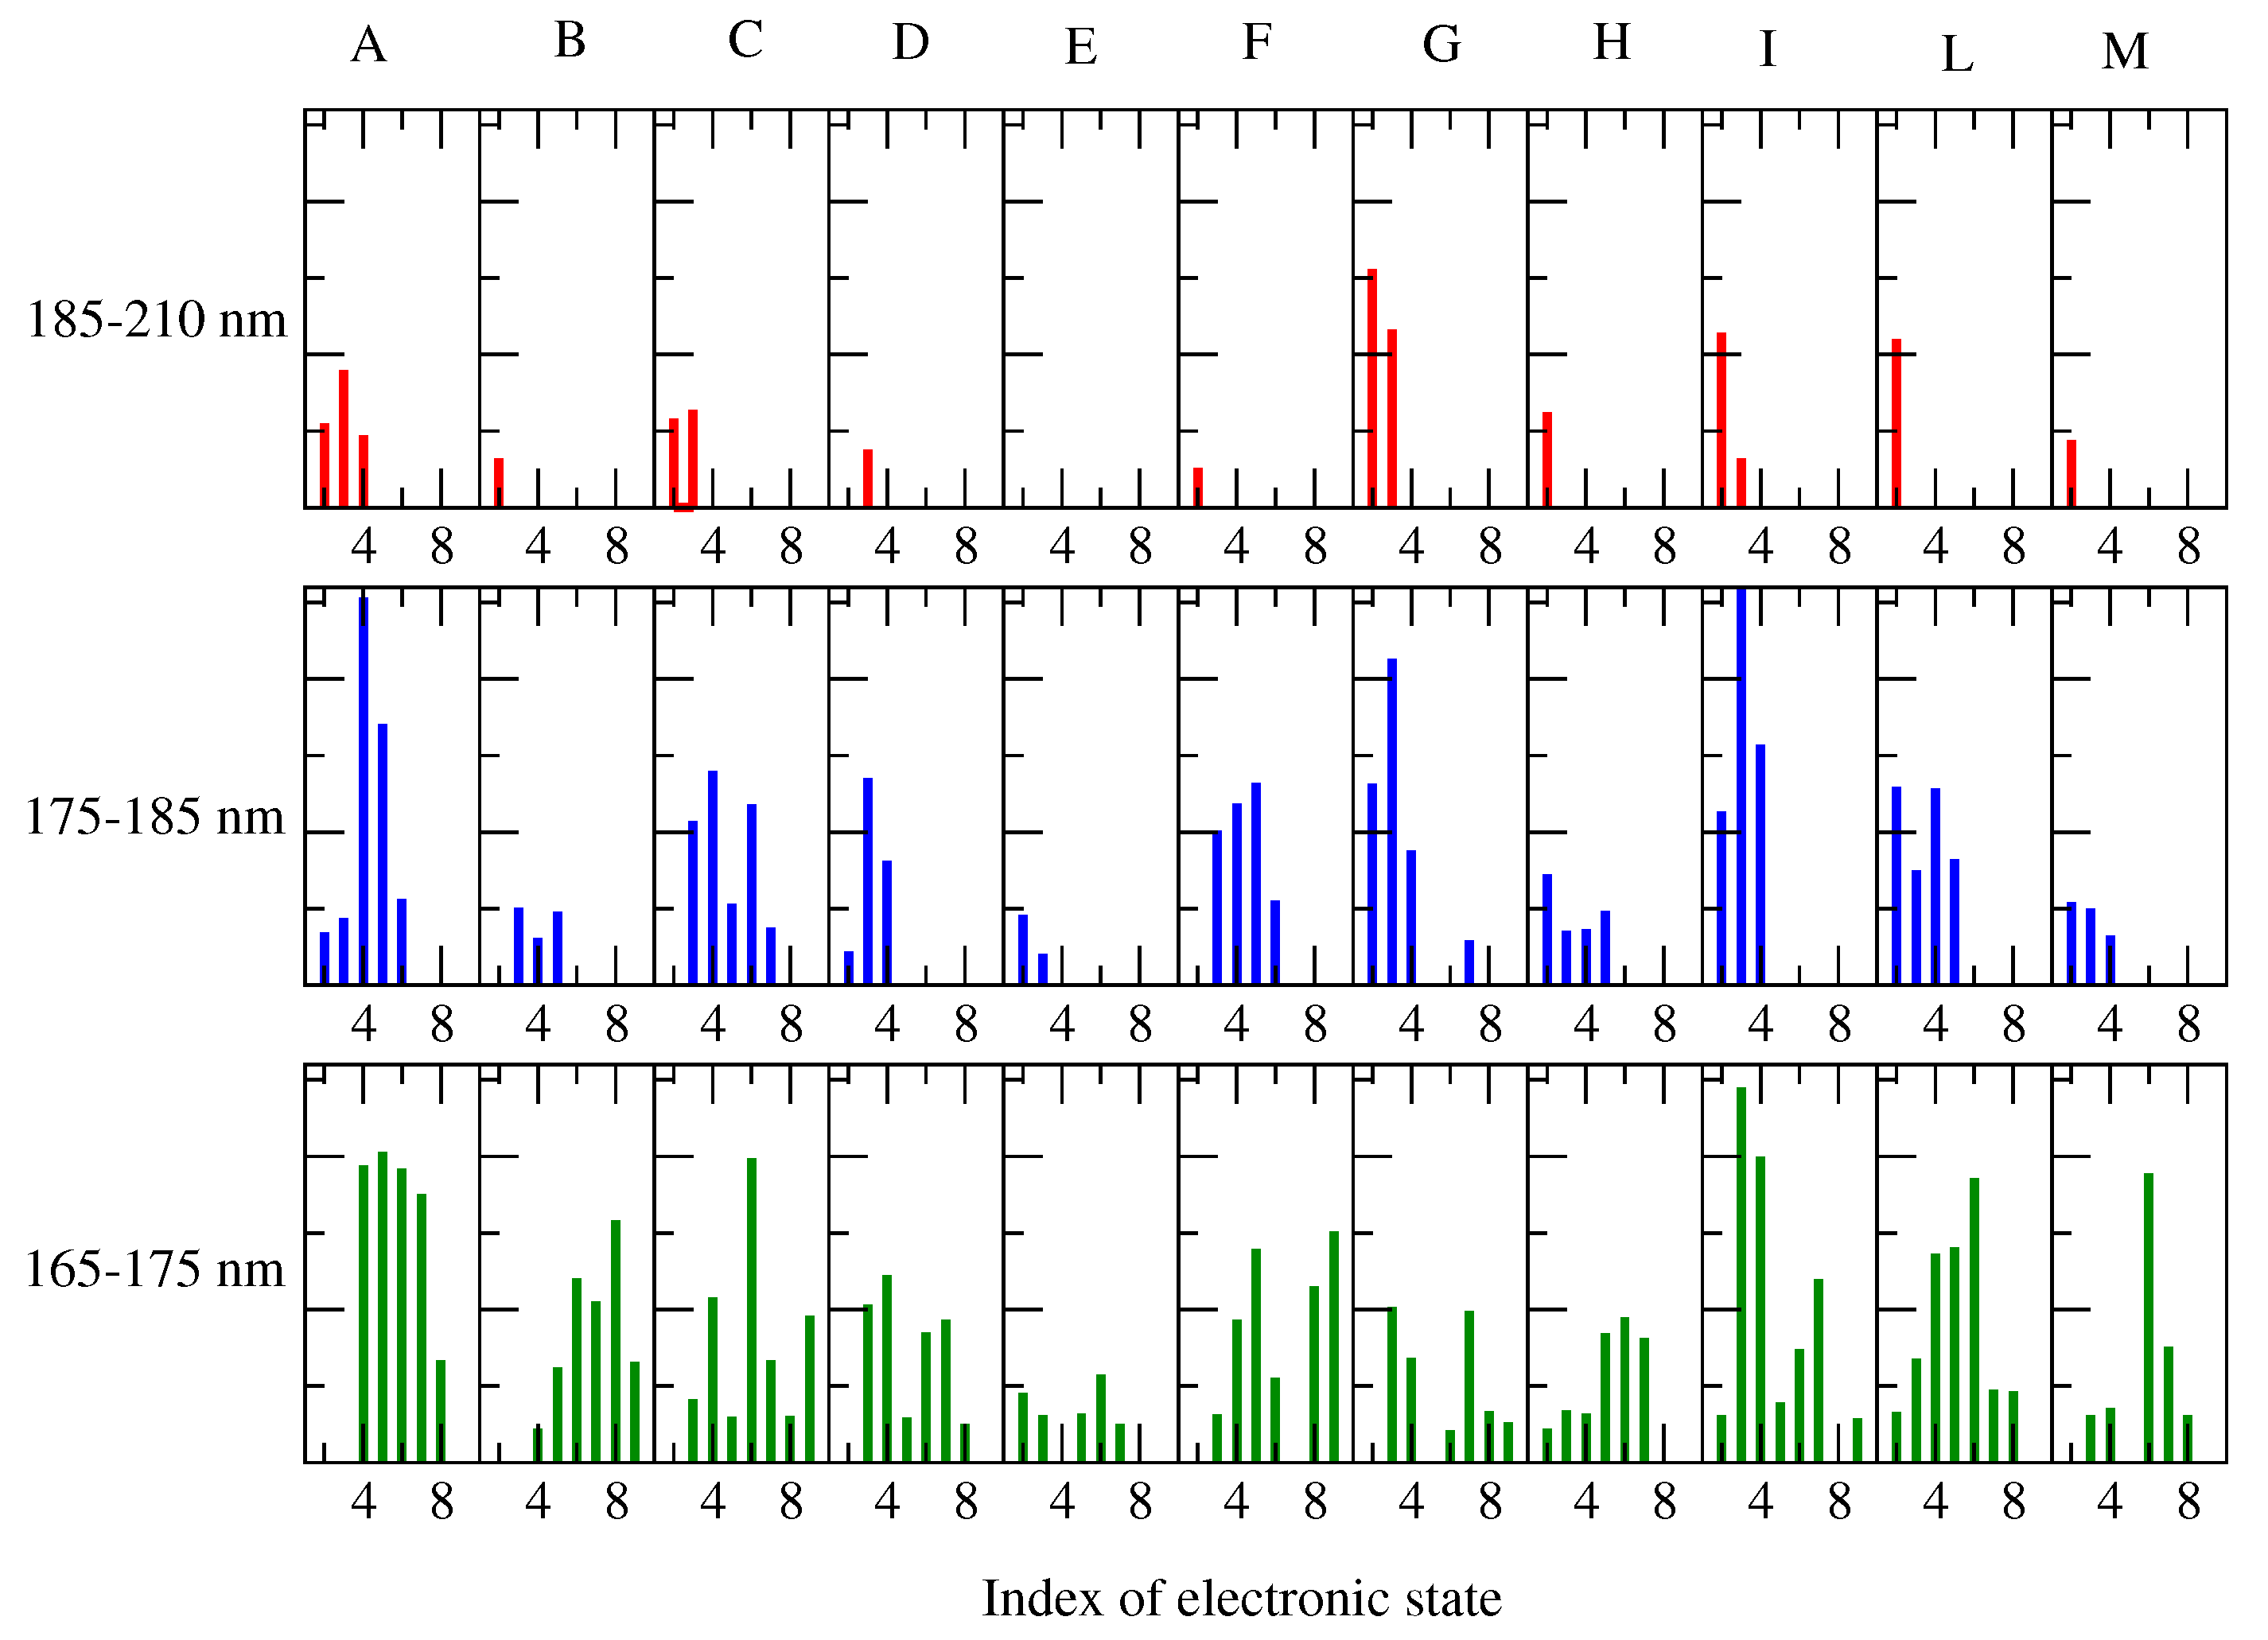
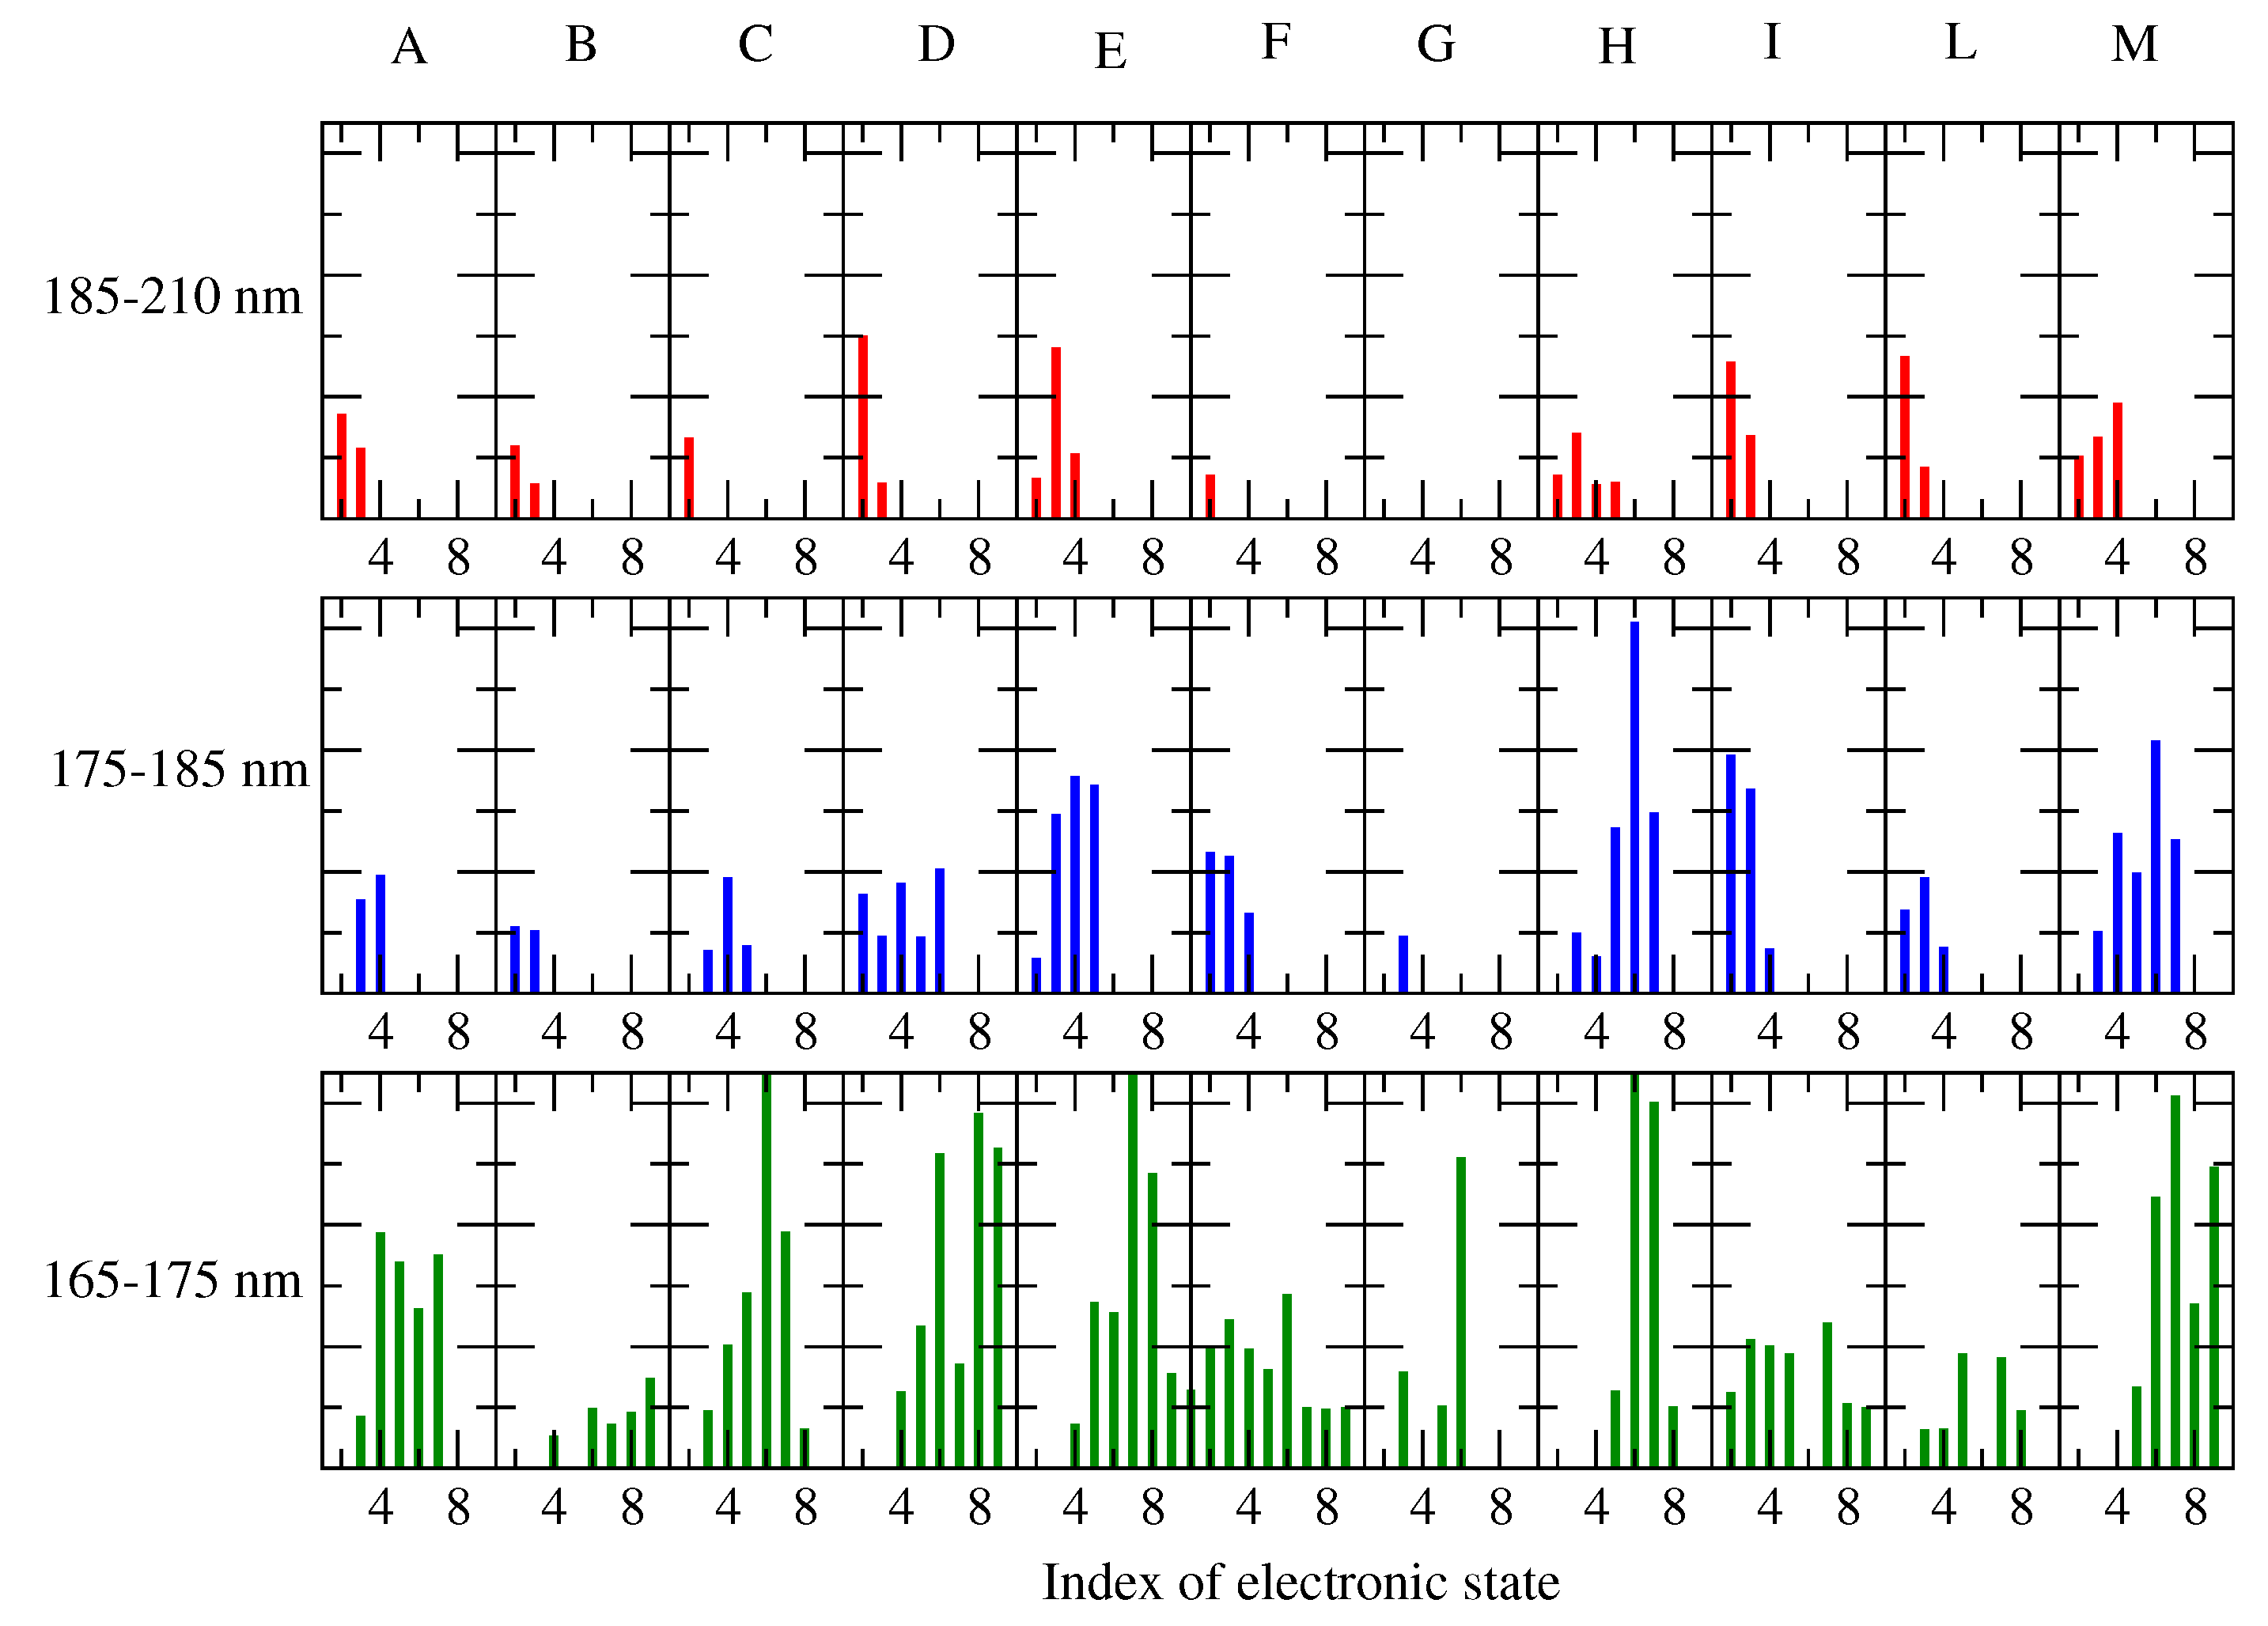
- The MD-free was then analyzed through the ED analysis (see below), which allowed us to evaluate the chromophore free-energy conformational landscape, i.e., the location of an M number of chromophore free-energy basins. Subsequently, it was possible to extract a number of chromophore reference configurations (hereafter, RC) that were representative of the conformations to be used for each of the M free-energy basins, for a total of reference structures. Note that a single RC might be not sufficient for describing a single conformational basin. Each of the RC, corresponding to each conformation characterized by the relative free energy and probability provided by the MD-free simulation, was then independently simulated with a constrained MD simulation (i.e., the chromophore is kept frozen), hereafter termed MD-constr, in order to increase the solvent conformational sampling included in the modeling of the spectral features (see the previous subsection). Note the all the MD-constr, although carried out exactly under the same MD-free conditions did not require for a proper sampling of the same simulation length because only the fast solvent relaxation had to be achieved.
- Each of the RC was used for the quantum chemical calculations during the gas phase. In particular, the RC was first optimized by retaining the semi-classical internal degrees-of-freedom (proper dihedrals). Subsequently, the constrained-optimized structure was used for determining the unperturbed properties necessary for the PMM calculations (see the Theory Section) with the QC corresponding to the entire chromophore. Note that in order to test the performance of the method even when using the most simplified QC definition, we did not include any water molecules within the QC [28], though their presence was possible.
- The unperturbed properties of each RC were used for the PMM calculations of the corresponding MD-constr, providing the perturbed rotational strength, and the conformation CD spectrum (see Equation (9) in the Theory Section).
- The total spectra of the chromophore for the alpha and beta configurations were then evaluated by summing all the spectra, each weighted by the corresponding conformation probability, as obtained by the MD-free simulation.
2.1. d-Glucose ECD Spectrum
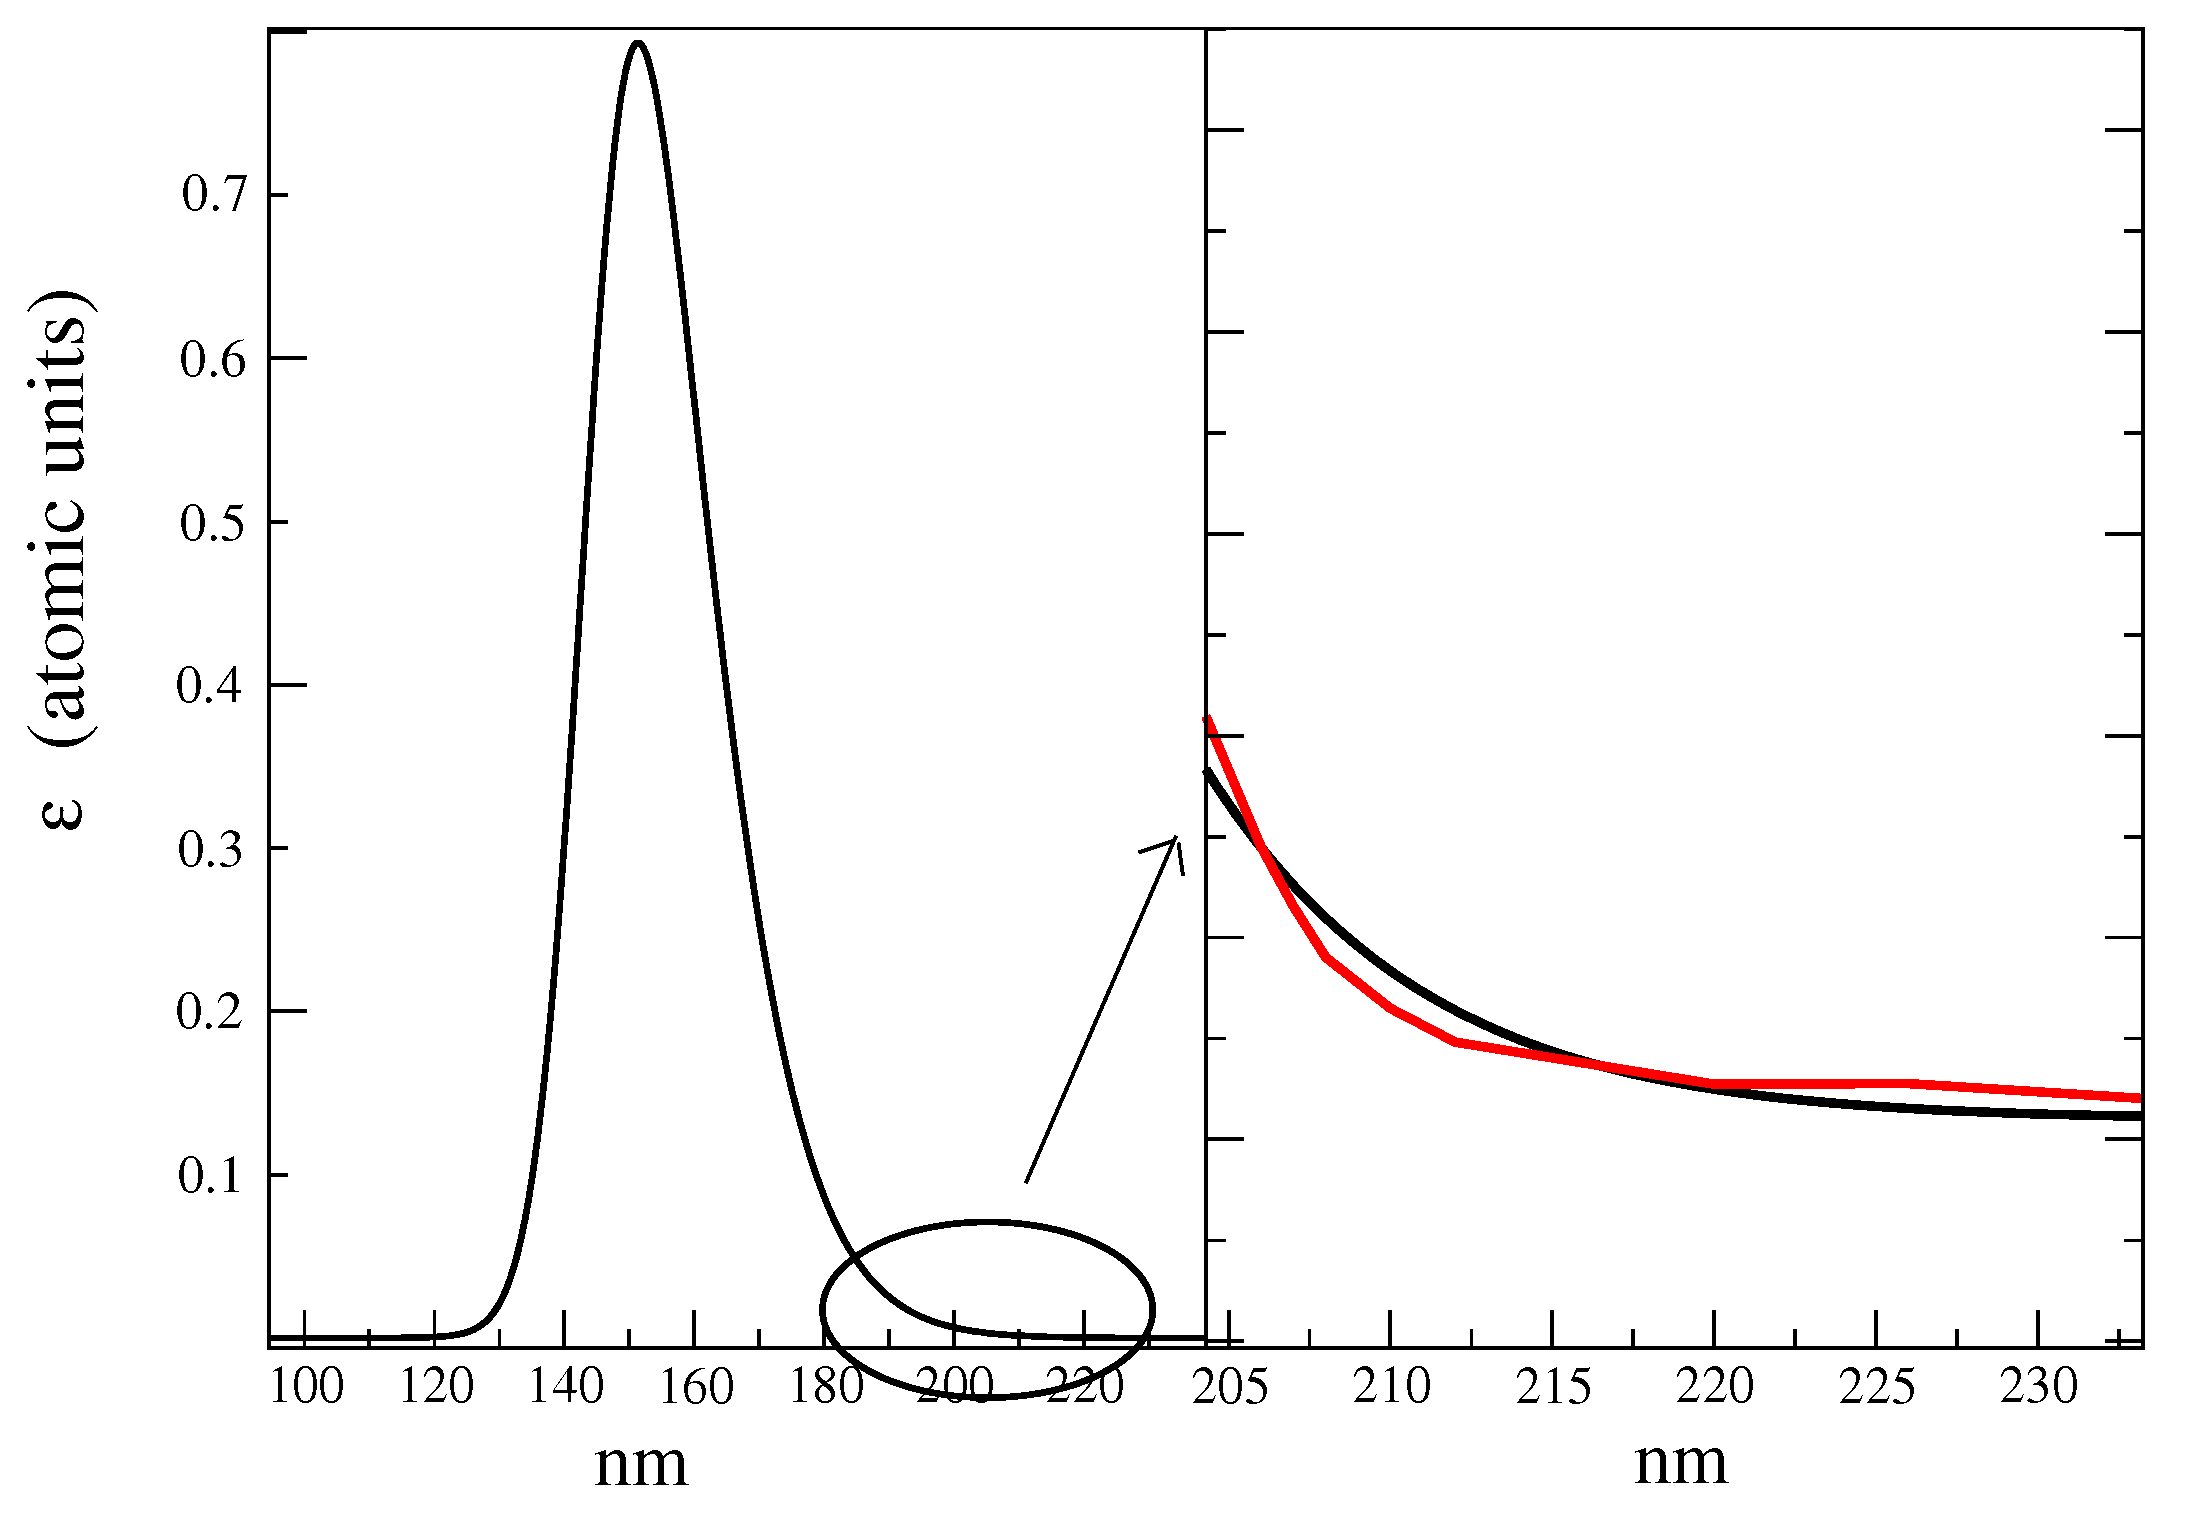
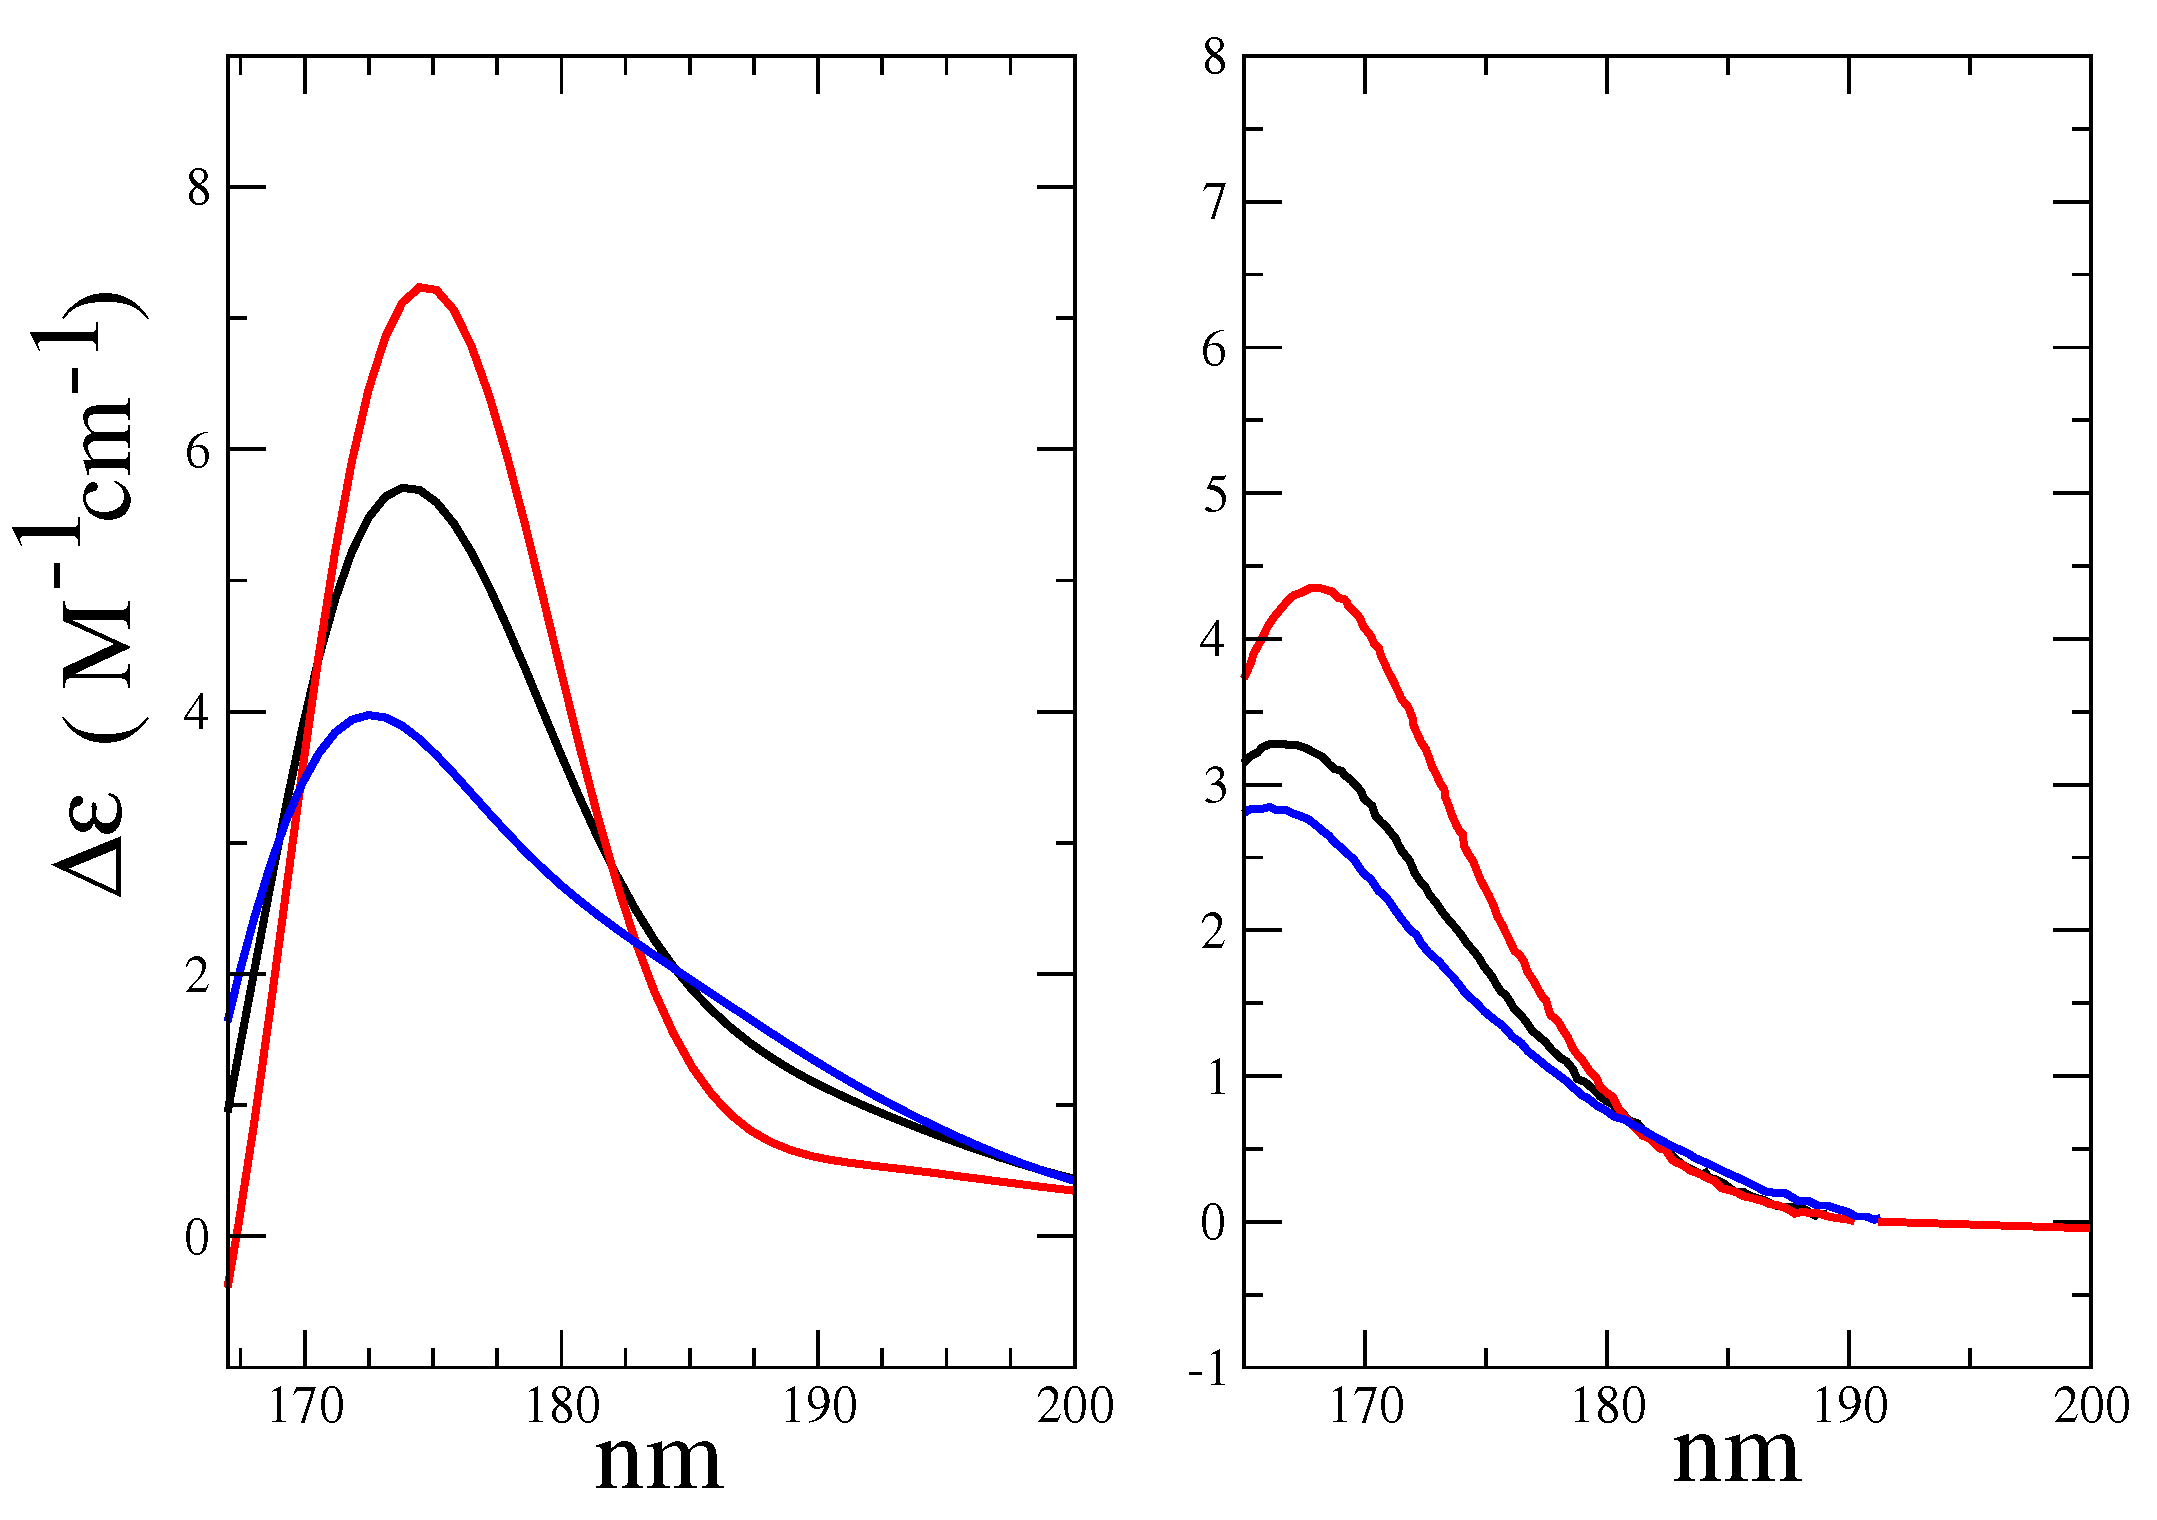
- The maximum of the global ECD spectrum was found at 174 nm, i.e., 6 nm red-shift with respect to the experimental value. This result was probably due to the intrinsic limitations of the CAM-B3LYP functional that had provided the same shift in the study of Matsuo and Gekko [39]. Not surprisingly, for cases such as the present one in which the vibronic effect had not been taken into account and where we had used the vertical transition approximation [45], the absolute intensity was overestimated, though the correct order-of-magnitude of the experimental spectral intensity [35] was reproduced.
- The relative heights of Alpha-Glu and Beta-Glu (1:0.55) ECD spectra, as obtained by our model, were in good agreement with the experiments (1:0.54 [39] and 1:0.60 [35]) and the overall spectral asymmetric shape [35,39] was properly reproduced. However, the calculated Beta-Glu spectrum and, consequently, the calculated overall spectrum appeared as characterized by a red-tail that faded at 15 nm (see Figure 9) beyond the experimental value. The origin of such a slight discrepancy could have been be twofold. On one hand, by using a limited number of RC conformations, as obtained by the MD sampling, our model could have suffered from some the inadequacies in the force field, resulting in an inaccurate sampling of the conformational regions. On the other hand, as already remarked in some of our recent studies [47], the purely classical QC-solvent interactions we used to model the QC perturbation could have resulted in incorrect hydrogen-bonding, leading to the overestimation of the first solvent shell mobility and, thus, to overestimated electric field fluctuations.
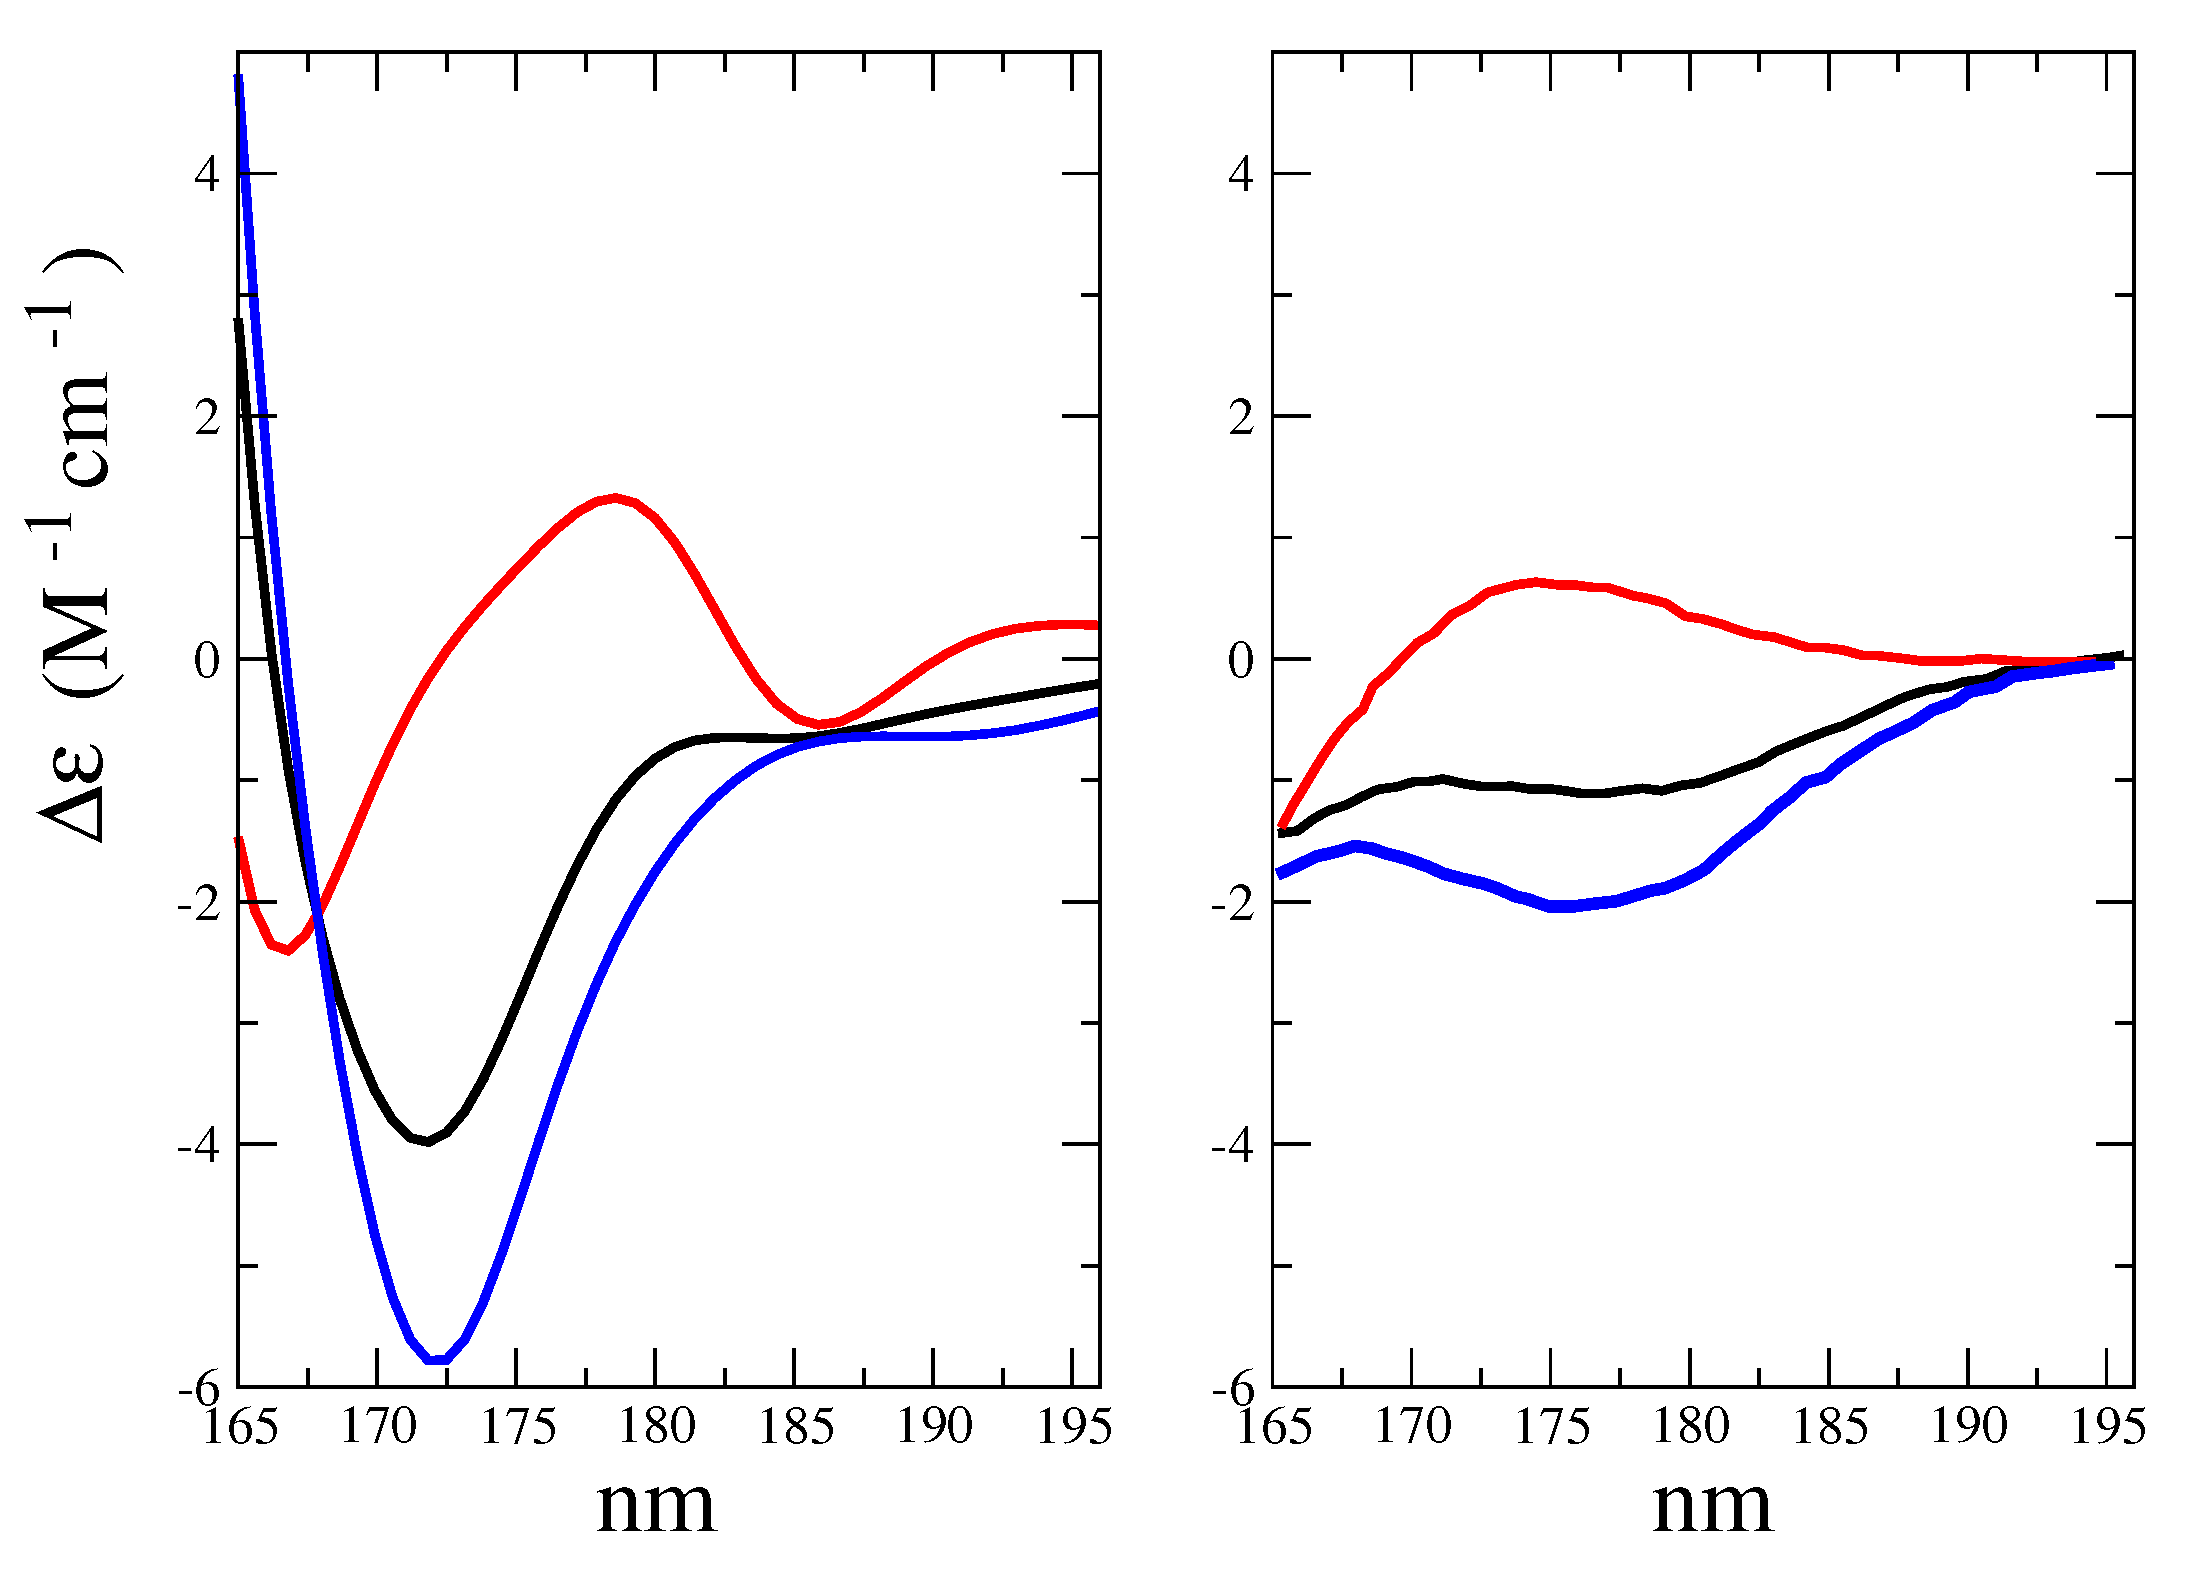
2.2. d-Galactose ECD Spectrum
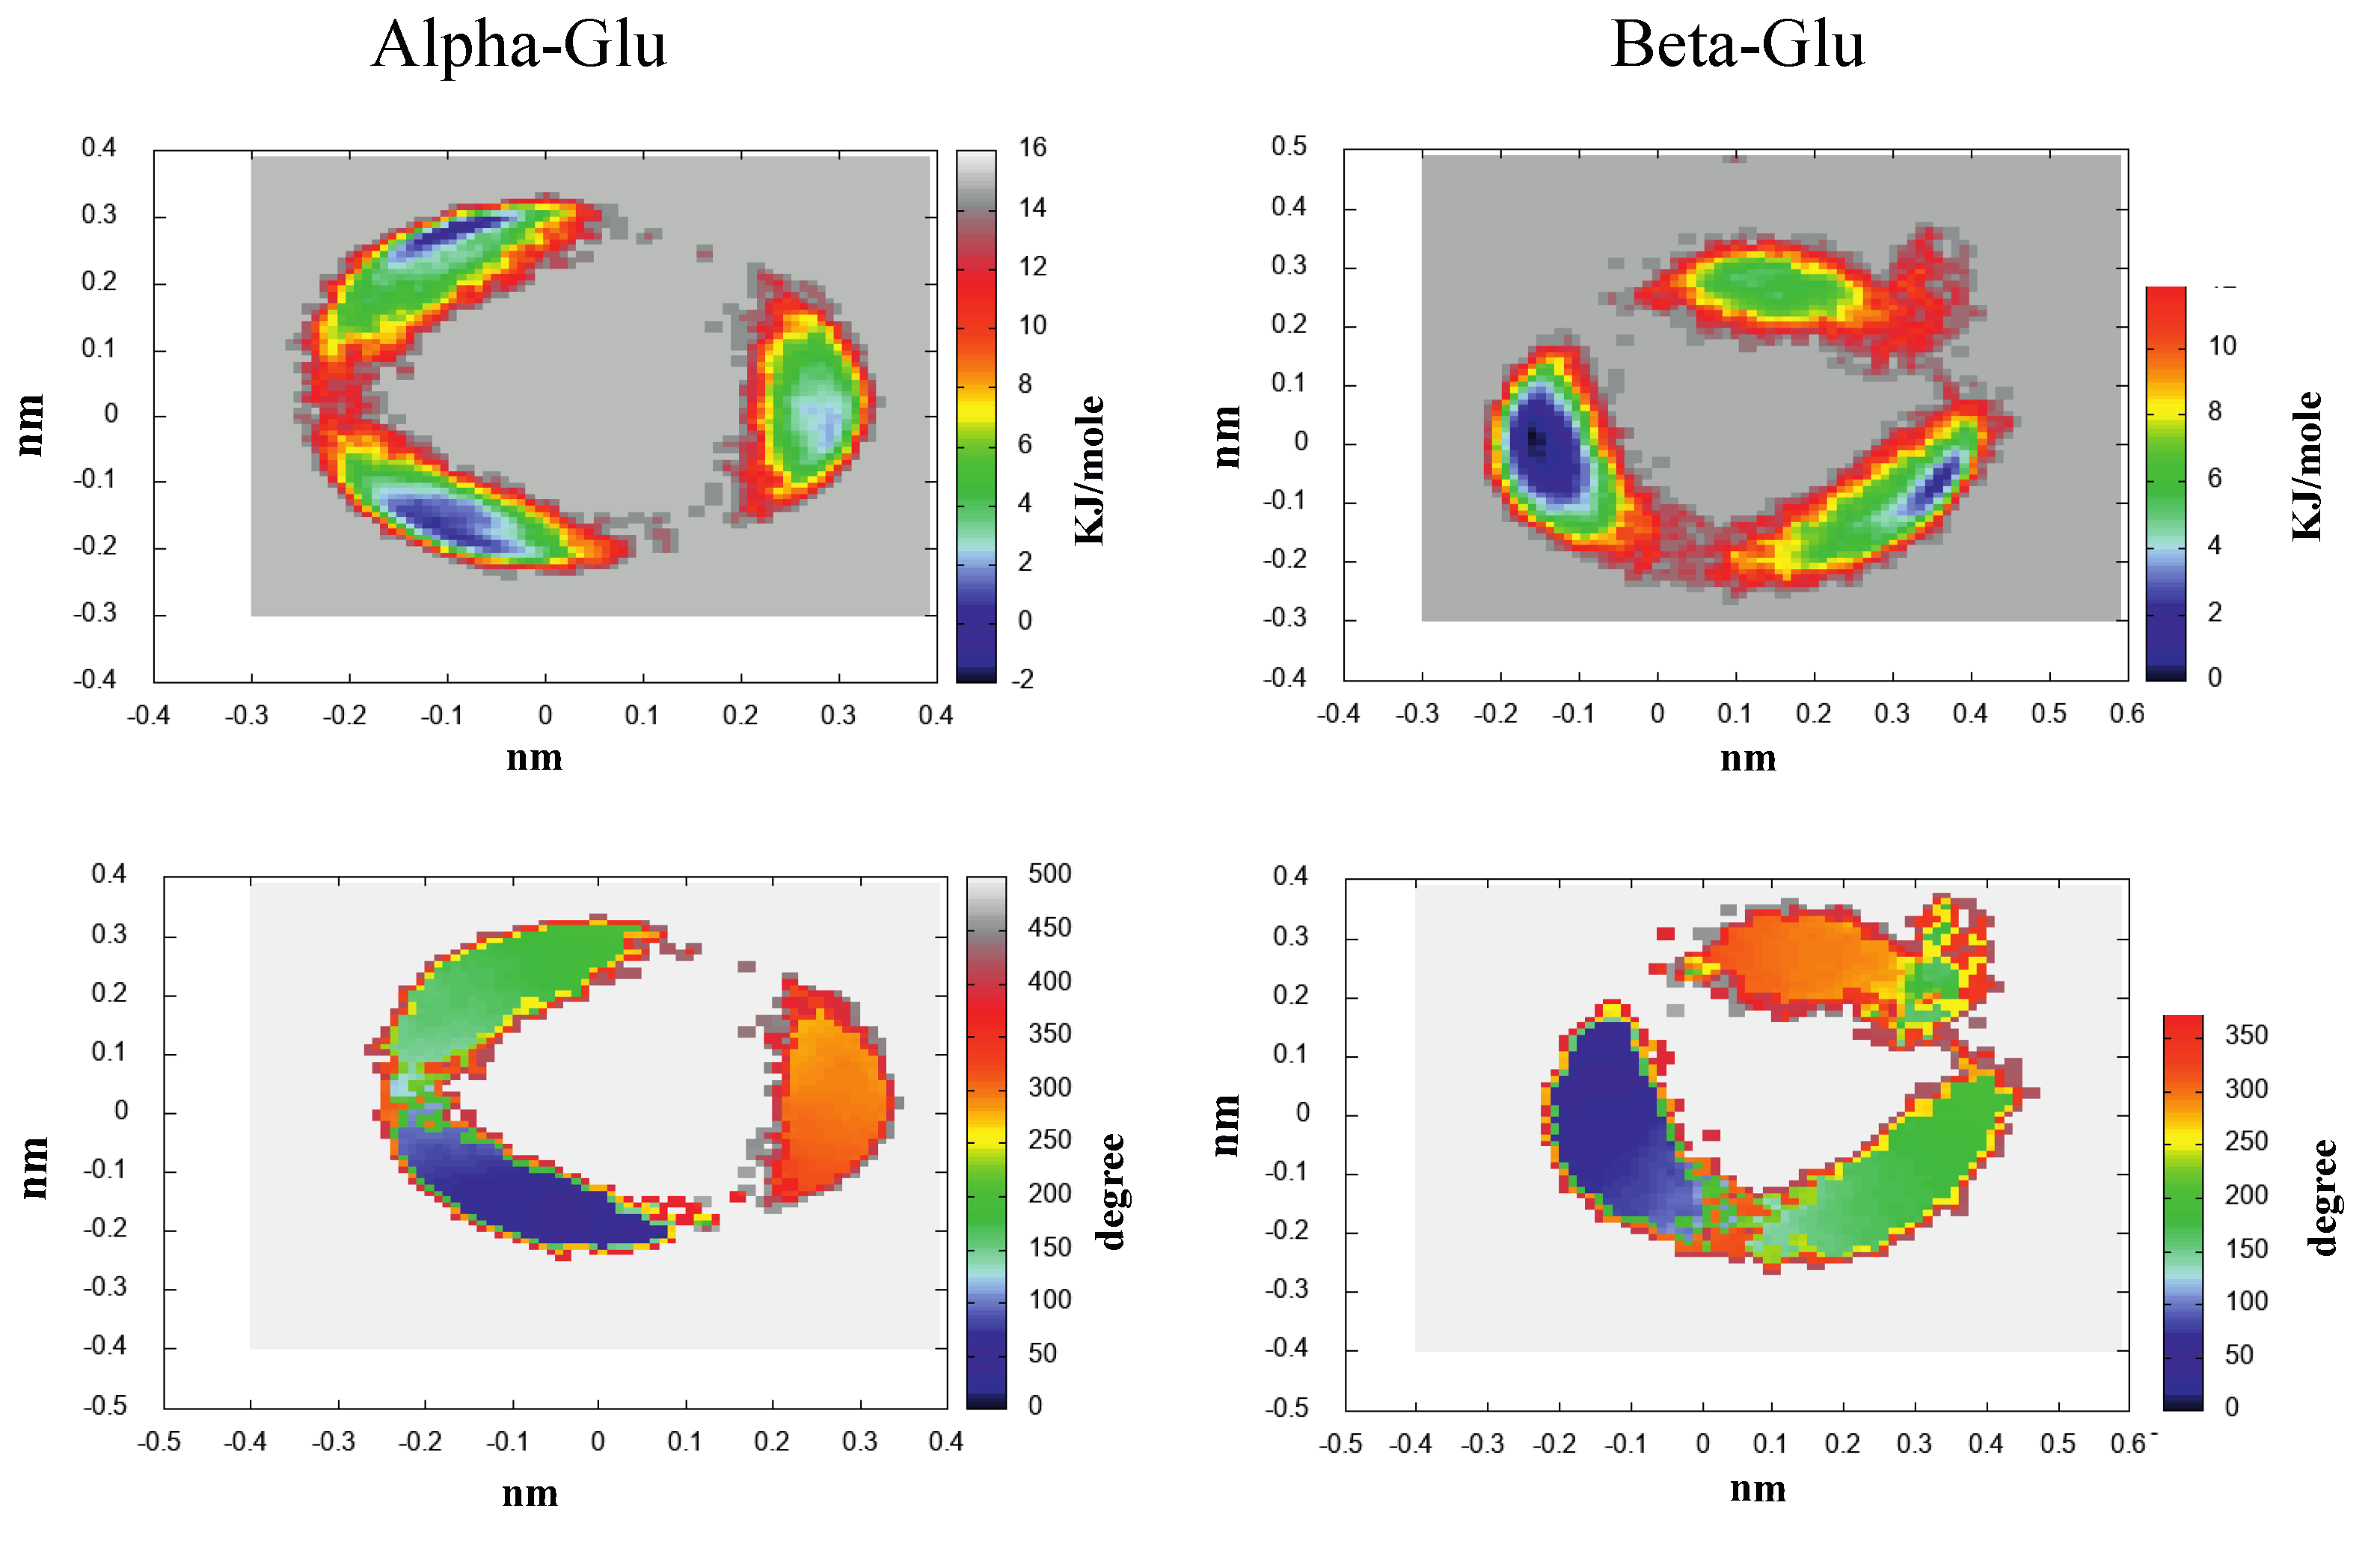
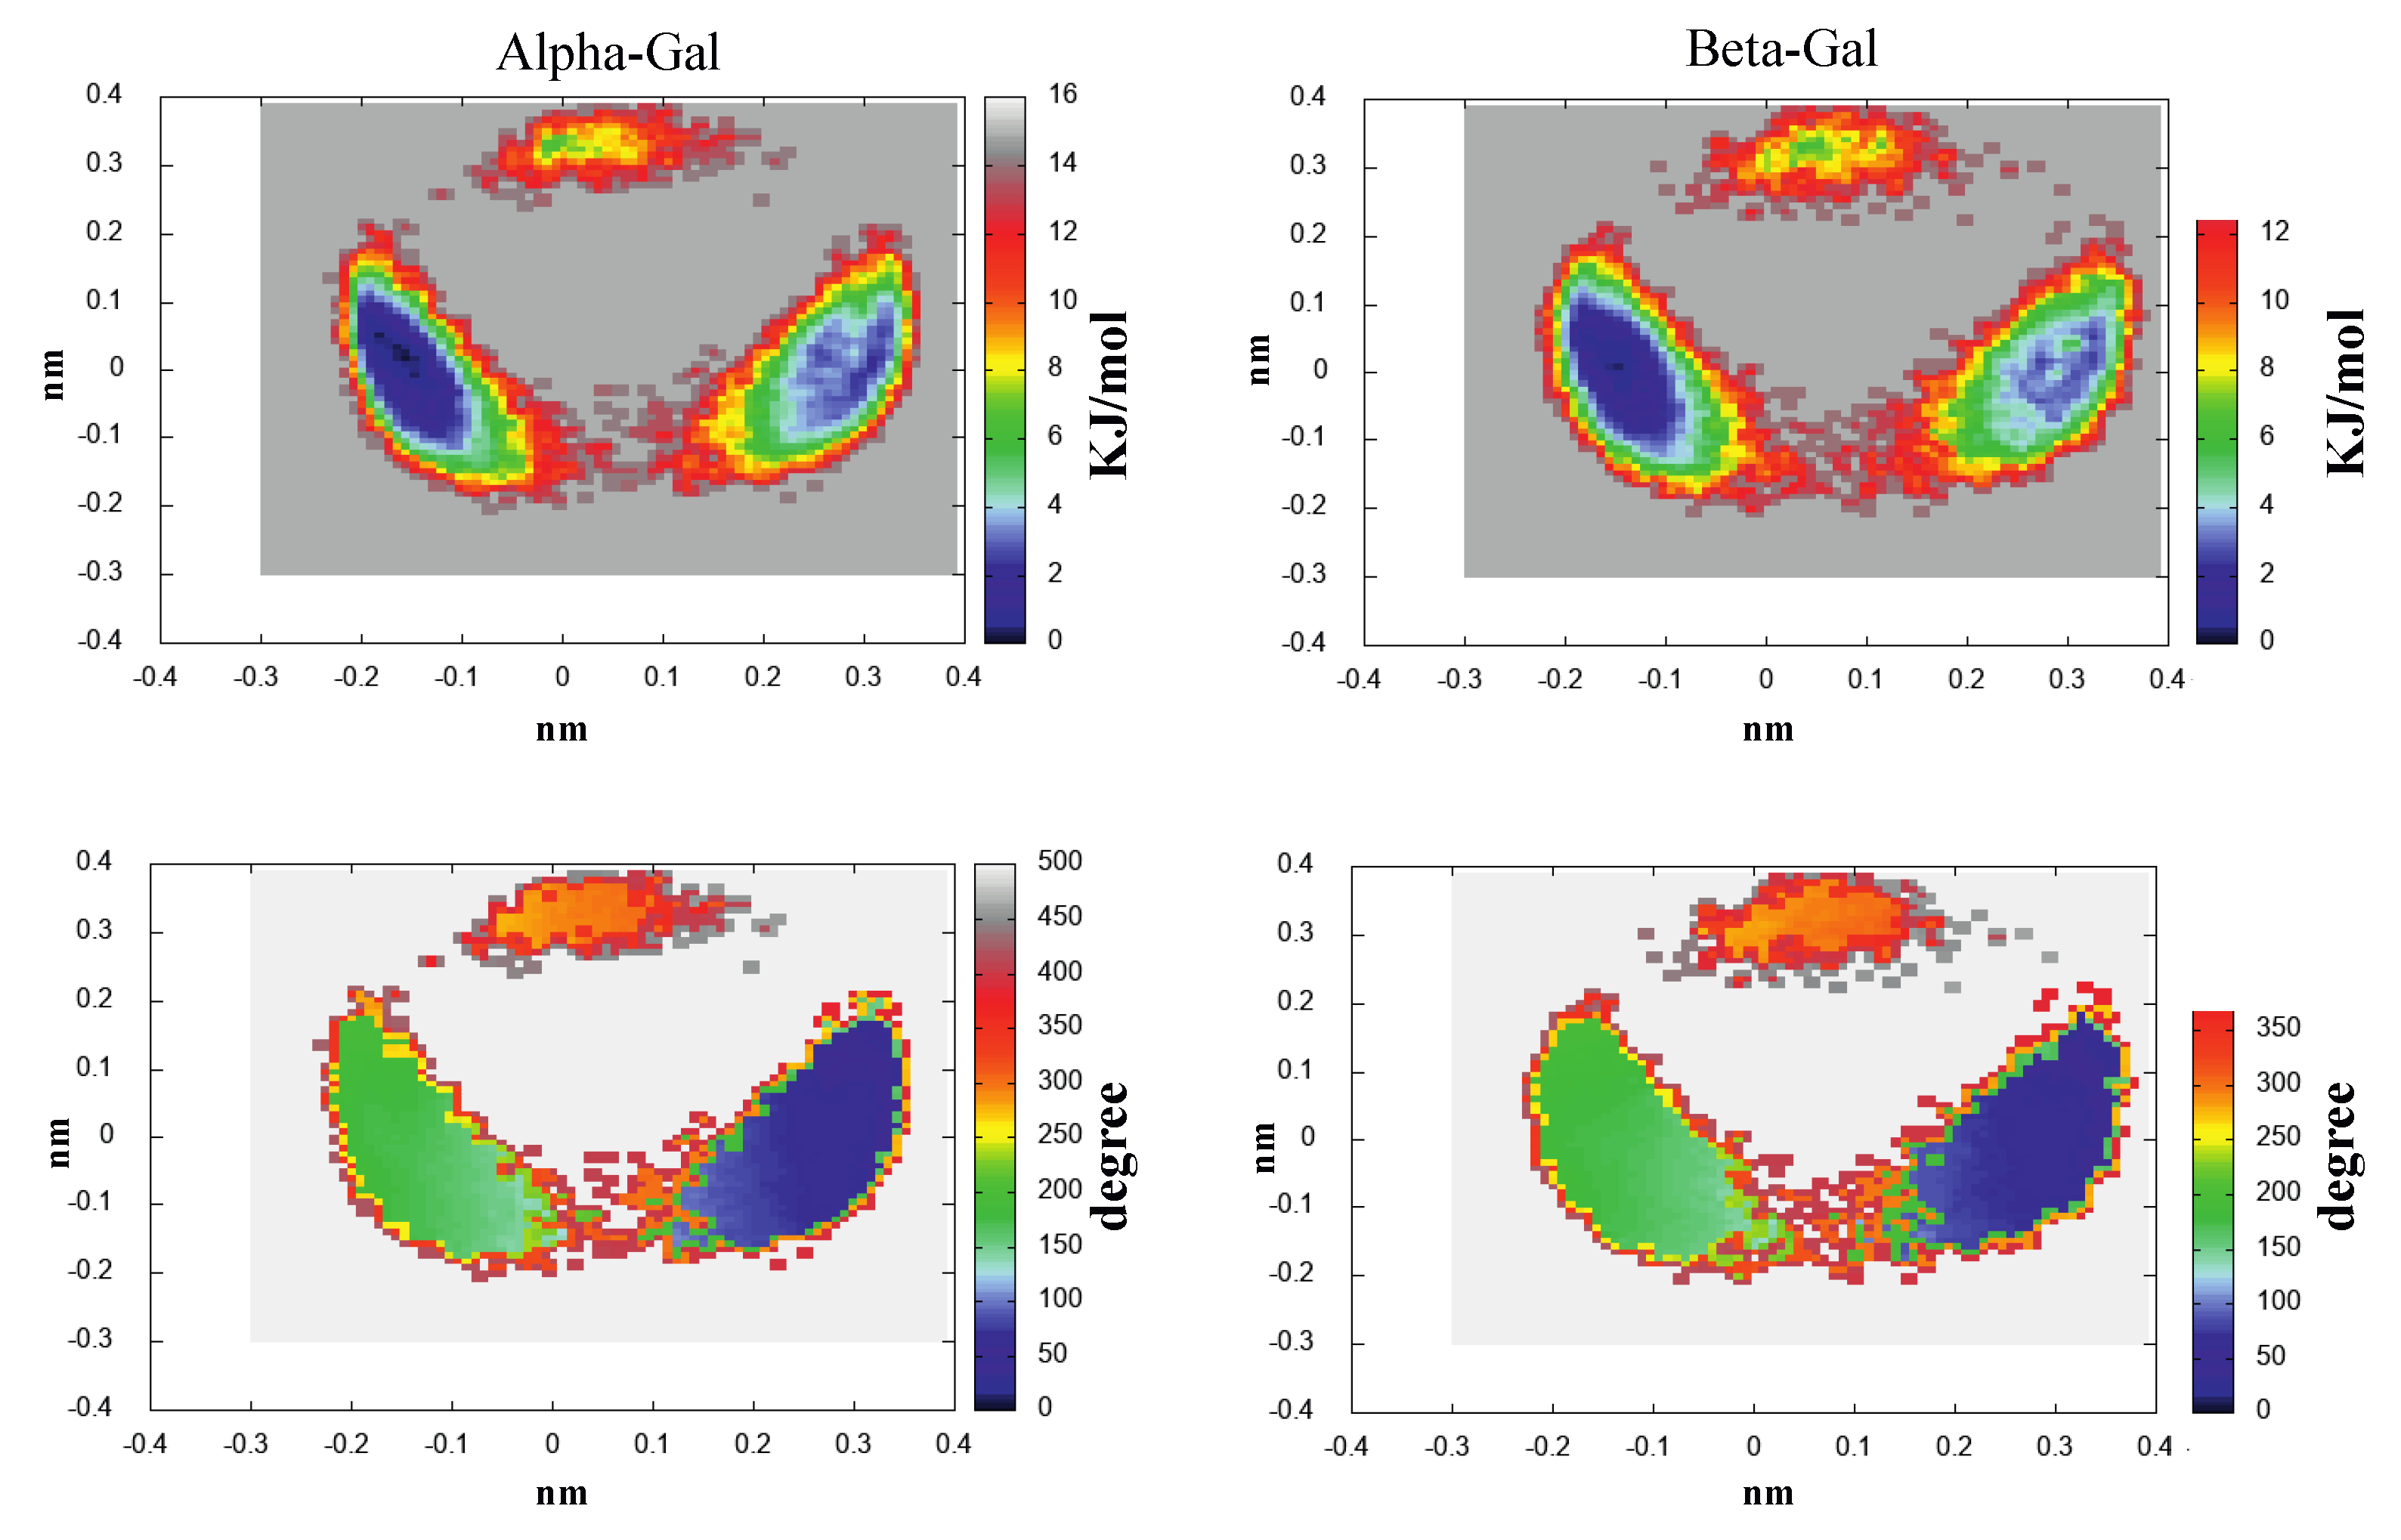
- The morphological features of the spectrum in the region-of-interest appeared to be sufficiently well reproduced. In addition, both the signs of the Alpha-Gal and Beta-Gal signals, as well as their shapes, were in satisfactory agreement with the experimental data. However, as compared to Glu, in the case of Alpha-Gal, a slight but significant deviation from the experimental spectrum was observed in two spectral regions, i.e., below 170 nm and between 185 and 190 nm. Furthermore, in these regions, our model predicts two negative peaks that were absent in the experimental spectrum, probably due to a slight inadequacy in the utilized conformational repertoire. It was interesting to observe that the positive sign of Alpha-Gal was determined by the GT rotamer (see S.I. for additional details).
- The Alpha-Gal and Beta-Gal minimum and maximum spectra, on the other hand, as compared to the experimental values, appeared slightly red-shifted (+2.5 nm) and blue-shifted (−5.0 nm) for Alpha-Gal and Beta-Gal, respectively.
- The calculated overall spectrum (obtained using the experimental Alpha:Beta population ratio of 38:62) showed the main features of the experimental results, although with enhanced intensity variations within the wavelength range-of-interest, probably due to the slightly overestimated absolute intensity, as briefly discussed for d-glucose.
- Nevertheless, even using a drastically reduced number of RC conformations, our model was able to capture the essential spectral features of D-Galactose.
3. Materials and Methods
4. Discussion and Concluding Remarks
Supplementary Materials
Author Contributions
Funding
Institutional Review Board Statement
Acknowledgments
Conflicts of Interest
Sample Availability
Abbreviations
| ECD | Electronic Circular Dichroism |
| MD | Molecular Dynamics |
| ED | Essential Dynamics |
| PMM | Perturbed Matrix Method |
| QC | Quantum Center |
| DFT | Density Functional Theory |
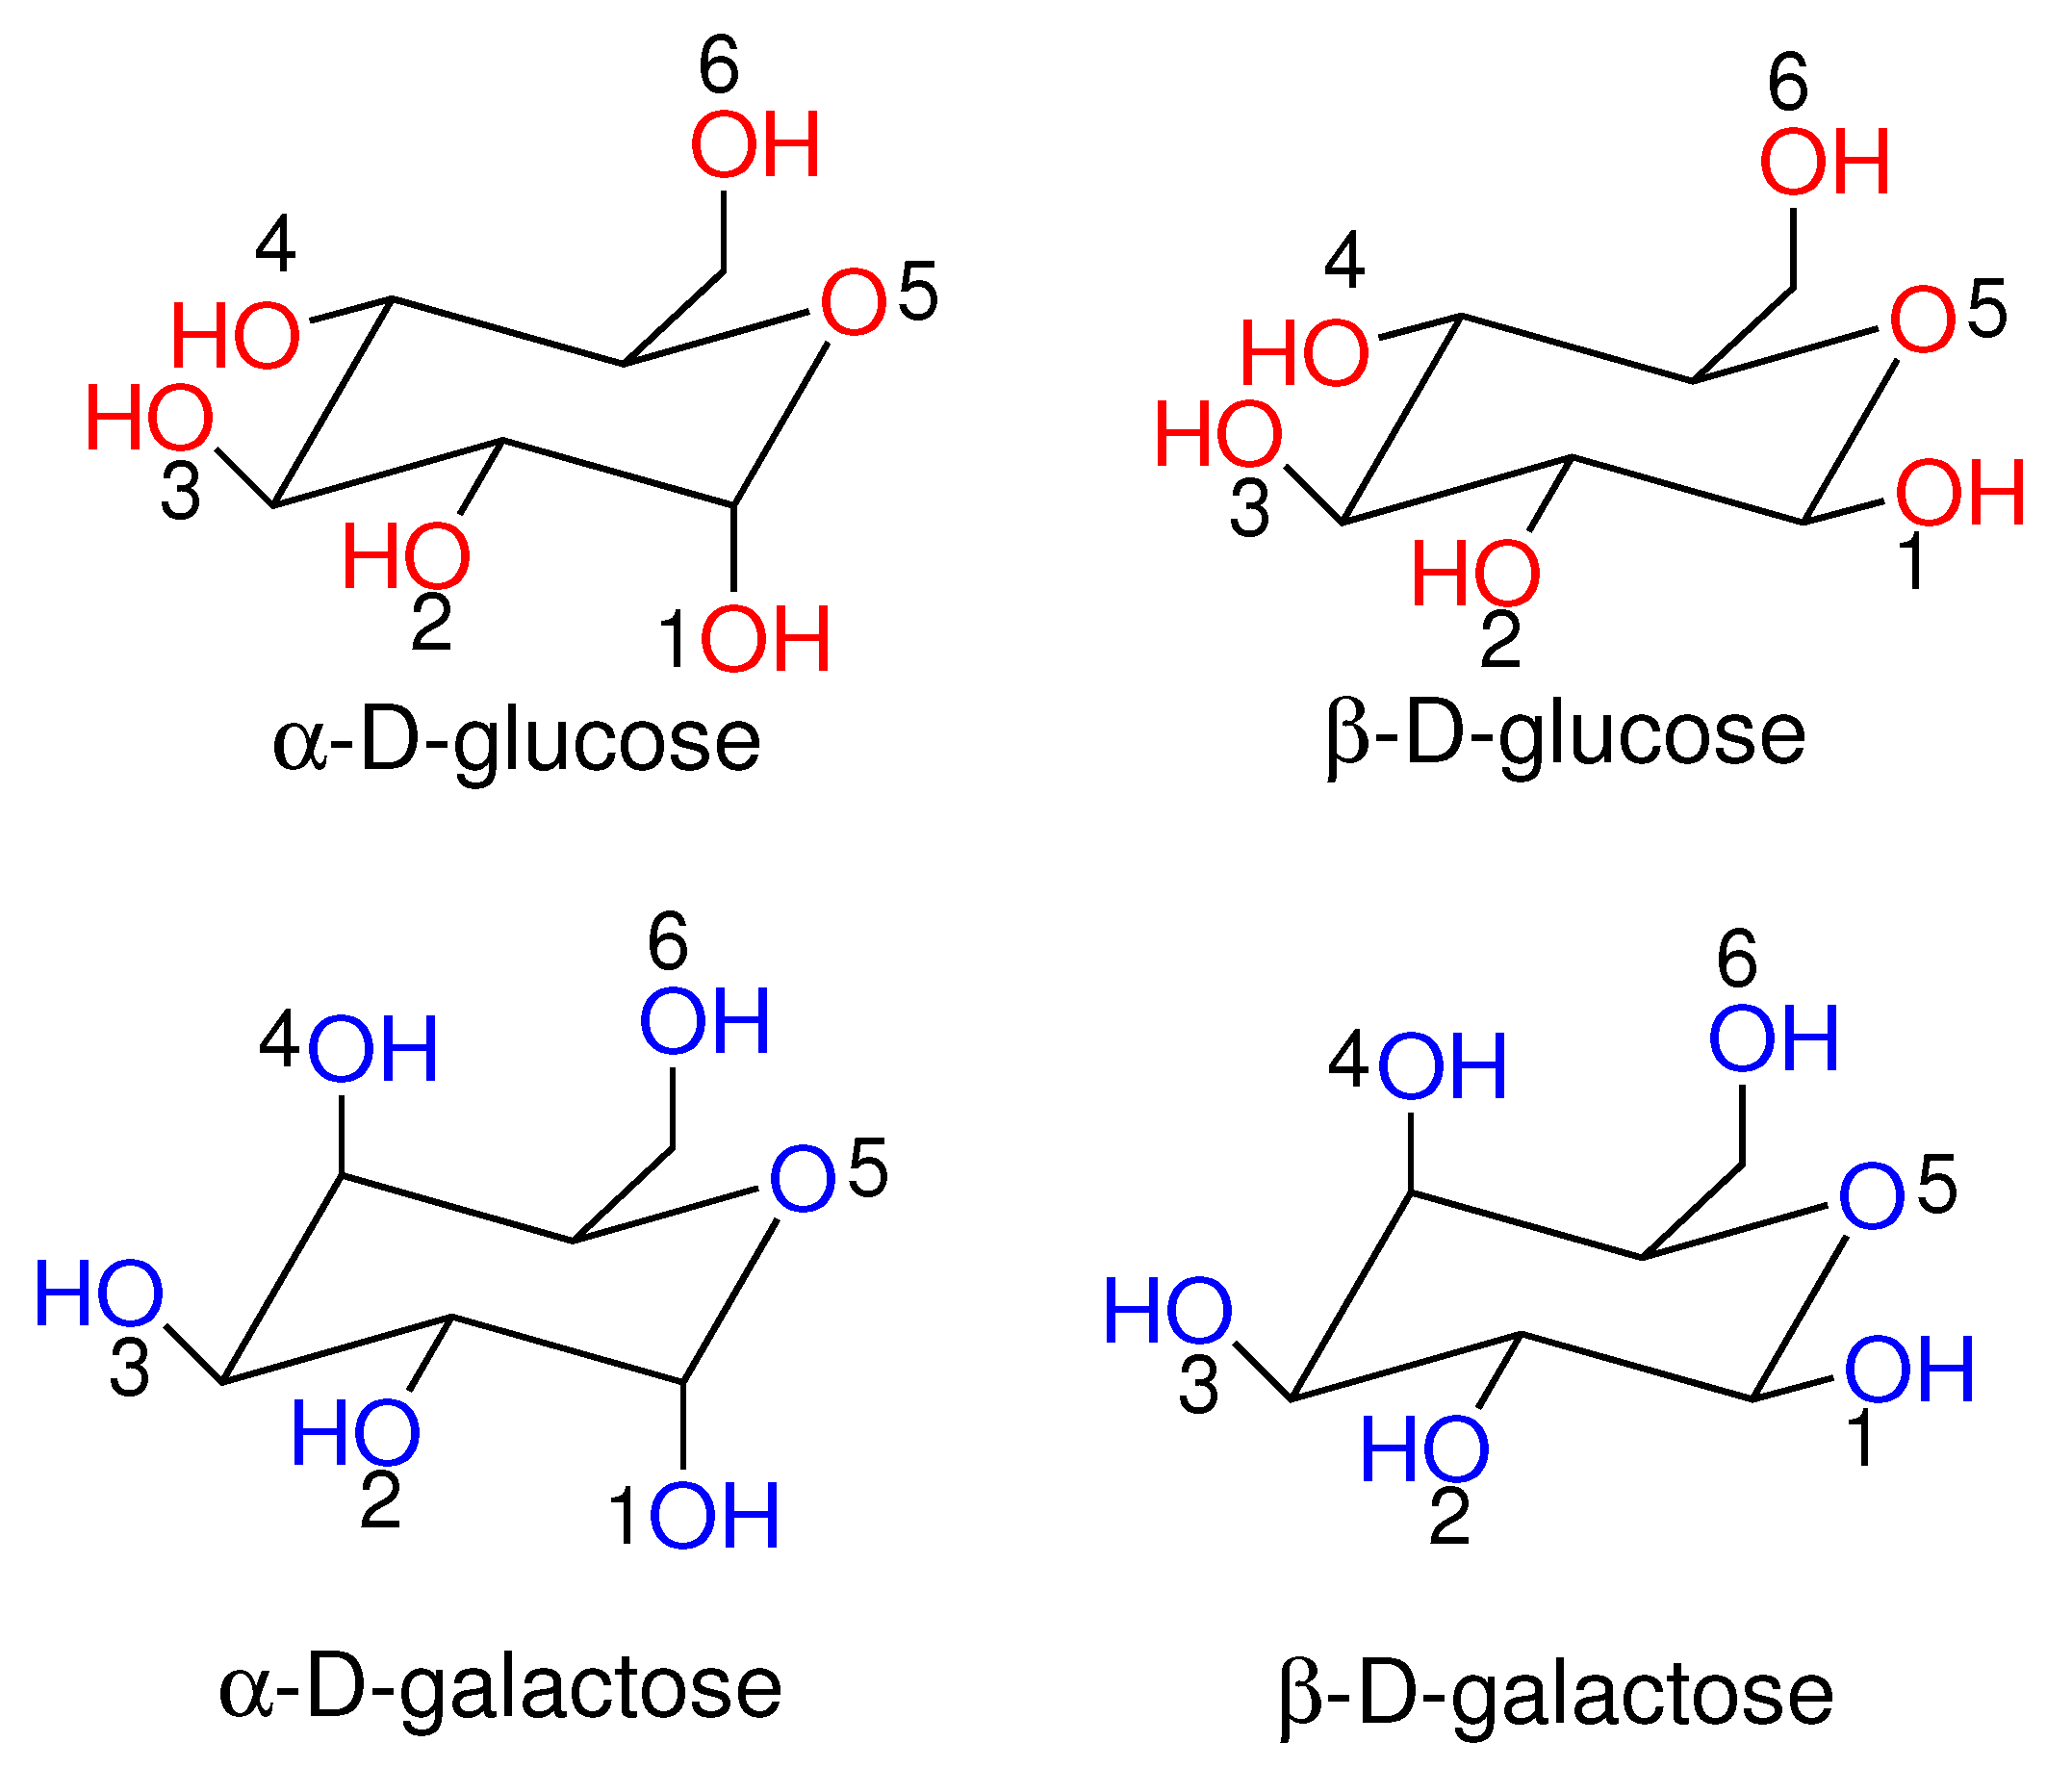
| Glu | D-Glucose |
| Gal | D-Galactose |
References
- Berova, N.; Di Bari, L.; Pescitelli, G. Application of electronic circular dichroism in configurational and conformational analysis of organic compounds. Chem. Soc. Rev. 2007, 36, 914. [Google Scholar] [CrossRef]
- Giovannini, T.; Egidi, F.; Cappelli, C. Theory and algorithms for chiroptical properties and spectroscopies of aqueous systems. Phys. Chem. Chem. Phys. 2020, 22, 22864. [Google Scholar] [CrossRef]
- Kumar, A.; Toal, S.; DiGuiseppi, D.; Schweitzer-Stenner, R.; Wong, B. Water-Mediated Electronic Structure of Oligopeptides Probed by Their UV Circular Dichroism, Absorption Spectra, and Time-Dependent DFT Calculations. J. Phys. Chem. B 2020, 124, 2579–2590. [Google Scholar] [CrossRef]
- Srebro-Hooper, M.; Autschbach, J. Calculating Natural Optical Activity of Molecules from First Principles. Annu. Rev. Phys. Chem. 2017, 68, 399. [Google Scholar] [CrossRef] [PubMed]
- Konecny, L.; Repisky, M.; Ruud, K.; Komorovsky, S. Relativistic four-component linear damped response TDDFT for electronic absorption and circular dichroism calculations. J. Chem. Phys. 2019, 151, 194112. [Google Scholar] [CrossRef] [PubMed]
- Woody, R.W. Circular Dichroism Spectrum of Peptides in the Poly(Pro)II Conformation. J. Am. Chem. Soc. 2009, 131, 8234–8245. [Google Scholar] [CrossRef]
- Aranda, D.; Cerezo, J.; Pescitelli, G.; Ferrer, F.J.A.; Santoro Soto, J. A computational study of the vibrationally-resolved electronic circular dichroism spectra of single-chain transoid and cisoid oligothiophenes in chiral conformations. Phys. Chem. Chem. Phys. 2018, 20, 21864–21880. [Google Scholar] [CrossRef] [PubMed]
- Greenfield, N.J. Using circular dichroism spectra to estimate protein secondary structure. Nat. Protoc. 2006, 1, 2876–2890. [Google Scholar] [CrossRef]
- Matsuo, K.; Yonehara, R.; Gekko, K.K. Secondary-structure analysis of proteins by vacuum-ultraviolet circular dichroism spectroscopy. J. Biochem. 2004, 135, 405–411. [Google Scholar] [CrossRef]
- Autschbach, J.; Ziegler, T. Calculating molecular electric and magnetic properties from time-dependent density functional response theory. J. Chem. Phys. 2002, 116, 891. [Google Scholar] [CrossRef]
- Becke, A.D. Density-functional thermochemistry. III. The role of exact exchange. J. Chem. Phys. 1993, 98, 5648. [Google Scholar] [CrossRef]
- Takeshi, Y.; Tew, D.P.; Handy, N.C. A new hybrid exchange–correlation functional using the Coulomb-attenuating method (CAM-B3LYP). Chem. Phys. Lett. 2004, 393, 51. [Google Scholar]
- Mori, T.; Inoue, Y.; Grimme, S. Time Dependent Density Functional Theory Calculations for Electronic Circular Dichroism Spectra and Optical Rotations of Conformationally Flexible Chiral Donor—Acceptor Dyad. J. Org. Chem. 2006, 71, 9797–9806. [Google Scholar] [CrossRef] [PubMed]
- Goerigk, L.; Grimme, S. Calculation of Electronic Circular Dichroism Spectra with Time-Dependent Double-Hybrid Density Functional Theory. J. Phys. Chem. A 2009, 113, 767–776. [Google Scholar] [CrossRef] [PubMed]
- Bannwarth, C.; Grimme, S. Electronic Circular Dichroism of Highly Conjugated pi-Systems: Breakdown of the Tamm–Dancoff/Configuration Interaction Singles Approximation. J. Phys. Chem. A 2015, 119, 3653–3662. [Google Scholar] [CrossRef] [PubMed]
- Niemeyer, N.; Caricato, M.; Neugebauer, J. Origin invariant electronic circular dichroism in the length dipole gauge without London atomic orbitals. J. Chem. Phys. 2022, 156, 154114. [Google Scholar] [CrossRef]
- Zhang, K.; Balduf, T.; Caricato, M. Full optical rotation tensor at coupled cluster with single and double excitations level in the modified velocity gauge. Chirality 2021, 33, 303. [Google Scholar] [CrossRef]
- Lin, N.; Santoro, F.; Zhao, X.; Rizzo, A.; Barone, V. Vibronically resolved electronic circular dichroism spectra of (R)-(+)-3-methylcyclopentanone: A theoretical study. J. Phys. Chem. A 2008, 112, 12401–12411. [Google Scholar] [CrossRef] [PubMed]
- Santoro, F.; Barone, V. Computational approach to the study of the lineshape of absorption and electronic circular dichroism spectra. Int. J. Quant. Chem. 2010, 110, 476–486. [Google Scholar] [CrossRef]
- Pescitelli, G.; Bruhn, T. Good Computational Practice in the Assignment of Absolute Configurations by TDDFT Calculations of ECD Spectra. Chirality 2016, 28, 466. [Google Scholar] [CrossRef]
- De Wergifosse, M.; Seibert, J.; Grimme, S. Simplified time-dependent density functional theory (sTD-DFT) for molecular optical rotation. J. Chem. Phys. 2020, 153, 084116. [Google Scholar] [CrossRef]
- Bohle, F.; Seibert, J.; Grimme, S. Automated Quantum Chemistry-Based Calculation of Optical Rotation for Large Flexible Molecules. J. Org. Chem. 2021, 86, 15522. [Google Scholar] [CrossRef]
- D’Cunha, R.; Crawford, T.D. Modeling Complex Solvent Effects on the Optical Rotation of Chiral Molecules: A Combined Molecular Dynamics and Density Functional Theory Study. J. Phys. Chem. A 2021, 125, 3095. [Google Scholar] [CrossRef]
- Shiraogawa, T.; Ehara, M.; Jurinovich, S.; Cupellini, L.; Mennucci, B. Frenkel-exciton decomposition analysis of circular dichroism and circularly polarized luminescence for multichromophoric systems. J. Comput. Chem. 2018, 39, 931. [Google Scholar] [CrossRef]
- Mancini, G.; Fuse, M.; Lazzari, F.; Chandramouli, B.; Barone, V. Unsupervised search of low-lying conformers with spectroscopic accuracy: A two-step algorithm rooted into the island model evolutionary algorithm. J. Chem. Phys. 2020, 153, 124110. [Google Scholar] [CrossRef] [PubMed]
- D’Abramo, M.; Aschi, M.; Di Nola, A.; Amadei, A. Calculation of the optical rotatory dispersion of solvated alanine by means of the perturbed matrix method. Chem. Phys. Lett. 2005, 402, 559–563. [Google Scholar] [CrossRef]
- Chen, C.G.; Giustini, M.; Scipioni, A.; Amadei, A.; D’Abramo, M. Theoretical-computational modeling of the L-alanine CD spectrum in water. Comp. Theor. Chem. 2022, 1209, 113591. [Google Scholar] [CrossRef]
- Monti, M.; Stener, M.; Aschi, M. A computational approach for modeling electronic circular dichroism of solvated chromophores. J. Comput. Chem. 2022, 43, 2023–2036. [Google Scholar] [CrossRef]
- Amadei, A.; Linssen, A.; Berendsen, H. Essential Dynamics of Proteins. Proteins 1993, 17, 412–425. [Google Scholar] [CrossRef] [PubMed]
- Daidone, I.; Amadei, A. Essential dynamics: Foundation and applications. WIREs Comput Mol. Sci. 2012, 2, 762–770. [Google Scholar] [CrossRef]
- Aschi, M.; Spezia, R.; Di Nola, A.; Amadei, A. A first-principles method to model perturbed electronic wavefunctions: The effect of an external homogeneous electric field. Chem. Phys. Lett. 2001, 344, 374–380. [Google Scholar] [CrossRef]
- Amadei, A.; D’Alessandro, M.; D’Abramo, M.; Aschi, M. Theoretical Characterization of Electronic States in Interacting Chemical Systems. J. Chem. Phys. 2009, 130, 084109. [Google Scholar] [CrossRef] [PubMed]
- Zanetti-Polzi, L.; Del Galdo, S.; Daidone, I.; D’Abramo, M.; Barone, V.; Aschi, M.; Amadei, A. Extending the perturbed matrix method beyond the dipolar approximation: Comparison of different levels of theory. Phys. Chem. Chem. Phys. 2018, 20, 24369–24378. [Google Scholar] [CrossRef] [PubMed]
- Nelson, R.G.; Johnson, W.C., Jr. Optical properties of sugars. I. Circular dichroism of monomers at equilibrium. J. Am. Chem. Soc. 1972, 94, 3343–3345. [Google Scholar] [CrossRef]
- Nelson, R.G.; Johnson, W.C., Jr. Optical properties of sugars. 3. Circular dichroism of aldo- and ketopyranose anomers. J. Am. Chem. Soc. 1976, 98, 4290–4295. [Google Scholar] [CrossRef]
- Karabulut, S.; Leszczynski, J. Anomeric and rotameric preference of glucopyranose in vacuo, water and organic solvents. J. Mol. Model. 2013, 19, 3637–3645. [Google Scholar] [CrossRef]
- Nelson, R.G.; Johnson, W.C., Jr. Optical properties of sugars. 4. Circular dichroism of methyl aldopyranosides. J. Am. Chem. Soc. 1976, 98, 4296–4301. [Google Scholar] [CrossRef]
- Bertucci, C.; Salvadori, P.; Giampaolo, Z.; Pini, D.; Johnson, W.C., Jr. Circular dichroism spectra of some model compounds related to D-glucopyranose and D-galactopyranose. Carbohydr. Chem. 1986, 149, 299–307. [Google Scholar] [CrossRef] [PubMed]
- Matsuo, K.; Gekko, K. Vacuum Ultraviolet Electronic Circular Dichroism Study of d-glucose in Aqueous Solution. J. Phys. Chem. A 2020, 124, 642–651. [Google Scholar] [CrossRef]
- Cramer, C.; Truhlar, D.G. Quantum Chemical conformational analysis of glucose in aqueous solution. J. Am. Chem. Soc. 1993, 115, 5745–5753. [Google Scholar] [CrossRef]
- Barnett, C.B.; Naidoo, K.J. Stereoelectronic and solvation effects determine hydroxymethyl conformational preferences in monosaccharides. J. Phys. Chem. B 2008, 112, 15450–15459. [Google Scholar] [CrossRef]
- Nishida, Y.; Ohrui, H.; Meguro, H. 1H-NMR studies of (6r)- and (6s)-deuterated d-hexoses: Assignment of the preferred rotamers about C5–C6 bond of d-glucose and d-galactose derivatives in a solutions. Tetrahedron Lett. 1984, 25, 1575–1578. [Google Scholar] [CrossRef]
- Molteni, C.; Parrinello, M. Glucose in aqueous solution by first principles molecular dynamics. J. Am. Chem. Soc. 1998, 120, 2168–2171. [Google Scholar] [CrossRef]
- Ha, S.; Gao, J.; Tidor, B.; Brady, J.W.; Karplus, M. Solvent effect on the anomeric equilibrium in d-glucose: A free energy simulation analysis. J. Am. Chem. Soc. 1991, 113, 1553–1557. [Google Scholar] [CrossRef]
- D’Alessandro, M.; Aschi, M.; Mazzuca, C.; Palleschi, A.; Amadei, A. Theoretical modeling of UV-Vis absorption and emission spectra in liquid state systems including vibrational and conformational effects: The vertical transition approximation. J. Chem. Phys. 2013, 139, 114102. [Google Scholar] [CrossRef]
- Senn, H.M.; Thiel, W. Thiel QM/MM methods for biomolecular systems. Angew. Chem. 2009, 48, 1198–1229. [Google Scholar] [CrossRef] [PubMed]
- Amadei, A.; Aschi, M. Stationary and Time-Dependent Carbon Monoxide Stretching Mode Features in Carboxy Myoglobin: A Theoretical-Computational Reappraisal. J. Phys. Chem. B 2021, 125, 13624–13634. [Google Scholar] [CrossRef] [PubMed]
- Chen, C.G.; Aschi, M.; D’Abramo, M.; Amadei, A. A simplified Treatment foe Efficiently Modelling the Spectral Signal of Vibronic Transitions: Application to aqueous indole. Molecules 2022, 27, 8135. [Google Scholar] [CrossRef]
- Kosaka, A.; Aida, M.; Katsumoto, Y. Reconsidering the activation entropy for anomerization of glucose and mannose in water studied by NMR spectroscopy. J. Mol. Struct. 2015, 1093, 195–200. [Google Scholar] [CrossRef]
- Collins, P.M.; Ferrier, R.J. Monosaccharides; John Wiley Sons: New York, NY, USA, 1995. [Google Scholar]
- Van der Spoel, D.; Lindahl, E.; Hess, B.; van Buuren, A.R.; Apol, E.; Meulenhoff, P.J.; Sijbers, A.L.T.M.; Feenstra, K.A.; van Drunen, R.; Berendsen, H.J.C. Gromacs User Manual Version 4.5.6. 2020. Available online: www.gromacs.org (accessed on 1 January 2010).
- Berendsen, H.J.C.; van der Spoel, D.; van Druned, R. GROMACS: A message-passing parallel molecular dynamics implementation. Comput. Phys. Commun. 1995, 91, 43–56. [Google Scholar] [CrossRef]
- Berendsen, H.J.C.; Postma, J.P.M.; van Gunsteren, W.F.; Hermans, J. Intermolecular Forces; Pullman, B., Ed.; Reidel: Dordrecht, The Netherlands, 1981; p. 31. [Google Scholar]
- Van Gunsteren, W.F.; Billeter, S.R.; Eising, A.A.; Hünenberger, P.H.; Krüger, P.; Mark, A.E.; Scott, W.R.P.; Tironi, I.G. Biomolecular Simulation: The GROMOS96 Manual and User Guide; Hochschulverlag AG an der ETH Zürich: Zürich, Switzerland, 1996. [Google Scholar]
- Malde, A.K.; Zuo, L.; Breeze, M.; Stroet, M.; Poger, D.; Nair, P.C.; Oostenbrink, C.; Mark, A.E. An Automated force field Topology Builder (ATB) and repository: Version 1.0. J. Chem. Theory Comput. 2011, 7, 4026–4037. [Google Scholar] [CrossRef] [PubMed]
- Uddin, N.; Ghosh, M.K.; Choi, T.-H.; Choi, C.H. Gauche effects of glucopyranose by QM/MM-MD simulations. Theor. Chem. Acc. 2015, 134, 122. [Google Scholar] [CrossRef]
- Bussi, G.; Donadio, D.; Parrinello, M. Canonical sampling through velocity rescaling. J. Chem. Phys. 2017, 126, 014101–014109. [Google Scholar] [CrossRef] [PubMed]
- Hess, B.; Bekker, H.; Berendsen, H.J.C.; Frajie, J.C.E.M. LINCS: A linear constraint solver for molecular simulations. J. Comput. Chem. 1997, 81, 1463–1472. [Google Scholar] [CrossRef]
- Darden, T.A.; York, D.M.; Pedersen, L.G. Particle mesh Ewald: An Nlog(N) method for Ewald sums in large systems. J. Chem. Phys. 1993, 98, 10089–10092. [Google Scholar] [CrossRef]
- Gaussian 16; Revision A.03; Gaussian, Inc.: Wallingford, CT, USA, 2016.


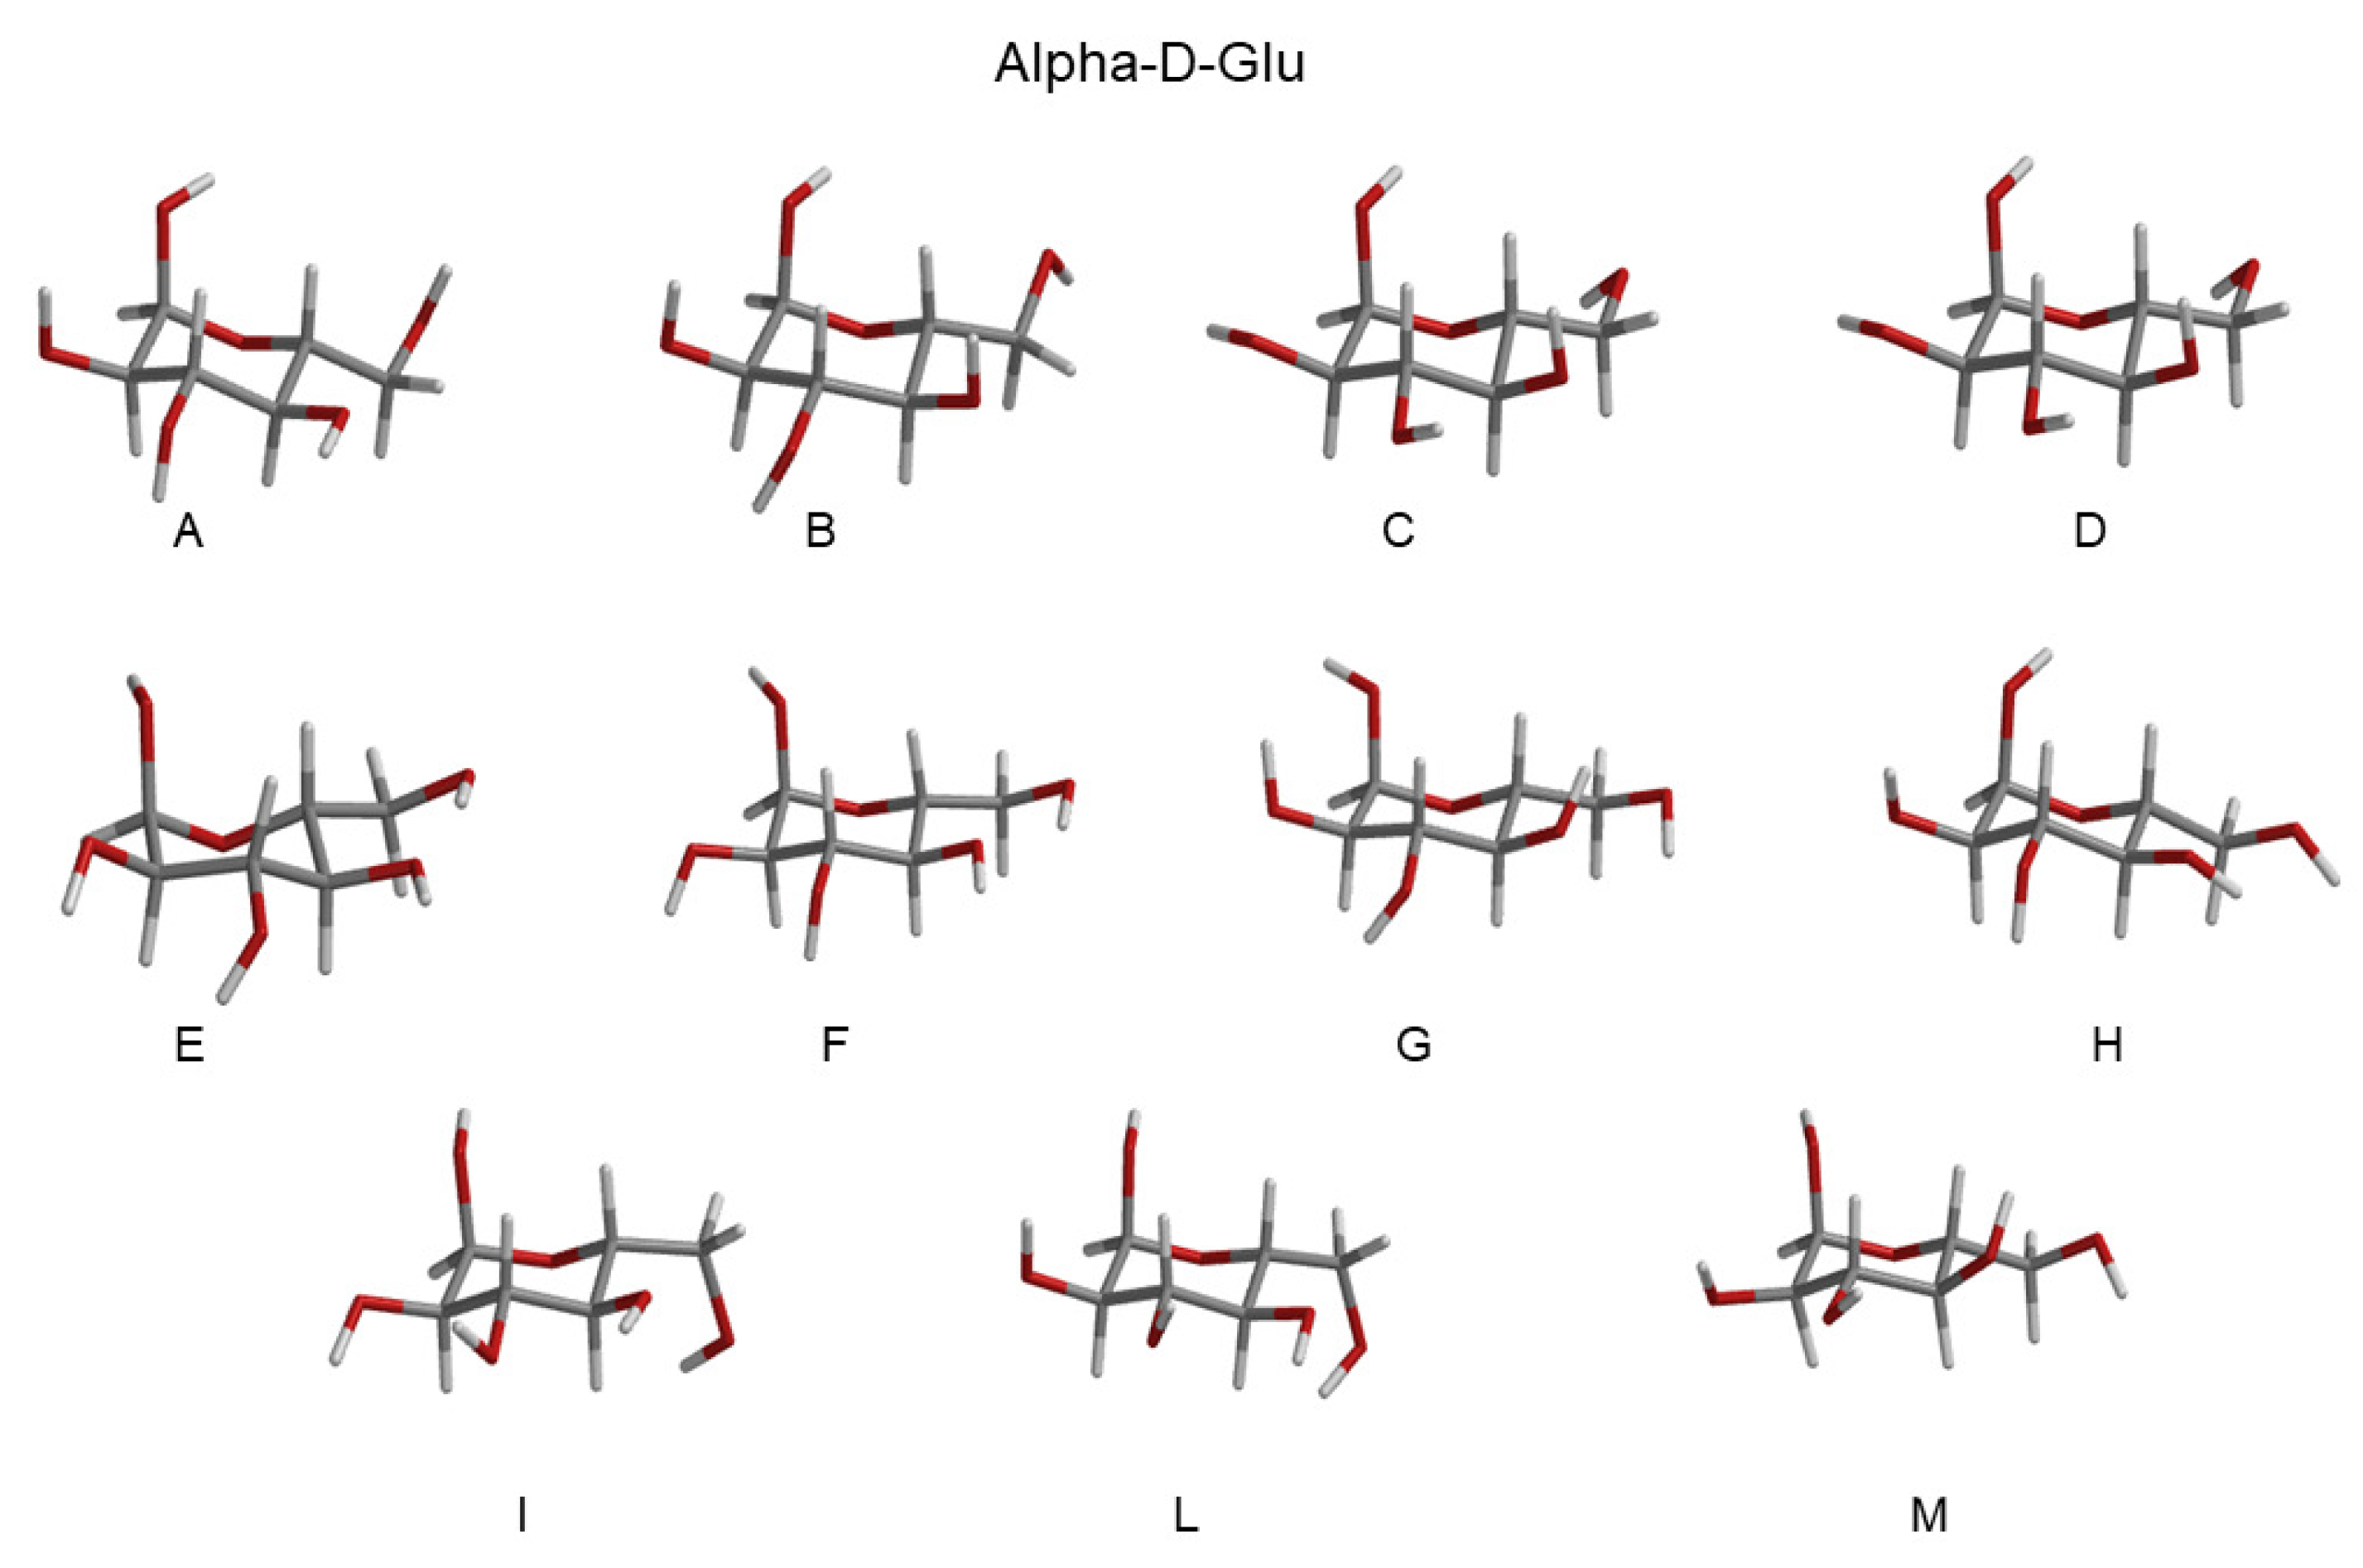
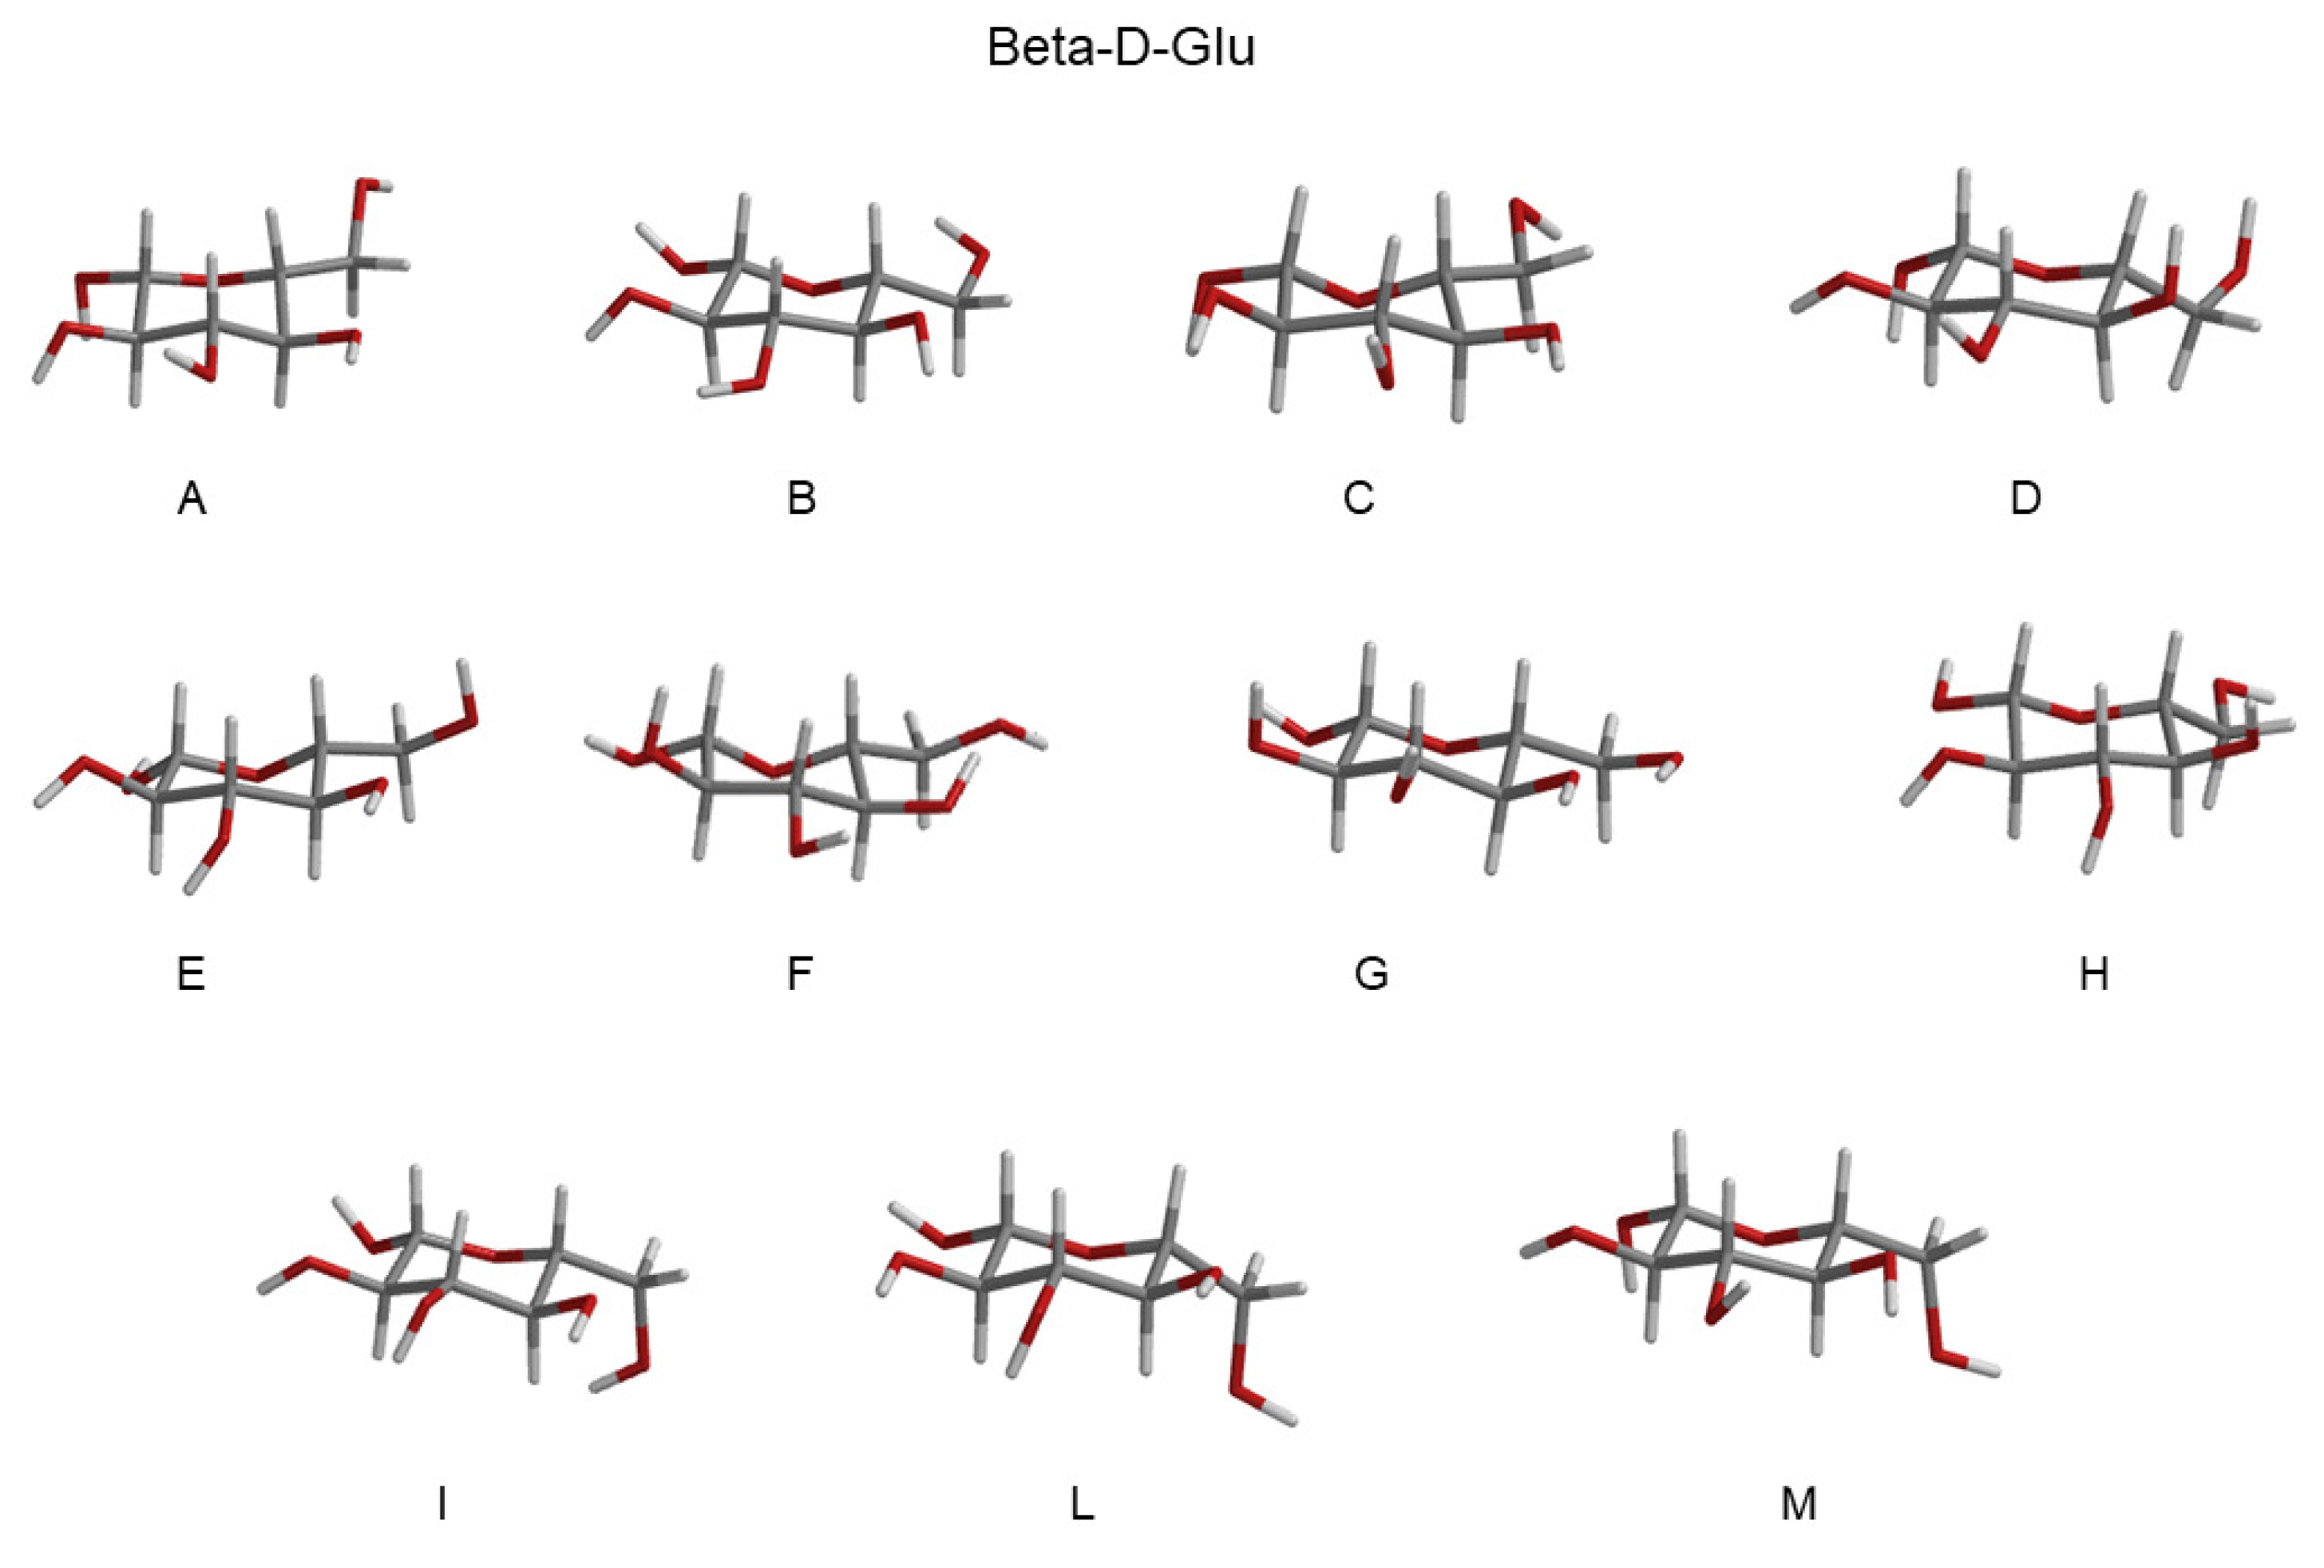
| RC-Conf Alpha-Glu | Probability | RC-Conf Beta-Glu | Probability |
|---|---|---|---|
| A (GT) | 0.10 | A (GG) | 0.10 |
| B (GT) | 0.10 | B (GG) | 0.10 |
| C (GT) | 0.09 | C (GG) | 0.11 |
| D (GT) | 0.13 | D (GG) | 0.10 |
| E (GG) | 0.10 | E (GT) | 0.13 |
| F (GG) | 0.09 | F (GT) | 0.14 |
| G (GG) | 0.09 | G (GT) | 0.13 |
| H (GG) | 0.08 | H (GG) | 0.07 |
| I (GG) | 0.10 | I (GG) | 0.04 |
| L (GG) | 0.10 | L (GG) | 0.04 |
| M (GG) | 0.11 | M (GG) | 0.04 |
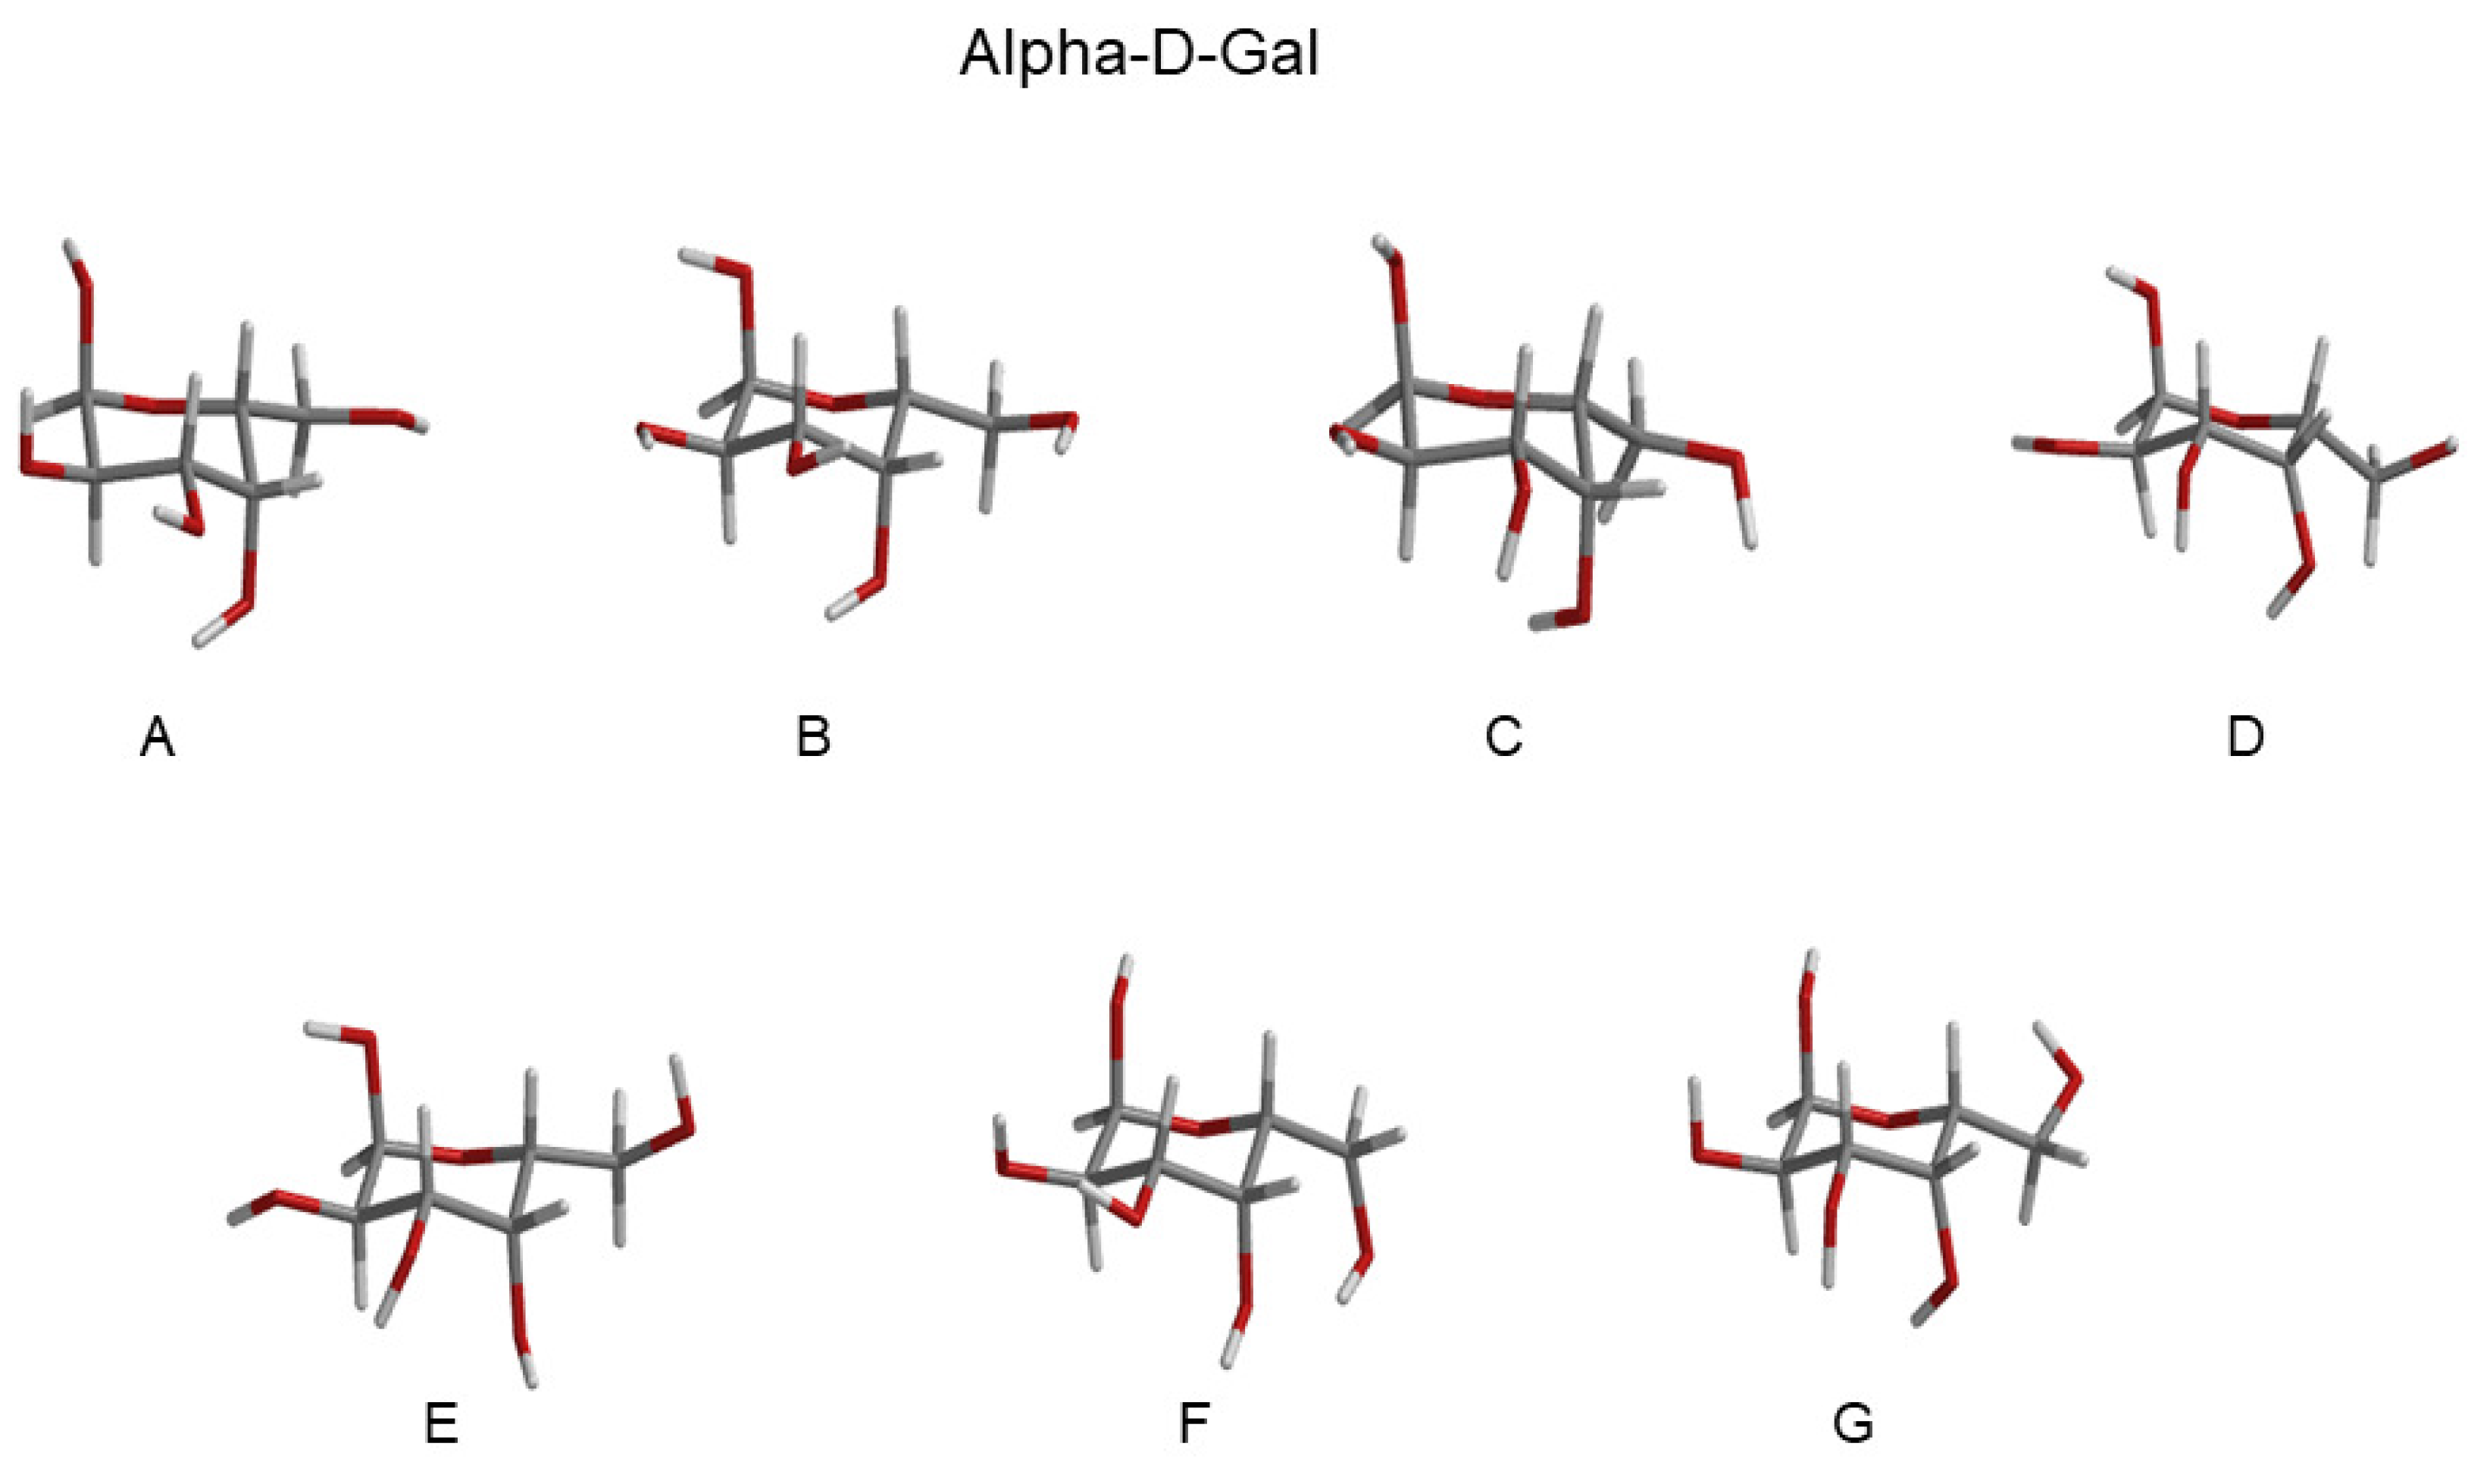
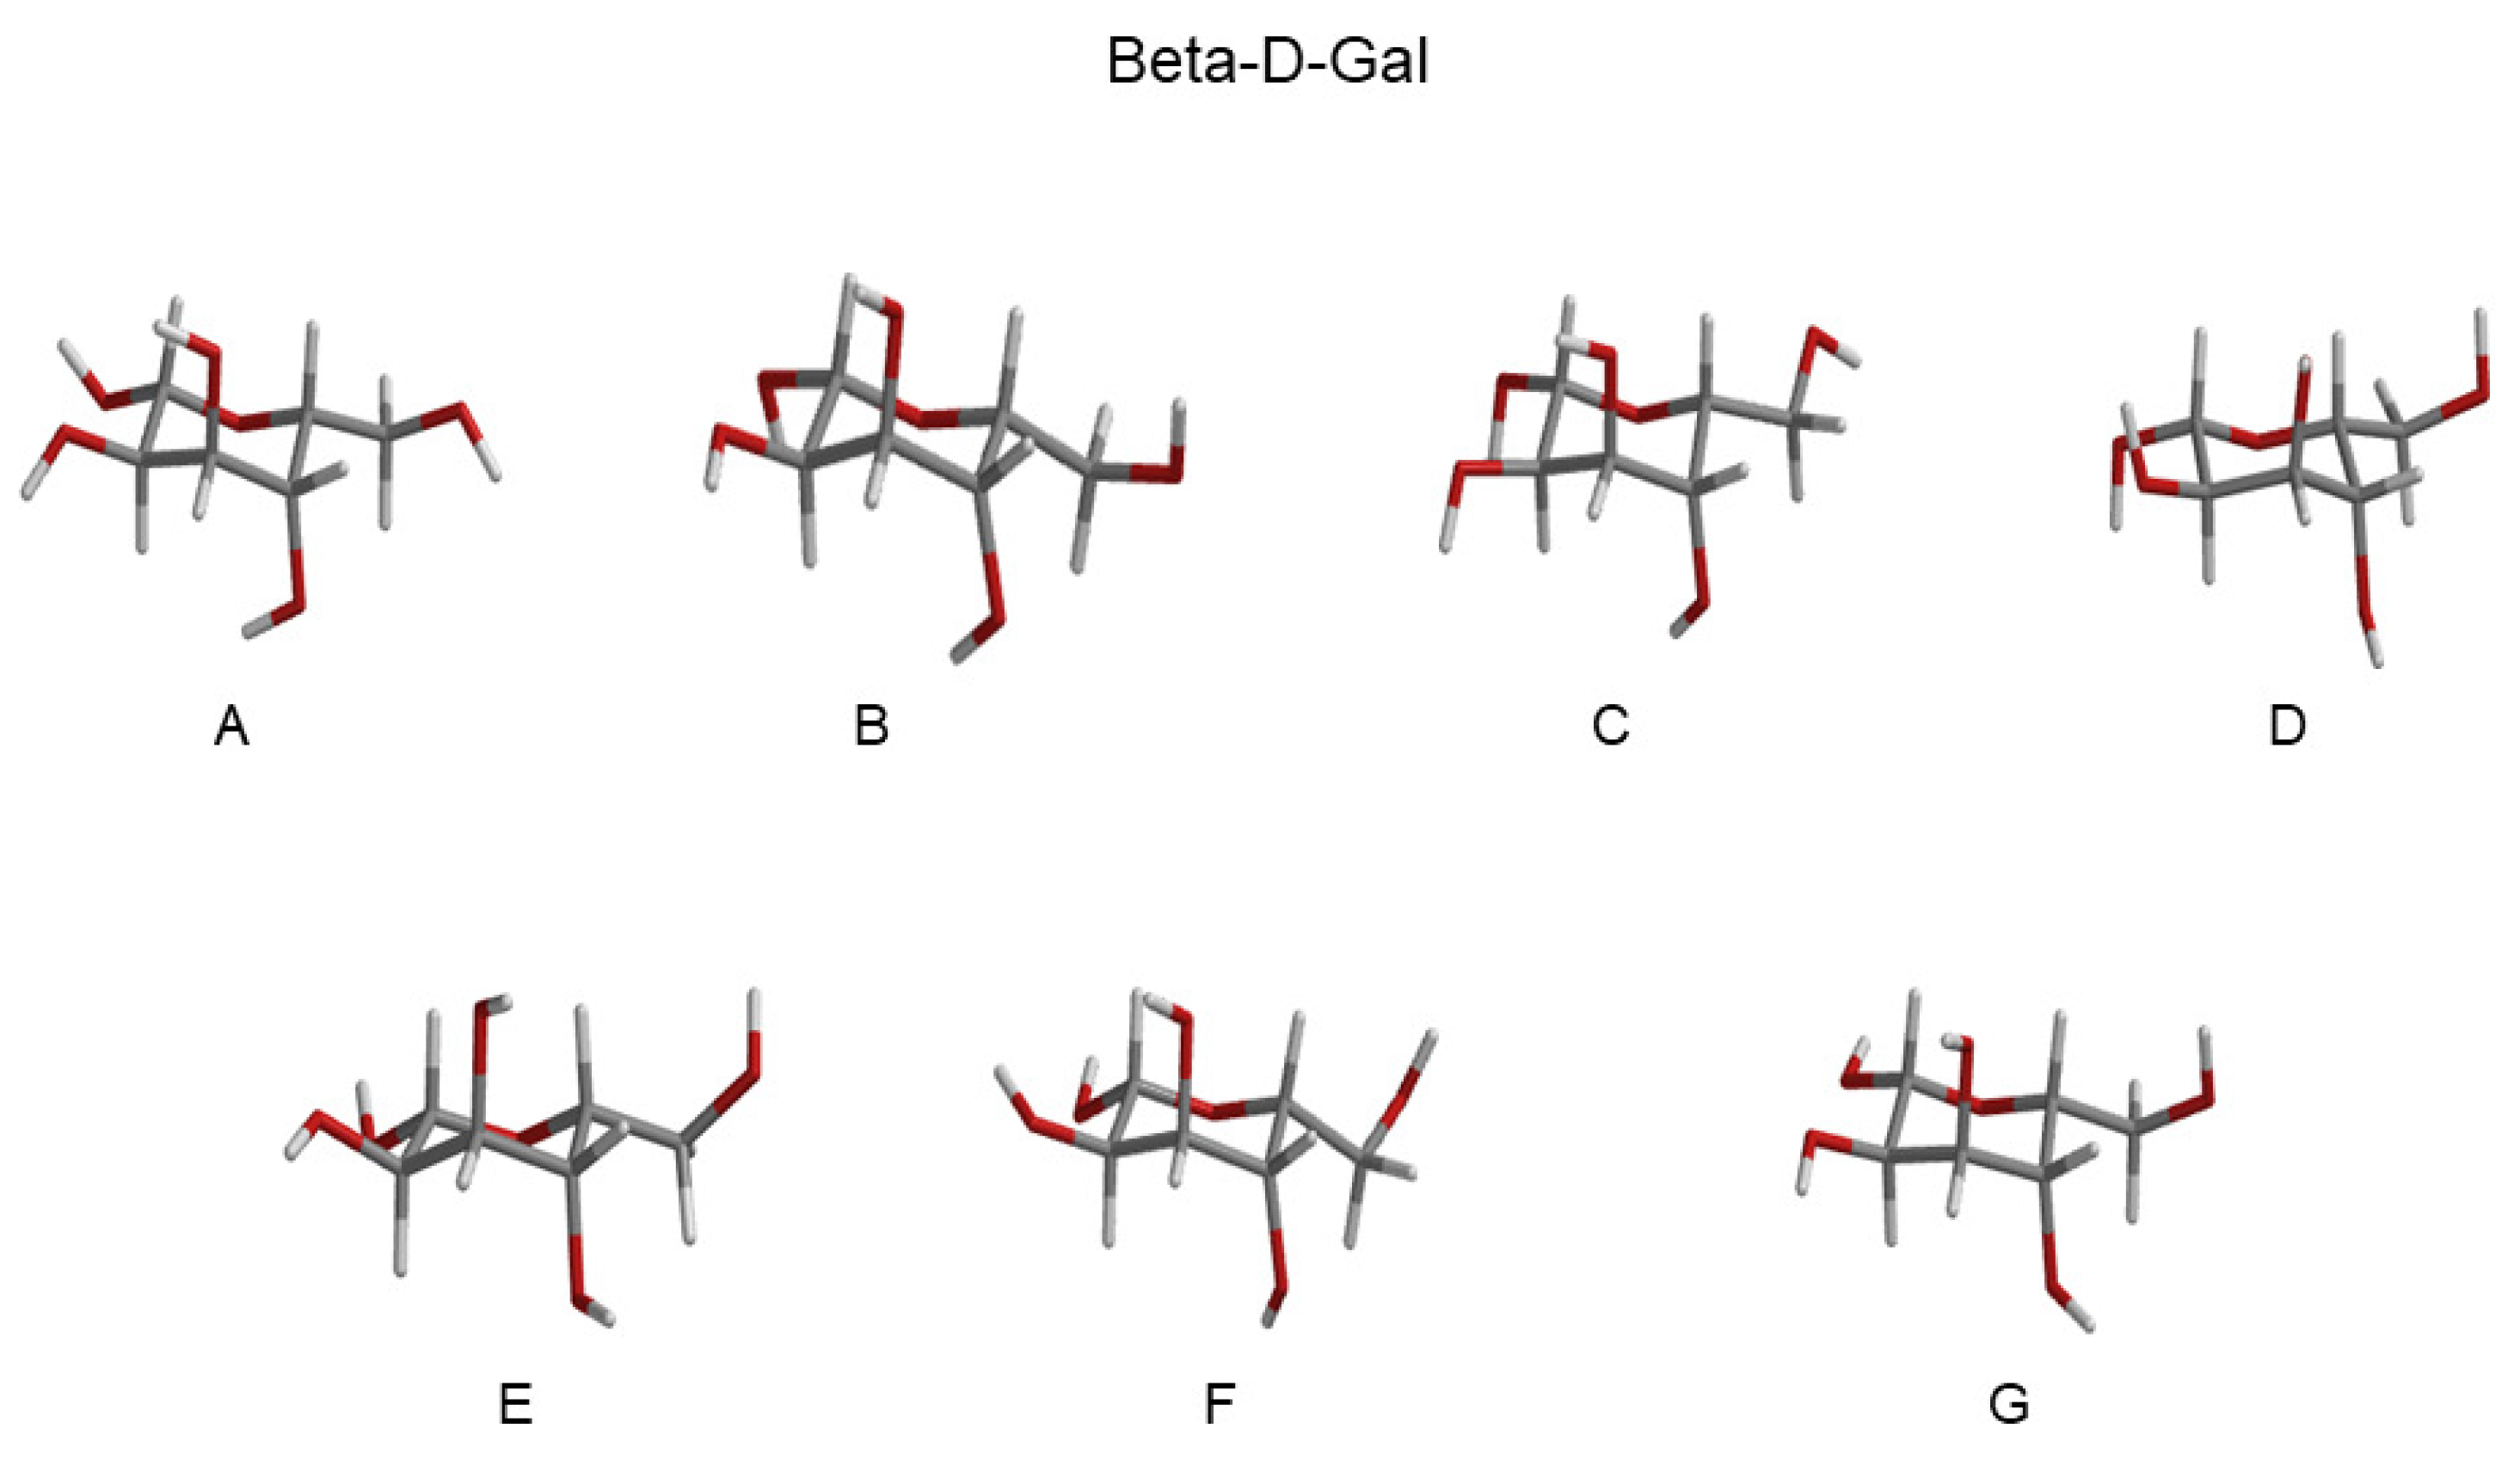
| RC Alpha-Gal (Basin) | Probability | RC Beta-Gal (Basin) | Probability |
|---|---|---|---|
| A (GT) | 0.15 | A (GT) | 0.09 |
| B (GT) | 0.15 | B (GT) | 0.16 |
| C (GT) | 0.12 | C (GT) | 0.13 |
| D (GT) | 0.15 | D (GT) | 0.12 |
| E (GG) | 0.19 | E (GG) | 0.19 |
| F (GG) | 0.19 | F (GG) | 0.18 |
| G (GG) | 0.05 | G (GG) | 0.07 |
Disclaimer/Publisher’s Note: The statements, opinions and data contained in all publications are solely those of the individual author(s) and contributor(s) and not of MDPI and/or the editor(s). MDPI and/or the editor(s) disclaim responsibility for any injury to people or property resulting from any ideas, methods, instructions or products referred to in the content. |
© 2023 by the authors. Licensee MDPI, Basel, Switzerland. This article is an open access article distributed under the terms and conditions of the Creative Commons Attribution (CC BY) license (https://creativecommons.org/licenses/by/4.0/).
Share and Cite
Aschi, M.; Palombi, L.; Amadei, A. Theoretical–Computational Modeling of CD Spectra of Aqueous Monosaccharides by Means of Molecular Dynamics Simulations and Perturbed Matrix Method. Molecules 2023, 28, 3591. https://doi.org/10.3390/molecules28083591
Aschi M, Palombi L, Amadei A. Theoretical–Computational Modeling of CD Spectra of Aqueous Monosaccharides by Means of Molecular Dynamics Simulations and Perturbed Matrix Method. Molecules. 2023; 28(8):3591. https://doi.org/10.3390/molecules28083591
Chicago/Turabian StyleAschi, Massimiliano, Laura Palombi, and Andrea Amadei. 2023. "Theoretical–Computational Modeling of CD Spectra of Aqueous Monosaccharides by Means of Molecular Dynamics Simulations and Perturbed Matrix Method" Molecules 28, no. 8: 3591. https://doi.org/10.3390/molecules28083591