

Computational Approaches for Identification of Potential Plant Bioactives as Novel G6PD Inhibitors Using Advanced Tools and Databases


Abstract
:1. Introduction
2. Materials and Methods
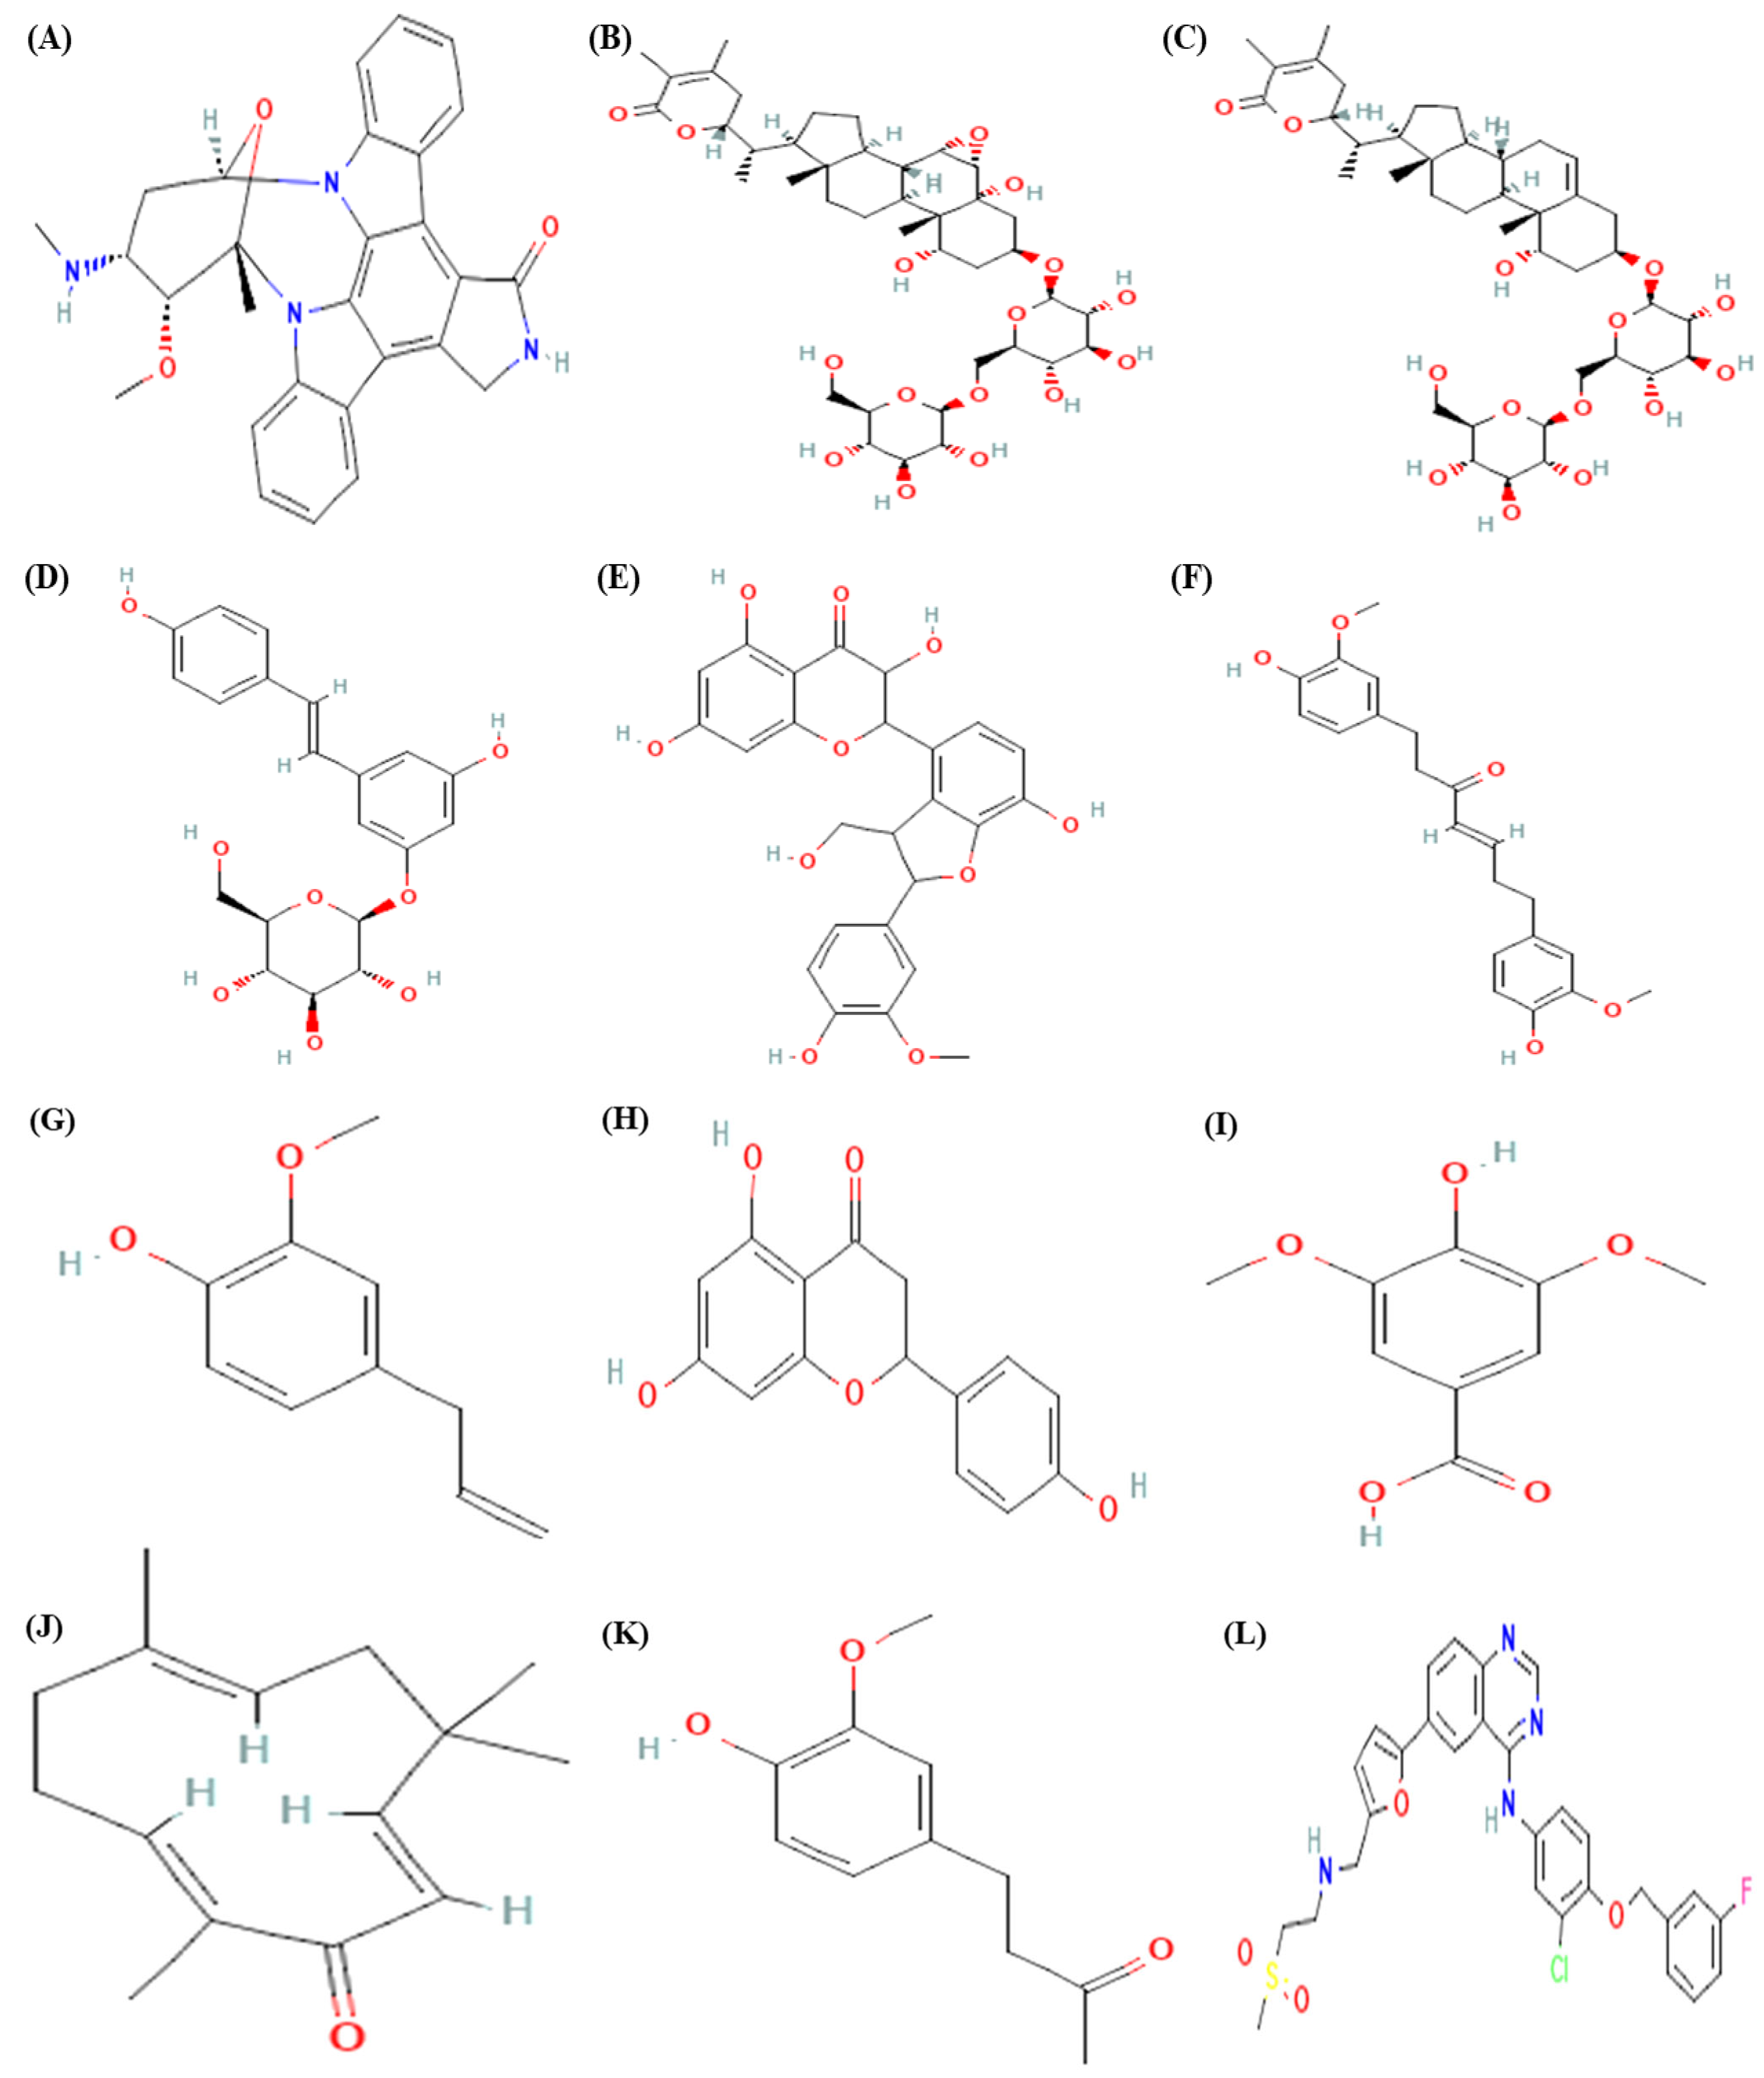
2.1. Ligand Selection
2.2. Online Smiles Translator
2.3. ADMET Analysis
2.4. Toxicity Analysis
2.5. Molecular Docking
2.6. Inhibition Constant
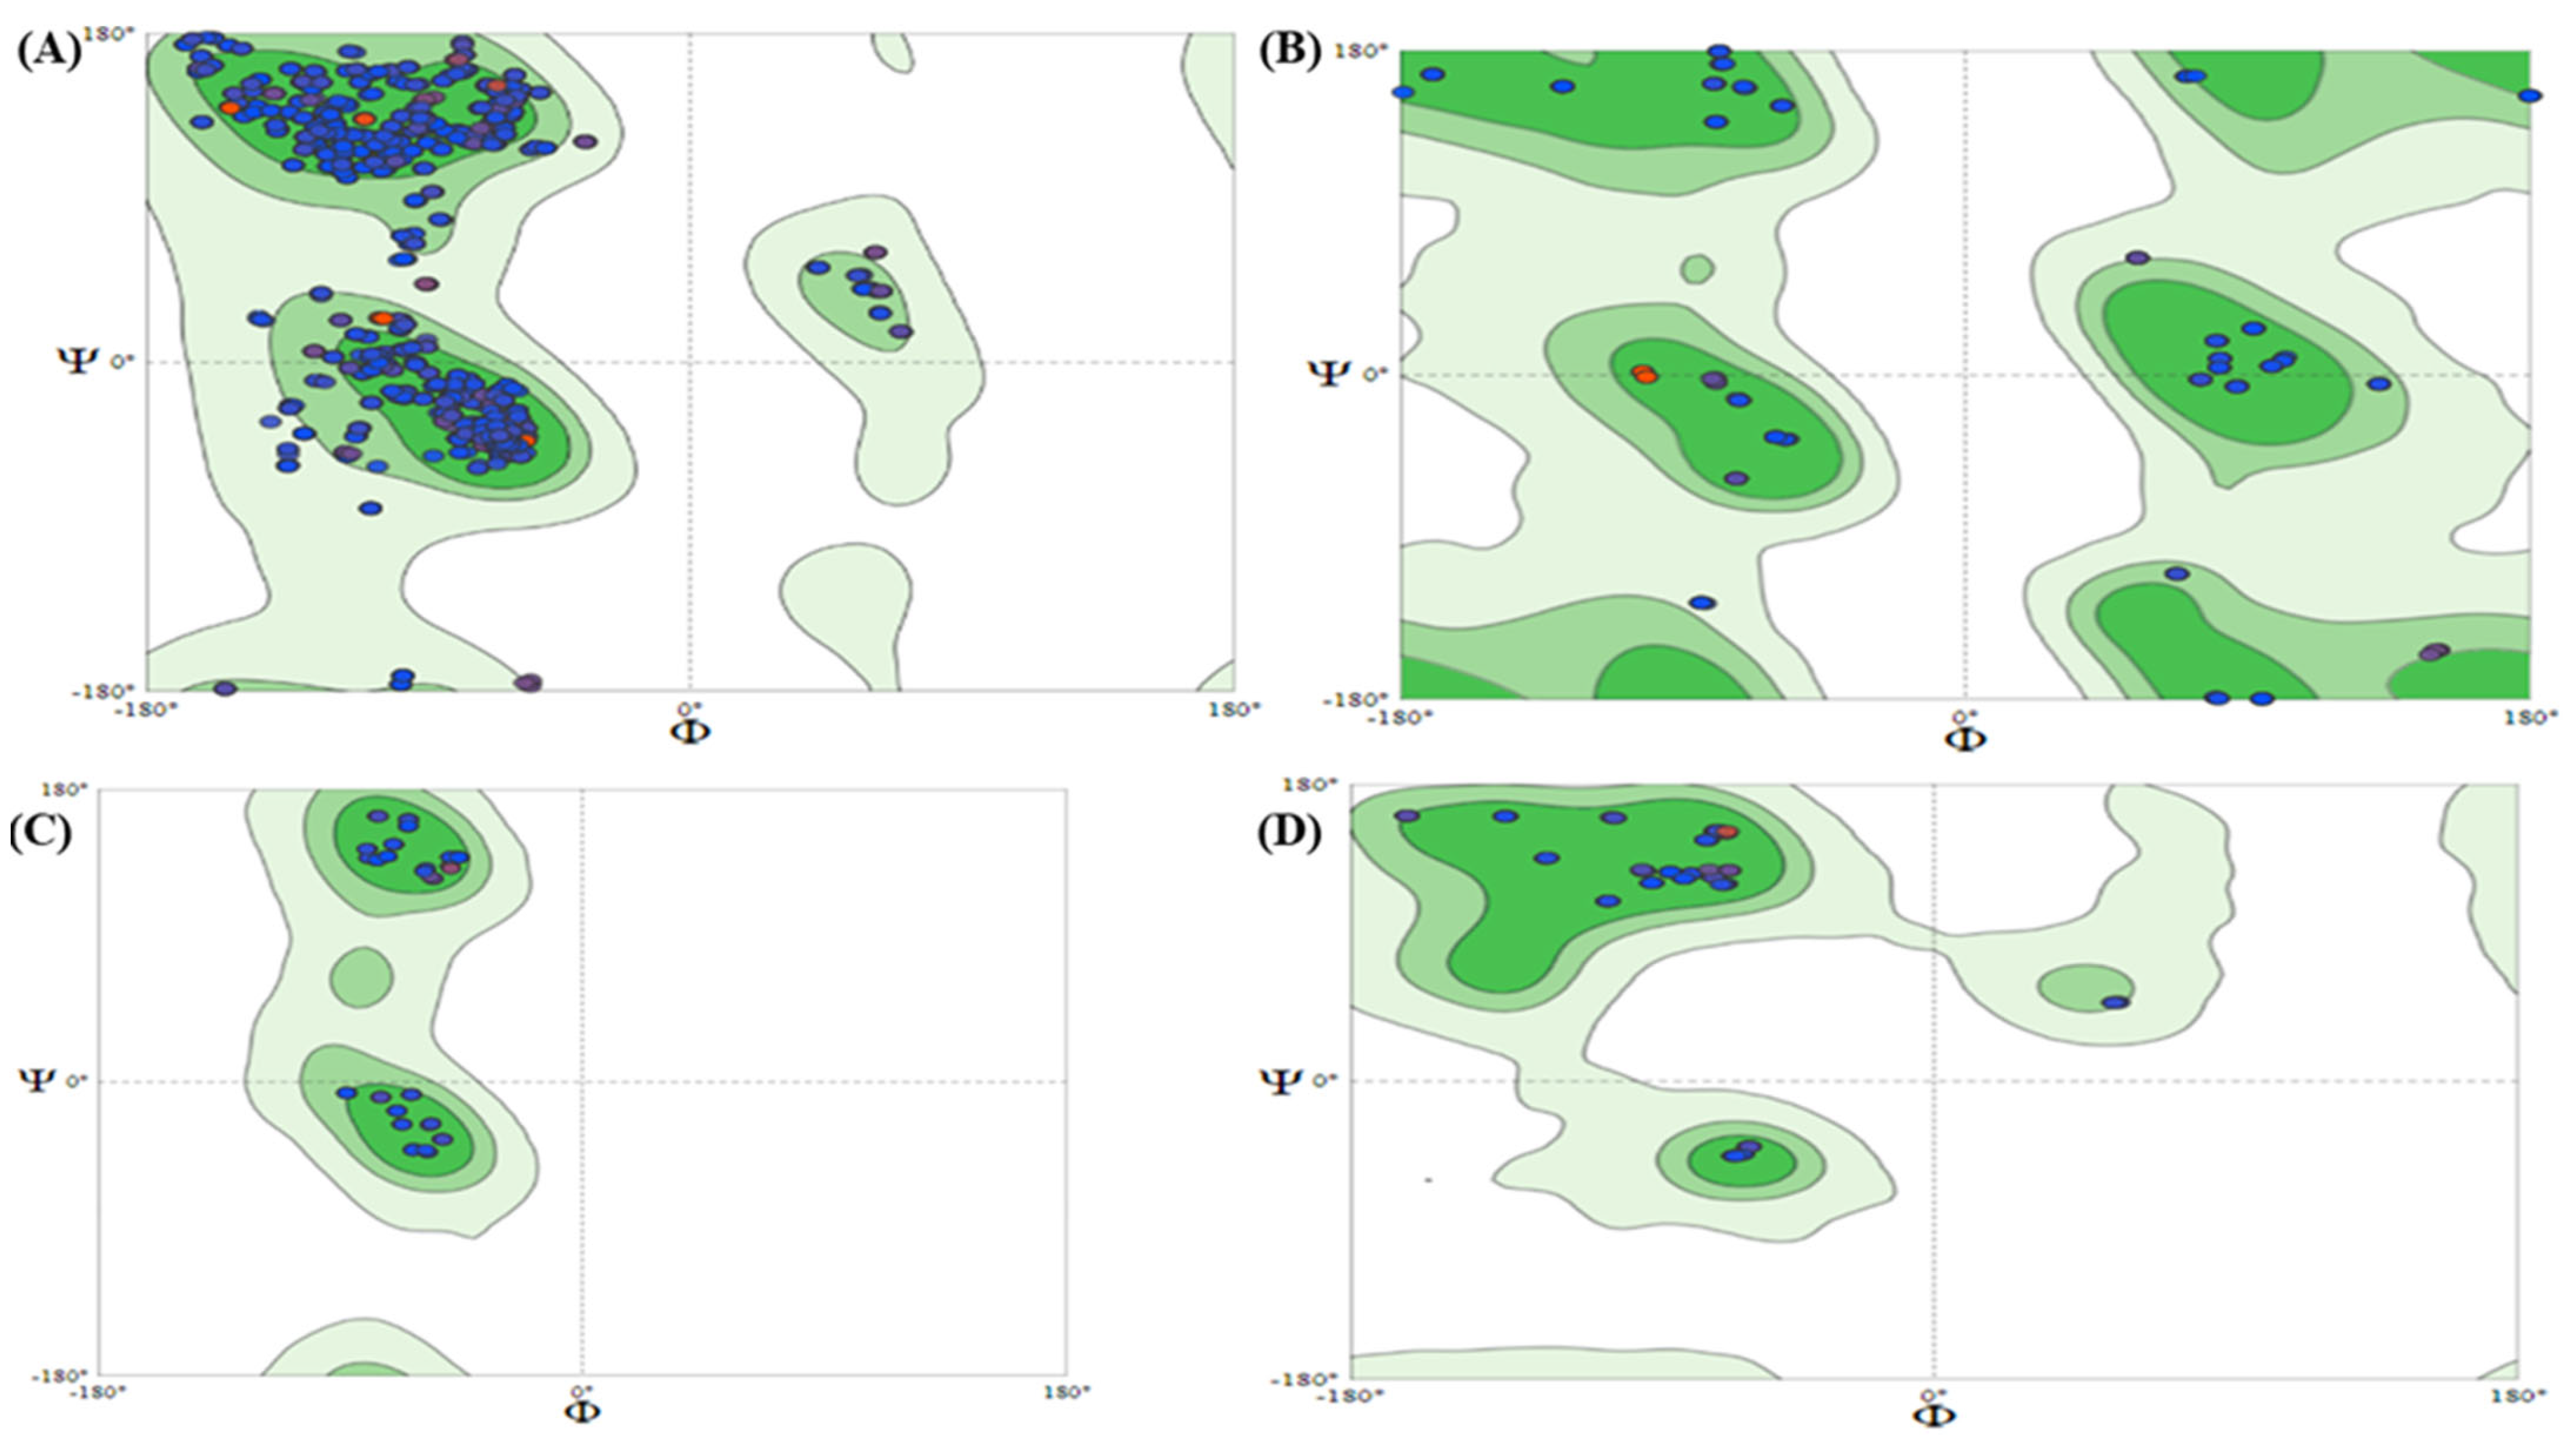
2.7. Structural Analysis
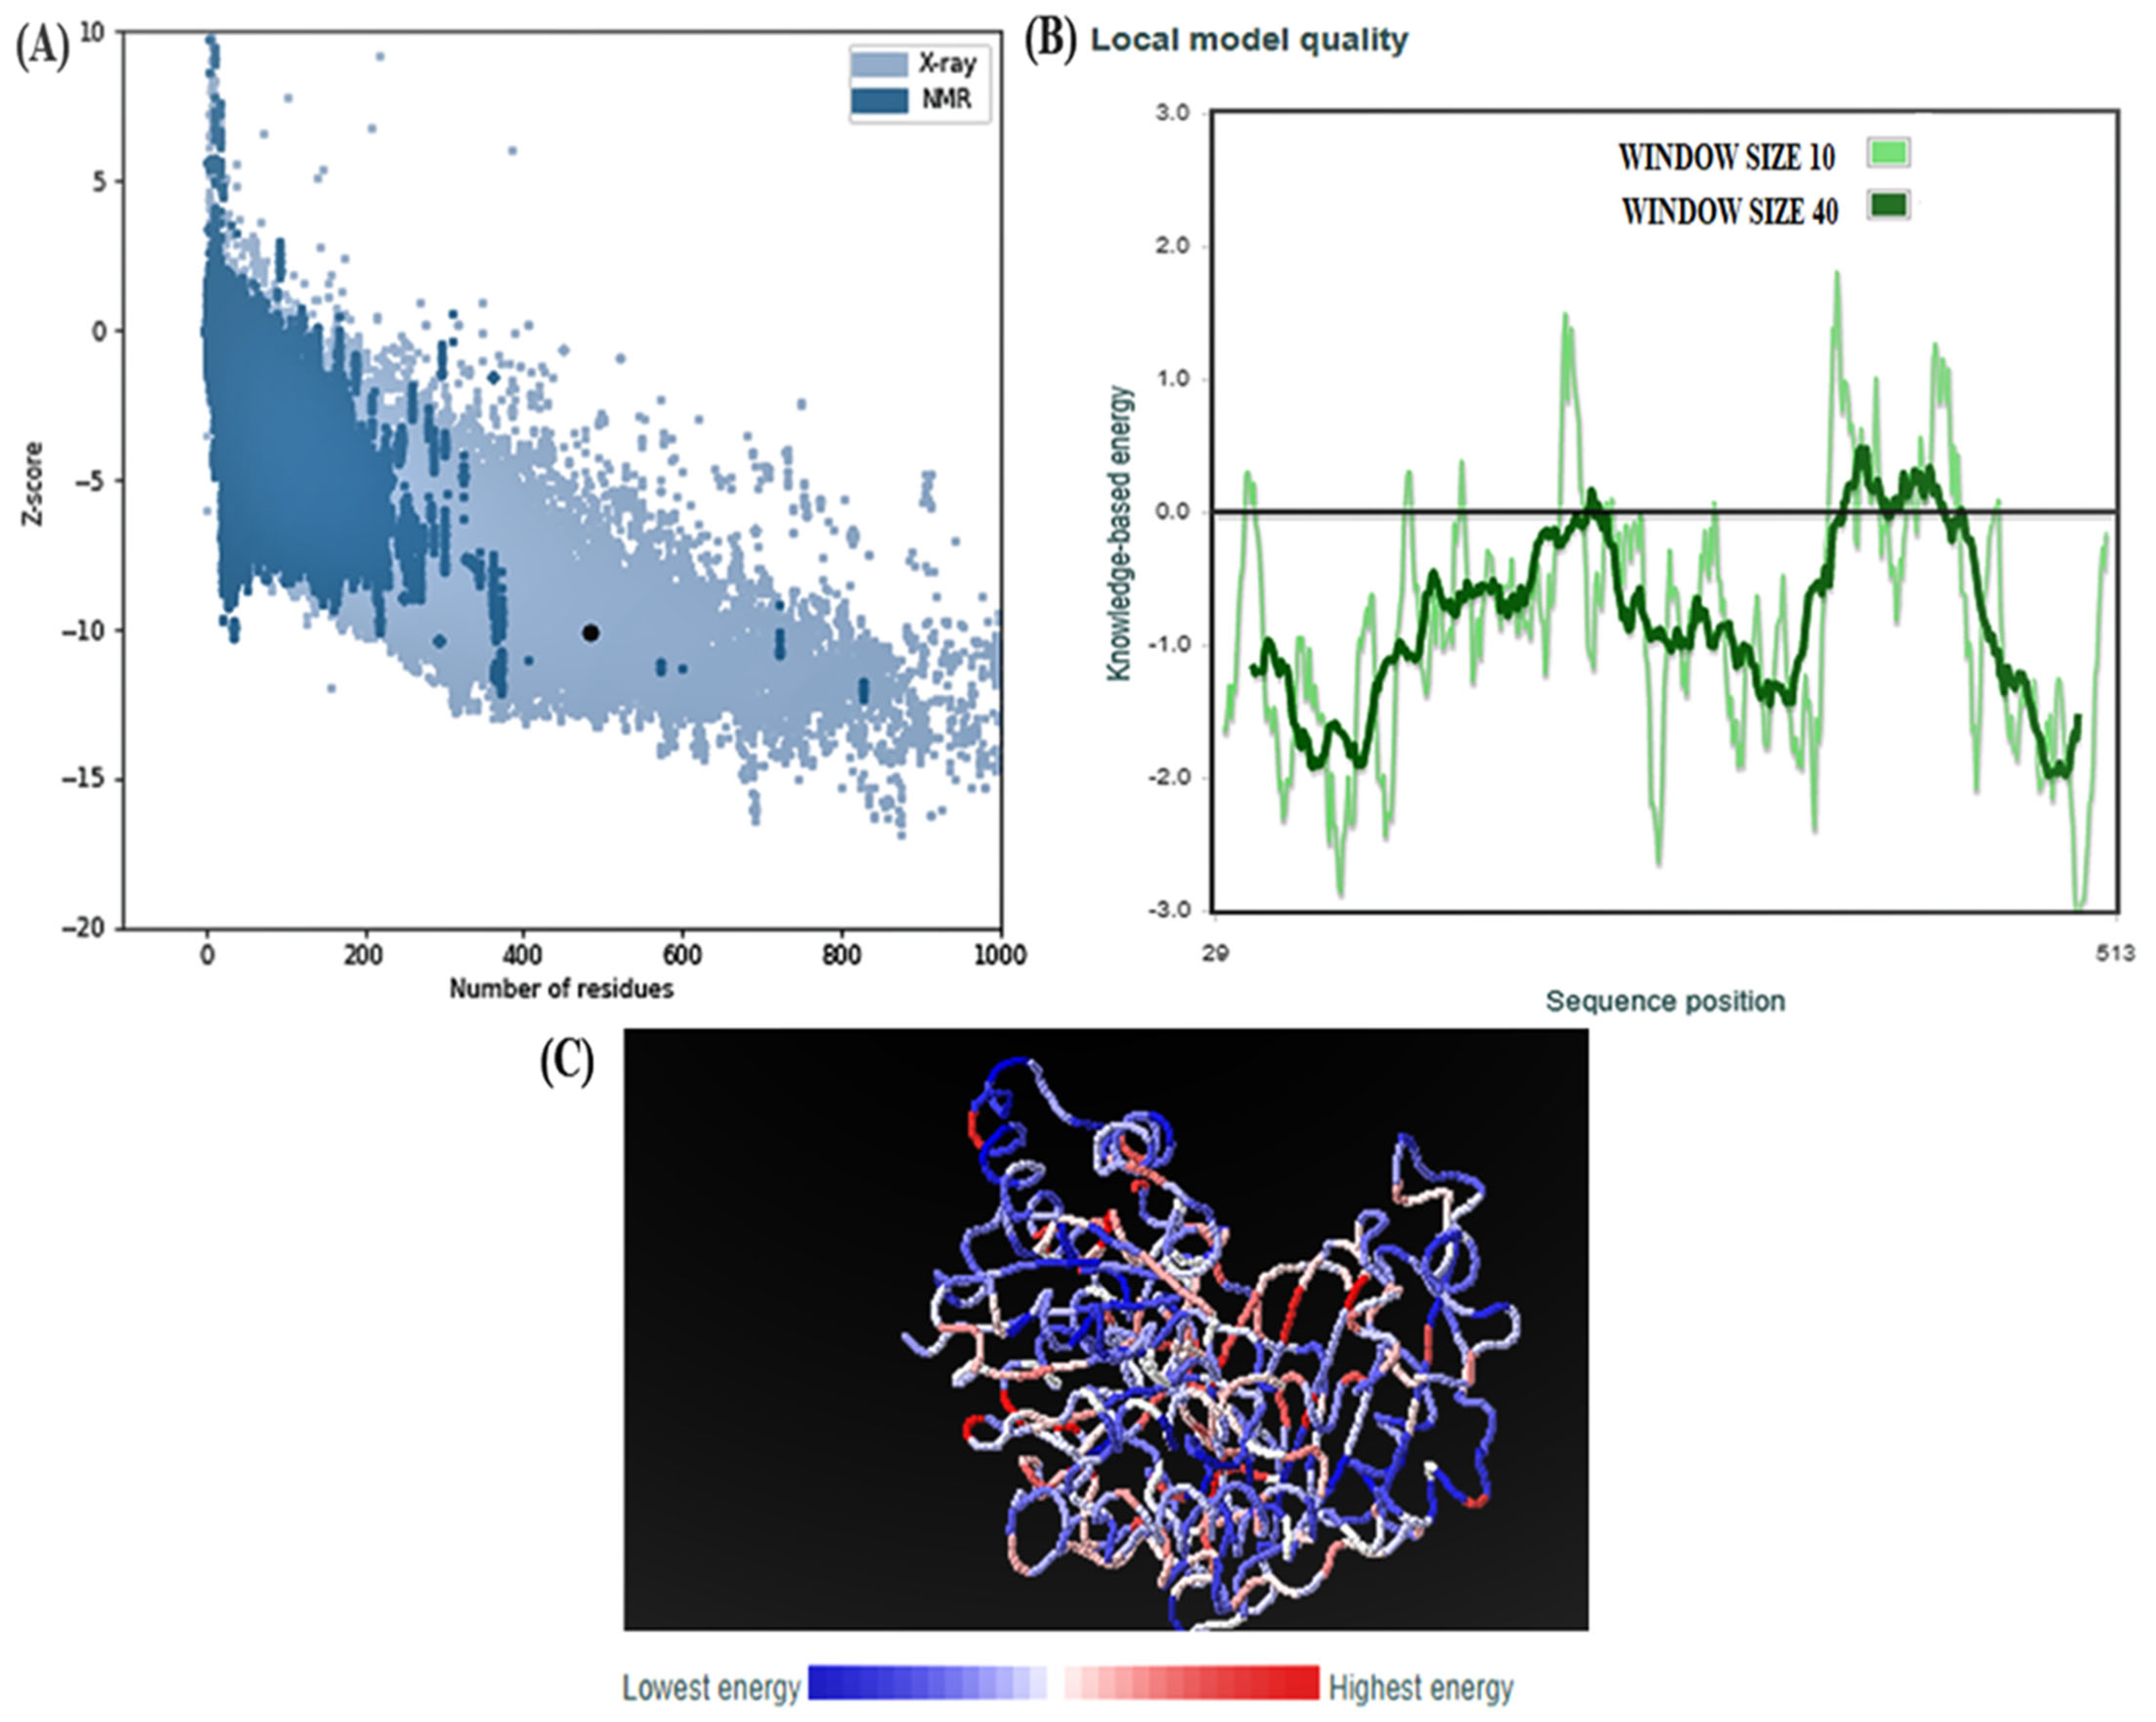
2.8. ProSAweb
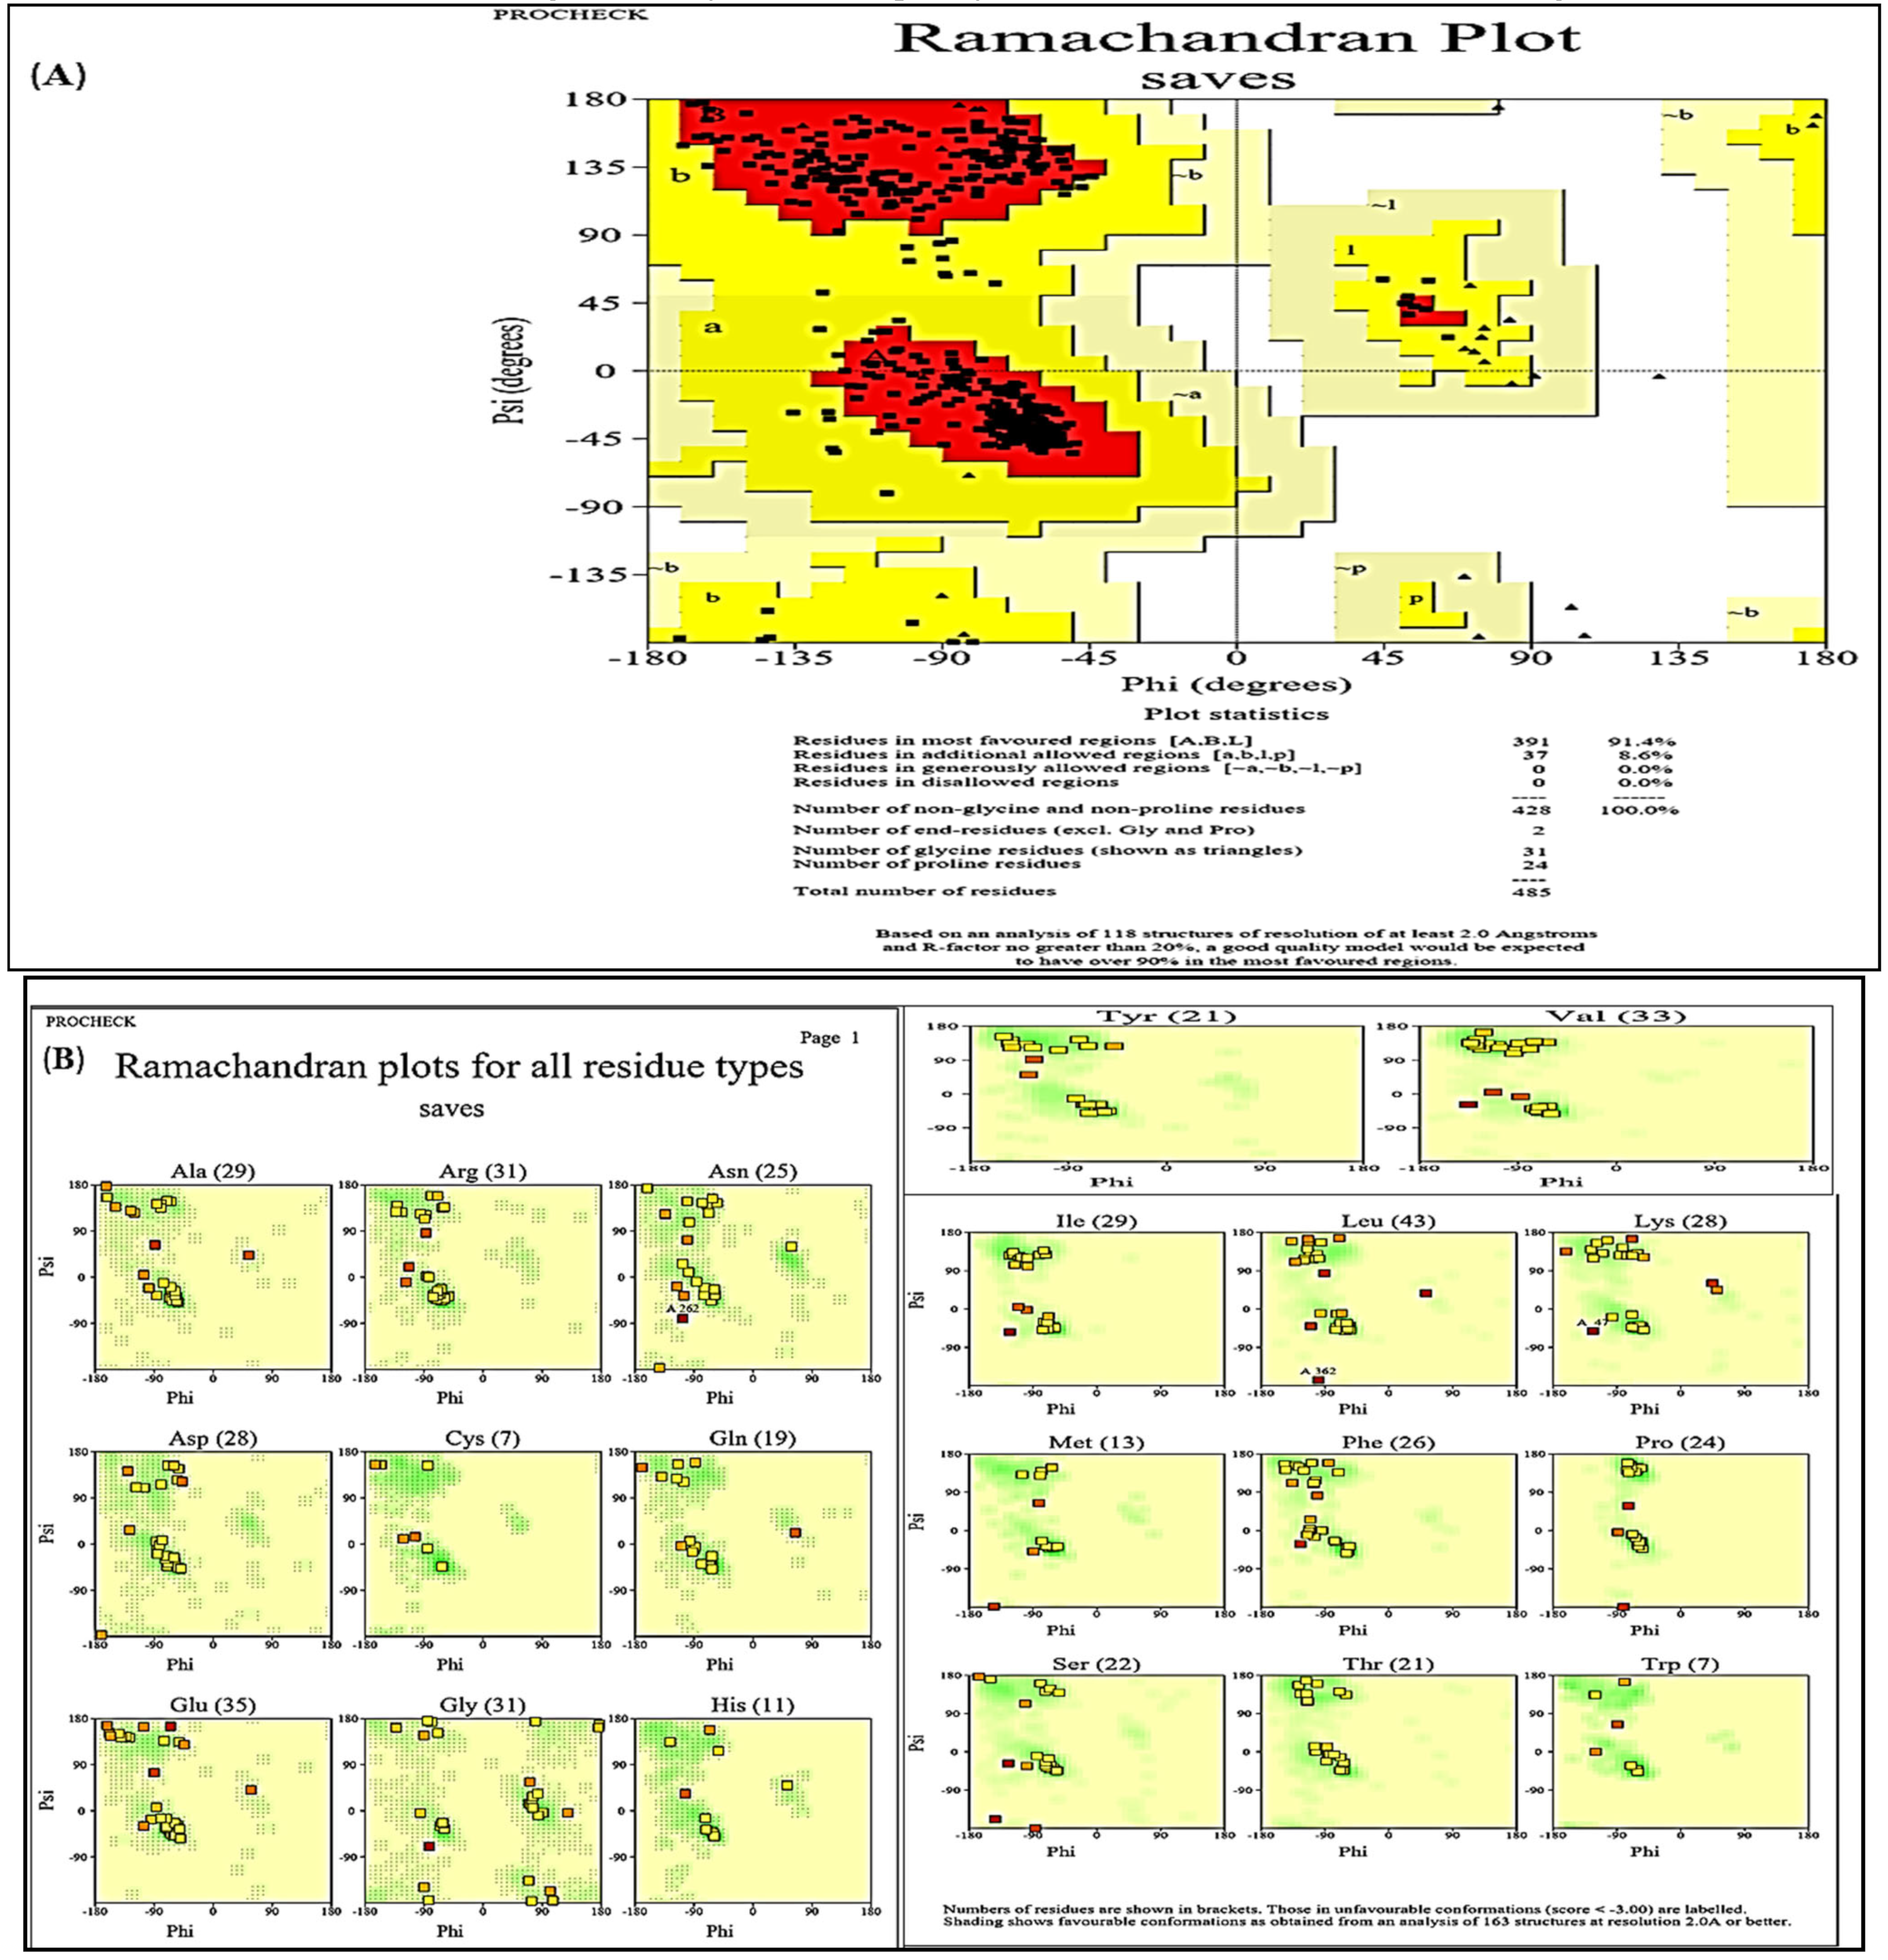
2.9. PROCHECK
2.10. iMODS
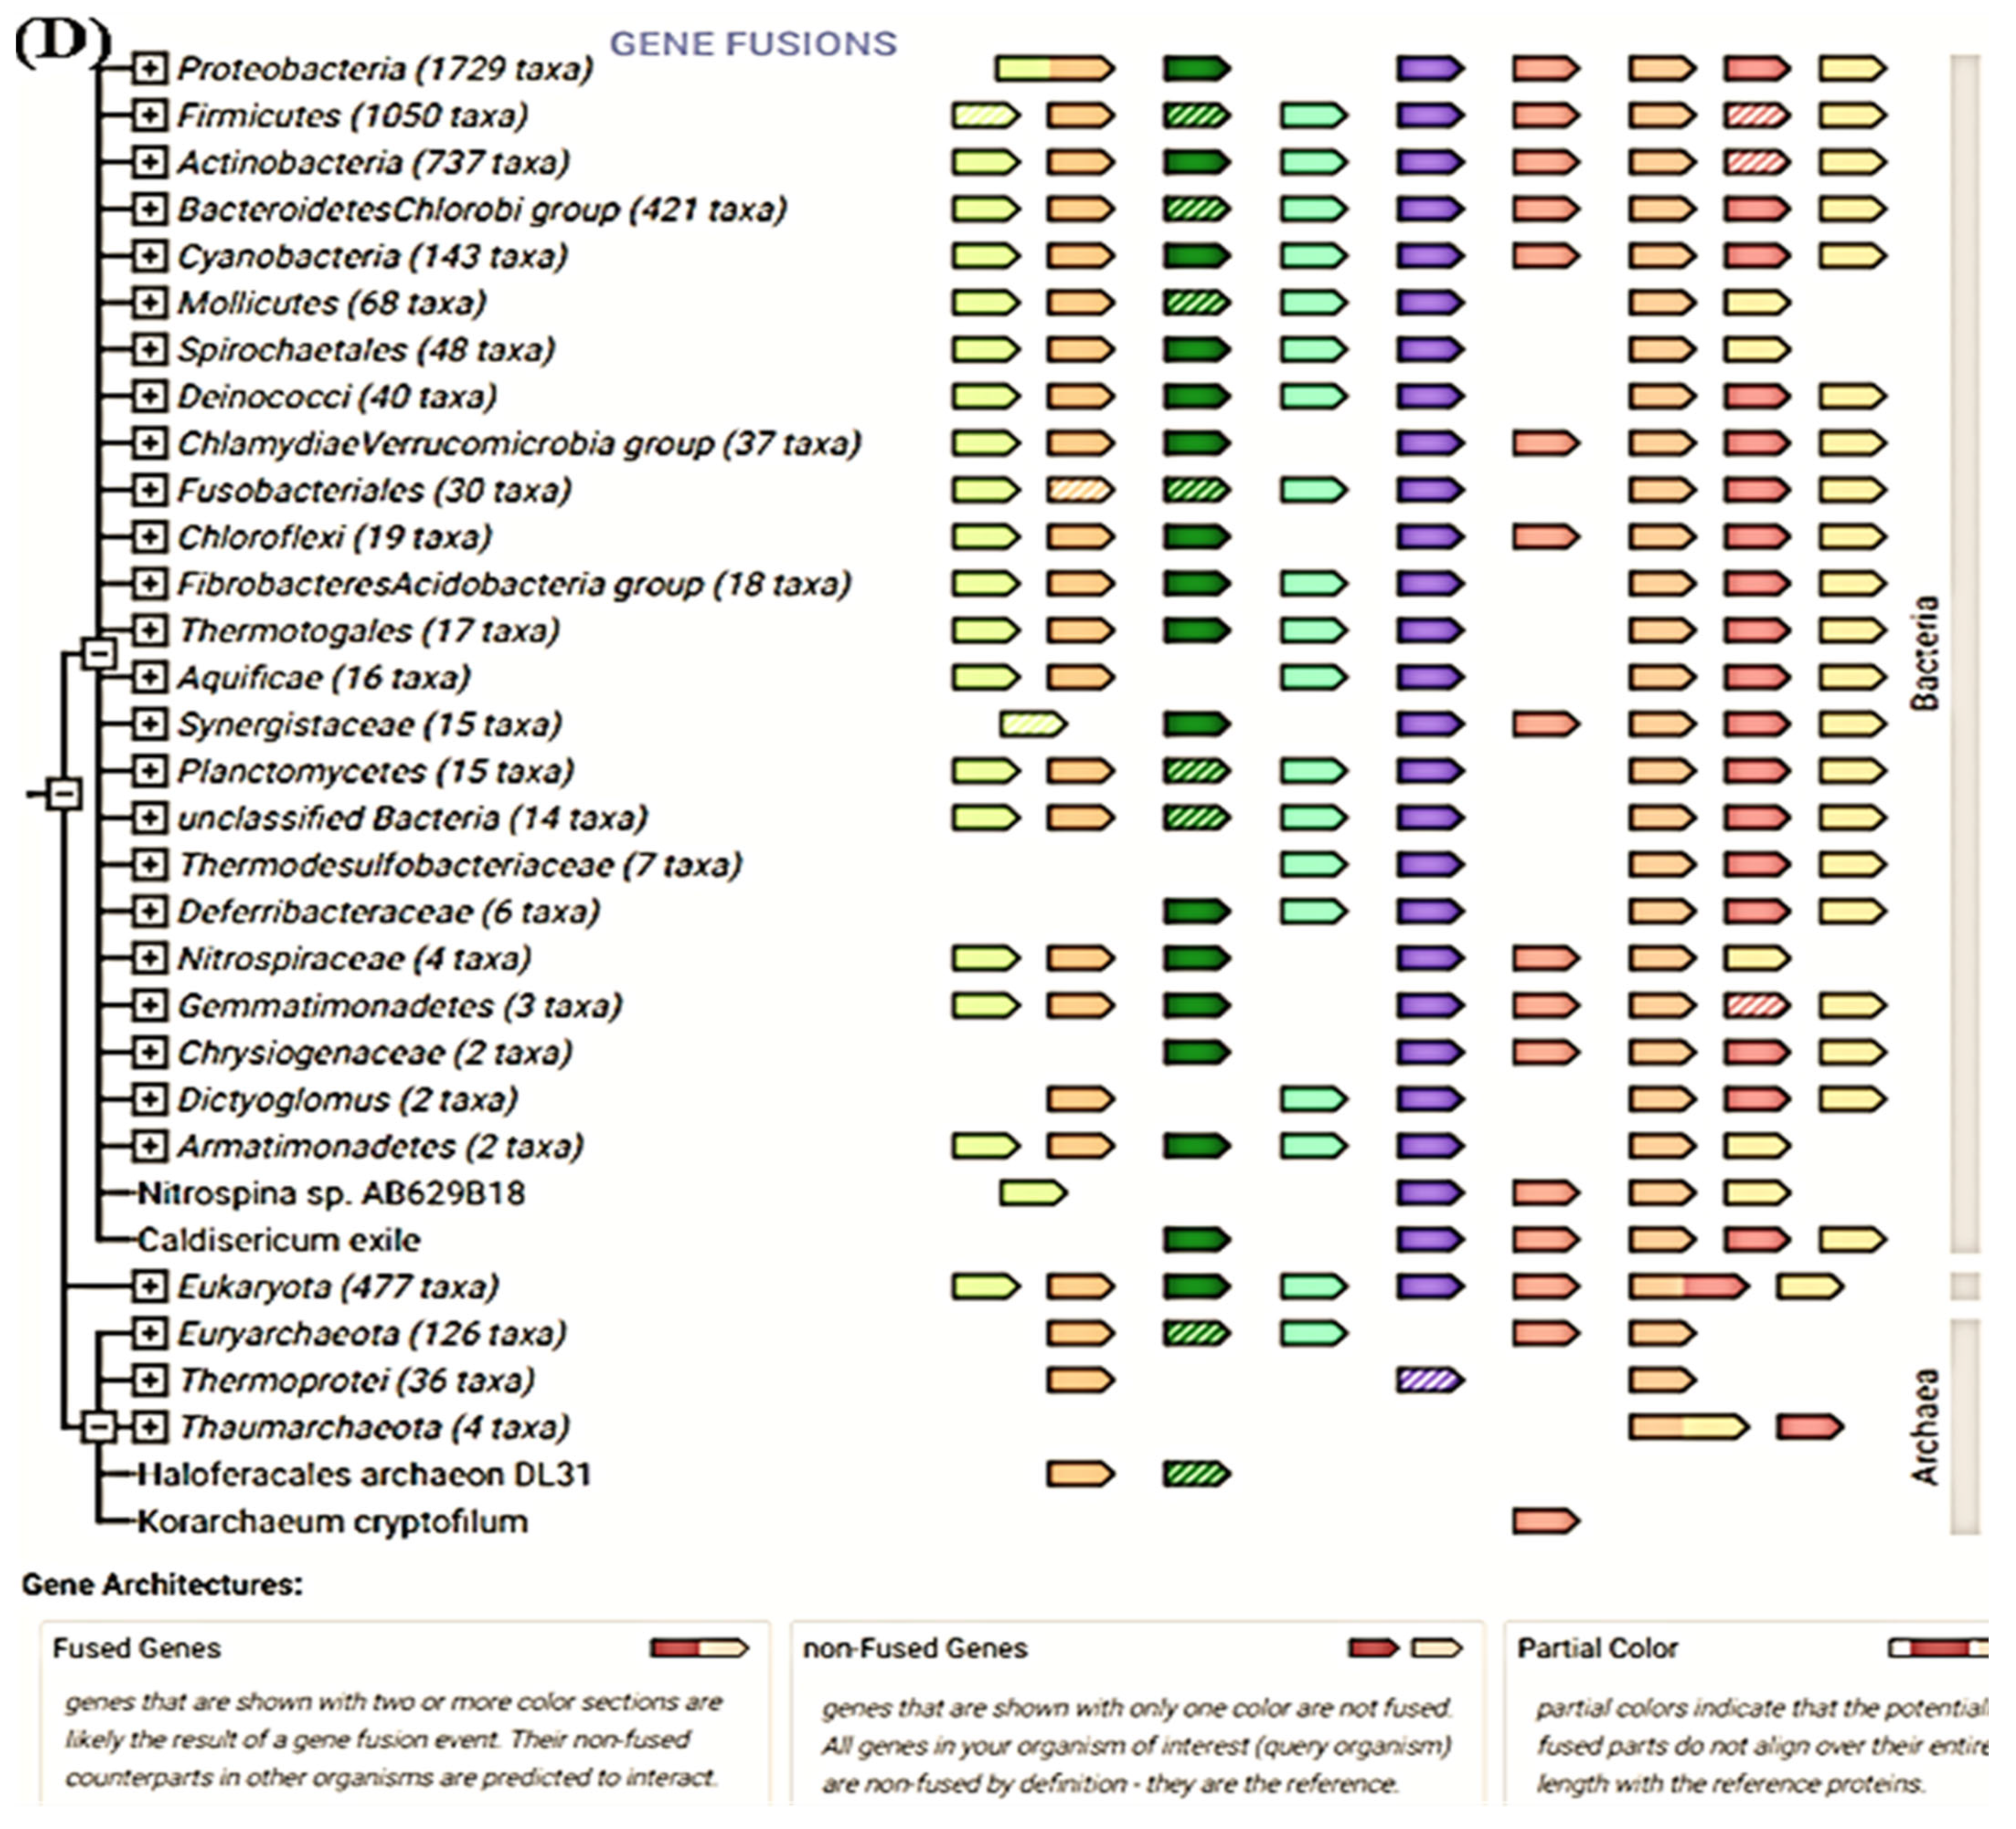
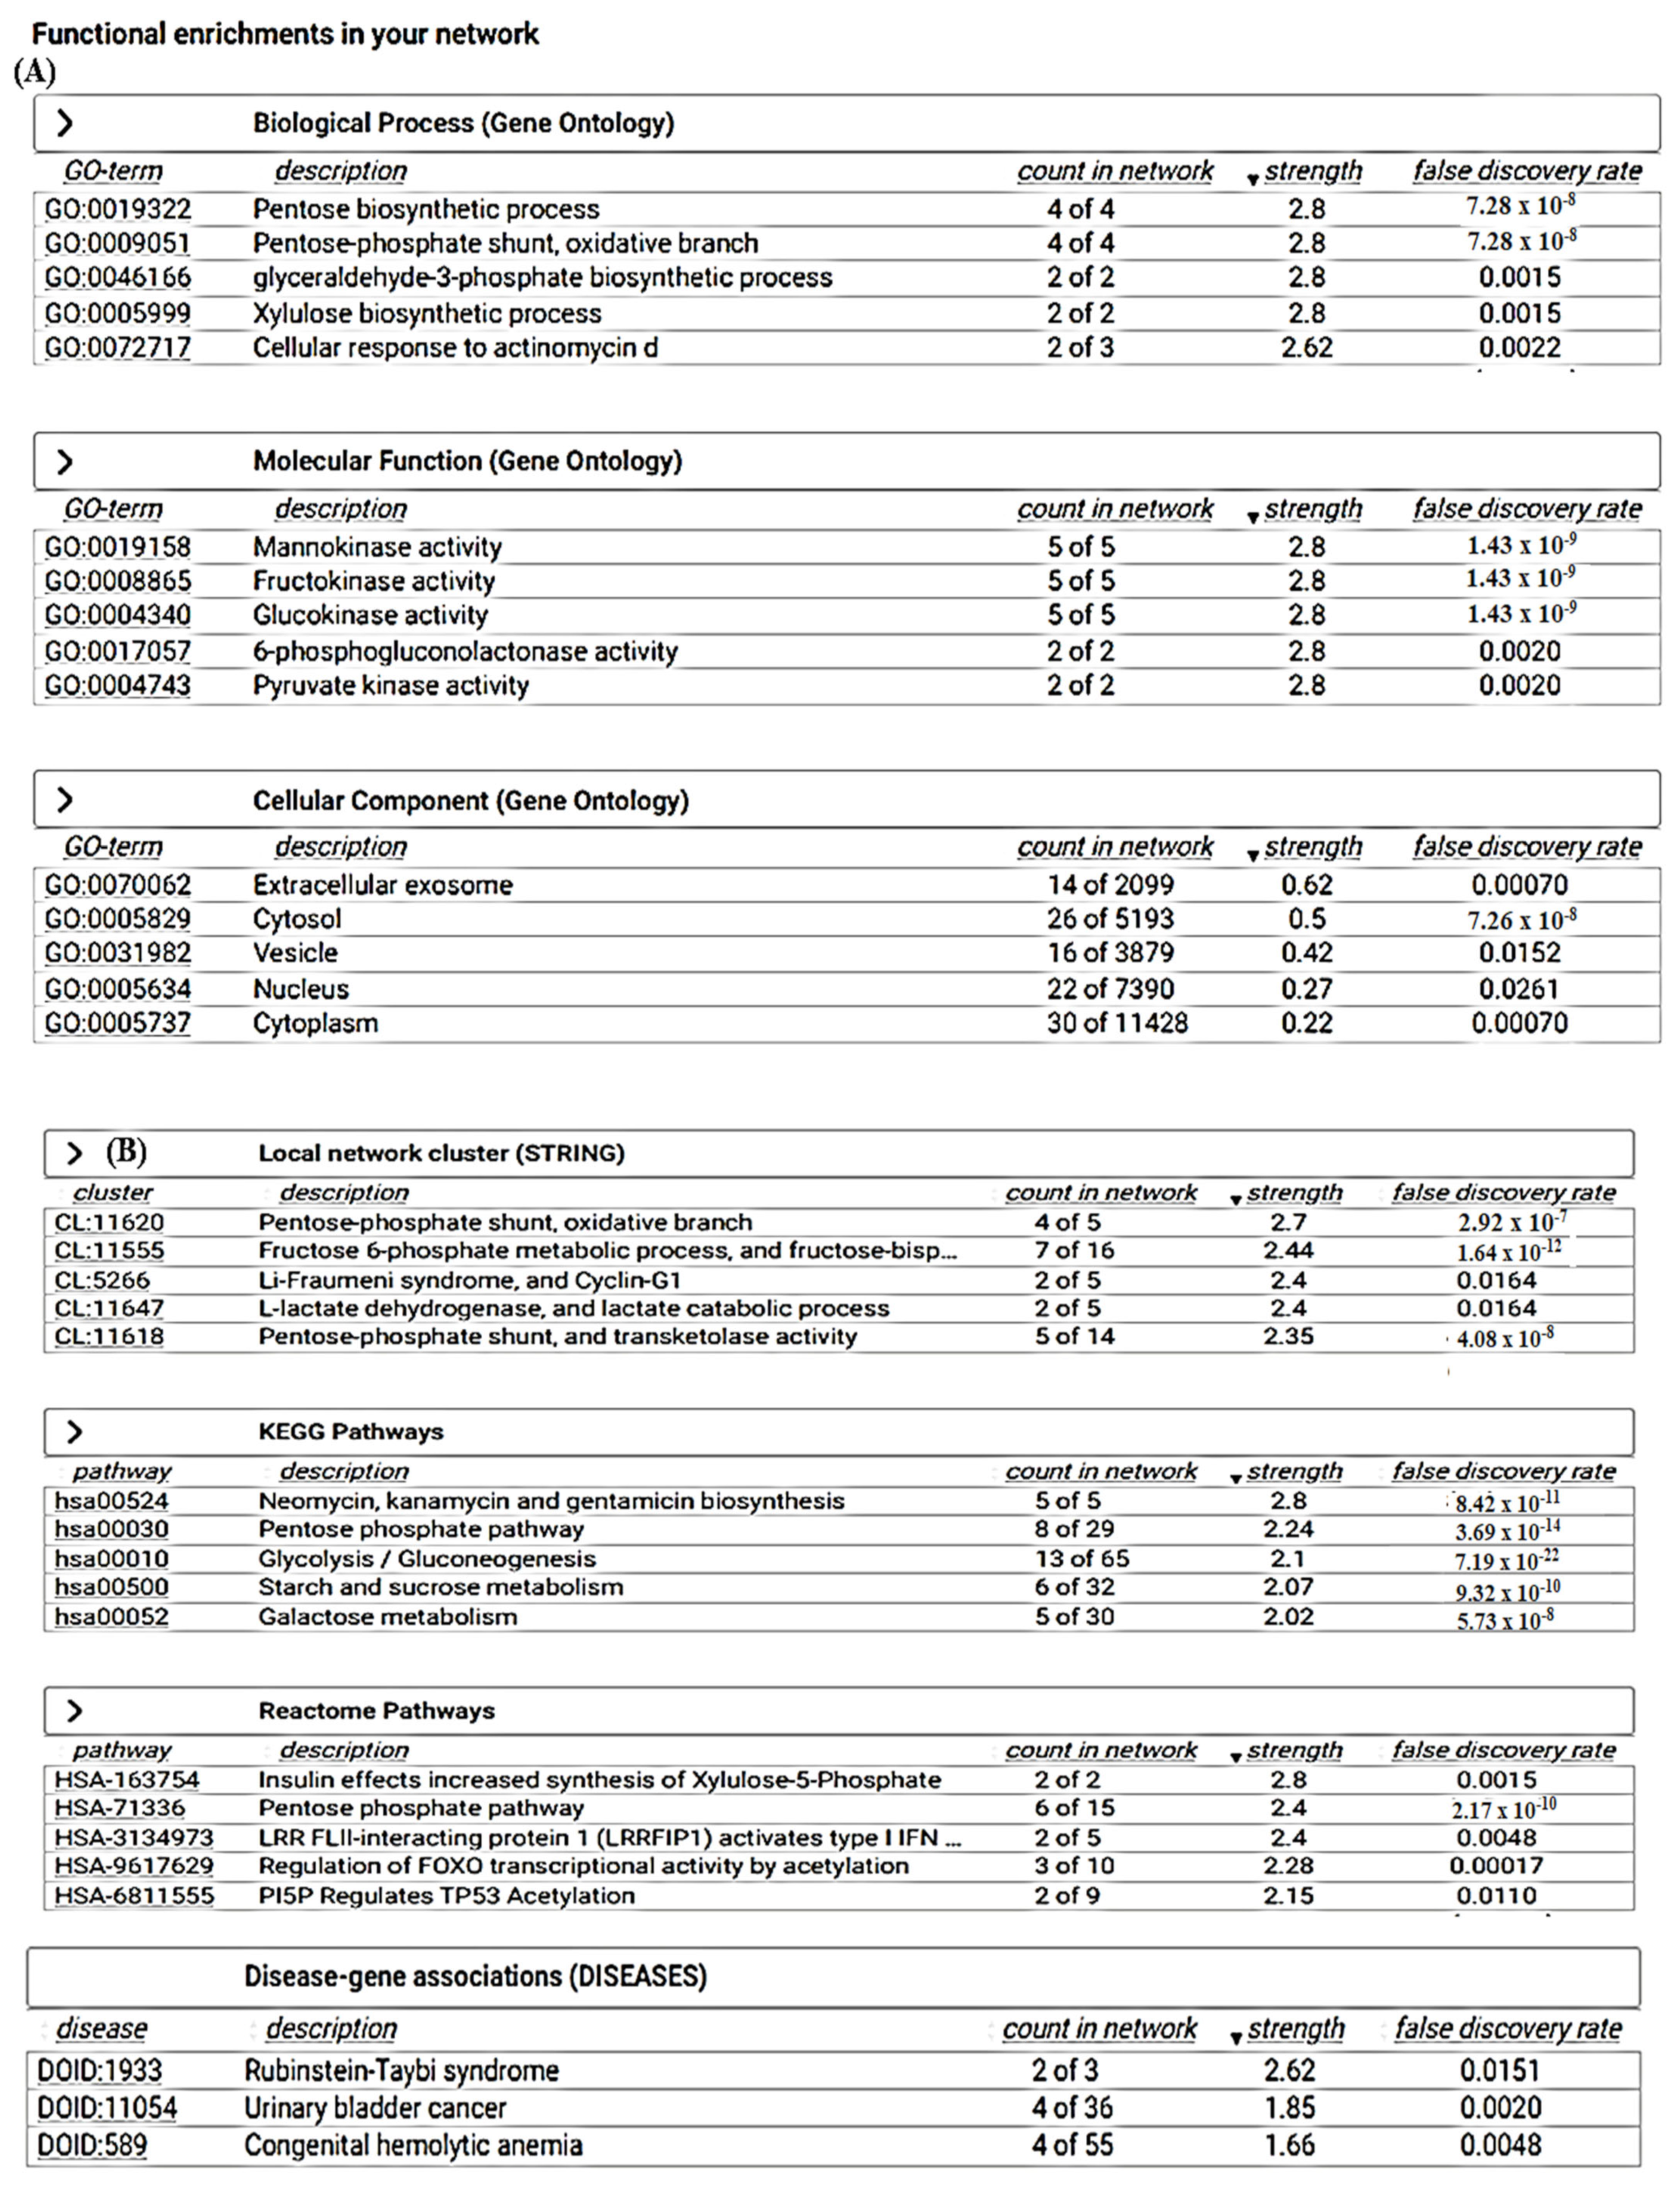
2.11. Search Tool for the Retrieval of Interacting Genes/Proteins (STRING)
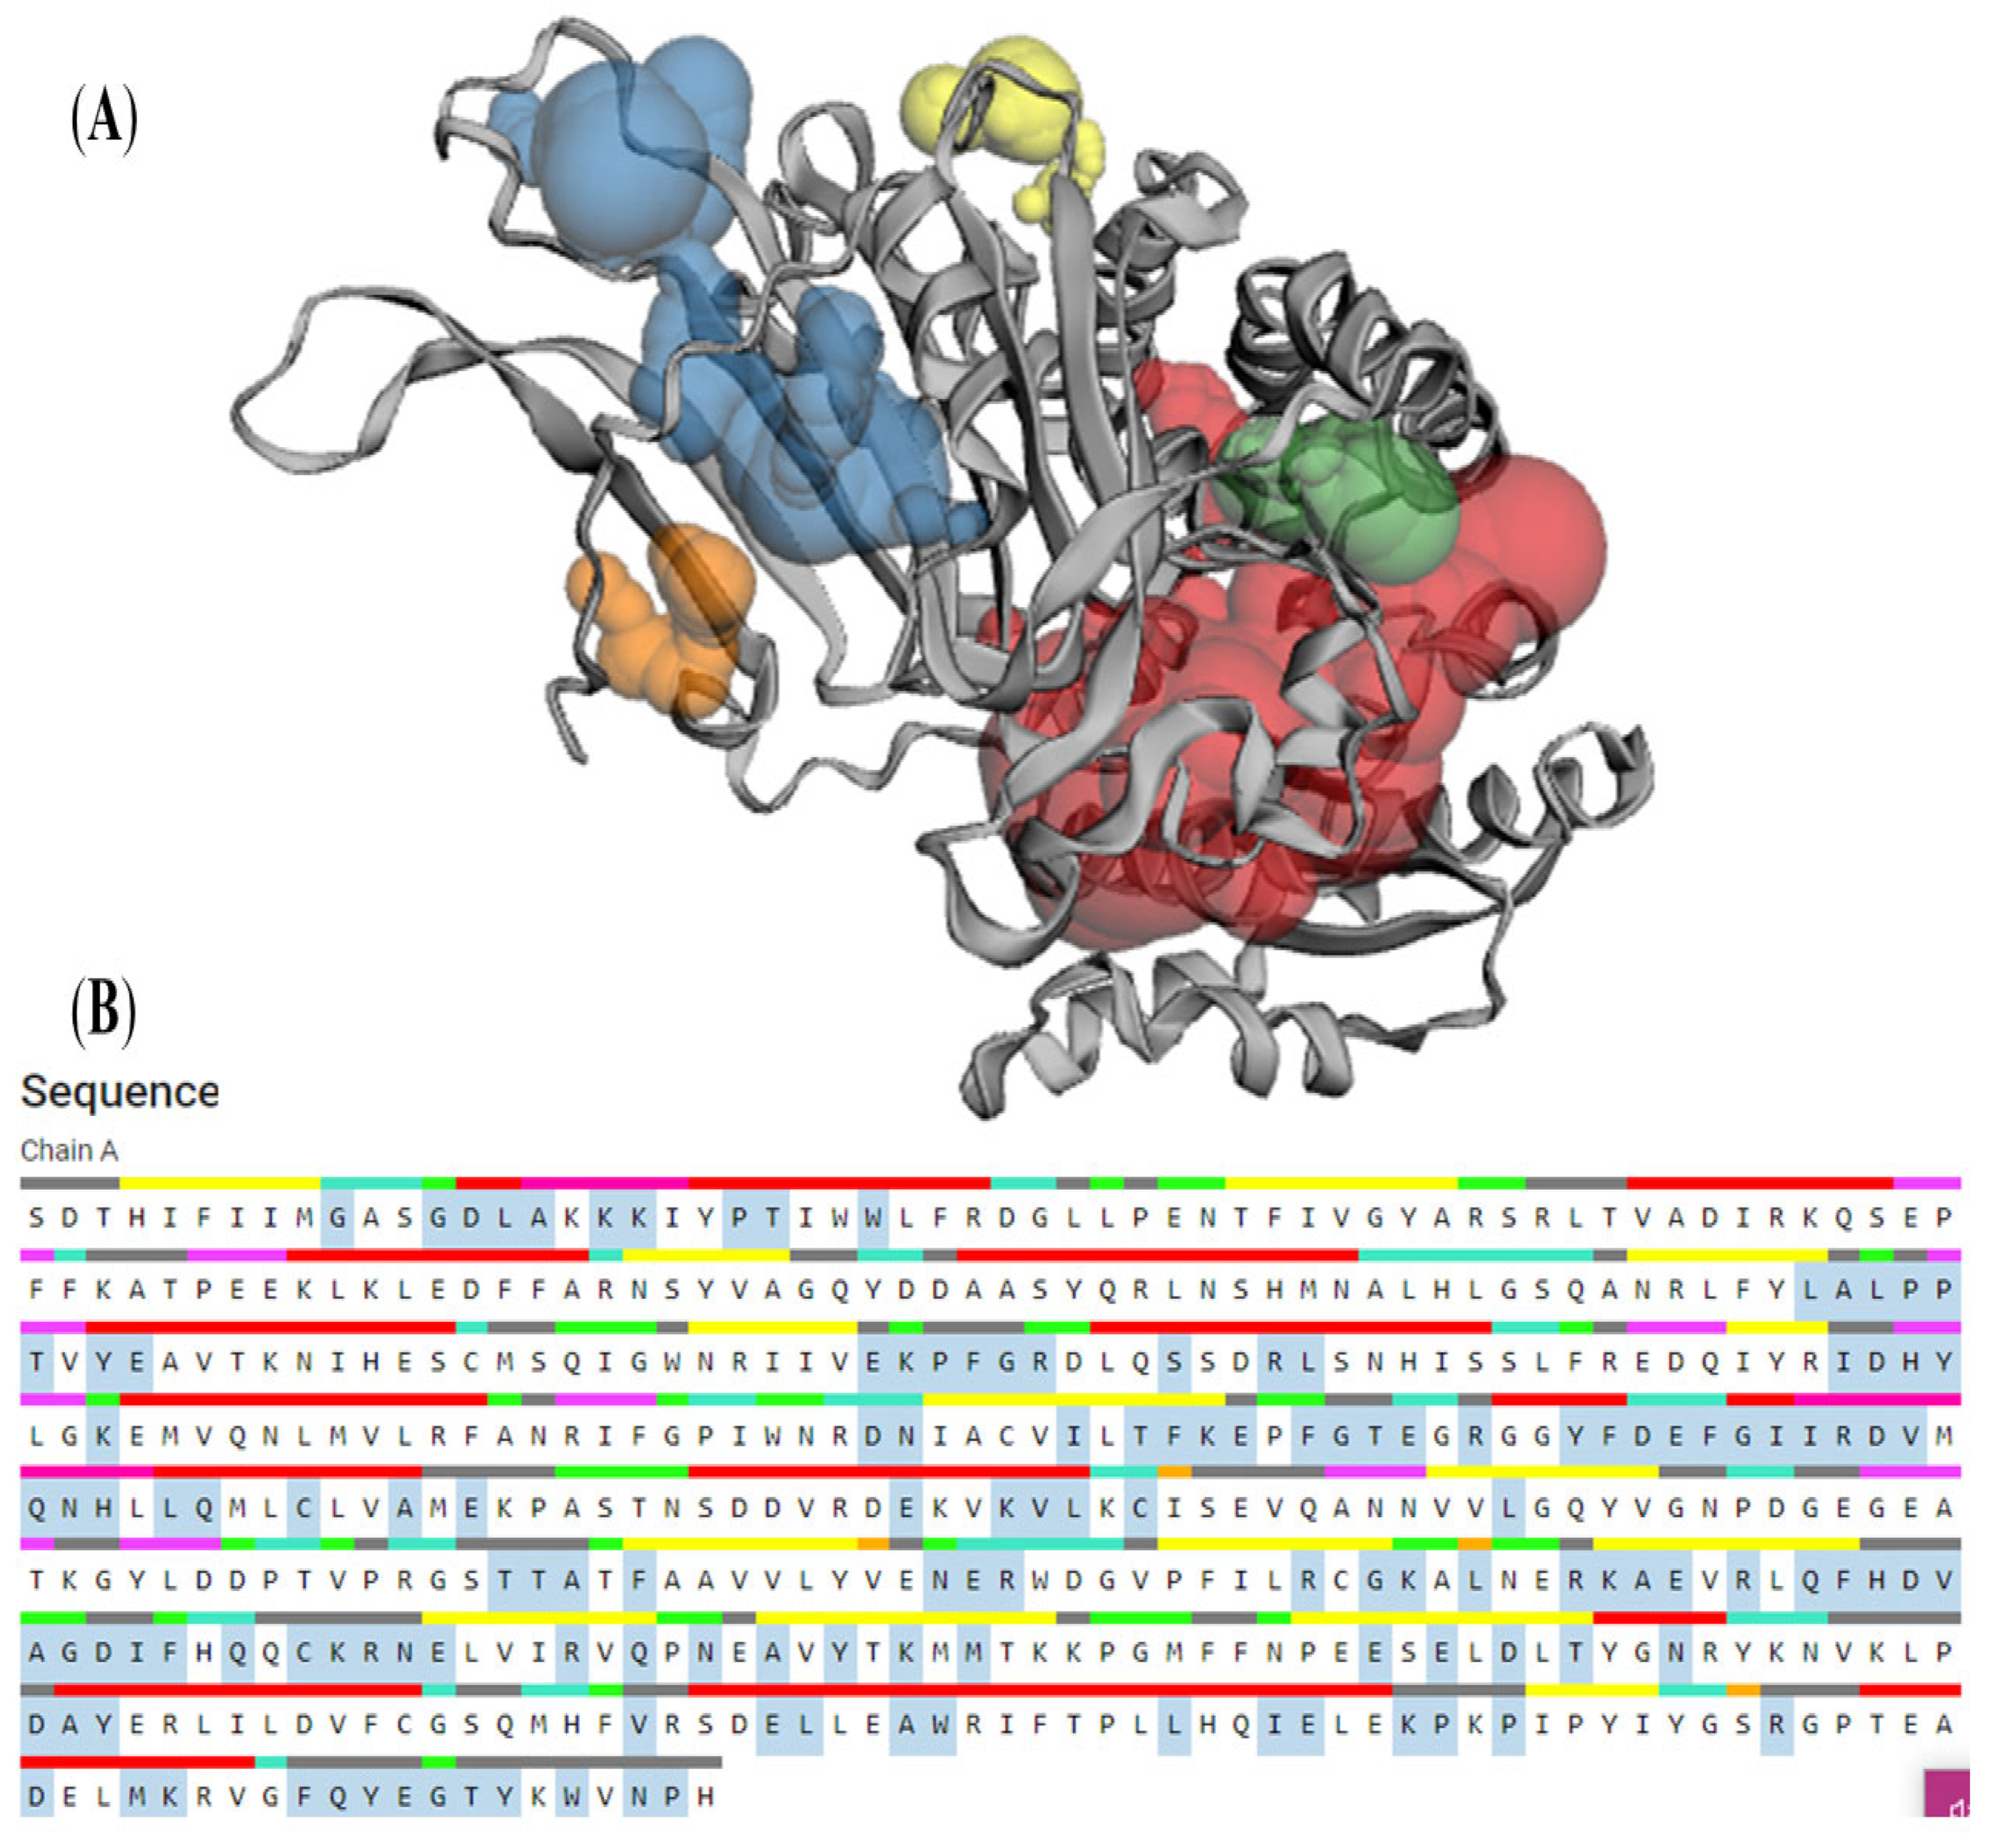
2.12. Computed Atlas of Surface Topography of Proteins (CASTp)
3. Results
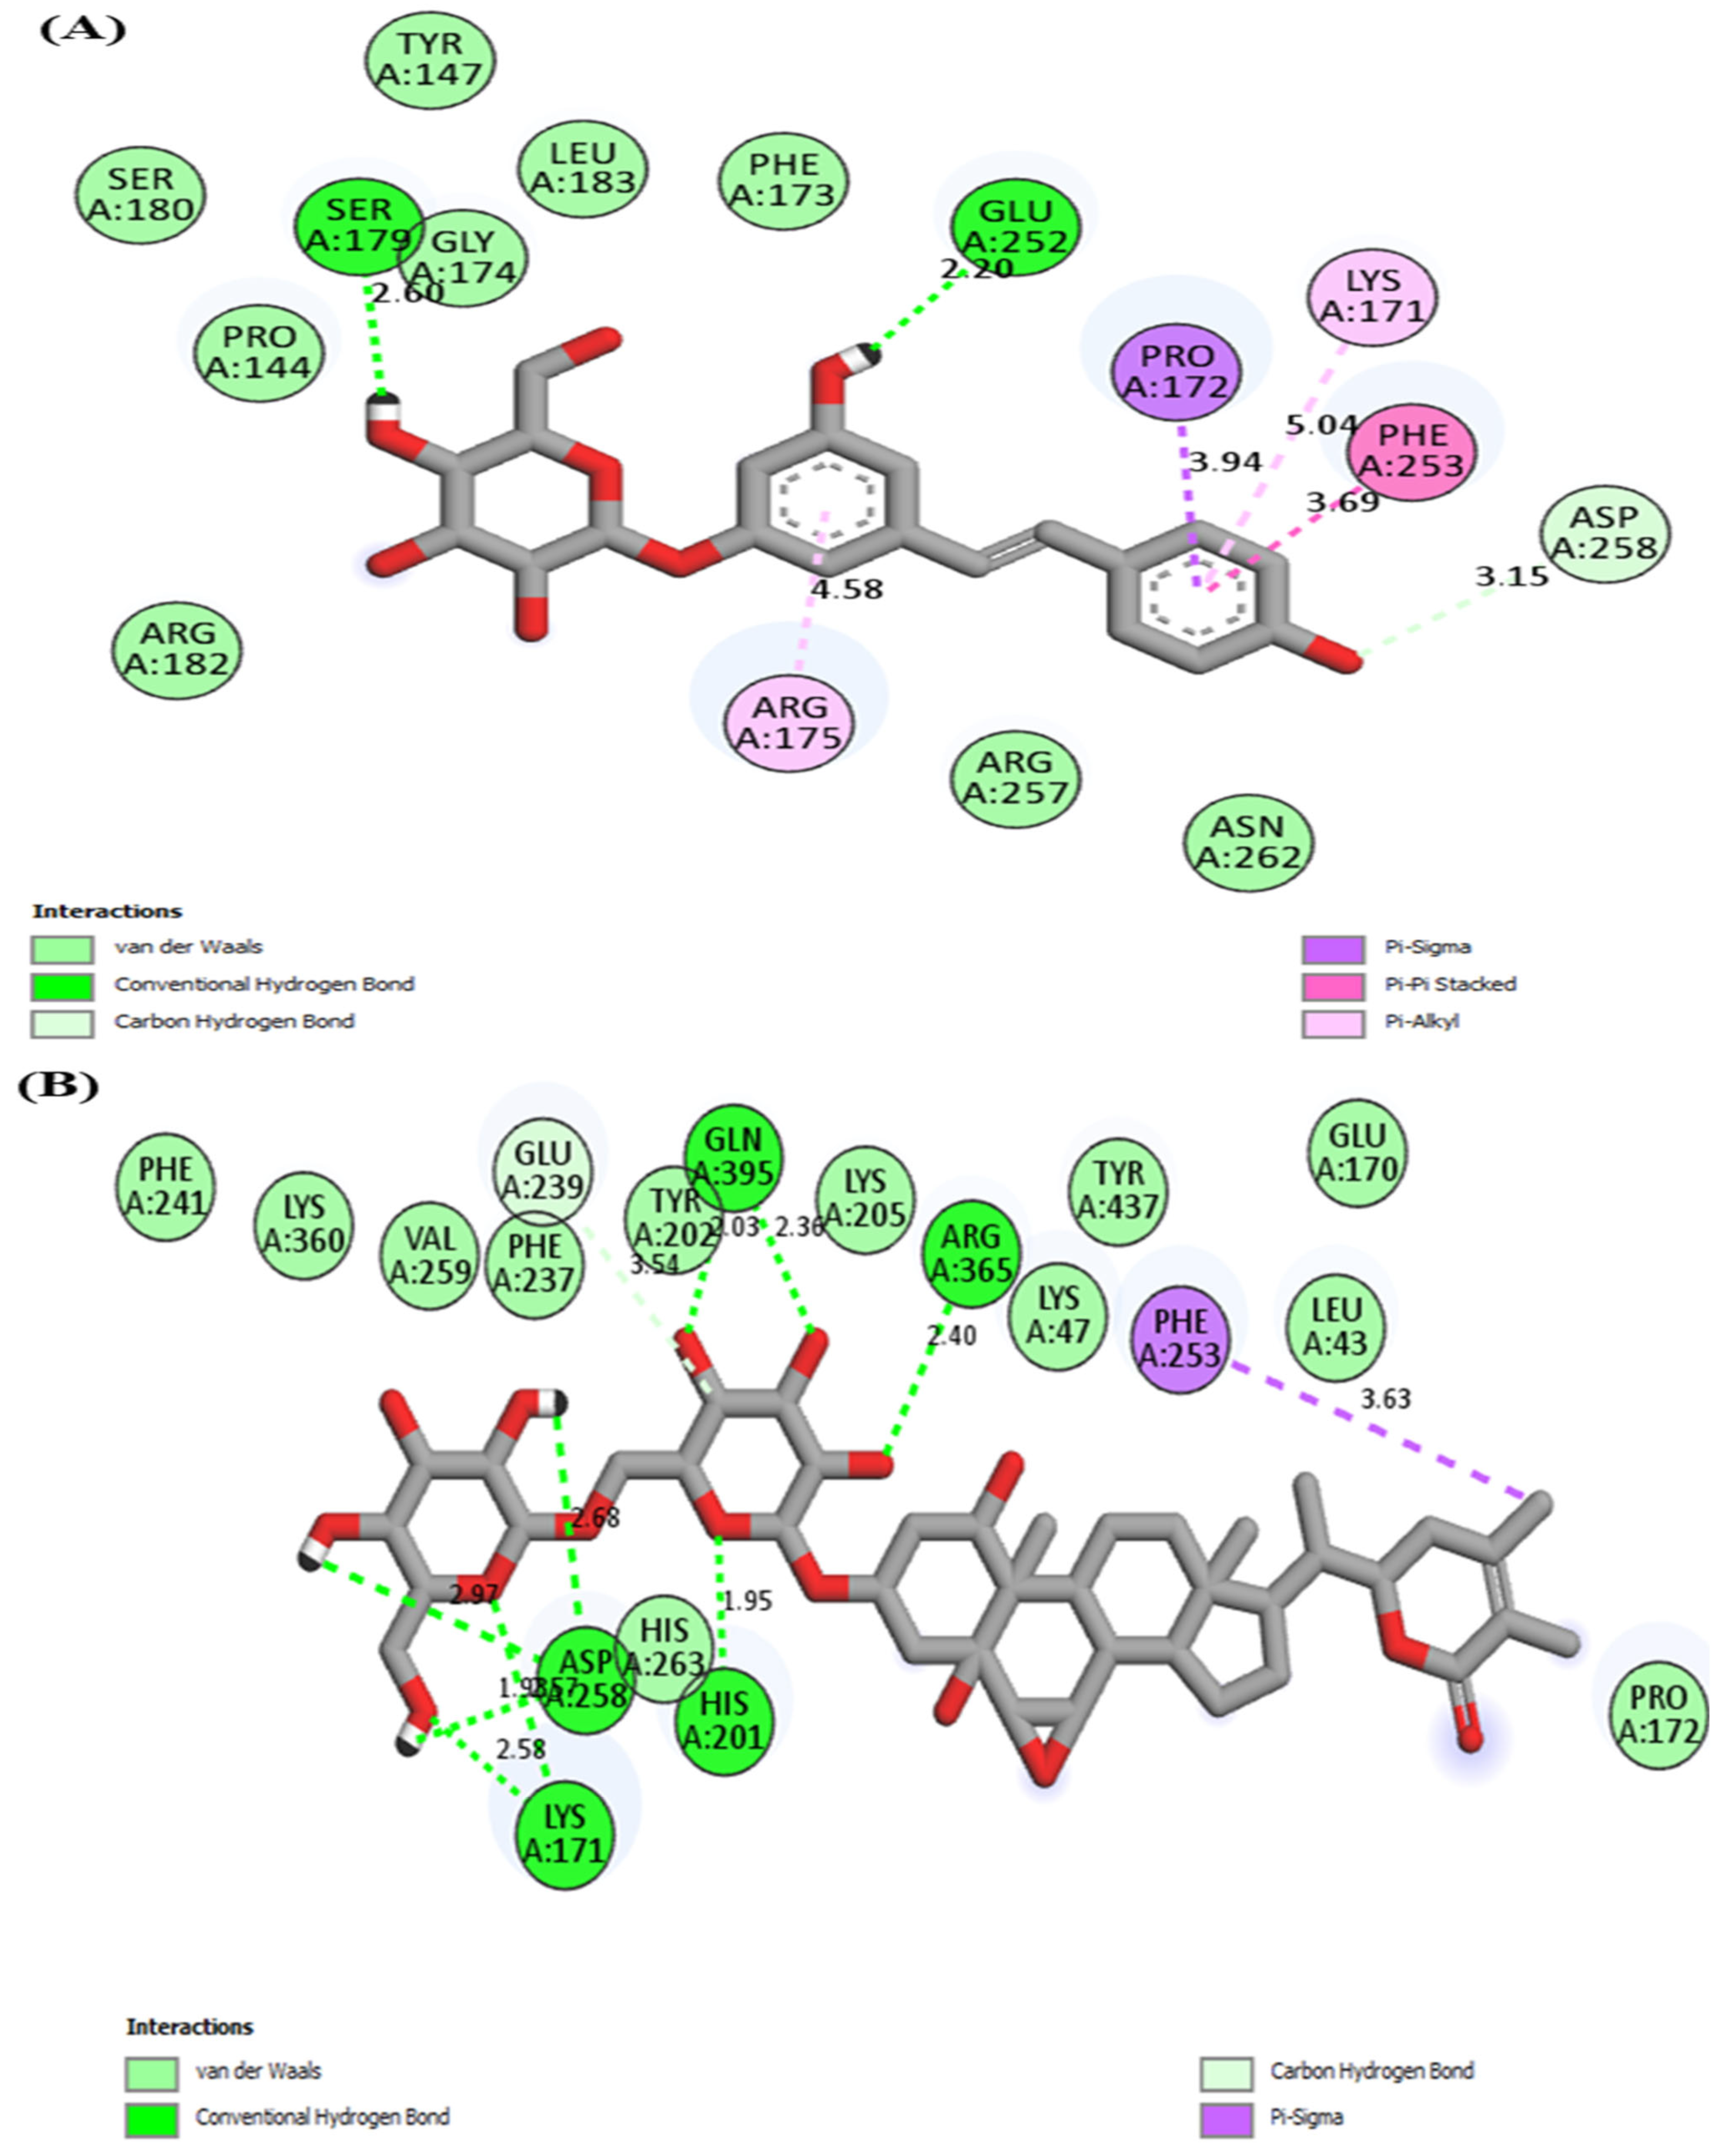
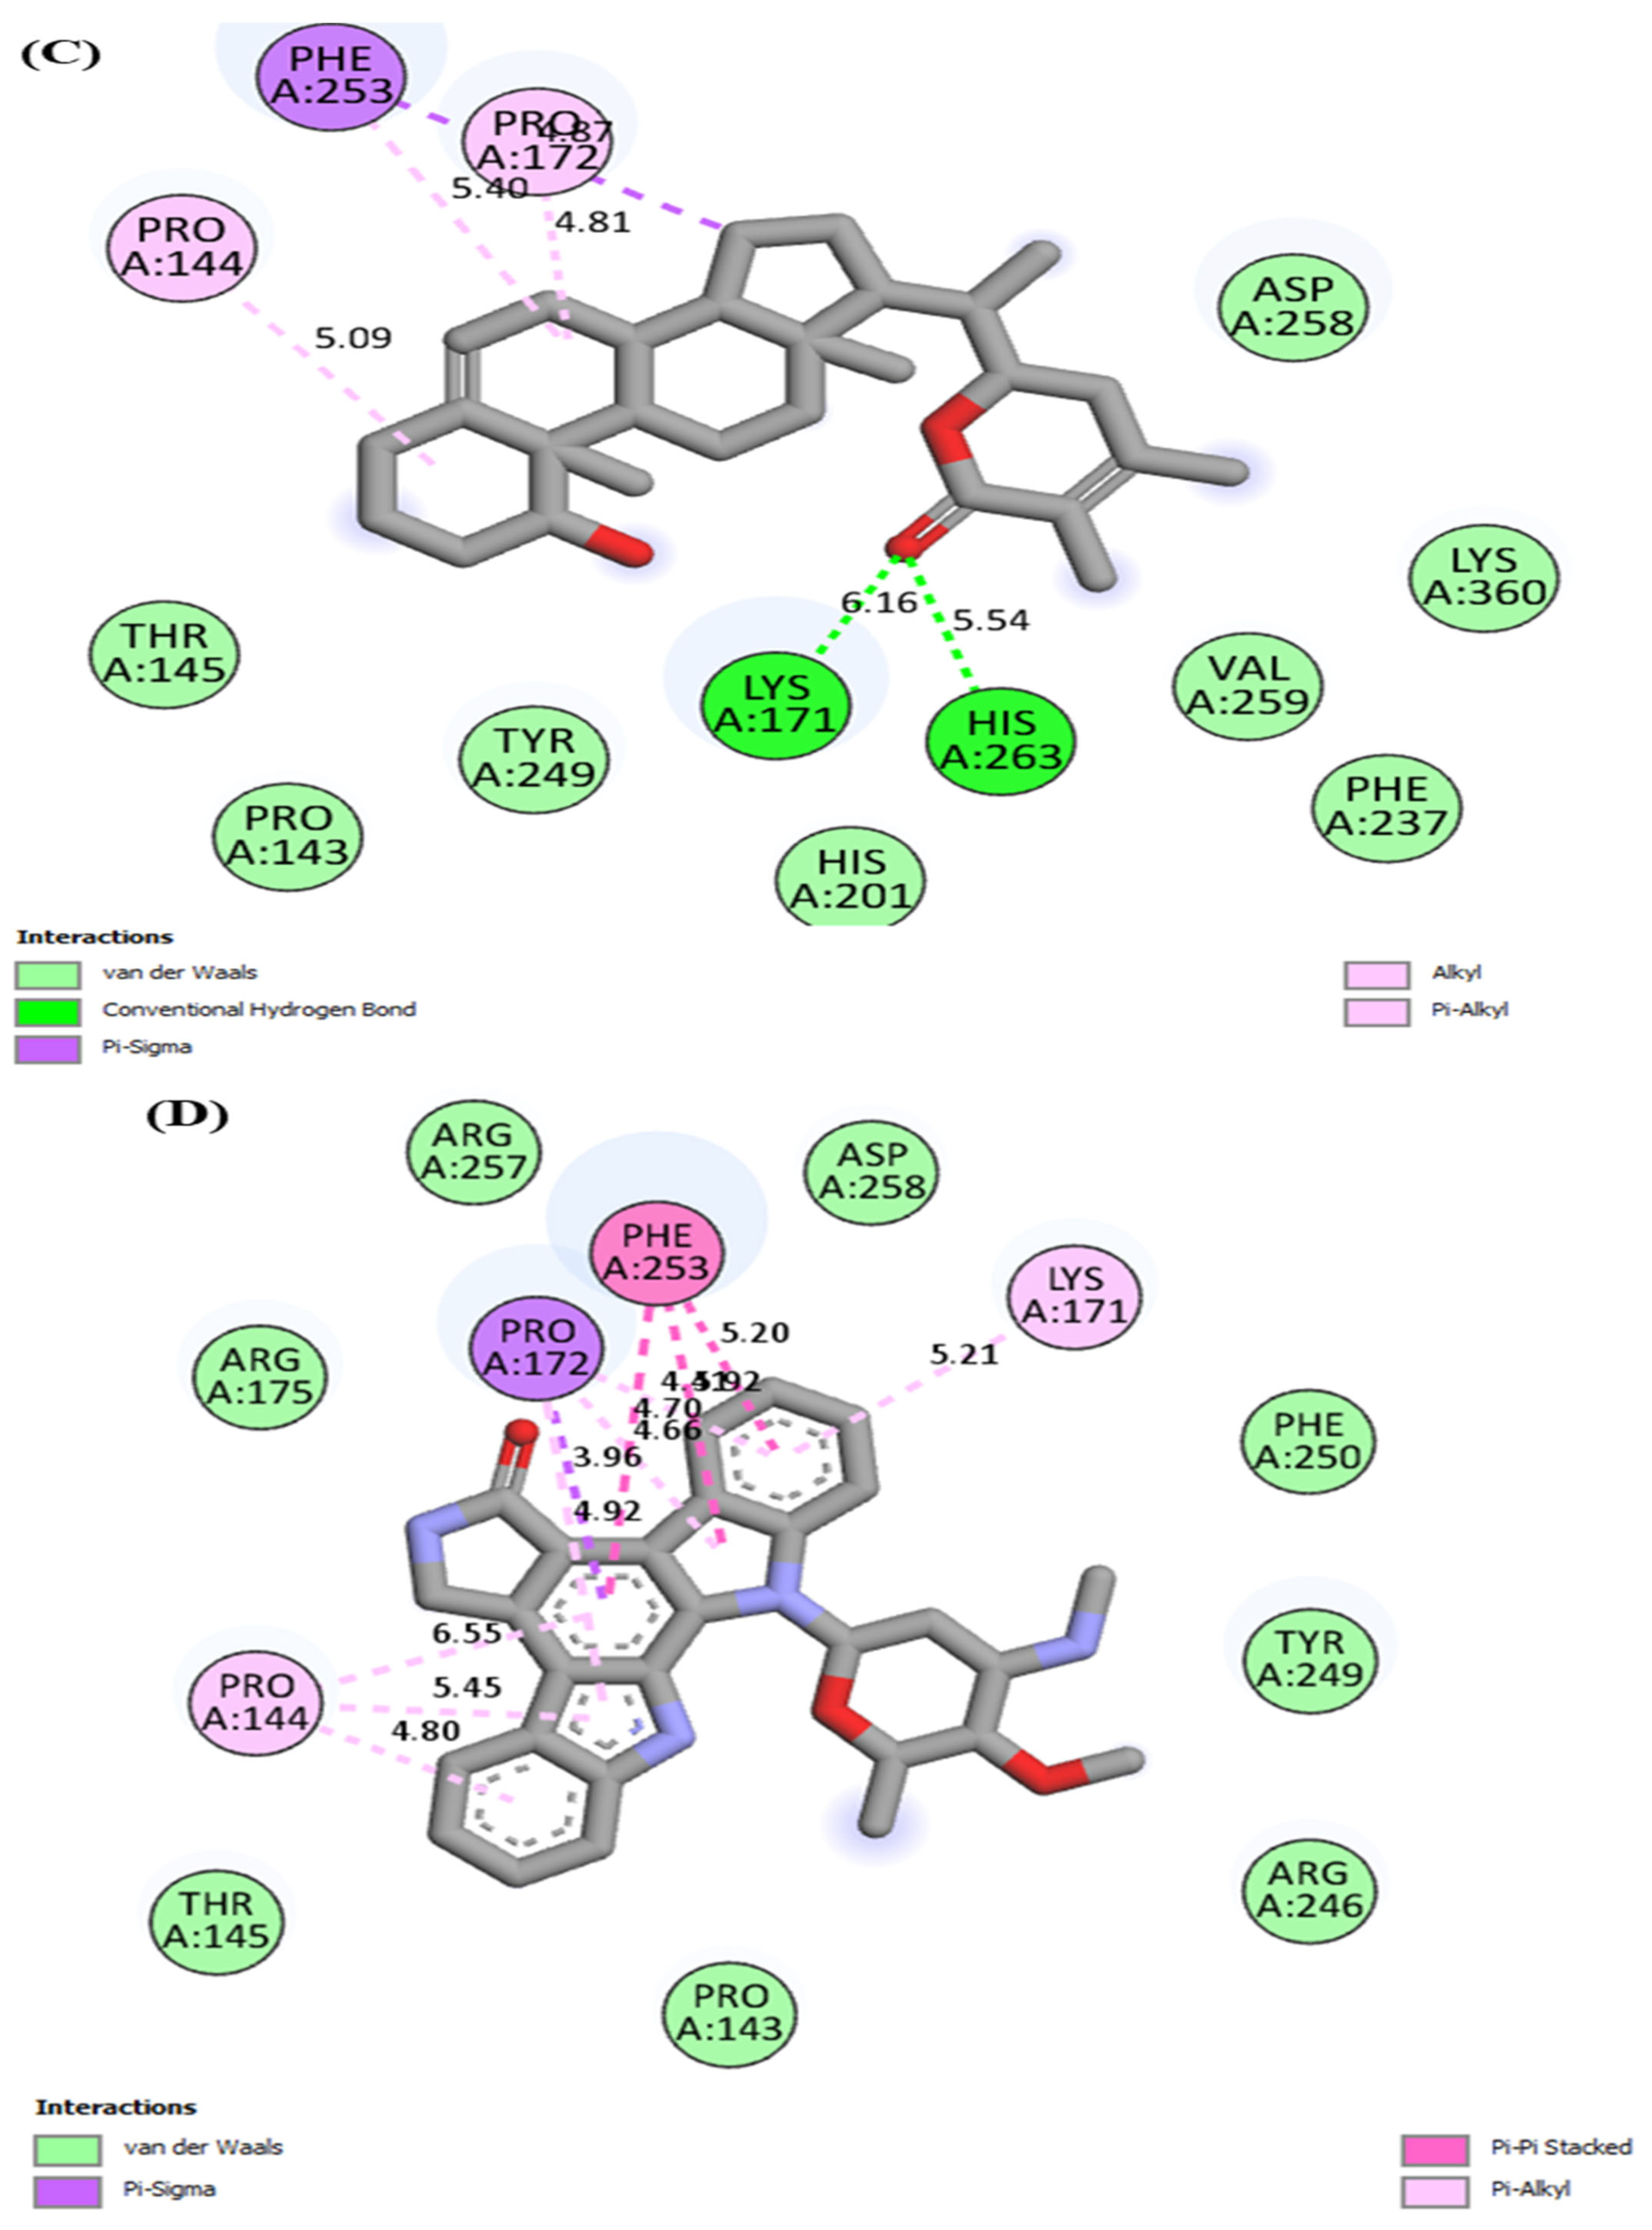
3.1. Molecular Docking
3.2. ADMET Analysis
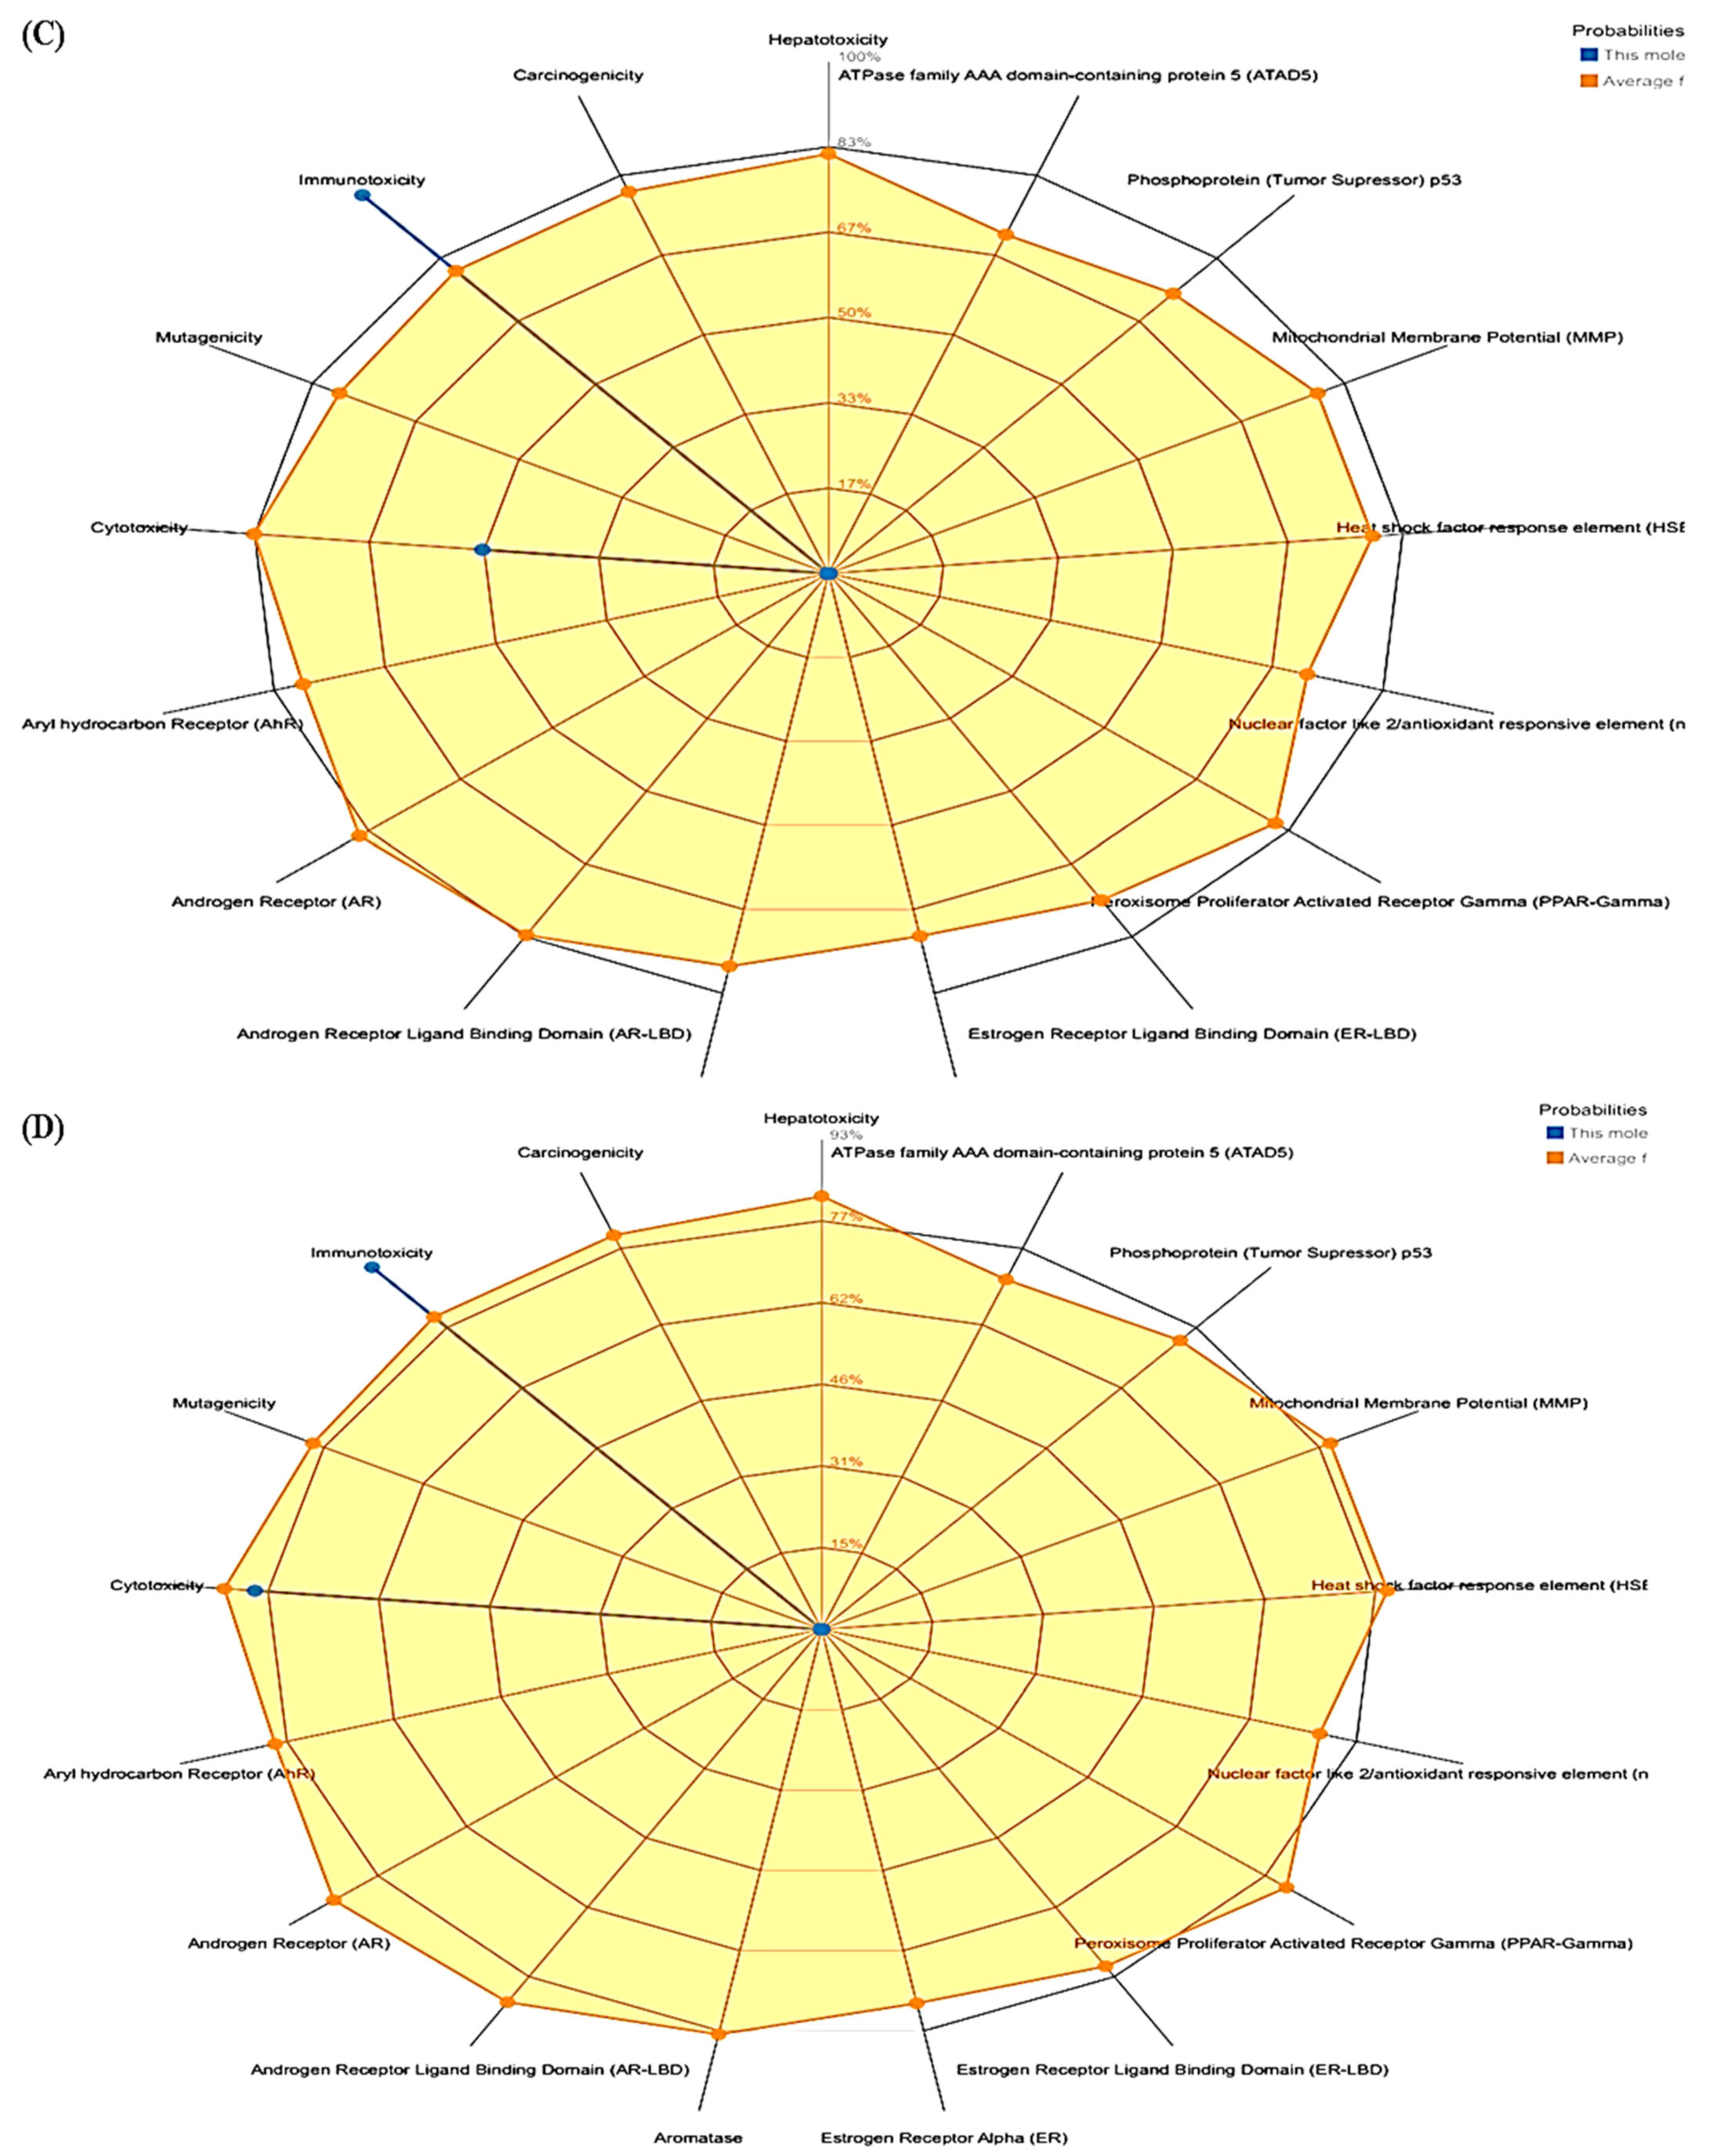
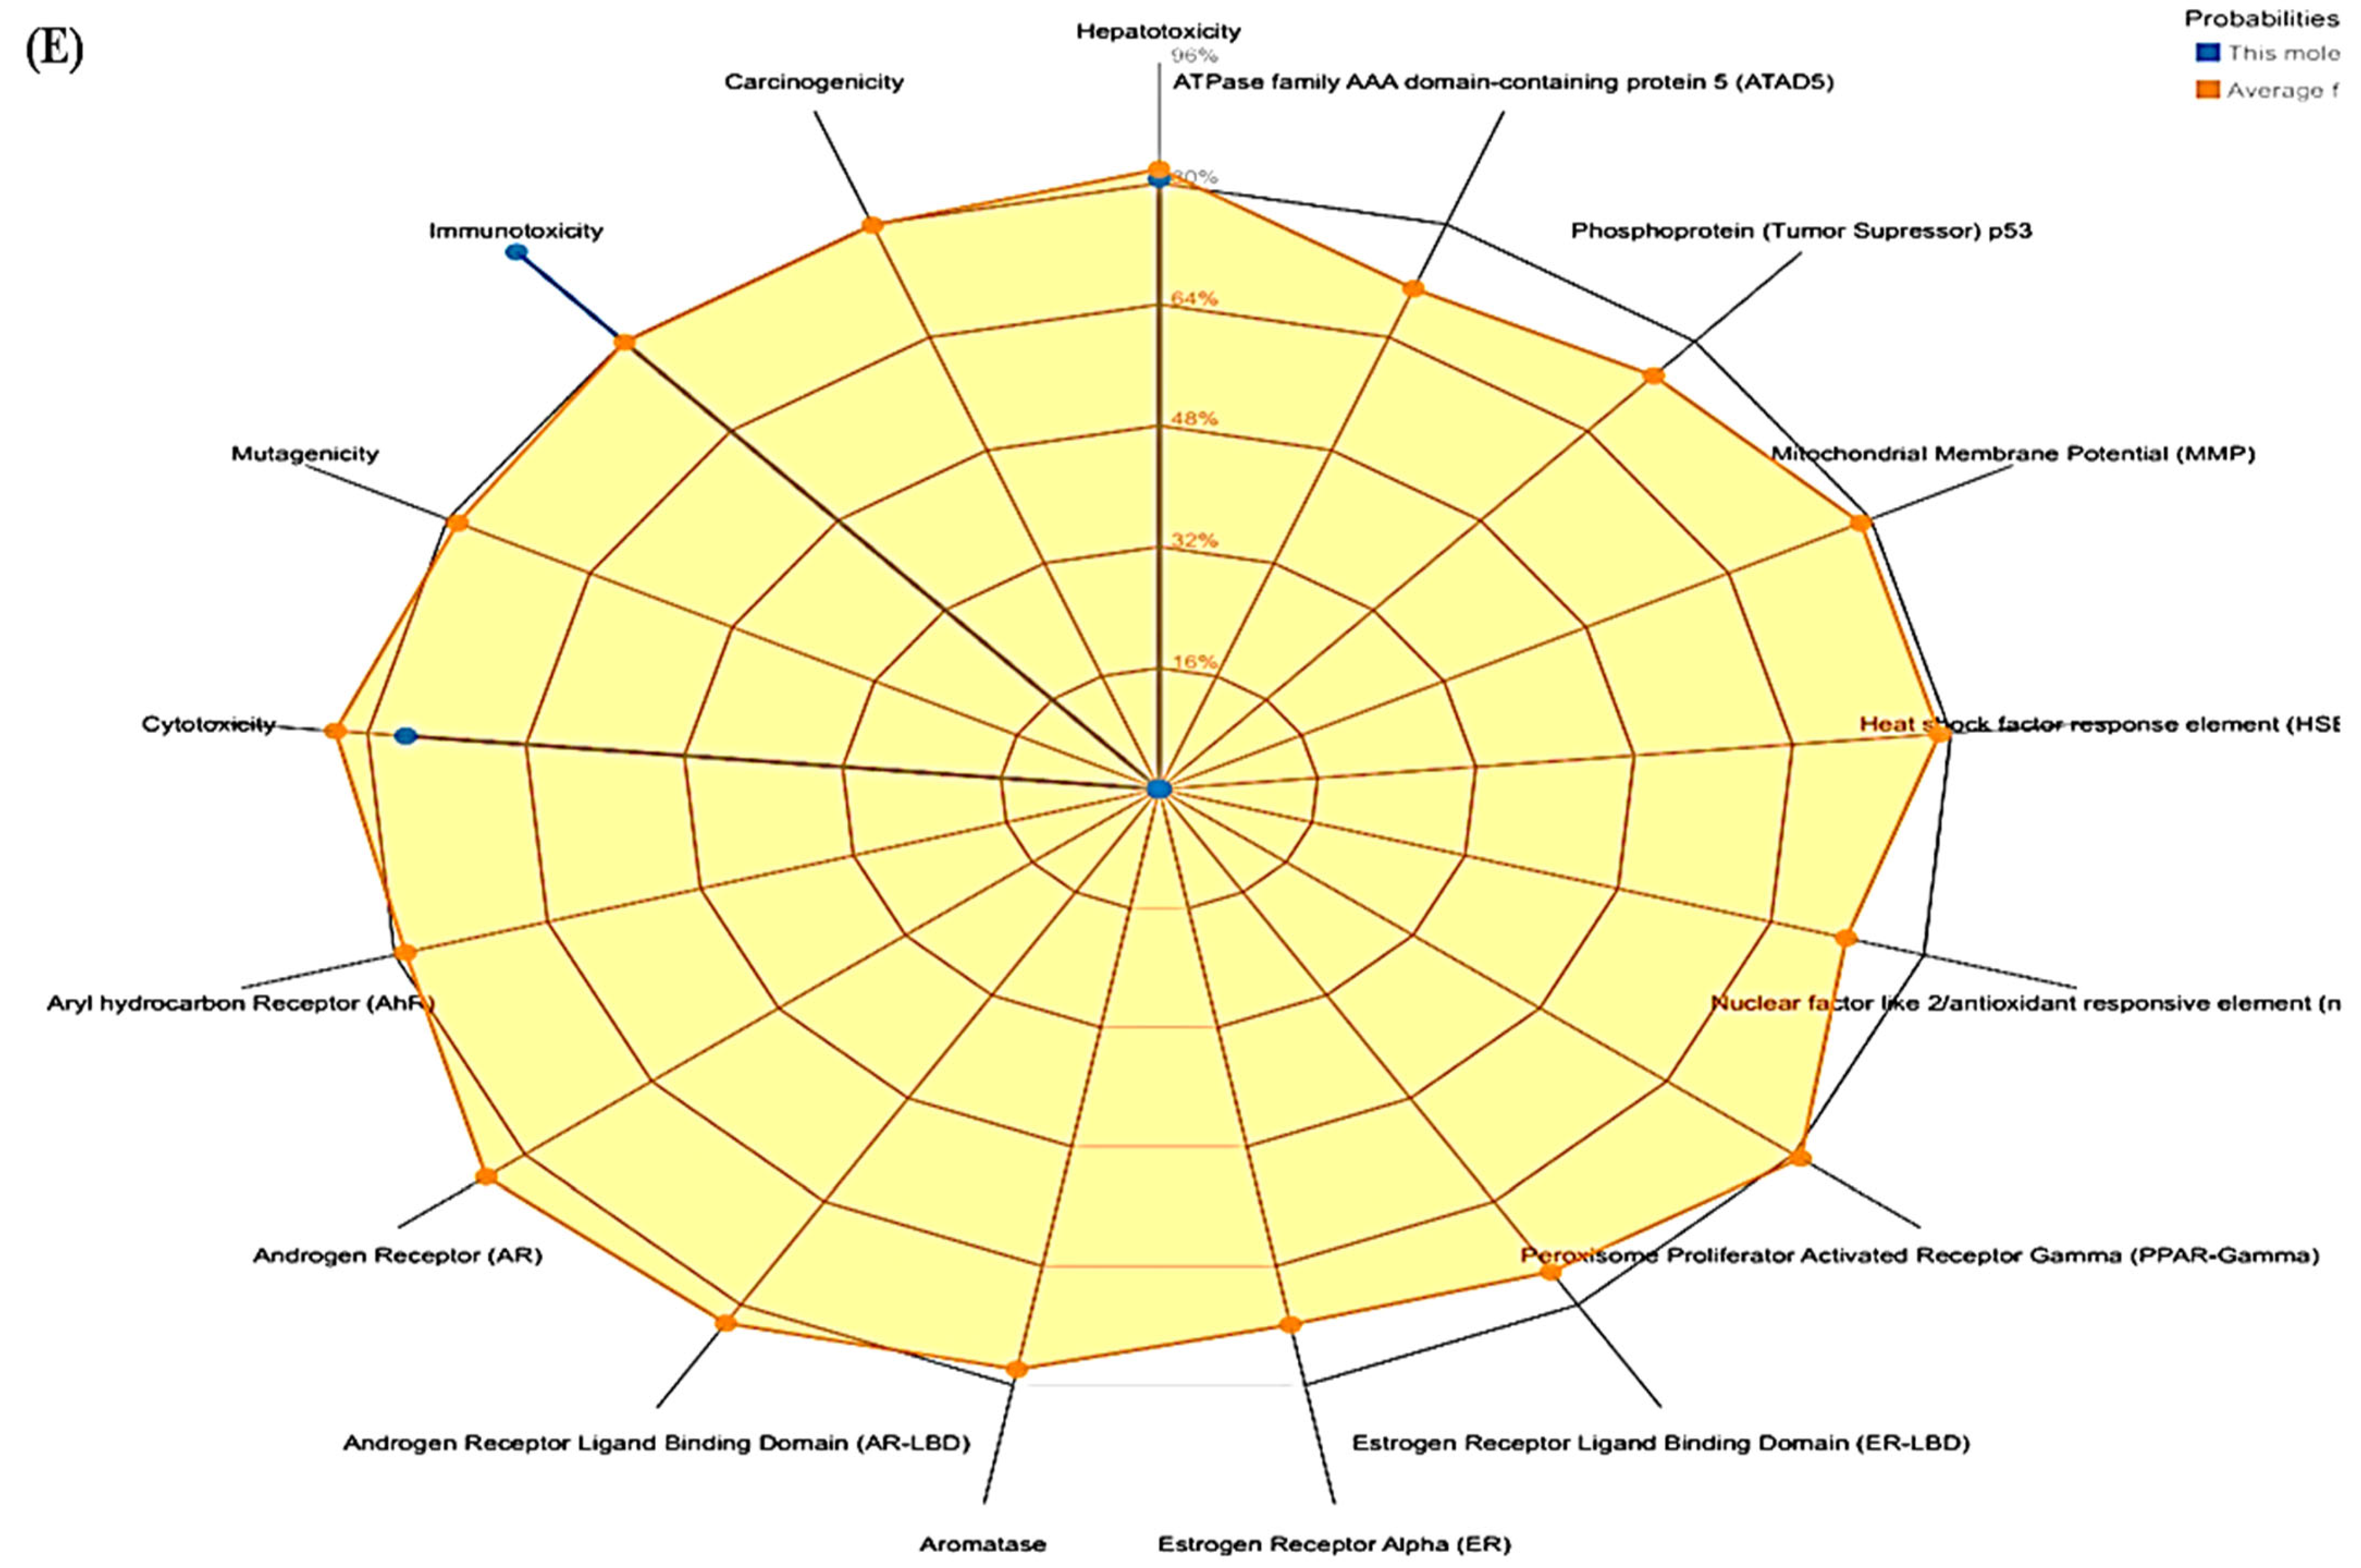
3.3. ProTox-II
3.4. Structural Analysis
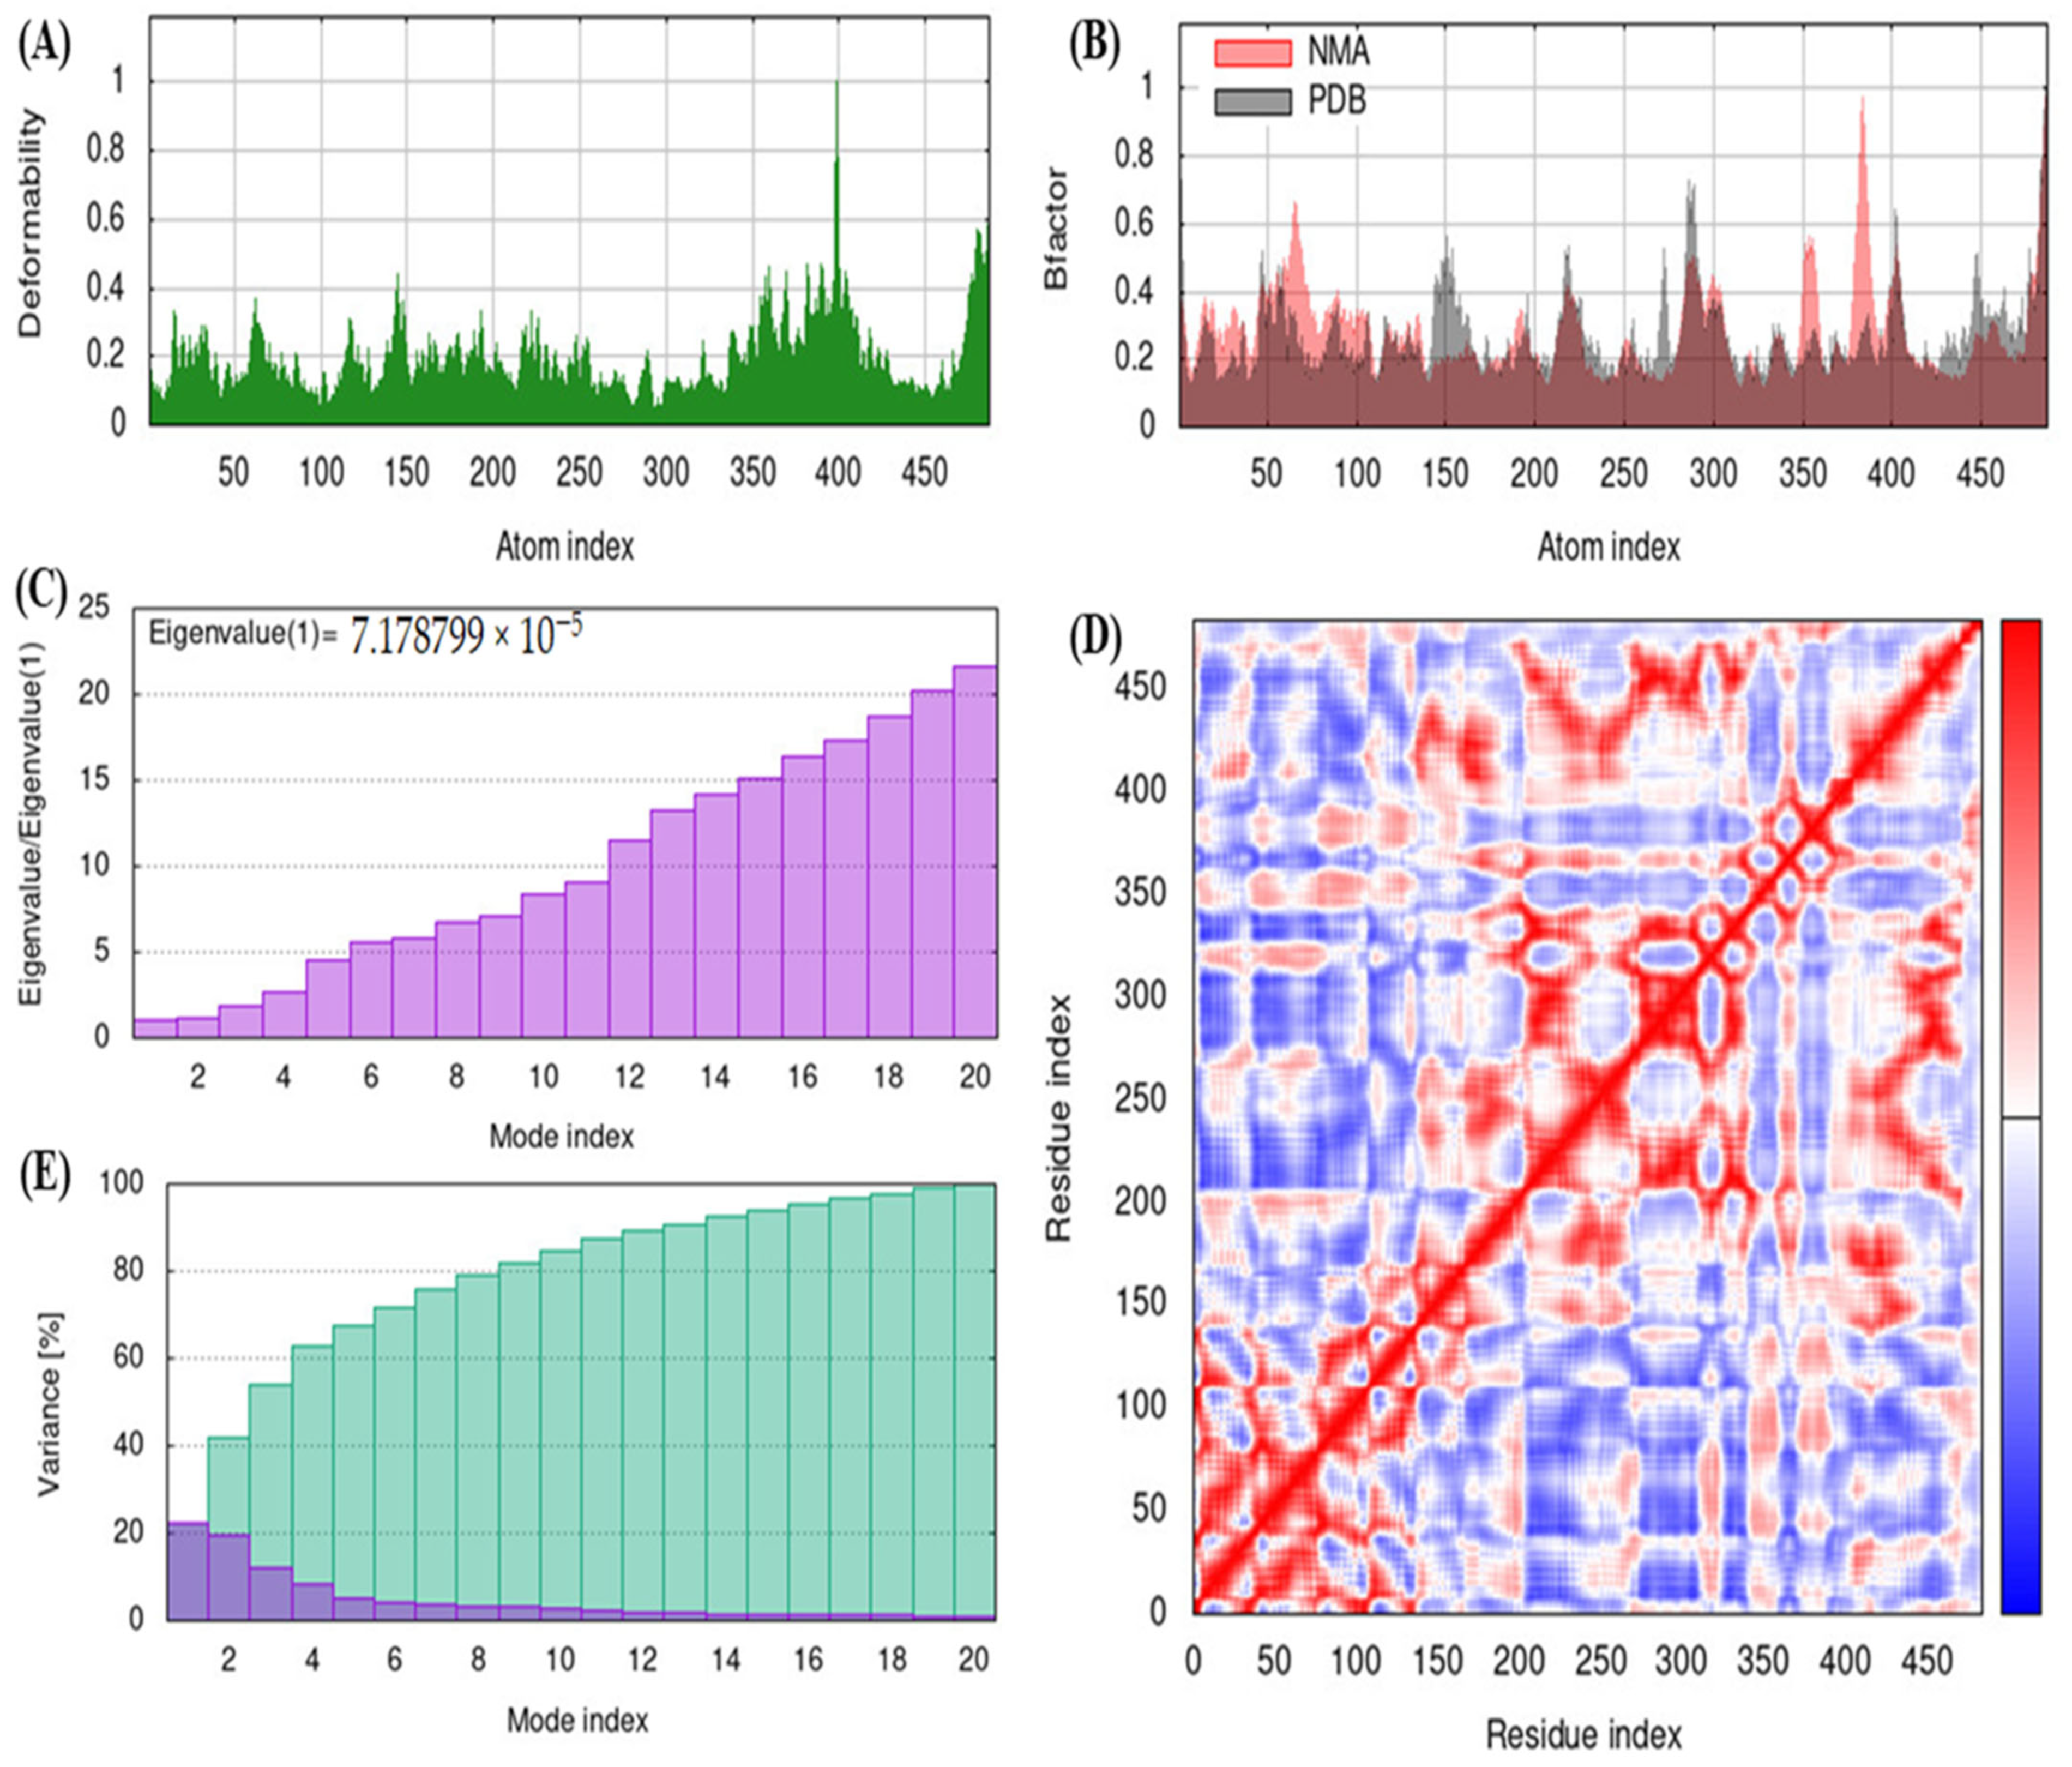
3.5. iMODS
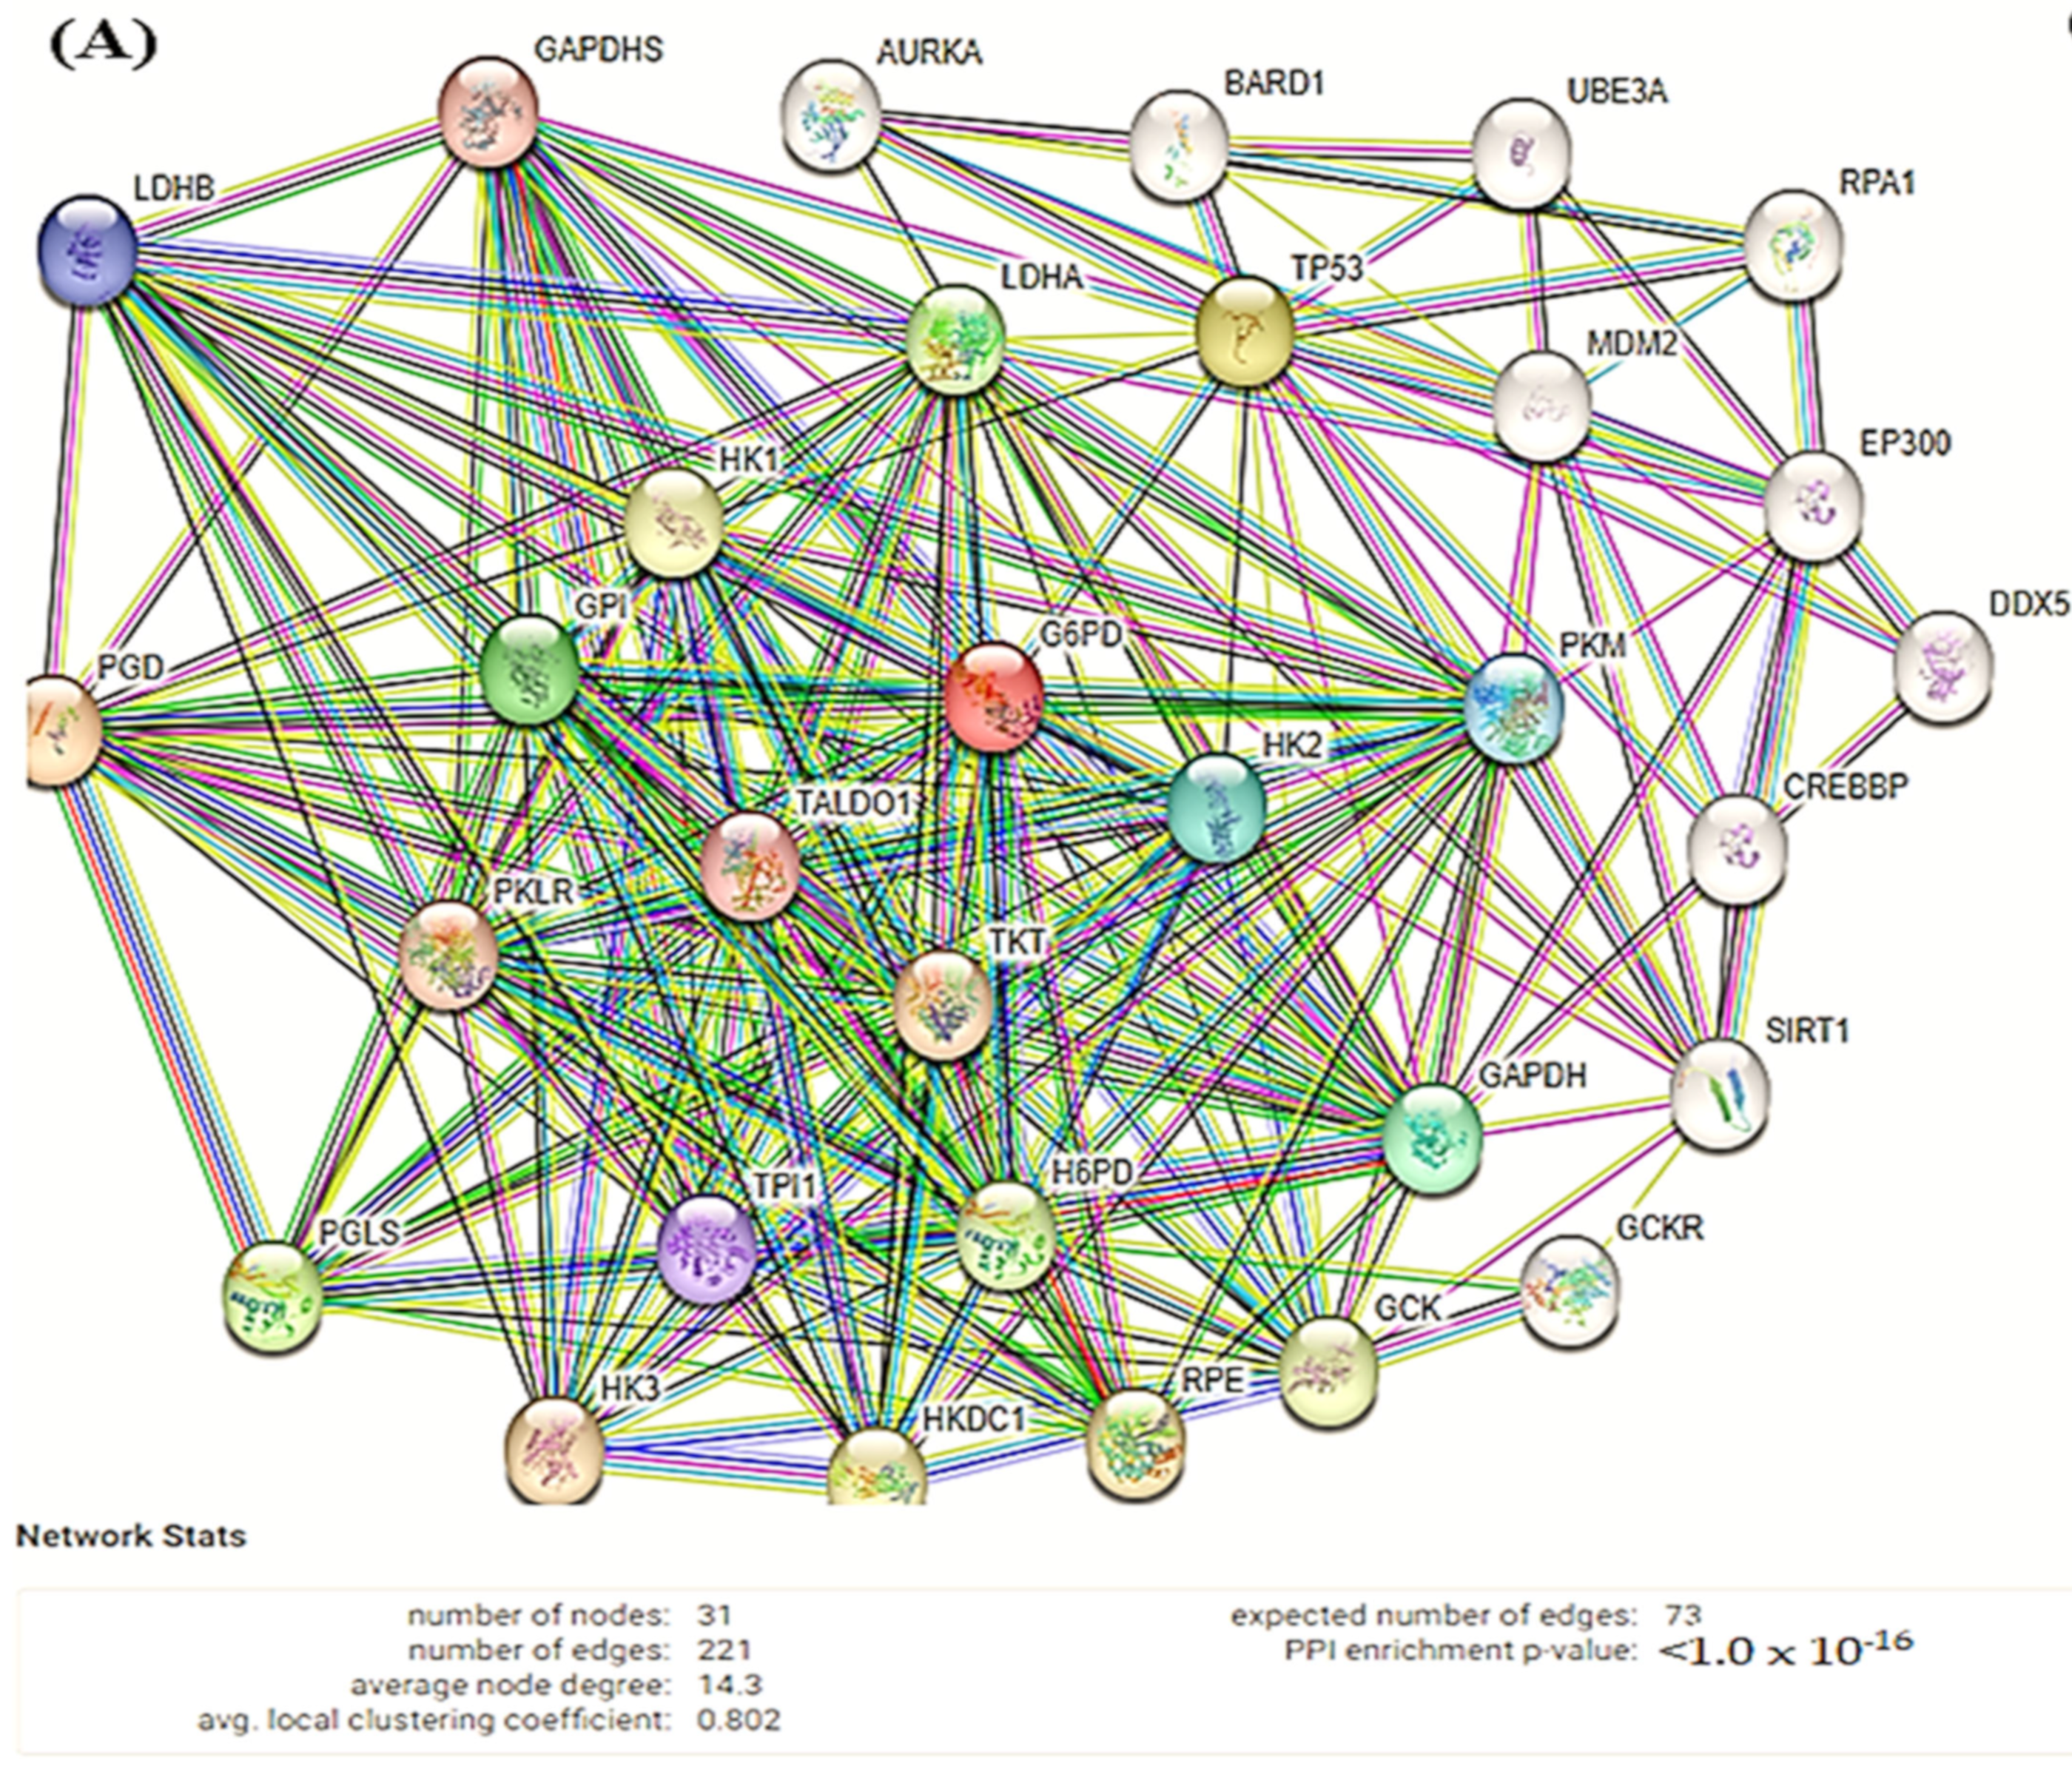
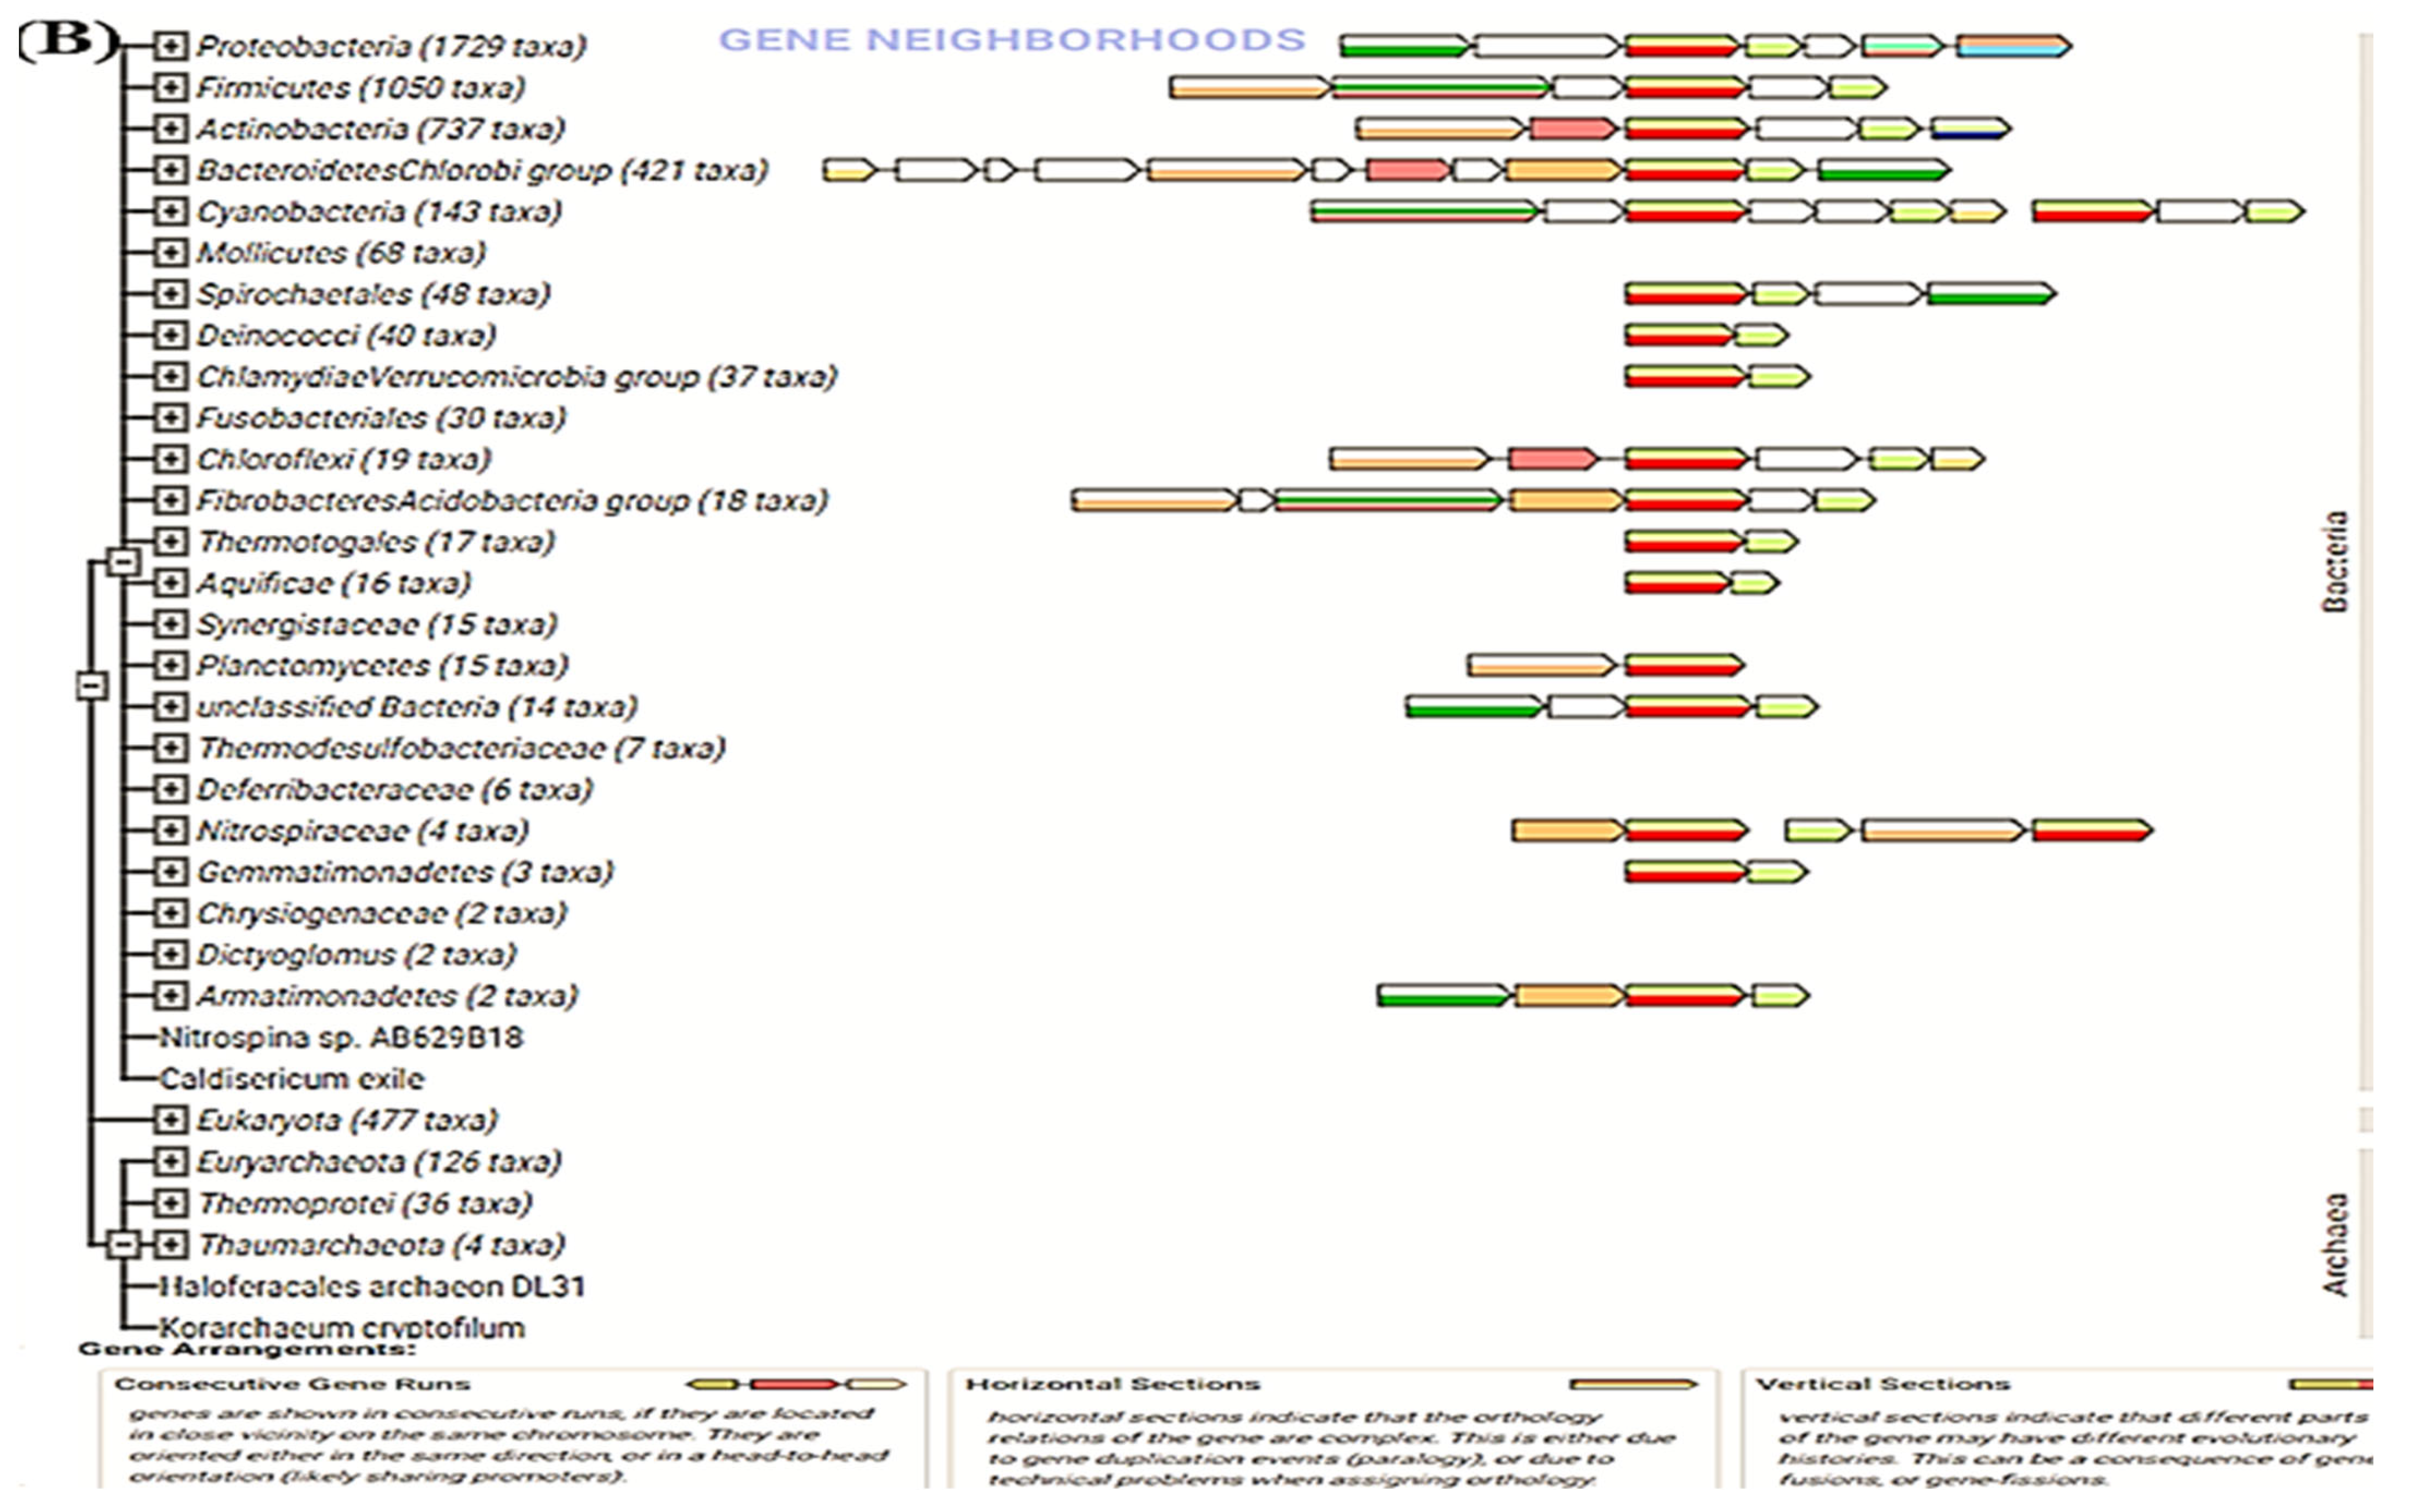
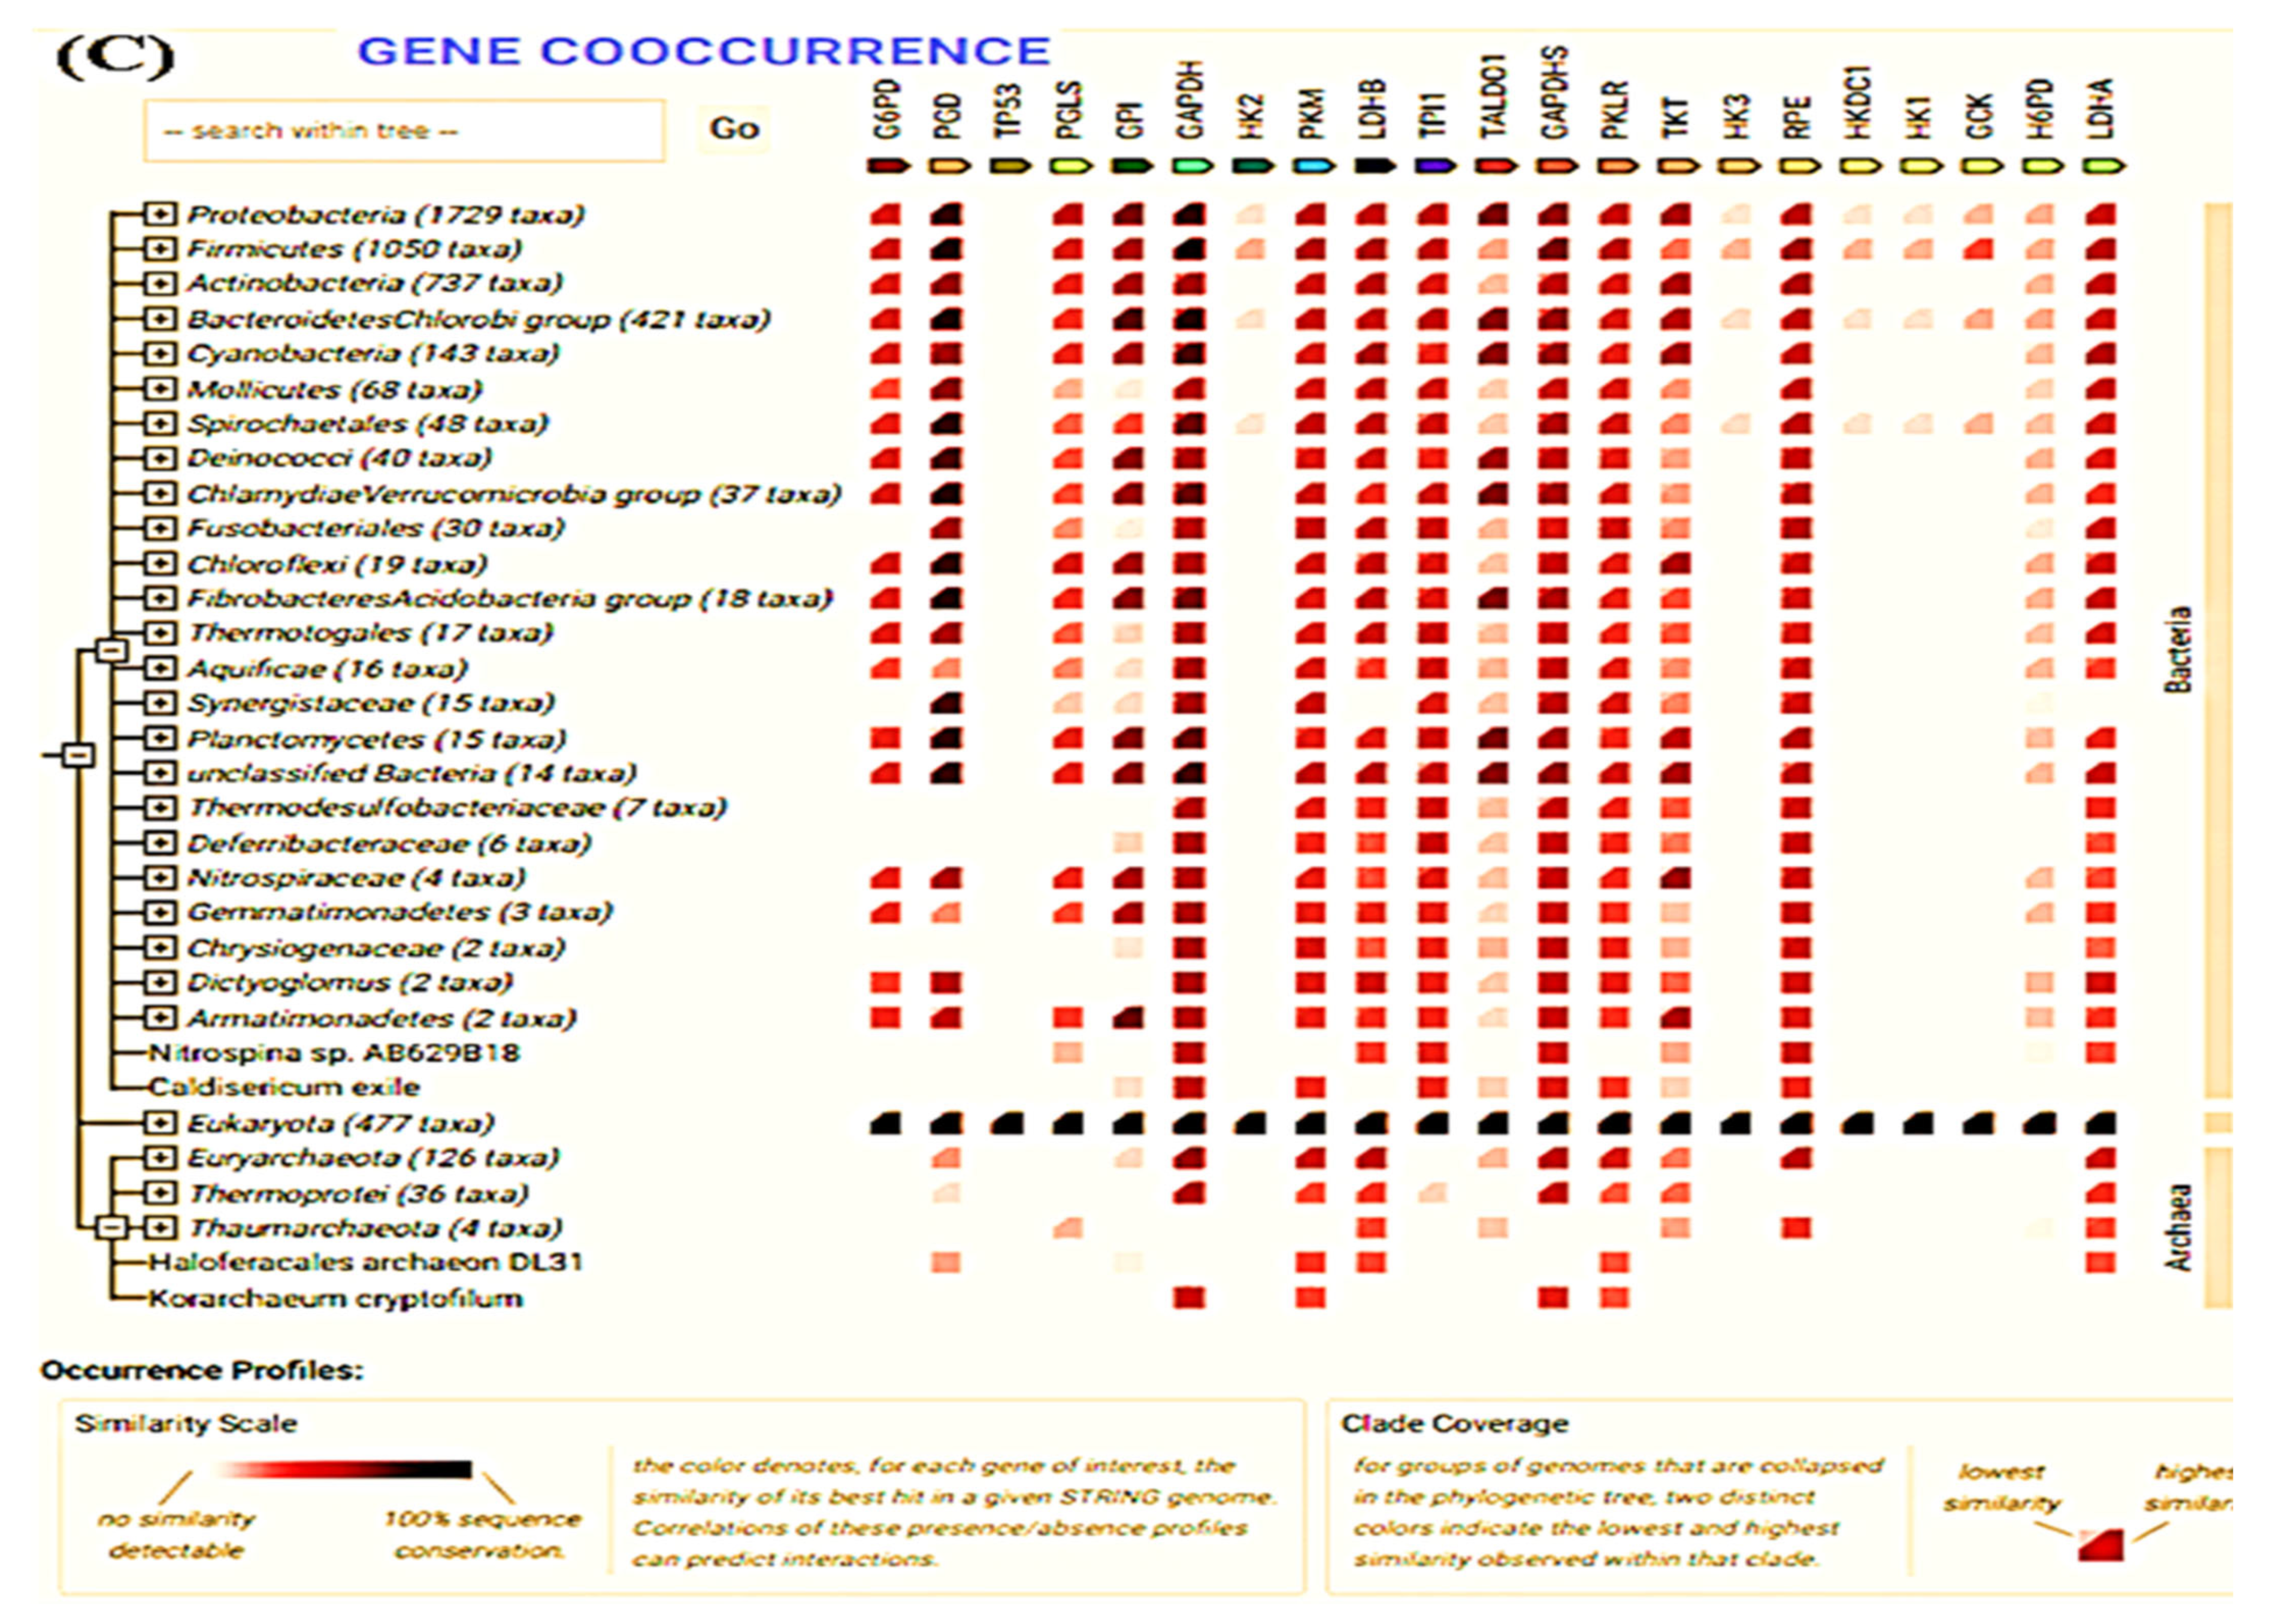
3.6. STRING
3.7. CASTp
4. Discussion
5. Conclusions
Author Contributions
Funding
Institutional Review Board Statement
Informed Consent Statement
Data Availability Statement
Acknowledgments
Conflicts of Interest
Abbreviations
References
- Stincone, A.; Prigione, A.; Cramer, T.; Wamelink, M.; Campbell, K.; Cheung, E.; Olin-Sandoval, V.; Grüning, N.-M.; Krüger, A.; Alam, M.T.; et al. The return of metabolism: Biochemistry and physiology of the pentose phosphate pathway. Biol. Rev. Camb. Philos. Soc. 2015, 90, 927–963. [Google Scholar] [CrossRef] [PubMed] [Green Version]
- Cortés-Morales, Y.Y.; Vanoye-Carlo, A.; Castillo-Rodríguez, R.A.; Serrano-Posada, H.; González-Valdez, A.; Ortega-Cuellar, D.; Hernández-Ochoa, B.; Moreno-Vargas, L.M.; Prada-Gracia, D.; Sierra-Palacios, E.; et al. Cloning and biochemical characterization of three glucose-6-phosphate dehydrogenase mutants presents in the Mexican population. Int. J. Biol. Macromol. 2018, 119, 926–936. [Google Scholar] [CrossRef] [PubMed]
- Martínez-Rosas, V.; Juárez-Cruz, M.V.; Ramírez-Nava, E.J.; Hernández-Ochoa, B.; Morales-Luna, L.; González-Valdez, A.; SerranoPosada, H.; Cárdenas-Rodríguez, N.; Ortiz-Ramírez, P.; Centeno-Leija, S.; et al. Effects of Single and Double Mutants in Human Glucose-6-Phosphate Dehydrogenase Variants Present in the Mexican Population: Biochemical and Structural Analysis. Int. J. Mol. Sci. 2020, 21, 2732. [Google Scholar] [CrossRef] [PubMed] [Green Version]
- Carvalho, C.G.; Castro, S.M.; Santin, A.P.; Zaleski, C.; Carvalho, F.G.; Giugliani, R. Glucose-6-phosphate-dehydrogenase deficiency and its correlation with other risk factors in jaundiced newborns in southern brazil. Asian Pac. J. Trop. Biomed. 2011, 1, 110–113. [Google Scholar] [CrossRef] [Green Version]
- Domingo, G.J.; Advani, N.; Satyagraha, A.W.; Sibley, C.H.; Rowley, E.; Kalnoky, M.; Cohen, J.; Parker, M.; Kelley, M. Addressing the gender-knowledge gap in glucose-6-phosphate dehydrogenase deficiency: Challenges and opportunities. Int. Health 2019, 11, 7–14. [Google Scholar] [CrossRef] [PubMed] [Green Version]
- Hanahan, D.; Weinberg, R.A. Hallmarks of cancer: The next generation. Cell 2011, 144, 646–674. [Google Scholar] [CrossRef] [Green Version]
- Zhang, Q.; Yi, X.; Yang, Z.; Han, Q.; Di, X.; Chen, F.; Wang, Y.; Yi, Z.; Kuang, Y.; Zhu, Y. Overexpression of G6PD Represents a Potential Prognostic Factor in Clear Cell Renal Cell Carcinoma. J. Cancer 2017, 8, 665–673. [Google Scholar] [CrossRef] [Green Version]
- Su, X.; Gao, C.; Feng, X.; Jiang, M. miR-613 suppresses migration and invasion in esophageal squamous cell carcinoma via the targeting of G6PD. Exp. Ther. Med. 2020, 19, 3081–3089. [Google Scholar] [CrossRef] [Green Version]
- Zhang, Q.; Han, Q.; Yang, Z.; Ni, Y.; Agbana, Y.L.; Bai, H.; Yi, Z.; Yi, X.; Kuang, Y.; Zhu, Y. G6PD facilitates clear cell renal cell carcinoma invasion by enhancing MMP2 expression through ROS-MAPK axis pathway. Int. J. Oncol. 2020, 57, 197–212. [Google Scholar] [CrossRef] [Green Version]
- Shan, C.; Lu, Z.; Li, Z.; Sheng, H.; Fan, J.; Qi, Q.; Liu, S.; Zhang, S. 4-hydroxyphenylpyruvate dioxygenase promotes lung cancer growth via pentose phosphate pathway (PPP) flux mediated by LKB1-AMPK/HDAC10/G6PD axis. Cell Death Dis. 2019, 10, 525. [Google Scholar] [CrossRef] [Green Version]
- Du, W.; Jiang, P.; Mancuso, A.; Stonestrom, A.; Brewer, M.D.; Minn, A.J.; Mak, T.W.; Wu, M.; Yang, X. TAp73 enhances the pentose phosphate pathway and supports cell proliferation. Nat. Cell Biol. 2013, 15, 991–1000. [Google Scholar] [CrossRef]
- Ye, H.; Huang, H.; Cao, F.; Chen, M.; Zheng, X.; Zhan, R. HSPB1 Enhances SIRT2-Mediated G6PD Activation and Promotes Glioma Cell Proliferation. PLoS ONE 2016, 11, e0164285. [Google Scholar] [CrossRef] [Green Version]
- Lu, M.; Lu, L.; Dong, Q.; Yu, G.; Chen, J.; Qin, L.; Wang, L.; Zhu, W.; Jia, H. Elevated G6PD expression contributes to migration and invasion of hepatocellular carcinoma cells by inducing epithelial-mesenchymal transition. Acta Biochim. Biophys. Sin. 2018, 50, 70–380. [Google Scholar] [CrossRef] [Green Version]
- Nagashio, R.; Oikawa, S.; Yanagita, K.; Hagiuda, D.; Kuchitsu, Y.; Igawa, S.; Naoki, K.; Satoh, Y.; Ichinoe, M.; Murakumo, Y.; et al. Prognostic significance of G6PD expression and localization in lung adenocarcinoma. Biochim. Biophys. Acta Proteins Proteom. 2019, 1867, 38–46. [Google Scholar] [CrossRef]
- Pu, H.; Zhang, Q.; Zhao, C.; Shi, L.; Wang, Y.; Wang, J.; Zhang, M. Overexpression of G6PD is associated with high risks of recurrent metastasis and poor progression-free survival in primary breast carcinoma. World J. Surg. Oncol. 2015, 13, 323. [Google Scholar] [CrossRef] [PubMed] [Green Version]
- Ju, H.Q.; Lu, Y.X.; Wu, Q.N.; Liu, J.; Zeng, Z.L.; Mo, H.Y.; Chen, Y.; Tian, T.; Wang, Y.; Kang, T.B.; et al. Disrupting G6PD-mediated Redox homeostasis enhances chemosensitivity in colorectal cancer. Oncogene 2017, 36, 6282–6292. [Google Scholar] [CrossRef] [PubMed] [Green Version]
- Kong, D.H.; Li, S.; Du, Z.X.; Liu, C.; Liu, B.Q.; Li, C.; Zong, Z.H.; Wang, H.Q. BAG3 elevation inhibits cell proliferation via direct interaction with G6PD in hepatocellular carcinomas. Oncotarget 2016, 7, 700–711. [Google Scholar] [CrossRef] [Green Version]
- Yang, C.A.; Huang, H.Y.; Lin, C.L.; Chang, J.G. G6PD as a predictive marker for glioma risk, prognosis and chemosensitivity. J. Neurooncol. 2018, 139, 661–670. [Google Scholar] [CrossRef] [PubMed]
- Su, Q.; Huang, C.S.; Wu, L.S.; Luo, X.; Tian, R.M.; Chen, Y. Change of G6PD Activity in Children with Acute Leukemia and Its Clinical Significance. Zhongguo shi yan xue ye xue za zhi 2018, 26, 1649–1656. [Google Scholar] [PubMed]
- He, C.; Yang, J.; Ding, J.; Li, S.; Wu, H.; Xiong, Y.; Zhou, F.; Jiang, Y.; Teng, L.; Yang, J. Downregulation of glucose-6-phosphate dehydrogenase by microRNA-1 inhibits the growth of pituitary tumor cells. Oncol. Rep. 2018, 40, 3533–3542. [Google Scholar] [CrossRef] [Green Version]
- Li, D.; Zhu, Y.; Tang, Q.; Lu, H.; Li, H.; Yang, Y.; Li, Z.; Tong, S. A new G6PD knockdown tumor-cell line with reduced proliferation and increased susceptibility to oxidative stress. Cancer Biother. Radiopharm. 2009, 24, 81–90. [Google Scholar] [CrossRef]
- Greenwell, M.; Rahman, P.K.S. Europe PMC funders group medicinal plants: Their use in anticancer treatment. Int. J. Pharm. Sci. 2015, 6, 4103–4112. [Google Scholar]
- Fu, Y.; Luo, J.; Qin, J.; Yang, M. Screening techniques for the identification of bioactive compounds in natural products. J. Pharm. Biomed. Anal. 2019, 168, 189–200. [Google Scholar] [CrossRef] [PubMed]
- Subramaniam, S.; Selvaduray, K.R.; Radhakrishnan, A.K. Bioactive compounds: Natural defense against cancer? Biomolecules 2019, 9, 758. [Google Scholar] [CrossRef] [Green Version]
- Yang, H.; Lou, C.; Sun, L.; Li, J.; Cai, Y.; Wang, Z.; Tang, Y. admetSAR 2.0: Web-service for prediction and optimization of chemical ADMET properties. Bioinformatics 2019, 35, 1067–1069. [Google Scholar] [CrossRef]
- Daina, A.; Michielin, O.; Zoete, V. SwissADME: A free web tool to evaluate pharmacokinetics, drug-likeness and medicinal chemistry friendliness of small molecules. Sci. Rep. 2017, 7, 42717. [Google Scholar] [CrossRef] [PubMed] [Green Version]
- Trott, O.; Olson, A.J. AutoDock Vina: Improving the speed and accuracy of docking with a new scoring function, efficient optimization, and multithreading. J. Comput. Chem. 2010, 31, 455–461. [Google Scholar] [CrossRef] [PubMed] [Green Version]
- Bienert, S.; Waterhouse, A.; de Beer, T.A.; Tauriello, G.; Studer, G.; Bordoli, L.; Schwede, T. The SWISS-MODEL Repository—New features and functionality. Nucl. Acids Res. 2017, 45, D313–D319. [Google Scholar] [CrossRef] [Green Version]
- Waterhouse, A.; Bertoni, M.; Bienert, S.; Studer, G.; Tauriello, G.; Gumienny, R.; Schwede, T. SWISS-MODEL: Homology modelling of protein structures and complexes. Nucl. Acids Res. 2018, 4, W296–W303. [Google Scholar] [CrossRef] [Green Version]
- Wiederstein, M.; Sippl, M.J. ProSA-web: Interactive web service for the recognition of errors in three-dimensional structures of proteins. Nucl. Acids Res. 2007, 35, W407–W410. [Google Scholar] [CrossRef] [PubMed] [Green Version]
- Laskowski, R.A.; MacArthur, M.W.; Moss, D.S.; Thornton, J.M. PROCHECK: A program to check the stereochemical quality of protein structures. J. Appl. Crystallogr. 1993, 26, 283–291. [Google Scholar] [CrossRef]
- Kleywegt, G.J.; Jones, T.A. Phi/psi-chology: Ramachandran revisited. Structure 1996, 4, 1395–1400. [Google Scholar] [CrossRef] [Green Version]
- Chen, T.L.; Yang, H.C.; Hung, C.Y.; Ou, M.H.; Pan, Y.Y.; Cheng, M.L.; Stern, A.; Lo, S.J.; Chiu, D.T. Impaired embryonic development in glucose-6-phosphate dehydrogenase-deficient Caenorhabditis elegans due to abnormal redox homeostasis induced activation of calcium-independent phospholipase and alteration of glycerophospholipid metabolism. Cell Death Dis. 2017, 8, e2545. [Google Scholar] [CrossRef] [PubMed] [Green Version]
- Yang, H.C.; Yu, H.; Liu, Y.C.; Chen, T.L.; Stern, A.; Lo, S.J.; Chiu, D.T. IDH-1 deficiency induces growth defects and metabolic alterations in GSPD-1-deficient Caenorhabditis elegans. J. Mol. Med. 2019, 97, 385–396. [Google Scholar] [CrossRef] [Green Version]
- Wu, Y.H.; Lee, Y.H.; Shih, H.Y.; Chen, S.H.; Cheng, Y.C.; Tsun-Yee Chiu, D. Glucose-6-phosphate dehydrogenase is indispensable in embryonic development by modulation of epithelial-mesenchymal transition via the NOX/Smad3/miR-200b axis. Cell Death Dis. 2018, 9, 10. [Google Scholar] [CrossRef] [Green Version]
- Xia, H.; Li, L.; Zhou, Y.; Ren, P.; He, Z.; Shu, L. Expression of g6pd gene in wild type zebrafish embryos of early development. Zhejiang Da Xue Xue Bao Yi Xue Ban 2018, 47, 57–63. [Google Scholar] [PubMed]
- Nobrega-Pereira, S.; Fernandez-Marcos, P.J.; Brioche, T.; Gomez-Cabrera, M.C.; Salvador-Pascual, A.; Flores, J.M.; Vina, J.; Serrano, M. G6PD protects from oxidative damage and improves healthspan in mice. Nat. Commun. 2016, 7, 10894. [Google Scholar] [CrossRef] [Green Version]
- Dong, T.; Kang, X.; Liu, Z.; Zhao, S.; Ma, W.; Xuan, Q.; Liu, H.; Wang, Z.; Zhang, Q. Altered glycometabolism affects both clinical features and prognosis of triple-negative and neoadjuvant chemotherapy-treated breast cancer. Tumor Biol. 2016, 37, 8159–8168. [Google Scholar] [CrossRef]
- Mele, L.; la Noce, M.; Paino, F.; Regad, T.; Wagner, S.; Liccardo, D.; Papaccio, G.; Lombardi, A.; Caraglia, M.; Tirino, V.; et al. Glucose-6-phosphate dehydrogenase blockade potentiates tyrosine kinase inhibitor effect on breast cancer cells through autophagy perturbation. J. Exp. Clin. Cancer Res. 2019, 38, 160. [Google Scholar] [CrossRef] [Green Version]
- Wang, J.; Yuan, W.; Chen, Z.; Wu, S.; Chen, J.; Ge, J.; Hou, F.; Chen, Z. Overexpression of G6PD is associated with poor clinical outcome in gastric cancer. Tumor Biol. 2012, 33, 95–101. [Google Scholar] [CrossRef] [PubMed]
- Chen, X.; Xu, Z.; Zhu, Z.; Chen, A.; Fu, G.; Wang, Y.; Pan, H.; Jin, B. Modulation of G6PD affects bladder cancer via ROS accumulation and the AKT pathway in vitro. Int. J. Oncol. 2018, 53, 1703–1712. [Google Scholar] [CrossRef] [PubMed] [Green Version]
- Yi, H.; Zheng, X.; Song, J.; Shen, R.; Su, Y.; Lin, D. Exosomes mediated pentose phosphate pathway in ovarian cancer metastasis: A proteomics analysis. Int. J. Clin. Exp. Pathol. 2015, 8, 15719–15728. [Google Scholar] [PubMed]
- Massari, F.; Ciccarese, C.; Santoni, M.; Iacovelli, R.; Mazzucchelli, R.; Piva, F.; Scarpelli, M.; Berardi, R.; Tortora, G.; Lopez-Beltran, A.; et al. Metabolic phenotype of bladder cancer. Cancer Treat. Rev. 2016, 45, 46–57. [Google Scholar] [CrossRef]
- Nna, E.; Tothill, I.E.; Ludeman, L.; Bailey, T. Endogenous control genes in prostate cells: Evaluation of gene expression using ‘real-time’ quantitative polymerase chain reaction. Med. Princ. Pract. 2010, 19, 433–439. [Google Scholar] [CrossRef]
- Dore, M.P.; Davoli, A.; Longo, N.; Marras, G.; Pes, G.M. Glucose-6-phosphate dehydrogenase deficiency and risk of colorectal cancer in Northern Sardinia: A retrospective observational study. Medicine 2016, 95, e5254. [Google Scholar] [CrossRef] [PubMed]
- Poulain, L.; Sujobert, P.; Zylbersztejn, F.; Barreau, S.; Stuani, L.; Lambert, M.; Palama, T.L.; Chesnais, V.; Birsen, R.; Vergez, F.; et al. High mTORC1 activity drives glycolysis addiction and sensitivity to G6PD inhibition in acute myeloid leukemia cells. Leukemia 2017, 31, 2326–2335. [Google Scholar] [CrossRef]
- Barajas, J.M.; Reyes, R.; Guerrero, M.J.; Jacob, S.T.; Motiwala, T.; Ghoshal, K. The role of miR-122 in the dysregulation of glucose-6-phosphate dehydrogenase (G6PD) expression in hepatocellular cancer. Sci. Rep. 2018, 8, 9105. [Google Scholar] [CrossRef]
- Gani, O.A.; Engh, R.A. Protein kinase inhibition of clinically important staurosporine analogues. Nat. Prod. Rep. 2010, 27, 489–498. [Google Scholar] [CrossRef] [PubMed]
- Del Solar, V.; Lizardo, D.Y.; Li, N.; Hurst, J.J.; Brais, C.J.; Atilla Gokcumen, G.E. Differential Regulation of Specific Sphingolipids in Colon Cancer Cells during StaurosporineInduced Apoptosis. Chem. Biol. 2015, 22, 1662–1670. [Google Scholar] [CrossRef]
- Yadav, S.S.; Prasad, C.B.; Prasad, S.B.; Pandey, L.K.; Singh, S.; Pradhan, S.; Narayan, G. Anti-tumor activity of staurosporine in the tumor microenvironment of cervical cancer: An in vitro study. Life Sci. 2015, 133, 21–28. [Google Scholar] [CrossRef]
- Vasaturo, F.; Malacrino, C.; Sallusti, E.; Coppotelli, G.; Birarelli, P.; Giuffrida, A.; Albonici, L.; Simonelli, L.; Modesti, A.; Modesti, M.; et al. Role of extracellular matrix in regulation of staurosporine-induced apoptosis in breast cancer cells. Oncol. Rep. 2005, 13, 745–750. [Google Scholar] [CrossRef] [PubMed]
- Stepczynska, A.; Lauber, K.; Engels, I.H.; Janssen, O.; Kabelitz, D.; Wesselborg, S.; Schulze-Osthoff, K. Staurosporine and conventional anticancer drugs induce overlapping.; yet distinct pathways of apoptosis and caspase activation. Oncogene 2001, 20, 1193–1202. [Google Scholar] [CrossRef] [Green Version]
- Saeki, T.; Inui, H.; Fujioka, S.; Fukuda, S.; Nomura, A.; Nakamura, Y.; Park, E.Y.; Sato, K.; Kanamoto, R. Staurosporine synergistically potentiates the deoxycholate-mediated induction of COX-2 expression. Physiol. Rep. 2014, 2, e12143. [Google Scholar] [CrossRef] [PubMed]
- Zhao, C.; Yin, P.; Mei, C.; Li, N.; Yao, W.; Li, X.; Qi, J.; Fan, K.; Li, Z.; Wang, L.; et al. Down-regulation of DNA methyltransferase 3B in staurosporine-induced apoptosis and its mechanism in human hepatocarcinoma cell lines. Mol. Cell Biochem. 2013, 376, 111–119. [Google Scholar] [CrossRef]
- Zhang, H.; Vollmer, M.; De Geyter, M.; Dürrenberger, M.; De Geyter, C. Apoptosis and differentiation induced by staurosporine in granulosa tumor cells is coupled with activation of JNK and suppression of p38 MAPK. Int. J. Oncol. 2005, 26, 1575–1580. [Google Scholar] [CrossRef]
- Peng, H.Y.; Liao, H.F. Staurosporine induces megakaryocytic differentiation through the upregulation of JAK/Stat3 signaling pathway. Ann. Hematol. 2011, 90, 1017–1029. [Google Scholar] [CrossRef] [PubMed]
- Short, D.M.; Heron, I.D.; Birse-Archbold, J.L.; Kerr, L.; Sharkey, J.; McCulloch, J. Apoptosis induced by staurosporine alters chaperone and endoplasmic reticulum proteins: Identification by quantitative proteomics. Proteomics 2007, 7, 3085–3096. [Google Scholar] [CrossRef] [PubMed]
- Li, X.; Li, Z.; Li, N.; Qi, J.; Fan, K.; Yin, P.; Zhao, C.; Liu, Y.; Yao, W.; Cai, X.; et al. MAGI2 enhances the sensitivity of BEL-7404 human hepatocellular carcinoma cells to staurosporine-induced apoptosis by increasing PTEN stability. Int. J. Mol. Med. 2013, 32, 439–447. [Google Scholar] [CrossRef] [Green Version]
- Noël, A.; Barrier, L.; Rinaldi, F.; Hubert, C.; Fauconneau, B.; Ingrand, S. Lithium chloride and staurosporine potentiate the accumulation of phosphorylated glycogen synthase kinase 3β/Tyr216; resulting in glycogen synthase kinase 3β activation in SH-SY5Y human neuroblastoma cell lines. J. Neurosci. Res. 2011, 89, 755–763. [Google Scholar] [CrossRef]
- Lipinski, C.A. Lead-and drug-like compounds: The rule-of-five revolution. Drug Discov. Today Technol. 2004, 1, 337–341. [Google Scholar] [CrossRef]
- Malla, B.A.; Ali, A.; Maqbool, I.; Dar, N.A.; Ahmad, S.B.; Alsaffar, R.M.; Rehman, M.U. Insights into molecular docking and dynamics to reveal therapeutic potential of natural compounds against P53 protein. J. Biomol. Struct. Dyn. 2022, 40, 1–20. [Google Scholar] [CrossRef]
- Rehman, M.U.; Ali, A.; Ansar, R.; Arafah, A.; Imtiyaz, Z.; Wani, T.A.; Ganie, S.A. In Silico molecular docking and dynamic analysis of natural compounds against major non-structural proteins of SARS-COV-2. J. Biomol. Struct. Dyn. 2022, 40, 1–17. [Google Scholar] [CrossRef]
- Wang, Y.; Xing, J.; Xu, Y.; Zhou, N.; Peng, J.; Xiong, Z.; Jiang, H. In silico ADME/T modelling for rational drug design. Q. Rev. Biophys. 2015, 48, 488–515. [Google Scholar] [CrossRef] [PubMed] [Green Version]
- Banerjee, P.; Eckert, A.O.; Schrey, A.K.; Preissner, R. ProTox-II: A webserver for the prediction of toxicity of chemicals. Nucl. Acids Res. 2018, 46, W257–W263. [Google Scholar] [CrossRef] [PubMed] [Green Version]
- Drwal, M.N.; Banerjee, P.; Dunkel, M.; Wettig, M.R.; Preissner, R. ProTox: A web server for the in silico prediction of rodent oral toxicity. Nucl. Acids Res. 2014, 42, W53–W58. [Google Scholar] [CrossRef] [PubMed] [Green Version]
- Schmidt, T.; Bergner, A.; Schwede, T. Modelling three-dimensional protein structures for applications in drug design. Drug Discov. Today 2014, 19, 890–897. [Google Scholar] [CrossRef] [PubMed] [Green Version]
- Elcock, A.H.; McCammon, J.A. Identification of protein oligomerization states by analysis of interface conservation. Proc. Natl. Acad. Sci. USA 2001, 98, 2990–2994. [Google Scholar] [CrossRef] [Green Version]
- Capra, J.A.; Singh, M. Predicting functionally important residues from sequence conservation. Bioinformatics 2007, 23, 1875–1882. [Google Scholar] [CrossRef] [Green Version]
- Cao, R.; Wang, Z.; Cheng, J. Designing and evaluating the MULTICOM protein local and global model quality prediction methods in the CASP10 experiment. BMC Struct. Biol. 2014, 14, 13. [Google Scholar] [CrossRef] [Green Version]
- Skwark, M.J.; Abdel-Rehim, A.; Elofsson, A. PconsC: Combination of direct information methods and alignments improves contact prediction. Bioinformatics 2013, 29, 1815–1816. [Google Scholar] [CrossRef] [PubMed] [Green Version]
- Yin, H.; Li, Y.Z.; Li, M.L. On the relation between residue flexibility and residue interactions in proteins. Protein Pept. Lett. 2011, 18, 450–456. [Google Scholar] [CrossRef]
- Weiss, M.S. On the interrelationship between atomic displacement parameters (ADPs) and coordinates in protein structures. Acta Crystallogr. 2007, D63, 1235–1242. [Google Scholar] [CrossRef] [PubMed]
- Liu, Q.; Li, Z.; Li, J. Use B-factor related features for accurate classification between protein binding interfaces and crystal packing contacts. BMC Bioinform. 2014, 15, S3. [Google Scholar] [CrossRef] [PubMed] [Green Version]
- Pedamallu, C.S.; Posfai, J. Open source tool for prediction of genome wide protein-protein interaction network based on ortholog information. Source Code Biol. Med. 2010, 5, 8. [Google Scholar] [CrossRef] [Green Version]
- Toh, S.; Holbrook-Smith, D.; Stogios, P.J.; Onopriyenko, O.; Lumba, S.; Tsuchiya, Y.; Savchenko, A.; McCourt, P. Structure-function analysis identifies highly sensitive strigolactone receptors in Striga. Science 2015, 350, 203–207. [Google Scholar] [CrossRef] [PubMed]
- Reetz, M.T. Directed Evolution of Selective Enzymes. In Catalysts for Organic Chemistry and Biotechnology; Wiley-VCH: Weinheim, Germany, 2016. [Google Scholar]
- Brouwer, J.M.; Lan, P.; Cowan, A.D.; Bernardini, J.P.; Birkinshaw, R.W.; van Delft, M.F.; Sleebs, B.E.; Robin, A.Y.; Wardak, A.; Tan, I.K. Conversion of Bim-BH3 from activator to inhibitor of Bak through structure-based design. Mol. Cell 2017, 68, 659–672. [Google Scholar] [CrossRef] [PubMed] [Green Version]


| S. No | Phytocompounds | Binding Affinity (kcal/mol) | Inhibition Constant (Ki) µM |
|---|---|---|---|
| 1 | Staurosporine | −9.2 | 15.54 |
| 2 | Withanoside II | −9.0 | 15.20 |
| 3 | Withanoside V | −8.9 | 15.03 |
| 4 | Polydatin | −8.5 | 14.36 |
| 5 | Isosilychristin | −8.2 | 13.85 |
| 6 | Gingerenone | −7.8 | 13.17 |
| 7 | Eugenol | −7.6 | 12.84 |
| 8 | Naringenin | −7.2 | 11.86 |
| 9 | Syringic Acid | −7.2 | 11.86 |
| 10 | Zerumbone | −6.2 | 10.47 |
| 11 | Zingerone | −5.5 | 9.29 |
| Drug | |||
| 1 | Lapatinib | −7.9 | 13.34 |
| Protein | Compound | Interaction | Position |
|---|---|---|---|
| G6PD | Polydatin | Hydrogen bonding | SER179, GLU252 |
| Van der waals | PRO144, TYR147, PHE173, GLY174, SER180, ARG182, LEU183, ARG257, ASN262 | ||
| Pi-alkyl/alkyl | LYS171, ARG175 | ||
| Pi-sigma | PRO172 | ||
| Pi-Pi stacked | PHE253 | ||
| Carbon hydrogen bond | ASP258 | ||
| Withanoside II | Hydrogen bonding | LYS171, HIS201, ASP258, ARG365, GLN395 | |
| Van der waals | LEU43, LYS47, GLU170, TYR437, PRO172, HIS263, LYS205, TYR202, PHE237, VAL259, LYS360, PHE241 | ||
| Pi-sigma | PHE253 | ||
| Carbon hydrogen bond | GLU239 | ||
| Withanoside IV | Hydrogen bonding | LYS171, HIS263 | |
| Van der waals | PRO143, THR145, HIS201, TYR249, VAL259, PHE237, LYS360, ASP258 | ||
| Pi-alkyl | PRO144, PRO172 | ||
| Pi-sigma | PHE253 | ||
| Staurosporine | Van der waals | THR145, PRO143, ARG246, TYR249, PHE250, ARG175, ARG257, ASP258 | |
| Pi-alkyl | PRO144, LYS171 | ||
| Pi-sigma | PRO172 | ||
| Pi-Pi stacked | PHE253 | ||
| Drug | |||
| Lapatinib | Hydrogen bonding | LEU142 | |
| Van der waals | ASP42, LEU140, ALA141, TYR147, ARG175, TRP462, PHE173, ASP258, PHE253, TYR249, ARG246 | ||
| Pi-alkyl | PRO172 | ||
| Pi-anion | GLU170 | ||
| Amide-pi stacked | LYS171 | ||
| Pi-sigma | LEU43 | ||
| Halogen | GLY174 | ||
| Carbon hydrogen bond | ARG257 | ||
| ADMET | Compounds | Drug | |||
|---|---|---|---|---|---|
| Polydatin | Withanoside II | Withanoside IV | Staurosporine | Lapatinib | |
| Physicochemical Properties | |||||
| Molecular weight (g/mol) | 390.38 | 798.91 | 782.91 | 466.53 | 581.06 |
| Topological polar surface area (TPSA) (Å2) | 139.84 | 257.82 | 245.29 | 69.45 | 114.73 |
| Num. of H bond acceptors | 8 | 16 | 15 | 4 | 8 |
| Num. of H bond donors | 6 | 9 | 9 | 2 | 2 |
| Molar Refractivity | 100 | 193.69 | 194.21 | 139.39 | 153.88 |
| XLOGP | 1.03 | 0.12 | 0.99 | 3.24 | 5.12 |
| iLOGP | 1.75 | 4.80 | 3.58 | 3.29 | 4.20 |
| MLOGP | −0.36 | −1.67 | −1.03 | 2.60 | 3.44 |
| WLOGP | 0.23 | −0.98 | −0.19 | 3.39 | 7.34 |
| Lipinski | Yes | No | No | Yes | Yes |
| Veber | Yes | No | No | Yes | No |
| Ghose | Yes | No | No | No | No |
| Egan | No | No | No | Yes | No |
| Muegge | No | No | No | No | No |
| Bioavailability score | 0.55 | 0.17 | 0.17 | 0.55 | 0.55 |
| GI absorption | High | Low | Low | High | Low |
| BBB permeability | No | No | No | Yes | No |
| P-gp substrate | Yes | Yes | Yes | Yes | No |
| CYP1A2 inhibitor | No | No | No | No | No |
| CYP2C19 inhibitor | No | No | No | Yes | Yes |
| CYP2C9 inhibitor | No | No | No | No | Yes |
| CYP2D6 inhibitor | No | No | No | Yes | Yes |
| CYP3A4 inhibitor | No | No | No | Yes | Yes |
| Log Kp (skin permeation) cm/s | −7.95 | −11.09 | −10.37 | −6.85 | −6.21 |
| Pan-assay interference compounds (PAINS) | 0 | 0 | 0 | 0 | 0 |
| BRENK | 1 | 2 | 1 | 0 | 0 |
| Leadlikeness | No | No | No | No | No |
| Synthetic accessibility | 4.82 | 8.89 | 8.88 | 4.93 | 4.05 |
| Compounds | LD50 (Mg/Kg) | Toxicity Class | Prediction Probability | ||||
|---|---|---|---|---|---|---|---|
| Hepatotoxicity | Cytotoxicity | Immunotoxicity | Mutagenicity | Carcinogenicity | |||
| Polydatin | 1380 | 4 | 0.85 | 0.85 | 0.74 | 0.73 | 0.81 |
| Withanoside II | 3 | 1 | 0.93 | 0.55 | 0.99 | 0.80 | 0.72 |
| Withanoside IV | 19 | 2 | 0.94 | 0.50 | 0.99 | 0.96 | 0.74 |
| Staurosporine | 1000 | 4 | 0.73 | 0.79 | 0.92 | 0.52 | 0.61 |
| Lapatinib | 1500 | 4 | 0.80 | 0.76 | 0.96 | 0.51 | 0.55 |
| S. No | Parameters | Interacting Residues |
|---|---|---|
| 1 | Ramachandran outliers | D407 ASP, B407 ASP, A407 ASP, C407 ASP |
| 2 | Rotamer outliers | D105 GLN, C317 GLU, A317 GLU, B317 GLU, D270 VAL, C270 VAL, B270 VAL, A270 VAL, C150 GLN, B150 GLN, B174 TYR, A174 TYR, D174 TYR, C174 TYR, B395 THR, A395 THR, D395 THR, C395 THR, C393 ASP, D393 ASP, D476 GLU, C476 GLU, B393 ASP, B476 GLU, A393 ASP, A476 GLU, D347 ASP, B347 ASP, A347 ASP, C347 ASP, D407 ASP, C407 ASP, A407 ASP, B407 ASP, A71 GLU, B71 GLU, C71 GLU, D71 GLU |
| 3 | C-beta deviations | A216 GLU, B216 GLU, C216 GLU, D216 GLU, B407 ASP, C407 ASP, A407 ASP, D407 ASP, D280 TYR, B280 TYR, C280 TYR, A280 TYR, A151 SER, C151 SER, B151 SER, D151 SER |
| 4 | Bad Angles | B479 TYR, A479 TYR, D479 TYR, C479 TYR |
| 5 | Bad Bonds | (D438 THR-D439 PRO), (A438 THR-A439 PRO), (B438 THR-B439 PRO), (C438 THR-C439 PRO), (B21 TYR-B22 PRO), D190 ASN, B190 ASN, C190 ASN, A190 ASN, (D21 TYR-D22 PRO), C2 ASP, (A21 TYR-A22 PRO), (C21 TYR-C22 PRO), B2 ASP, A2 ASP, D225 PHE, D2 ASP, C225 PHE, A225 PHE, B225 PHE, (A57 GLU-A58 PRO), D424 PHE, (D57 GLU-D58 PRO), (C57 GLU-C58 PRO), (B57 GLU-B58 PRO), A424 PHE, C424 PHE, B424 PHE, B346 HIS, (A143 LYS-A144 PRO), A346 HIS, D346 HIS, (B143 LYS-B144 PRO), (C143 LYS-C144 PRO), D101 HIS, C346 HIS, B173 HIS, (D143 LYS-D144 PRO), A101 HIS, D235 HIS, B127 HIS, C235 HIS, C173 HIS, B101 HIS, A173 HIS, D173 HIS, C127 HIS, C101 HIS, B235 HIS, D127 HIS, A127 HIS, A235 HIS, C148 ASP, C51 ASP, C354 HIS, D354 HIS, (D448 LYS-D449 PRO), B148 ASP, (B448 LYS-B449 PRO), D158 HIS, B51 ASP, A158 HIS, D51 ASP, C158 HIS, A354 HIS, B158 HIS, C442 HIS, B354 HIS, A51 ASP, (D300 VAL-D301 PRO), B442 HIS, (C300 VAL-C301 PRO), (B300 VAL-B301 PRO), (A300 VAL-A301 PRO), (C369 ASN-C370 GLU), A423 HIS, (D369 ASN-D370 GLU) |
| Pocket ID | Area | Volume |
|---|---|---|
| 1 | 1124.12 | 1501.13 |
| 2 | 508.06 | 279.43 |
| 3 | 170.81 | 86.03 |
| 4 | 103.32 | 33.28 |
| 5 | 55.87 | 20.12 |
Disclaimer/Publisher’s Note: The statements, opinions and data contained in all publications are solely those of the individual author(s) and contributor(s) and not of MDPI and/or the editor(s). MDPI and/or the editor(s) disclaim responsibility for any injury to people or property resulting from any ideas, methods, instructions or products referred to in the content. |
© 2023 by the authors. Licensee MDPI, Basel, Switzerland. This article is an open access article distributed under the terms and conditions of the Creative Commons Attribution (CC BY) license (https://creativecommons.org/licenses/by/4.0/).
Share and Cite
Aldossari, R.M.; Ali, A.; Rehman, M.U.; Rashid, S.; Ahmad, S.B. Computational Approaches for Identification of Potential Plant Bioactives as Novel G6PD Inhibitors Using Advanced Tools and Databases. Molecules 2023, 28, 3018. https://doi.org/10.3390/molecules28073018
Aldossari RM, Ali A, Rehman MU, Rashid S, Ahmad SB. Computational Approaches for Identification of Potential Plant Bioactives as Novel G6PD Inhibitors Using Advanced Tools and Databases. Molecules. 2023; 28(7):3018. https://doi.org/10.3390/molecules28073018
Chicago/Turabian StyleAldossari, Rana M., Aarif Ali, Muneeb U. Rehman, Summya Rashid, and Sheikh Bilal Ahmad. 2023. "Computational Approaches for Identification of Potential Plant Bioactives as Novel G6PD Inhibitors Using Advanced Tools and Databases" Molecules 28, no. 7: 3018. https://doi.org/10.3390/molecules28073018