Article

The Hydrophobic Extract of Sorghum bicolor (L. Moench) Enriched in Apigenin-Protected Rats against Aflatoxin B1-Associated Hepatorenal Derangement

by
Solomon E. Owumi
1,*,
Blessing Ajakaiye
2,
Adenike O. Akinwunmi
3,
Sarah O. Nwozo
2 and
Adegboyega K. Oyelere
4,*
1
Cancer Research and Molecular Biology Laboratories, Department of Biochemistry, Faculty of Basic Medical Sciences, University of Ibadan, Ibadan 200005, Nigeria
2
Nutrition and Industrial Biochemistry Laboratories, Department of Biochemistry, Faculty of Basic Medical Sciences, University of Ibadan, Ibadan 200005, Nigeria
3
Department of Chemistry, Ekiti State University, Ado-Ekiti 360001, Ekiti, Nigeria
4
School of Chemistry & Biochemistry, Parker H. Petit Institute for Bioengineering and Bioscience, Georgia Institute of Technology, Atlanta, GA 30332, USA
*
Authors to whom correspondence should be addressed.
Molecules 2023, 28(7), 3013; https://doi.org/10.3390/molecules28073013
Submission received: 22 February 2023 / Revised: 13 March 2023 / Accepted: 14 March 2023 / Published: 28 March 2023

Abstract

:
Aflatoxin B1 (AFB1) is a recalcitrant metabolite produced by fungi species, and due to its intoxications in animals and humans, it has been classified as a Group 1 carcinogen in humans. Preserving food products with Sorghum bicolor sheath can minimise the contamination of agricultural products and avert ill health occasioned by exposure to AFB1. The current study investigated the ameliorating effect of Sorghum bicolor sheath hydrophobic extract (SBE-HP) enriched in Apigenin (API) on the hepatorenal tissues of rats exposed to AFB1. The SBE-HP was characterised using TLC and LC-MS and was found to be enriched in Apigenin and its methylated analogues. The study used adult male rats divided into four experimental cohorts co-treated with AFB1 (50 µg/kg) and SBE-HP (5 and 10 mg/kg) for 28 days. Biochemical, enzyme-linked immunosorbent assays (ELISA) and histological staining were used to examine biomarkers of hepatorenal function, oxidative status, inflammation and apoptosis, and hepatorenal tissue histo-architectural alterations. Data were analysed using GraphPad Prism 8.3.0, an independent t-test, and a one-way analysis of variance. Co-treatment with SBE-HP ameliorated an upsurge in the biomarkers of hepatorenal functionality in the sera of rats, reduced the alterations in redox balance, resolved inflammation, inhibited apoptosis, and preserved the histological features of the liver and kidney of rats exposed to AFB1. SBE-HP-containing API is an excellent antioxidant regiment. It can amply prevent the induction of oxidative stress, inflammation, and apoptosis in the hepatorenal system of rats. Therefore, supplementing animal feeds and human foods with SBE-HP enriched in Apigenin may reduce the burden of AFB1 intoxication in developing countries with a shortage of effective antifungal agents.

1. Introduction

Aflatoxins (AFs) are mycotoxins produced by fungi species, especially the genus Aspergillus, including A. flavus, A. parasiticus, A. nomius, A. niger, and A. pseudotamarii [1,2,3]. The biosynthesis of AFs by fungi is driven under certain climatic conditions, including a temperature range of 25–35 °C and relative humidity of 80 to 100%, as typical in Sub-Saharan Africa [2,4], resulting in food spoilage [2,5,6] and significant economic loss [7]. AFs are classified, based on absorbance wavelengths and chromatographic mobility, into aflatoxin B1 (AFB1), aflatoxin B2 (AFB2), aflatoxin G1 (AFG1), and aflatoxin G2 (AFG2). In this classification guideline, the letters ‘B’ and ‘G’ are delineated as blue and green florescent colours emitted under UV light on thin-layer chromatographic plates. In contrast, subscripts 1 and 2 refer to the major and minor compounds, respectively [8]. Based on toxicity, the potency of AFs to mediate mutagenicity, carcinogenicity, and teratogenicity in humans and animals is in the order: AFB1 > AFG1 > AFB1 > AFG2 [9,10,11]. The class AFB1 is the most toxic of all the known aflatoxins, and it has been recognised by the World Health Organization (WHO) and the International Agency for Research on Cancer (IARC) as a group I carcinogenic hazard to humans [12]. The LD50 (lethal dose) of AFB1 highly depends on the species of organisms, with organisms such as rats, dogs, sheep, and monkeys being susceptible, while chickens and mice are resistant species [13,14]. Initially, it was claimed that humans could tolerate exposure to AFB1. However, recent carcinogenic potency established by the Joint FOA/WHO Expert Committee on Food Additives (JECFA) in Africa defined a maximum tolerable limit. It revealed that exposure to AFB1 is attributed to growth retardation, malnutrition, and immune suppression [15,16].
AFB1 toxicity depends on the absorption routes, distribution pattern, differences in the expression of CPY450 isoforms, and excretory pathways. AFB1 is absorbed and distributed to the enterocytes and hepatocytes, where different CYP450 enzymes act upon AFB1, including CYP3A4, 1A2, 2E6, and 3A5 [17,18] and NADPH-dependent reductase [19]. Specifically, NADPH-dependent reductase converts AFB1 into aflatoxicol (AFL), CYP3A4 and CYP1A2 convert AFB1 into aflatoxin Q1 (AFQ1), CYP1A1 and CYP1A2 convert AFB1 into aflatoxin M1 (AFM1), CYP3A4 converts AFB1 to aflatoxin P1 (AFP1) through an O-demethylation reaction, and CYP1A1, CYP1A2, CYP2E6, CPY3A4, and CYP3A5 convert AFB1 to aflatoxin B1-8, 9-epoxide (AFBO), an extremely reactive and toxic metabolite (Figure 1). Unlike AFBO, AFL, AFQ1, AFM, and AFP1 are clinically insignificant as they are not heavily implicated in mutagenicity, carcinogenicity, and teratogenicity. The mechanisms of AFBO toxicity are known to be through the formation of protein adducts, DNA adducts, and lipid peroxidation. Uncontrolled degradation of functional biological molecules following unfettered exposure to AFB1 has been observed to deplete the redox buffering system of rats, thereby predisposing cells to oxidative stress, inflammation, and programmed cell death [20,21,22]. Nonetheless, there is a safe pathway for removing AFBO from the enterocytes and hepatocytes via the second phase of biotransformation mediated by glutathione S-transferase (GST). GST is known to mediate the conjugation of AFBO with GSH to form the AFB1-S-G complex. This complex may bind to the 190-kDa multi-drug resistant protein (MRP) and the 170-kDa P-glycoprotein [23] and is extruded from the hepatocytes and enterocytes into bile and urine. Depleting GST and other innate antioxidant defence systems activities is known to increase the concentration of AFBO in the cells, leading to enhanced oxidative stress, oxidative DNA damage, chronic inflammation, and apoptosis in the hepatocytes and nephrons of rats [22,24].
Previous studies reported the harmful effects of AFB1 on the reproductive system [21], the endocrine system [25], the central nervous system [26], the cardiovascular system [27], and the immune system [28]. These reports reiterate that direct exposure to AFB1 could promote the development of disease and infection in animals and humans, hence the need to mitigate indiscriminate exposure to AFB1 and its associated health sequela.
Sorghum (Sorghum bicolor (L.) Moench is majorly cultivated as food in the semi-arid tropical regions of Asia and Africa [29]. Sorghum is a rich source of bioactive phytochemicals, including the two major 3-deoxyanthocyanidins, apigeninidin [30] and luteolinidin [31], and flavonoids such as apigenin, which are known to promote good health. Compounds extracted from Sorghum have been shown in in vivo and in vitro studies to have therapeutic effects against non-infectious disorders such as obesity, diabetes, dyslipidemia, cardiovascular disease, cancer, and hypertension [30,32]. Extracts from Sorghum enriched in certain phytochemicals such as apigenin (API), luteolin, luteolinidin, and apigeninidin in S. bicolor extracts have been shown to reduce oxidative stress by upregulating antioxidant enzymes while reducing the generation of reactive oxygen species (ROS) [30,33,34,35]. Based on the structural–activity relationship (SAR), the abilities of these compounds to stall oxidative stress may be attributed to their possession of several aromatic rings and phenolic groups [36]. These properties endow the leaf sheath extract of S. bicolor with high antioxidant potential and increase its free radical scavenging activity against ROS such as hydroxyl radicals and superoxide anions [37], one of the chief culprits of AFB1-induced hepatorenal toxicities. Experimental studies revealed that extracts of Sorghum bicolor (S. bicolor) significantly diminished ROS production by immune cells [37]. This report demonstrates the anti-inflammatory and immunomodulatory properties. Recently our laboratory developed a method to separate phytochemicals in S. bicolor into apigeninidin-enriched alcoholic extracts and a hydrophobic (CH2Cl2) extract (S. bicolor extract—SBE-HP). We observed that apigeninidin-enriched extracts of the plant protected the liver and kidney of male rats from AFB1-mediated increase in hepatorenal dysfunctional molecules, generation of ROS, pro-inflammatory molecules, and apoptotic proteins [30]. To further probe the ethnomedicinal benefits of the SBE-HP, we herein characterised the components of this hydrophobic extract using chromatographic and LC-MS techniques. We found SBE-HP devoid of apigeninidin and enriched in apigenin and apigenin analogues. Subsequently, we investigated the potential impact of this apigenin-rich SBE-HP in abating liver and kidney derangements following sub-acute exposure to AFB1 in male Wistar rats. The intention is to determine if SBE-HP could abrogate the AFB1-induced liver and kidney toxicities via antioxidative, anti-inflammatory, and apoptotic mechanisms. To this end, we treated rats with AFB1 and SBE-HP for 28 days and evaluated the effect of this treatment on endogenous antioxidant defence systems and levels of anti-inflammatory cytokines. We observed that SBE-HP improved endogenous antioxidant defence systems and upregulated anti-inflammatory cytokines while reversing the basal concentrations of hepatorenal dysfunction molecules, ROS, pro-inflammatory and apoptotic mediators, and histological lesions in the liver and kidney of rats challenged with AFB1.

2. Results

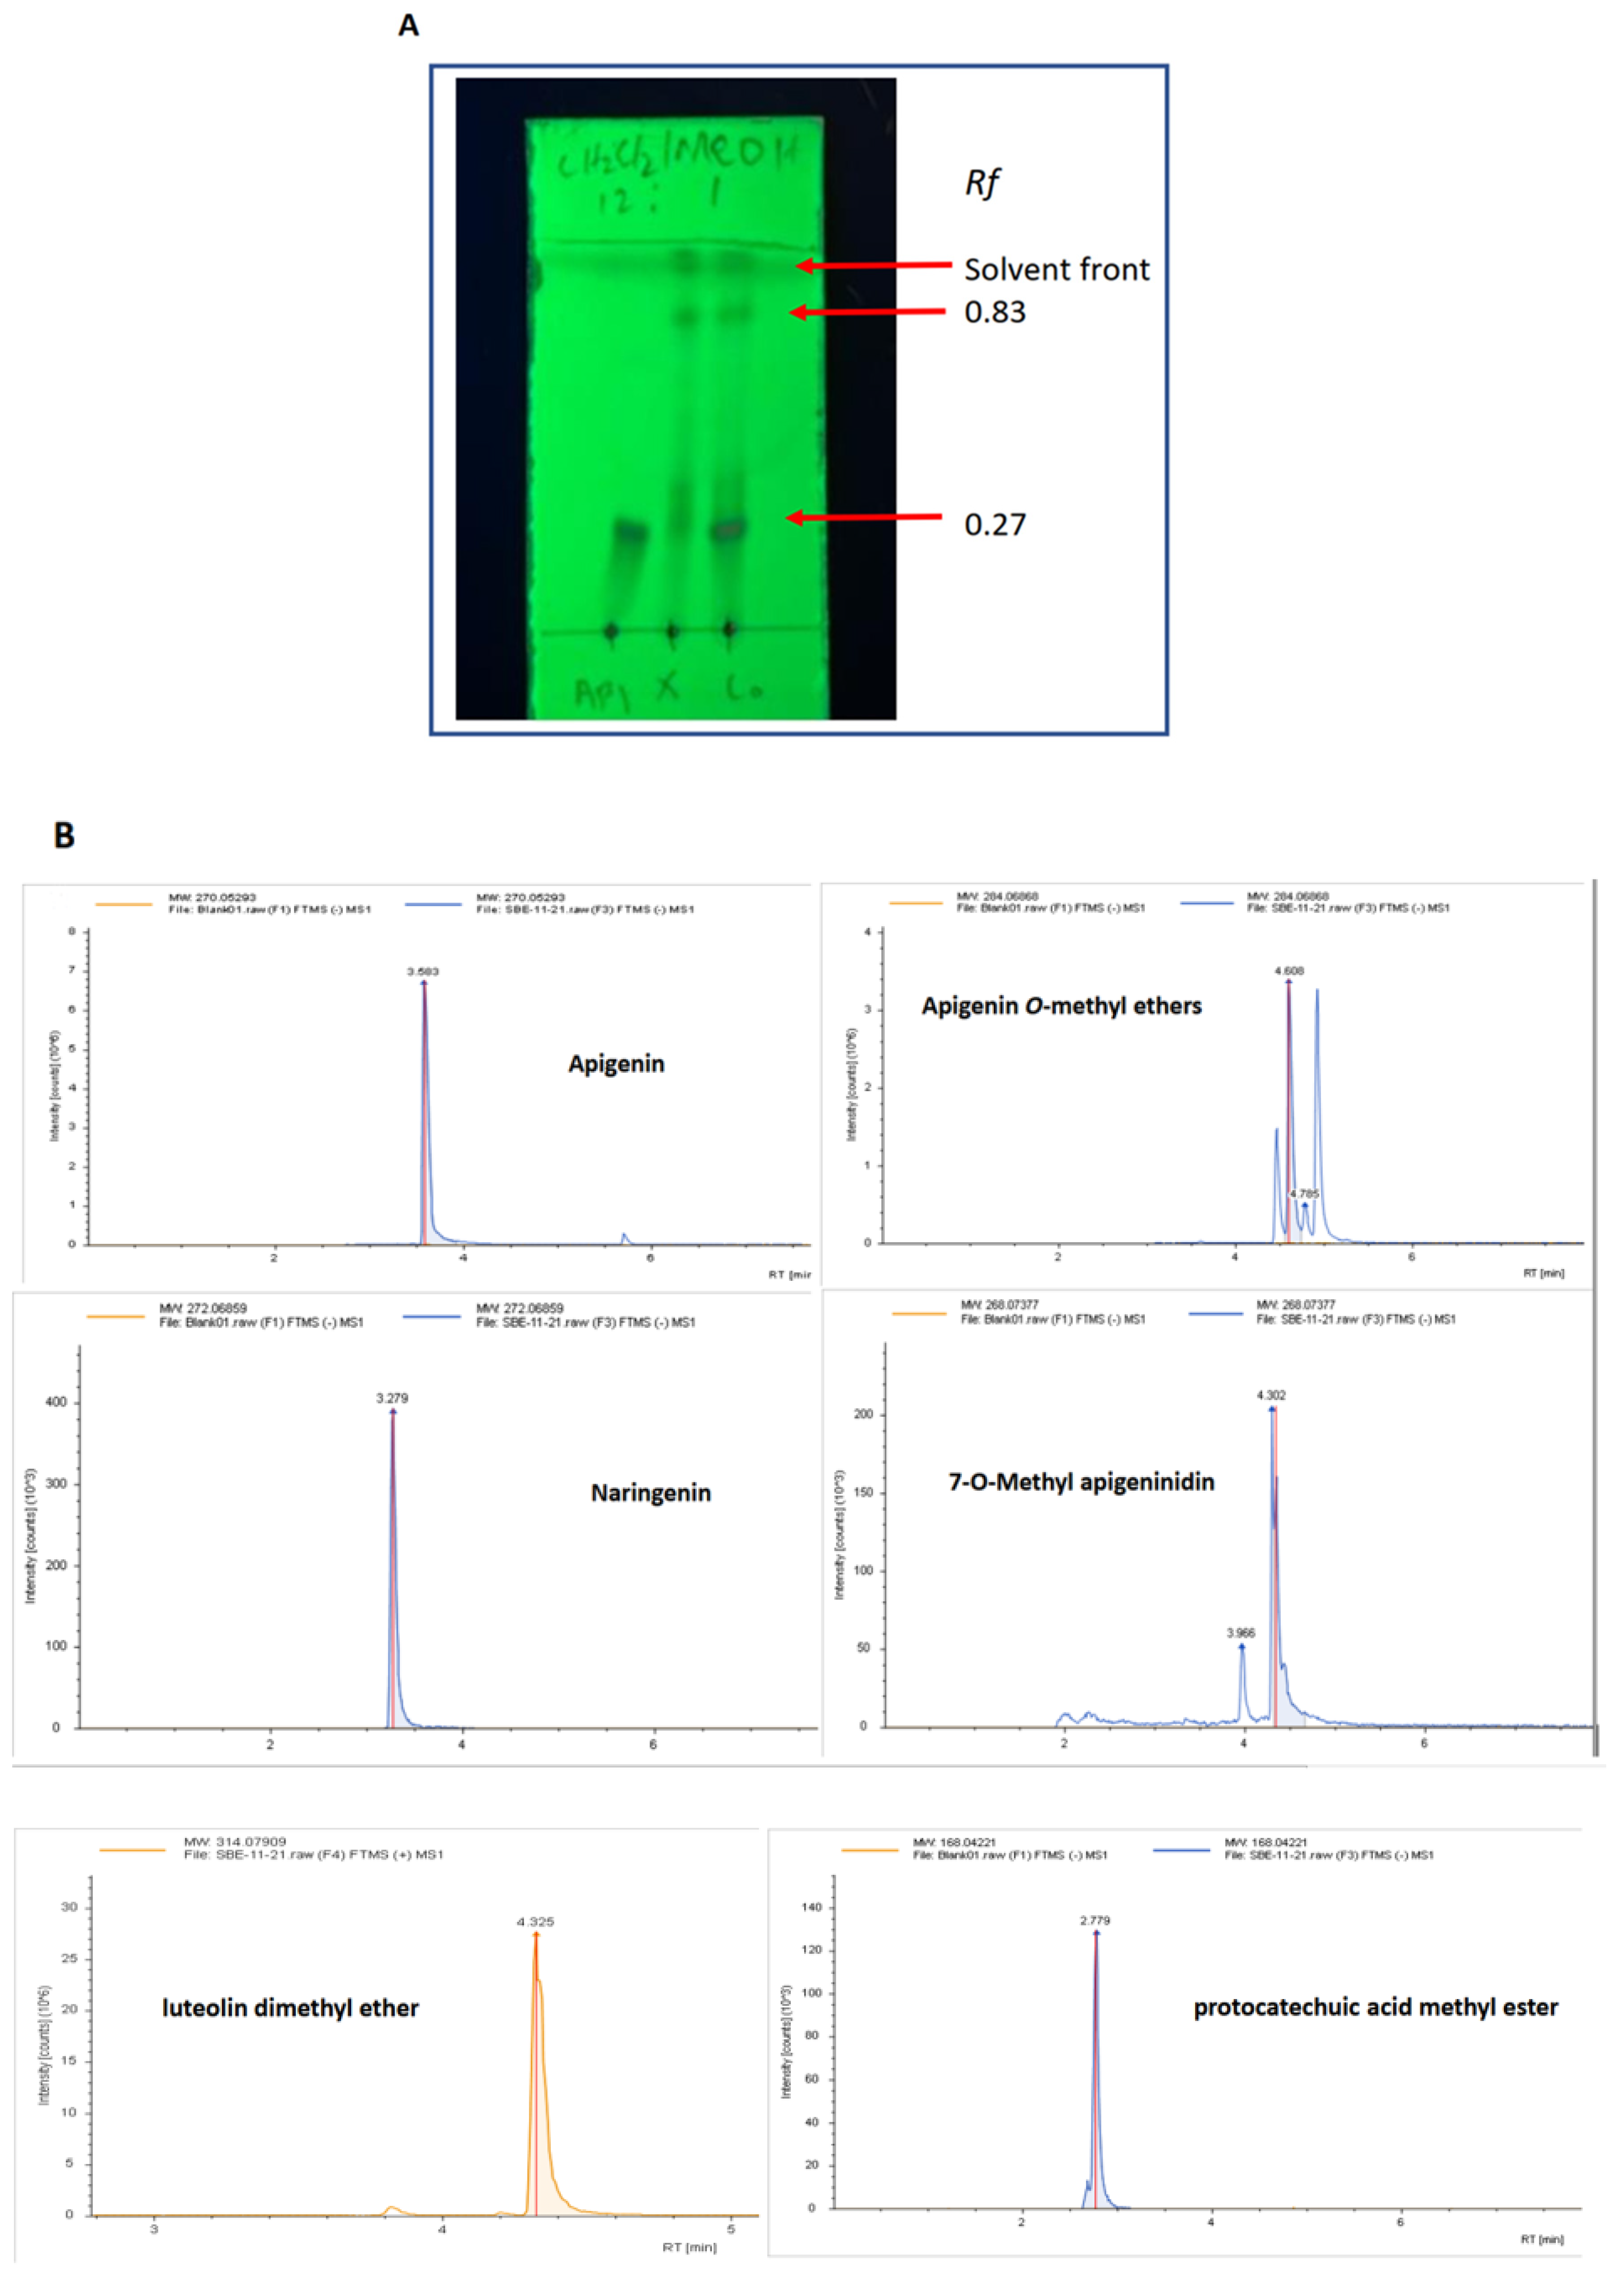
2.1. Characterisation of the Key Components in SBE-HP

The identities of the key components in SBE-HP, a CH2Cl2 extract of S. bicolor, were probed using a combination of TLC and LC-MS analyses. TLC using CH2Cl2/MeOH 12:1 revealed that the components of SBE_HP clustered into three spots with retention factors (Rf) of 0.27, 0.83, and approx. 1 (migrated with the solvent front). The Rf 0.27 is identical to API in this solvent system (Figure 2A), suggesting that the SBE-HP components with this Rf contain API and close analogues. Subsequent LC-MS analysis revealed that the main components of SBE-HP are API, apigenin O-methyl ethers—acacetin and glycitein (or genkwanin), apigenin dimethyl ethers, hispidulin or luteolin methyl ethers, luteolin dimethyl ether, naringenin, 7-O-methyl apigeninidin, and protocatechuic acid methyl ester (Figure 2B).

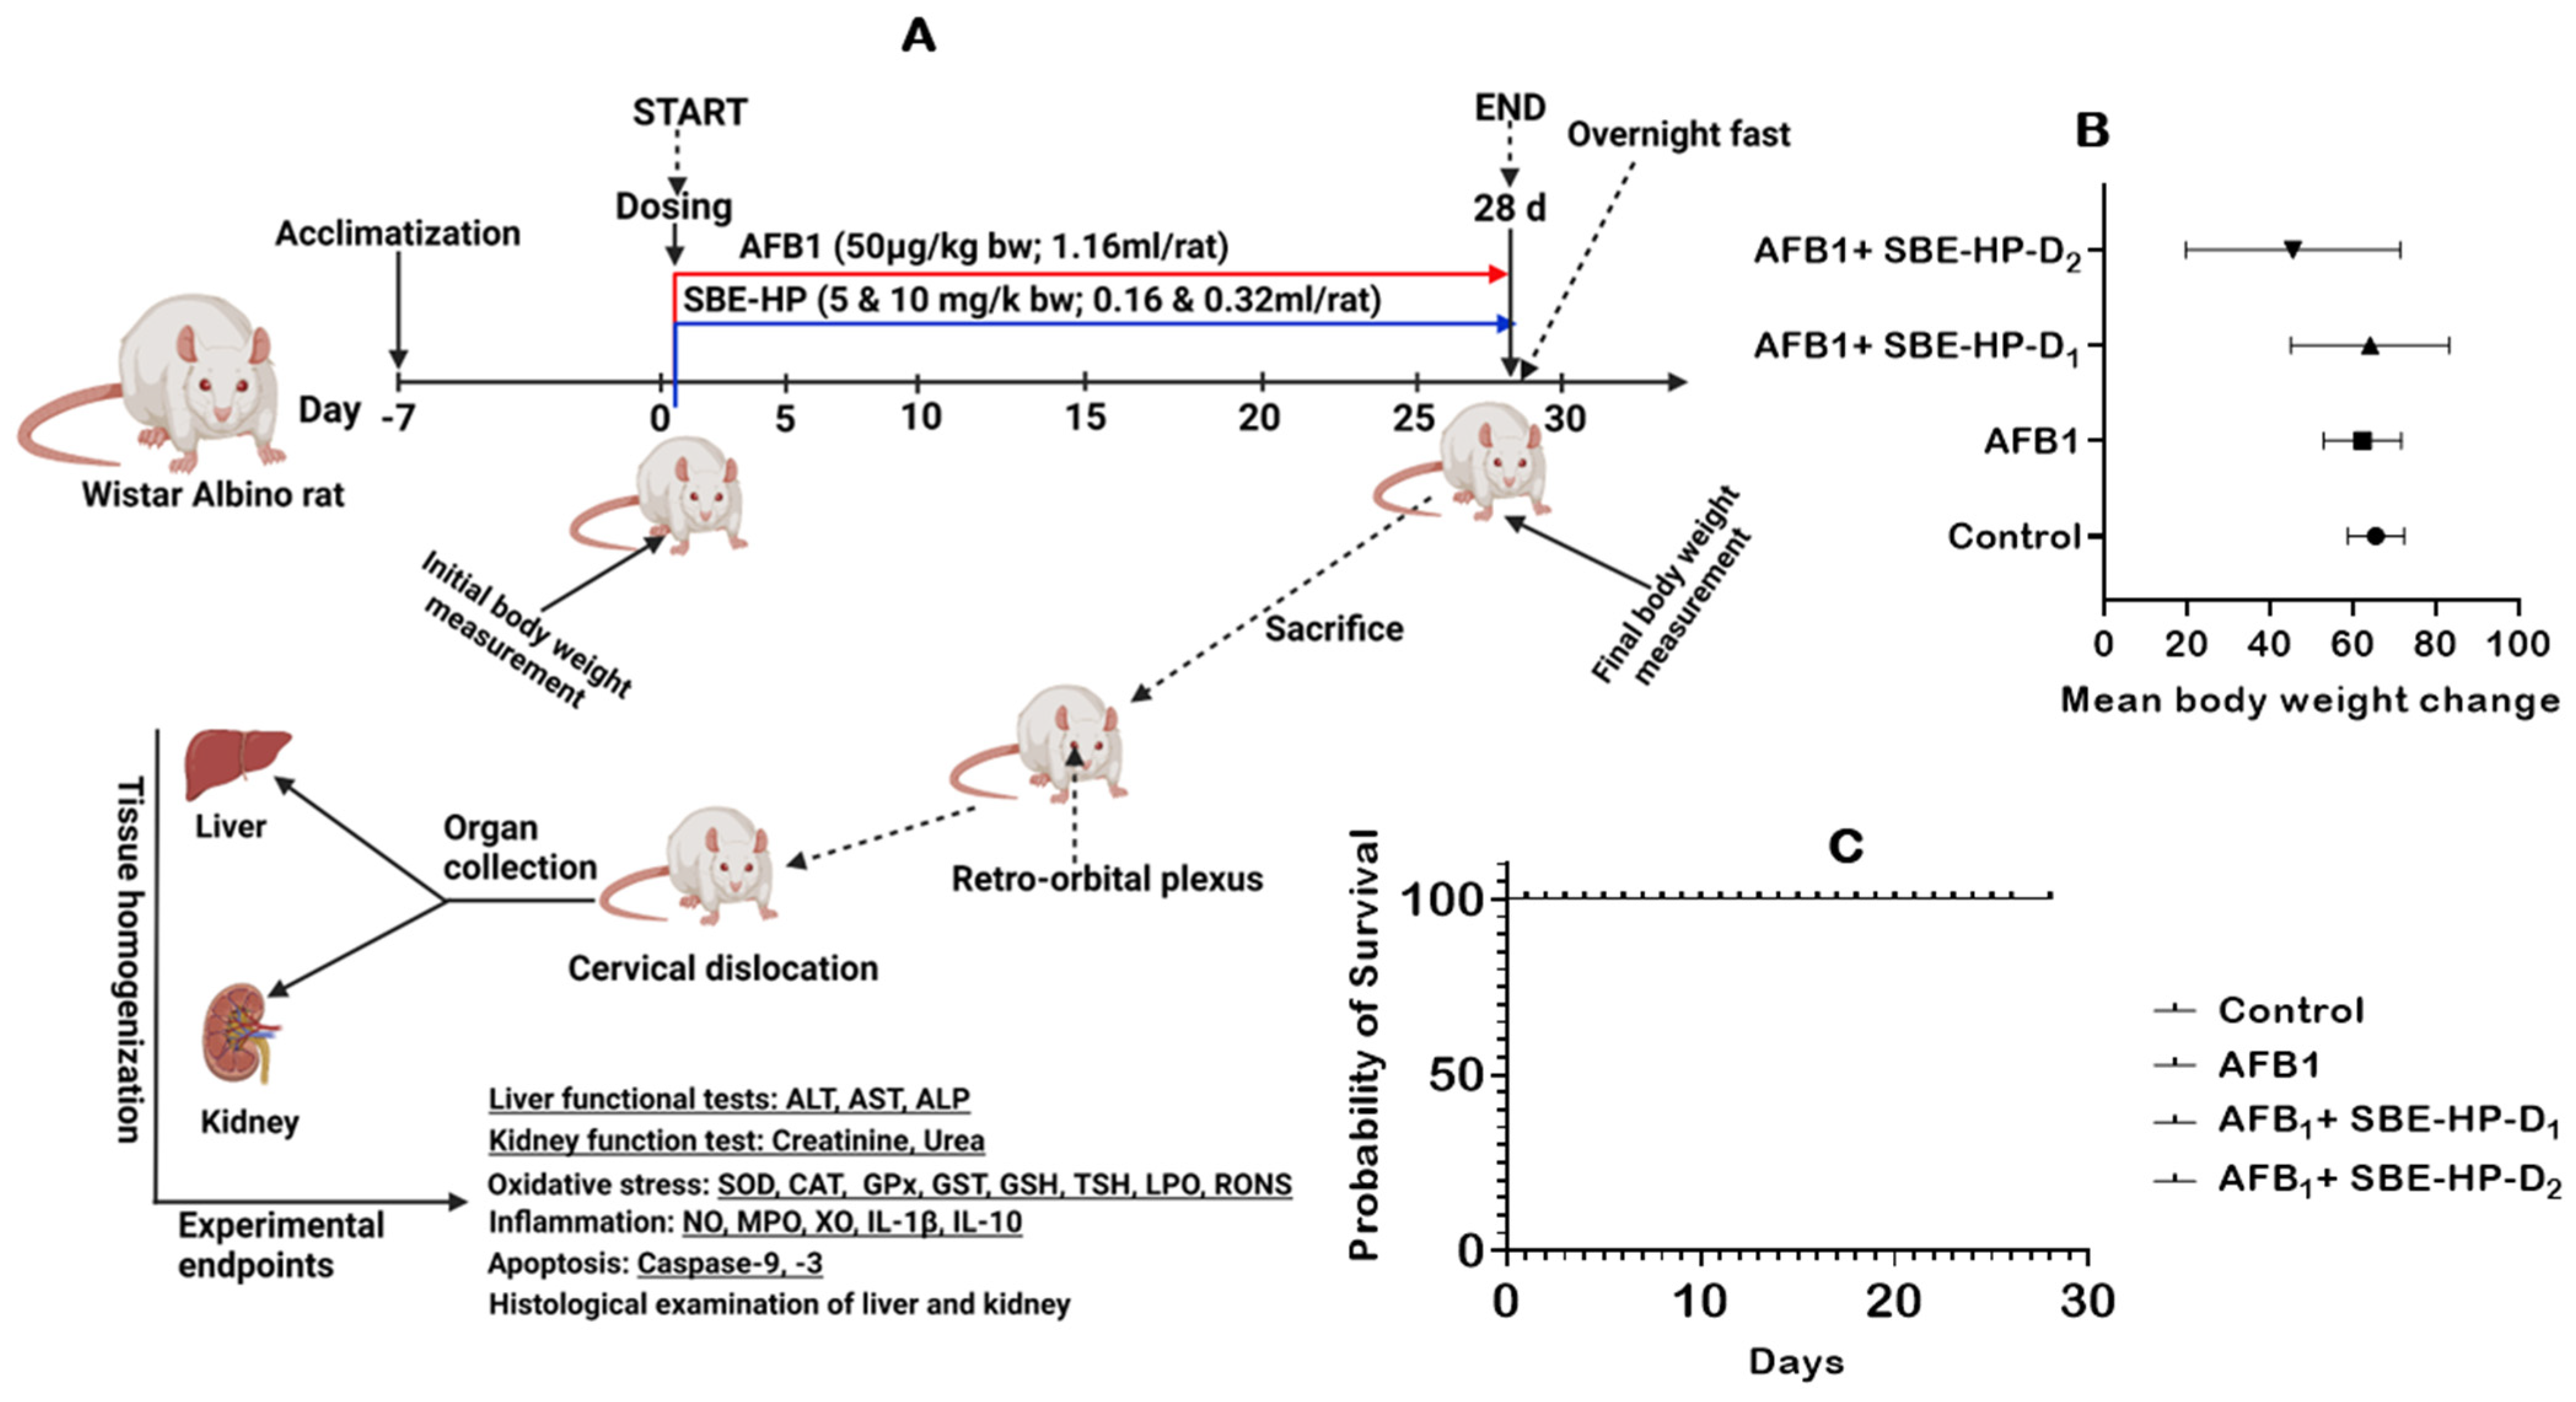
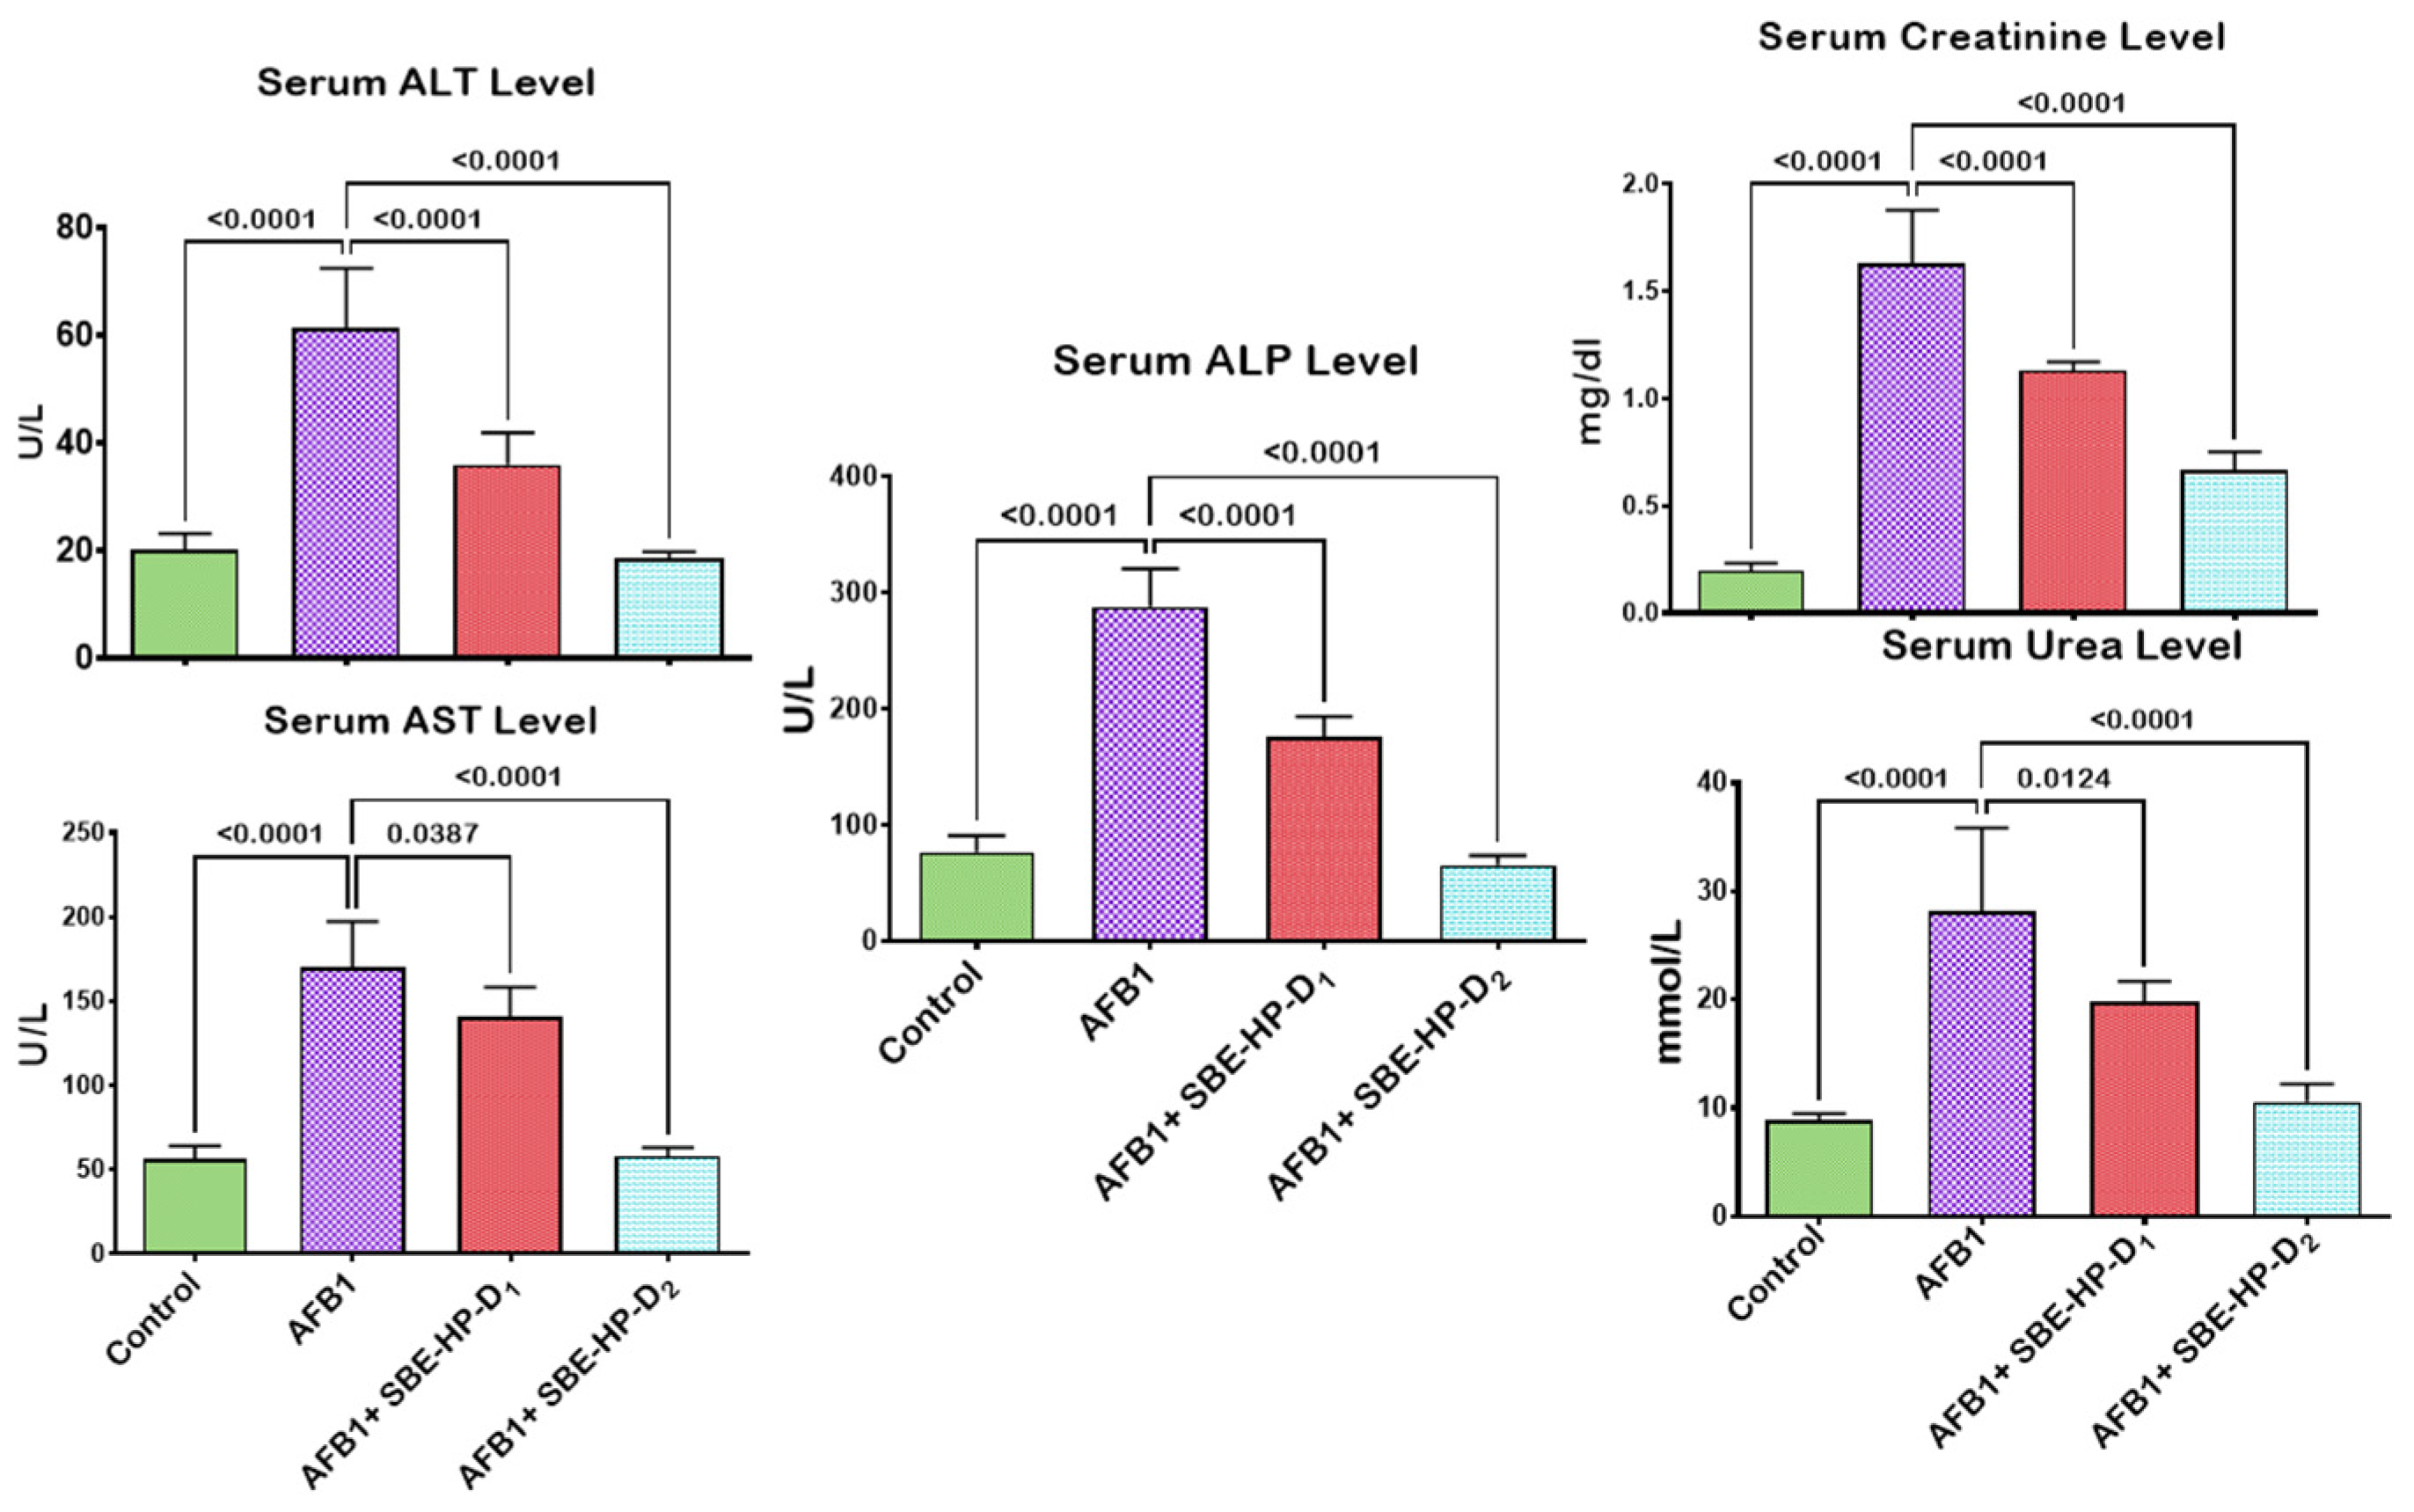
2.2. SBE-HP Prevented AFB1-Orchestrated Alterations in Body Weight and Organosomatic Indices, Rat Survivability, and Biomarkers of Hepatorenal Functions in Rats

The preventive effects of SBE-HP on AFB1-induced hepatorenal derangements in adult male Wistar rats were investigated in the current study. We explored the abrogative potential of SBE-HP on body weight and organosomatic indices (Figure 3B), overall survival (Figure 3C), and biomarkers of the functions and integrity of the hepatorenal system (Figure 4) in rats. Our results showed that the mean final body weights of the experimental animals increased significantly (p < 0.05) in all groups compared to the initial body weight of rats. However, there was no significant difference (p > 0.05) in the mean organ weight and relative organ weight of rats. Compared to the control, AFB1 slightly decreased the mean weight change of rats. However, this was abated in the group treated with only 5 mg/kg SBE-HP (Figure 3B). Despite the slight decrease in organ-to-somatic ratio and mean body weights, rats had no mortality during the study period, indicating 100% overall survival (Figure 3C). In addition, the administration of AFB1 significantly increased (p < 0.0001) the serum activities and levels of ALT, AST, ALP, urea, and creatinine compared to the control, indicative of hepatorenal toxicities. However, this was counterbalanced by SBE-HP at 5 and 10 mg/kg. At 5 mg/kg, SBE-HP significantly decreased the serum activities and levels of ALT (p < 0.001), AST (p = 0.0387), ALP (p < 0.0001), urea (p = 0.0124), and creatinine (p < 0.0001) compared to the cohort of rats treated with alone AFB1. The restoration in the serum concentrations of these hepatic and renal function biomarkers was significantly prominent (p < 0.0001) in a cohort of rats co-treated with 10 mg/kg SBE-HP compared to the AFB1 alone group (Figure 4).

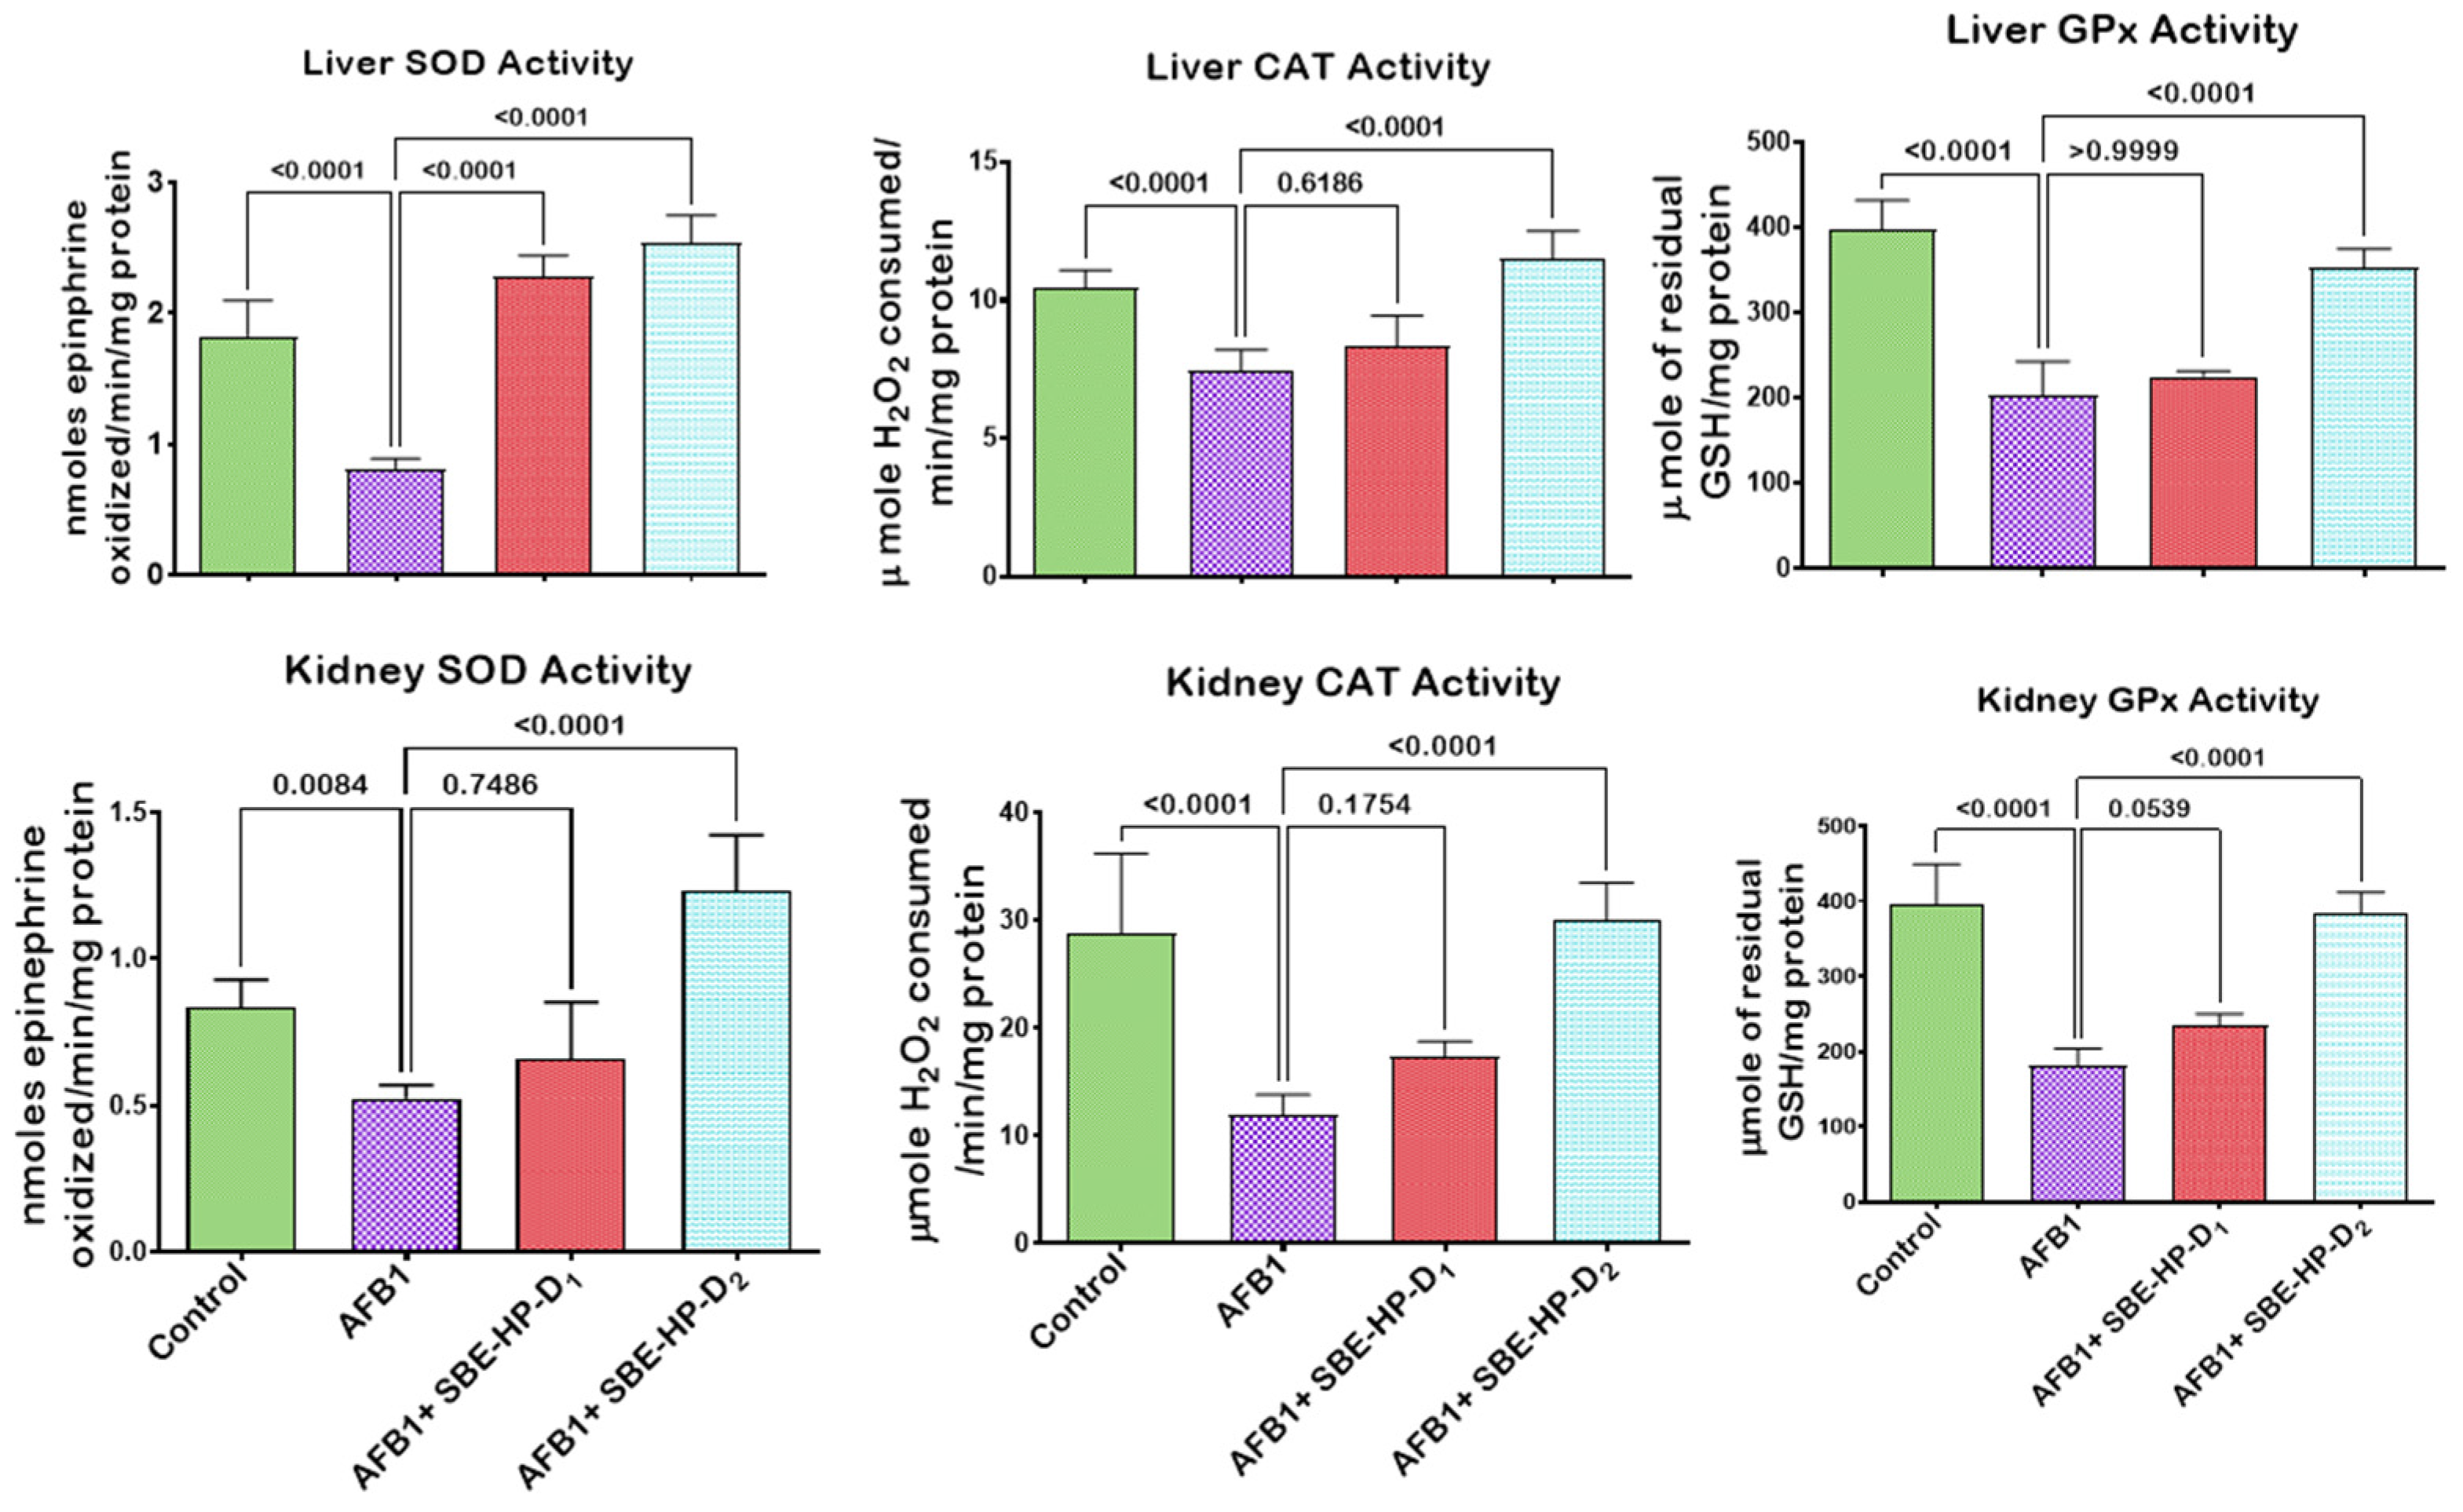
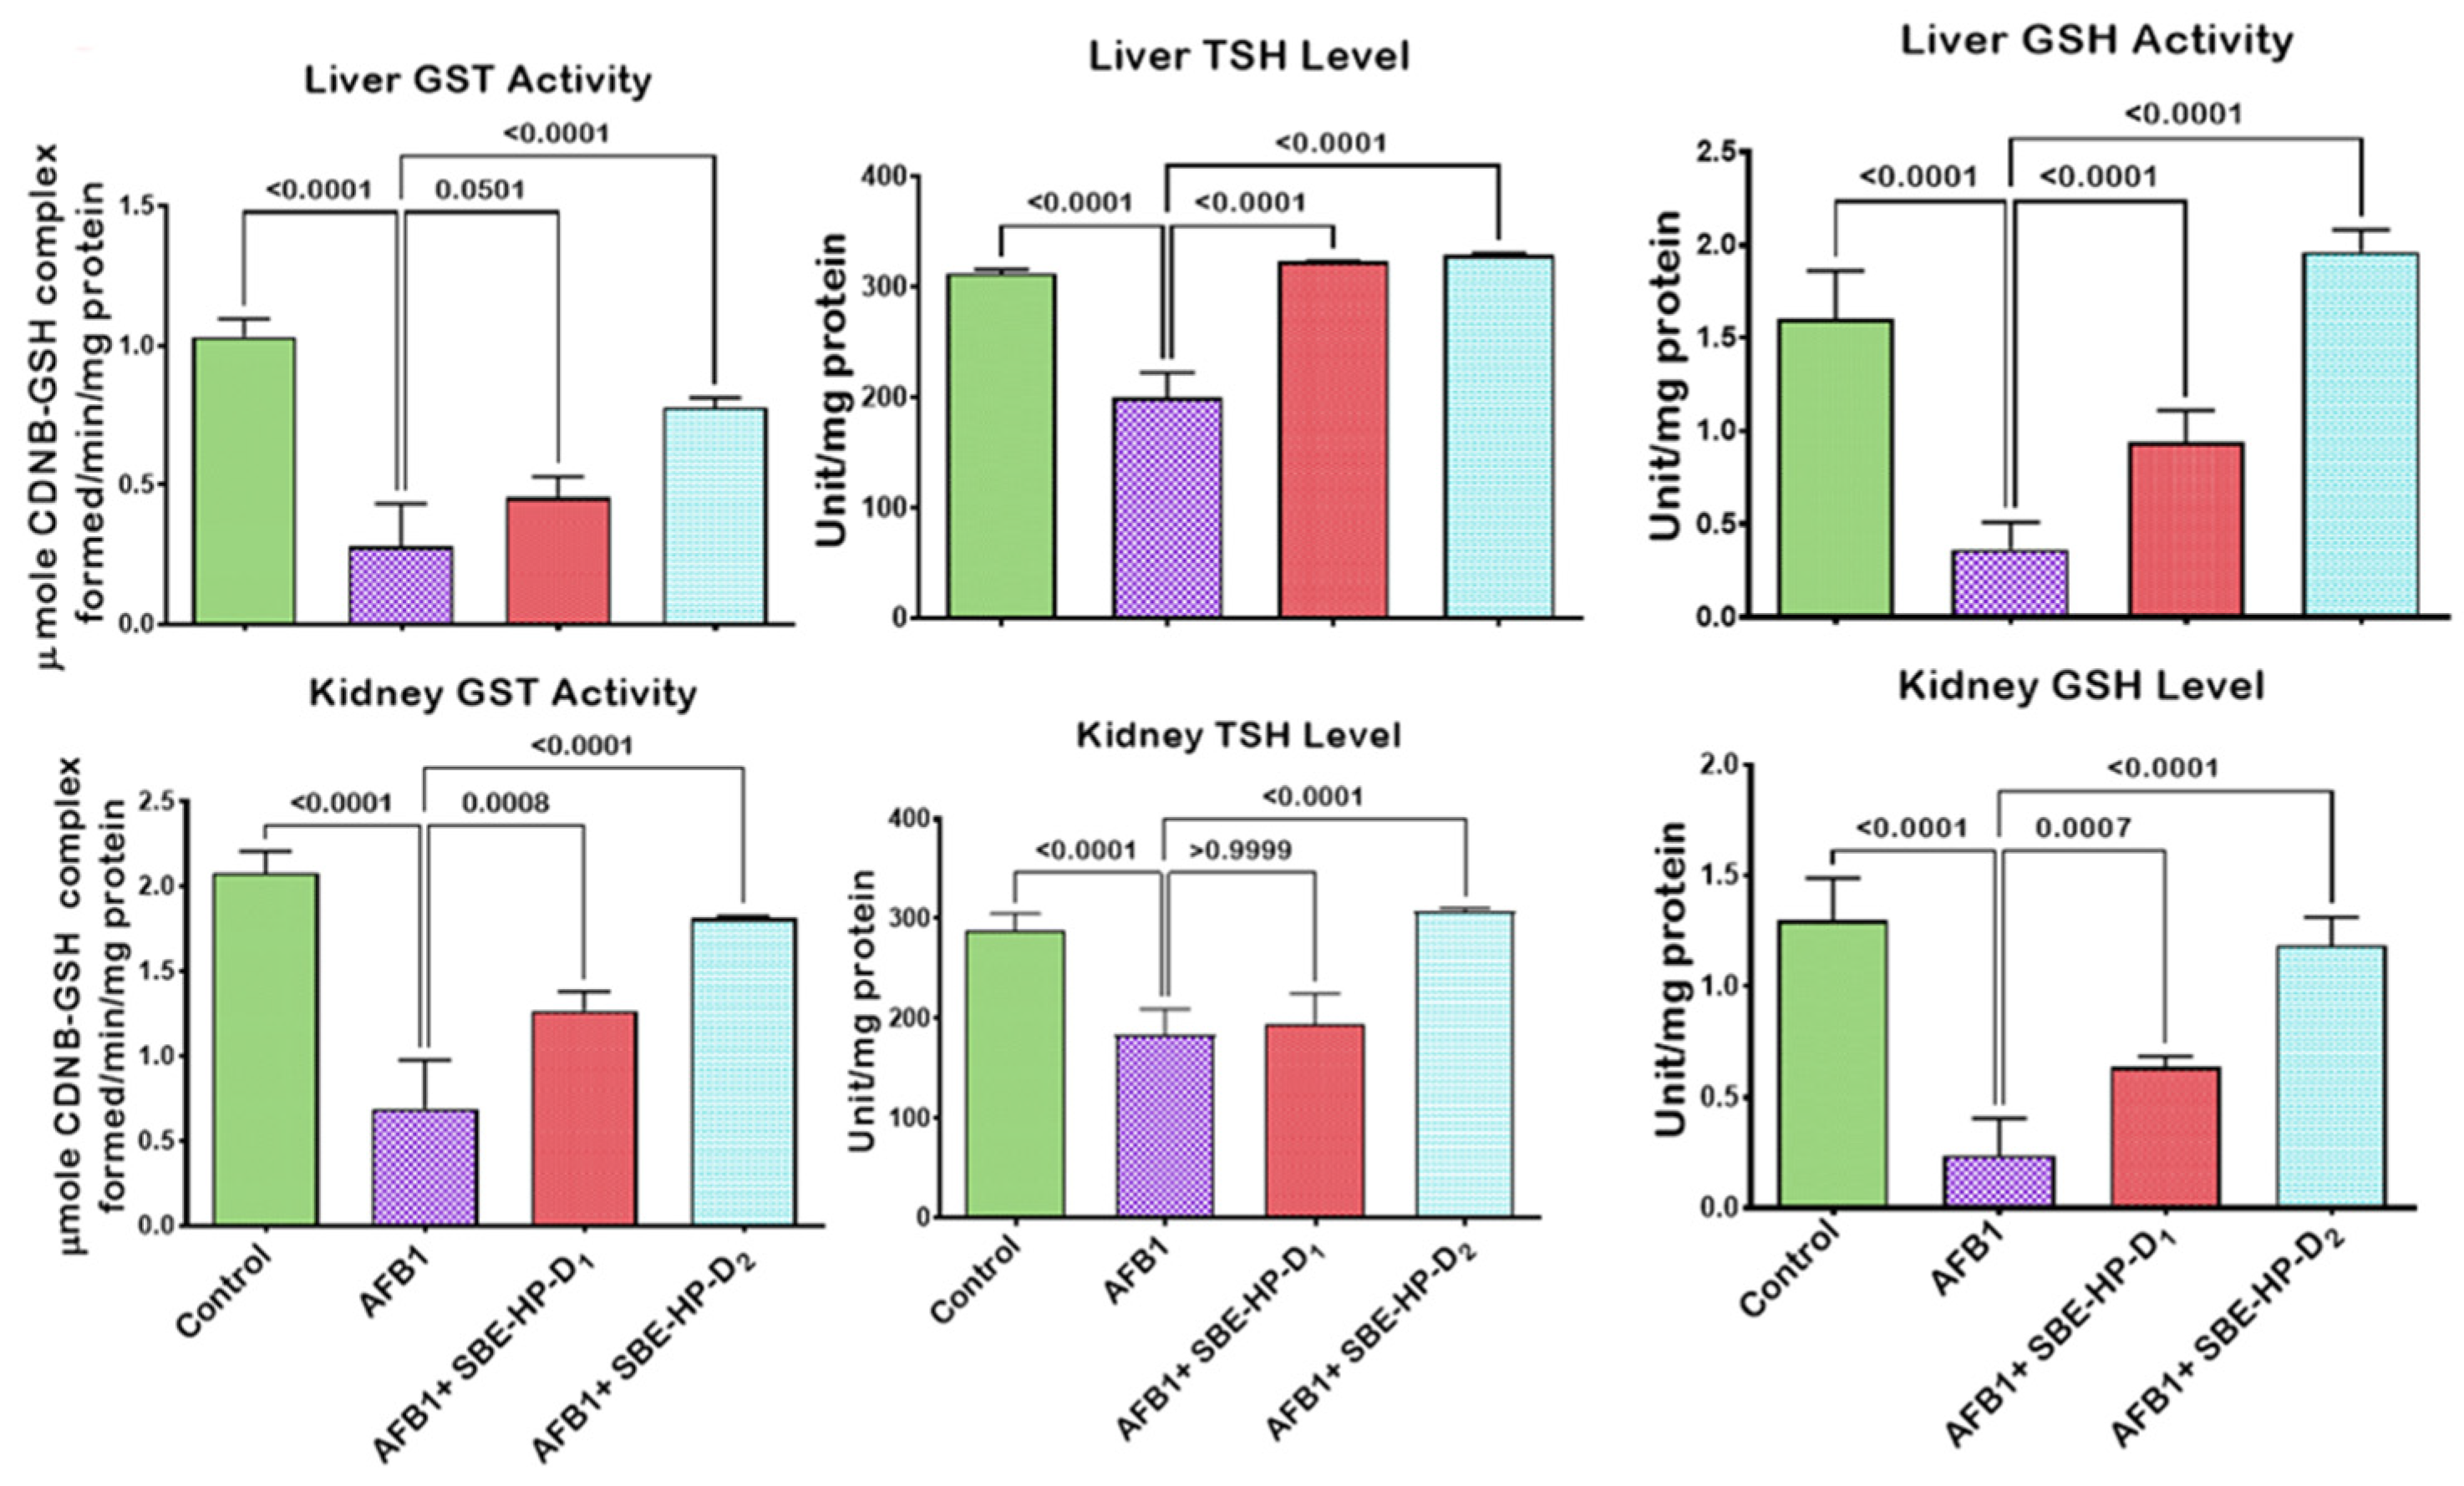
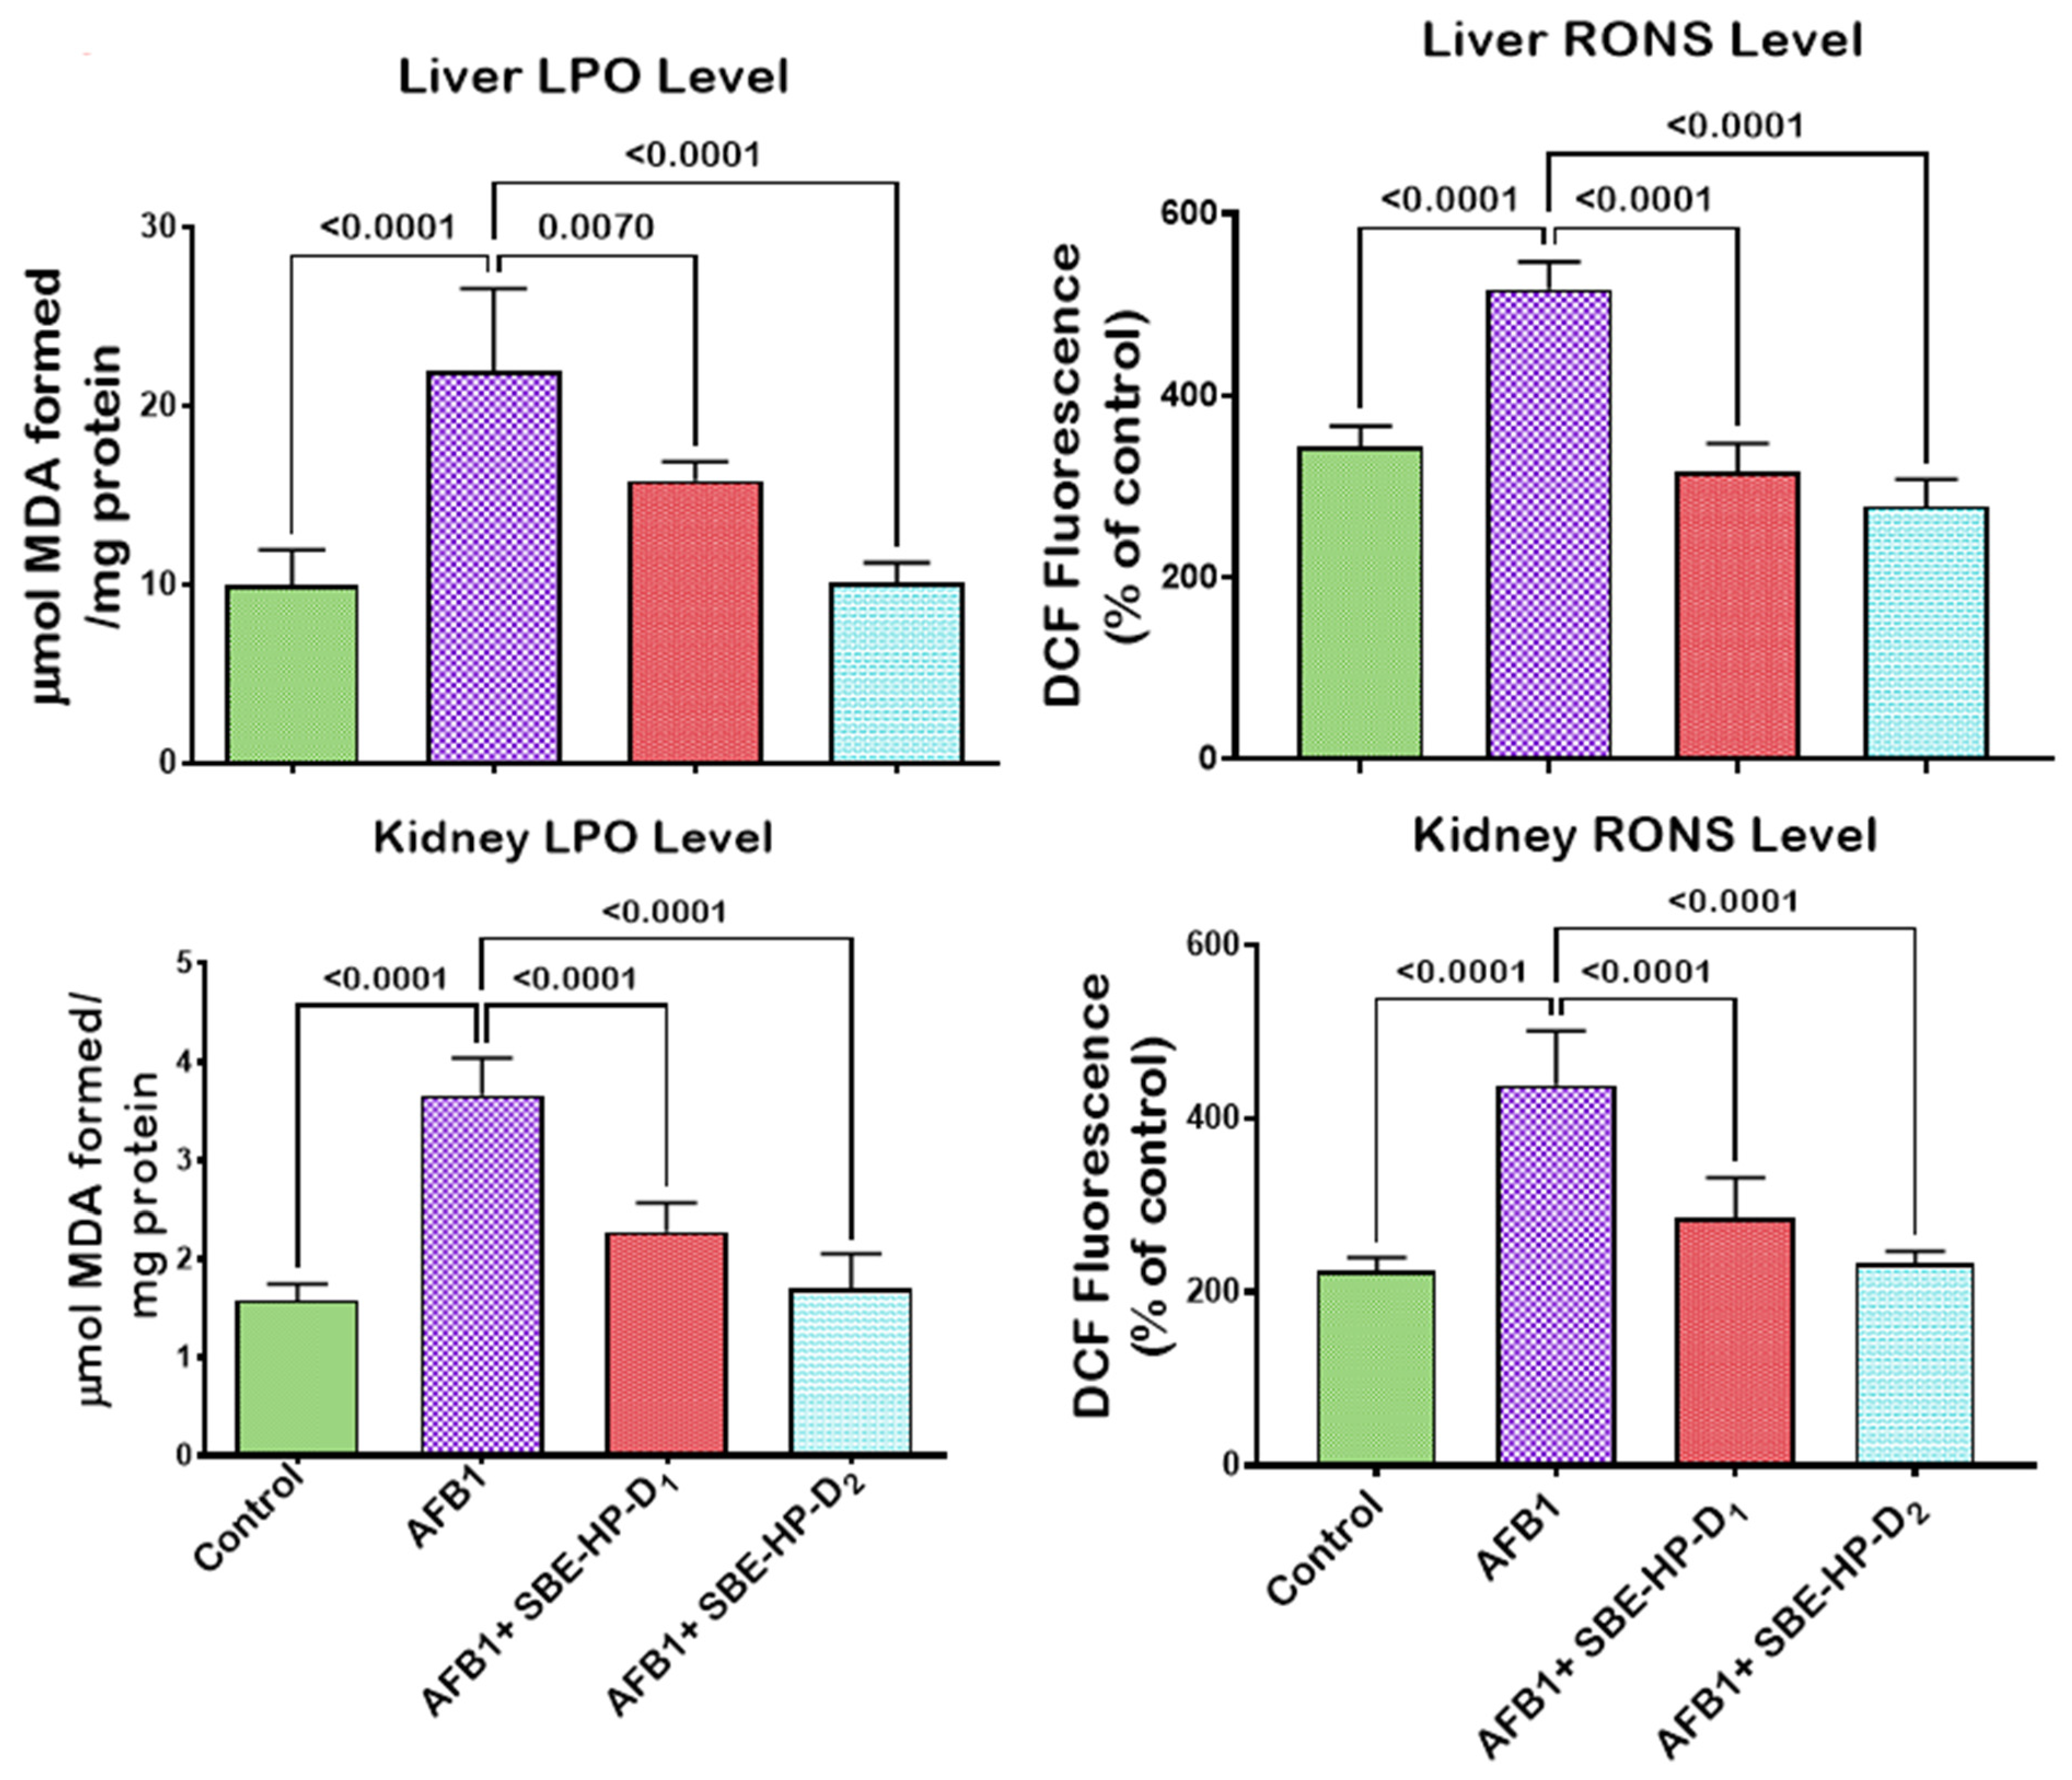
2.3. SBE-HP Mitigates Oxidative Stress and Restores Antioxidant Activities and Levels in the Liver and Kidney of AFB1-Treated Rats

The induction of oxidative stress is a probable mechanism of action of AFB1-induced hepatic and renal derangements. To this end, we probed the mitigating effect of SBE-HP against AFB1-mediated oxidative stress in rats’ hepatic and renal tissues, as presented in Figure 5, Figure 6 and Figure 7. In comparison to the control, our results showed that AFB1 significantly decreased (p < 0.0001) the hepatic activities of SOD, CAT, and GPx as well as the renal activities of SOD (p = 0.0084), CAT (p < 0.0001), and GPx (p < 0.0001) in rats, denoting the induction of oxidative stress. However, the administration of SBE-HP at 5 and 10 m/kg restores the activities of these antioxidants. At 5 mg/kg, SBE-HP increased the activities of SOD (p < 0.0001), CAT (p > 0.6186), and GPx (p > 0.9999) compared to the AFB1 alone group. However, at a higher concentration of SBE-HP (10 mg/kg), the activities of SOD, CAT, and GPx were prominent (p < 0.0001) relative to AFB1 alone treated rats (Figure 5). Furthermore, our results divulged that AFB1 markedly waned (p < 0.0001) the activities of GST (a phase-2 antioxidant molecule) and the levels of GSH and TSH in the liver and kidney of rats compared to the untreated group. In contrast, the co-ingestion of SBE-HP at the tested doses resulted in a positive trend in GST activity and GSH and TSH levels in the liver and kidney of rats. Rats co-treated with 5 mg/kg SBE-HP showed increased hepatic GST activity (p = 0.0501) and GSH (p < 0.0001) and TSH (p < 0.0001) levels. Renal GST activity (p = 0.0008) and GSH (p > 0.9999) and TSH (p = 0.0007) levels were also increased compared to the AFB1 alone treated group. The observed effects on GST activity and GSH and TSH levels were further reinforced (p < 0.001) in cohorts of rats co-treated with 10 mg/kg in the liver and kidney tissues of rats relative to the AFB1 alone treated rats (Figure 6). In addition, for oxidative stress to manifest in rats exposed to toxicants, there must be an imbalance between antioxidants and pro-oxidants in favour of pro-oxidants. In the current study, AFB1 significantly elevated (p < 0.0001) the hepatic and renal levels of LPO and RONS compared to the control. Nevertheless, co-treatment with SBE-HP offset this effect, thus scavenging available free radicals in the liver and kidney of rats. Specifically, co-treatment at 5 mg/kg waned the hepatic levels of LPO (p = 0.0070) and RONS (p < 0.0001) as well as significantly decreased (p < 0.0001) the renal levels of LPO and RONS relative to the AFB1 treated group. Furthermore, at 10 mg/kg, the decline in the levels of LPO and RONS was significantly prominent (p < 0.0001) compared to the AFB1 alone group in the liver and the kidney tissues, indicating that the extract mediates the antioxidative effect (Figure 7).

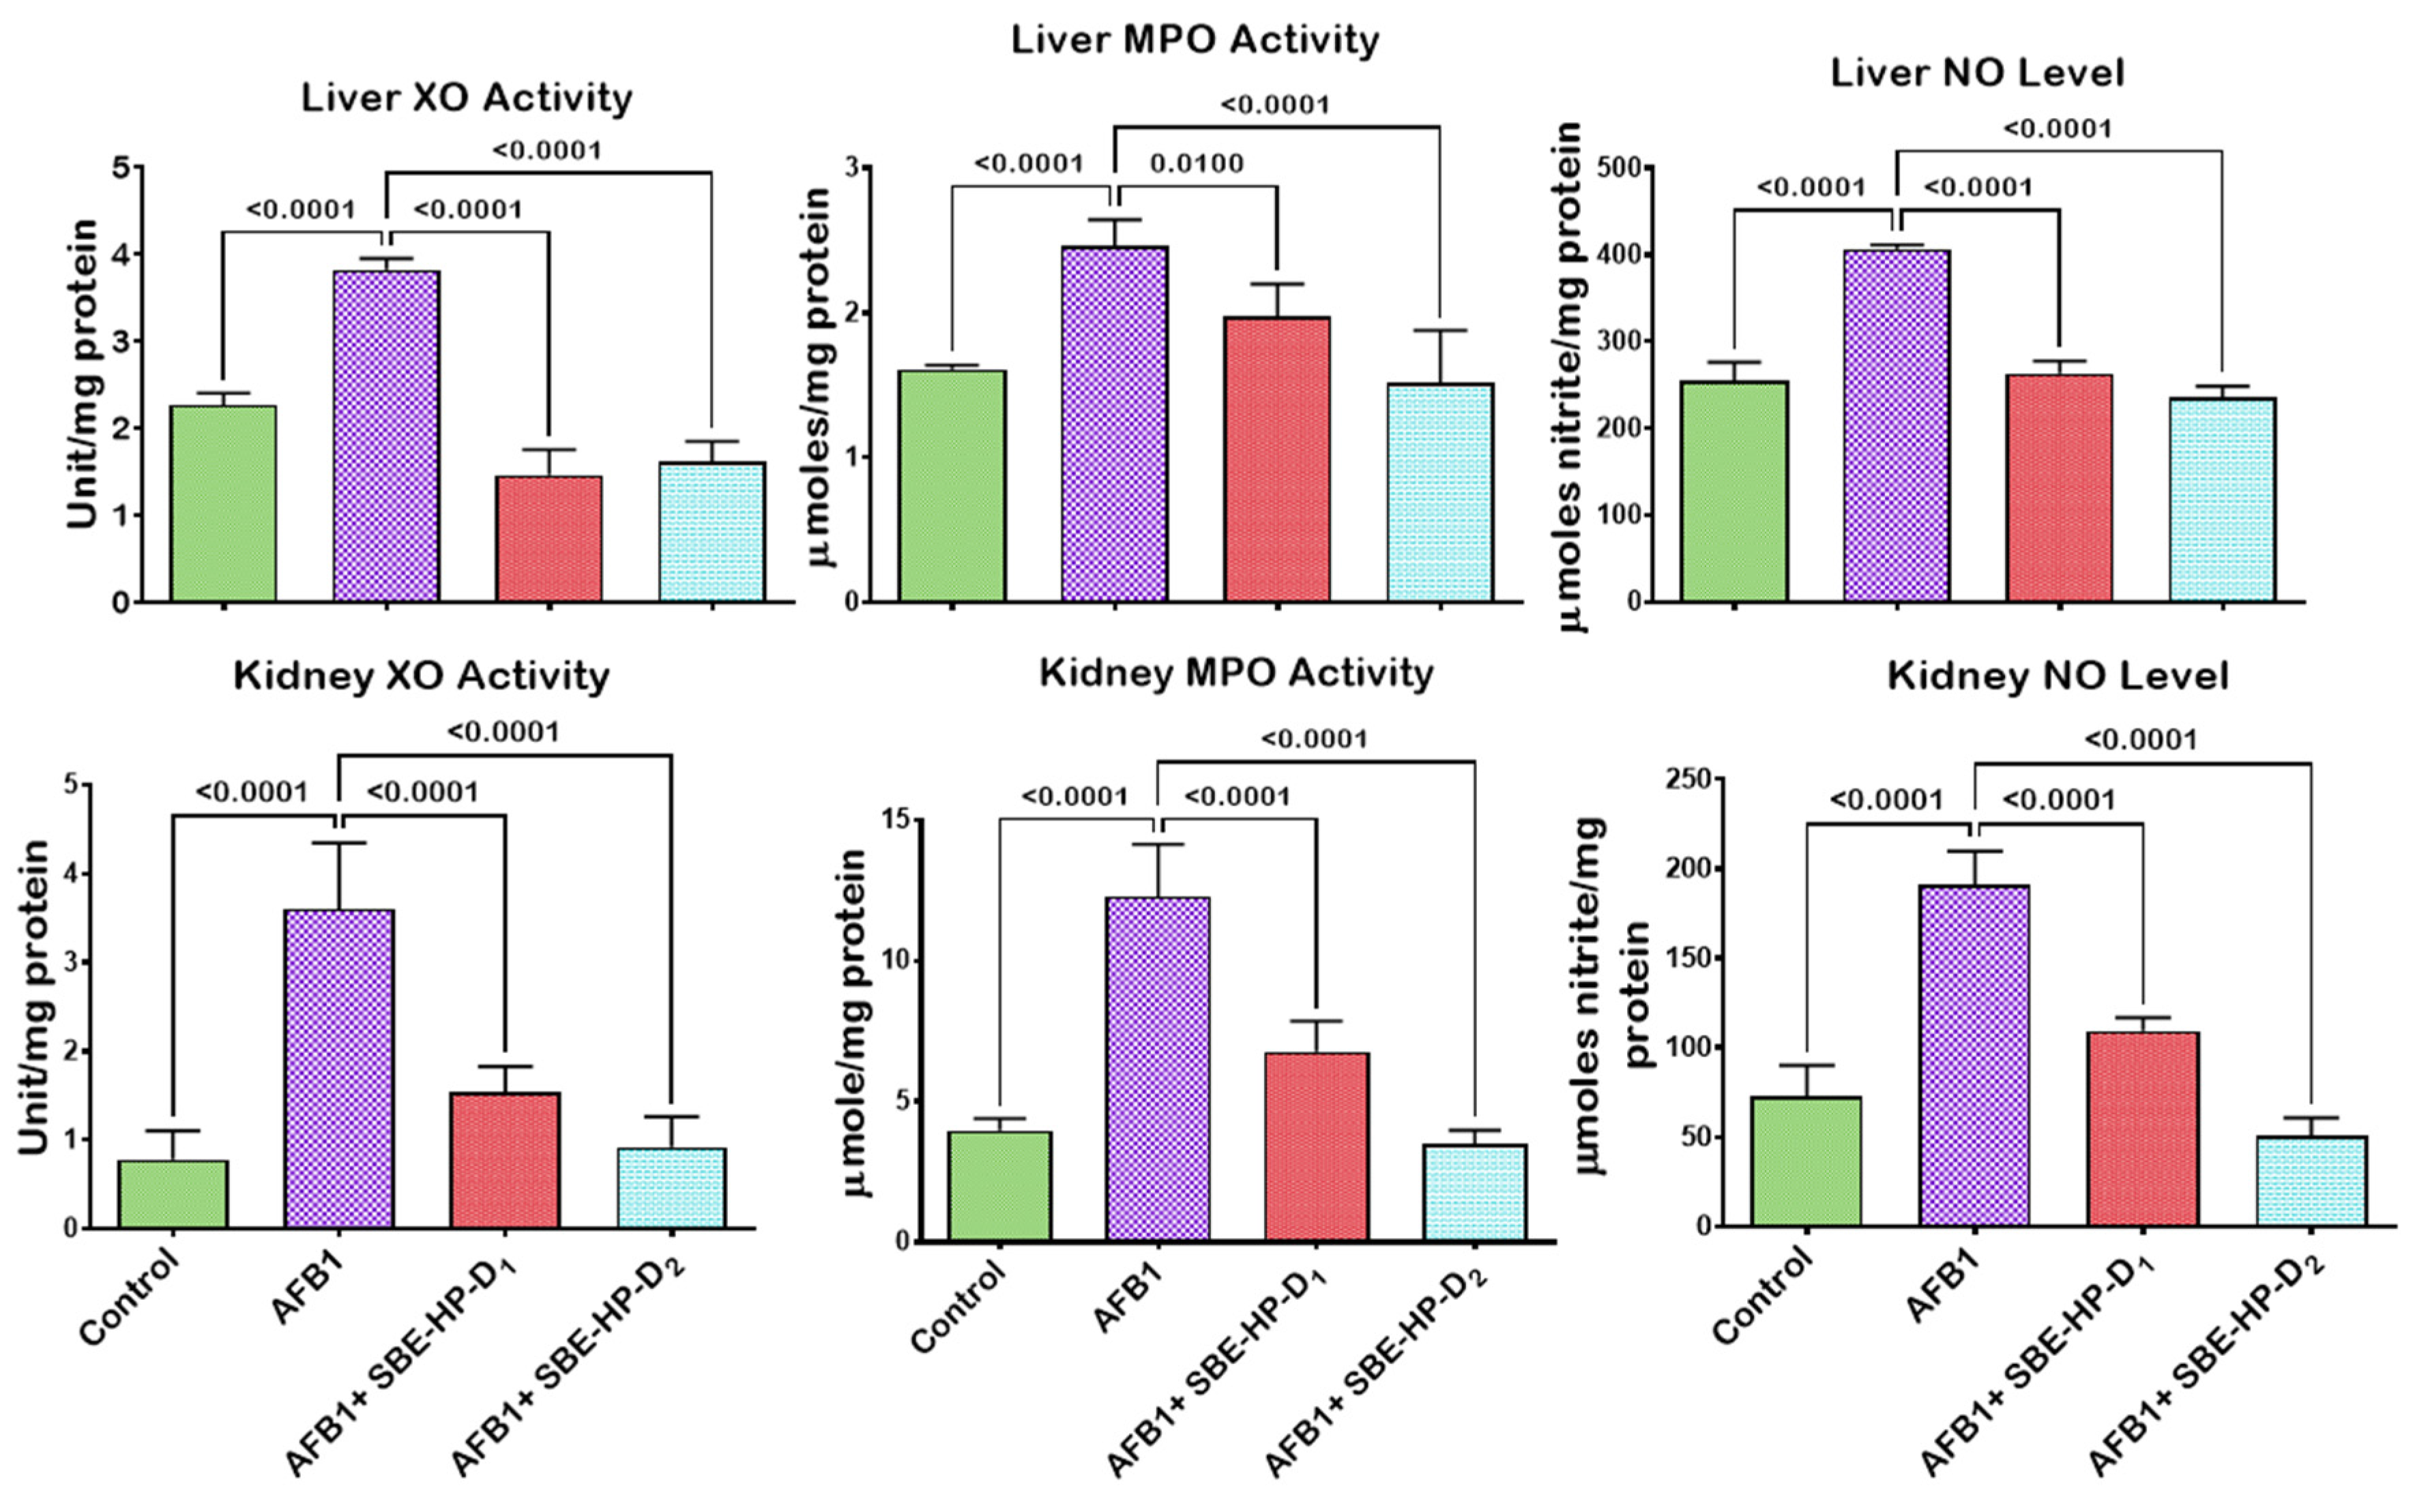
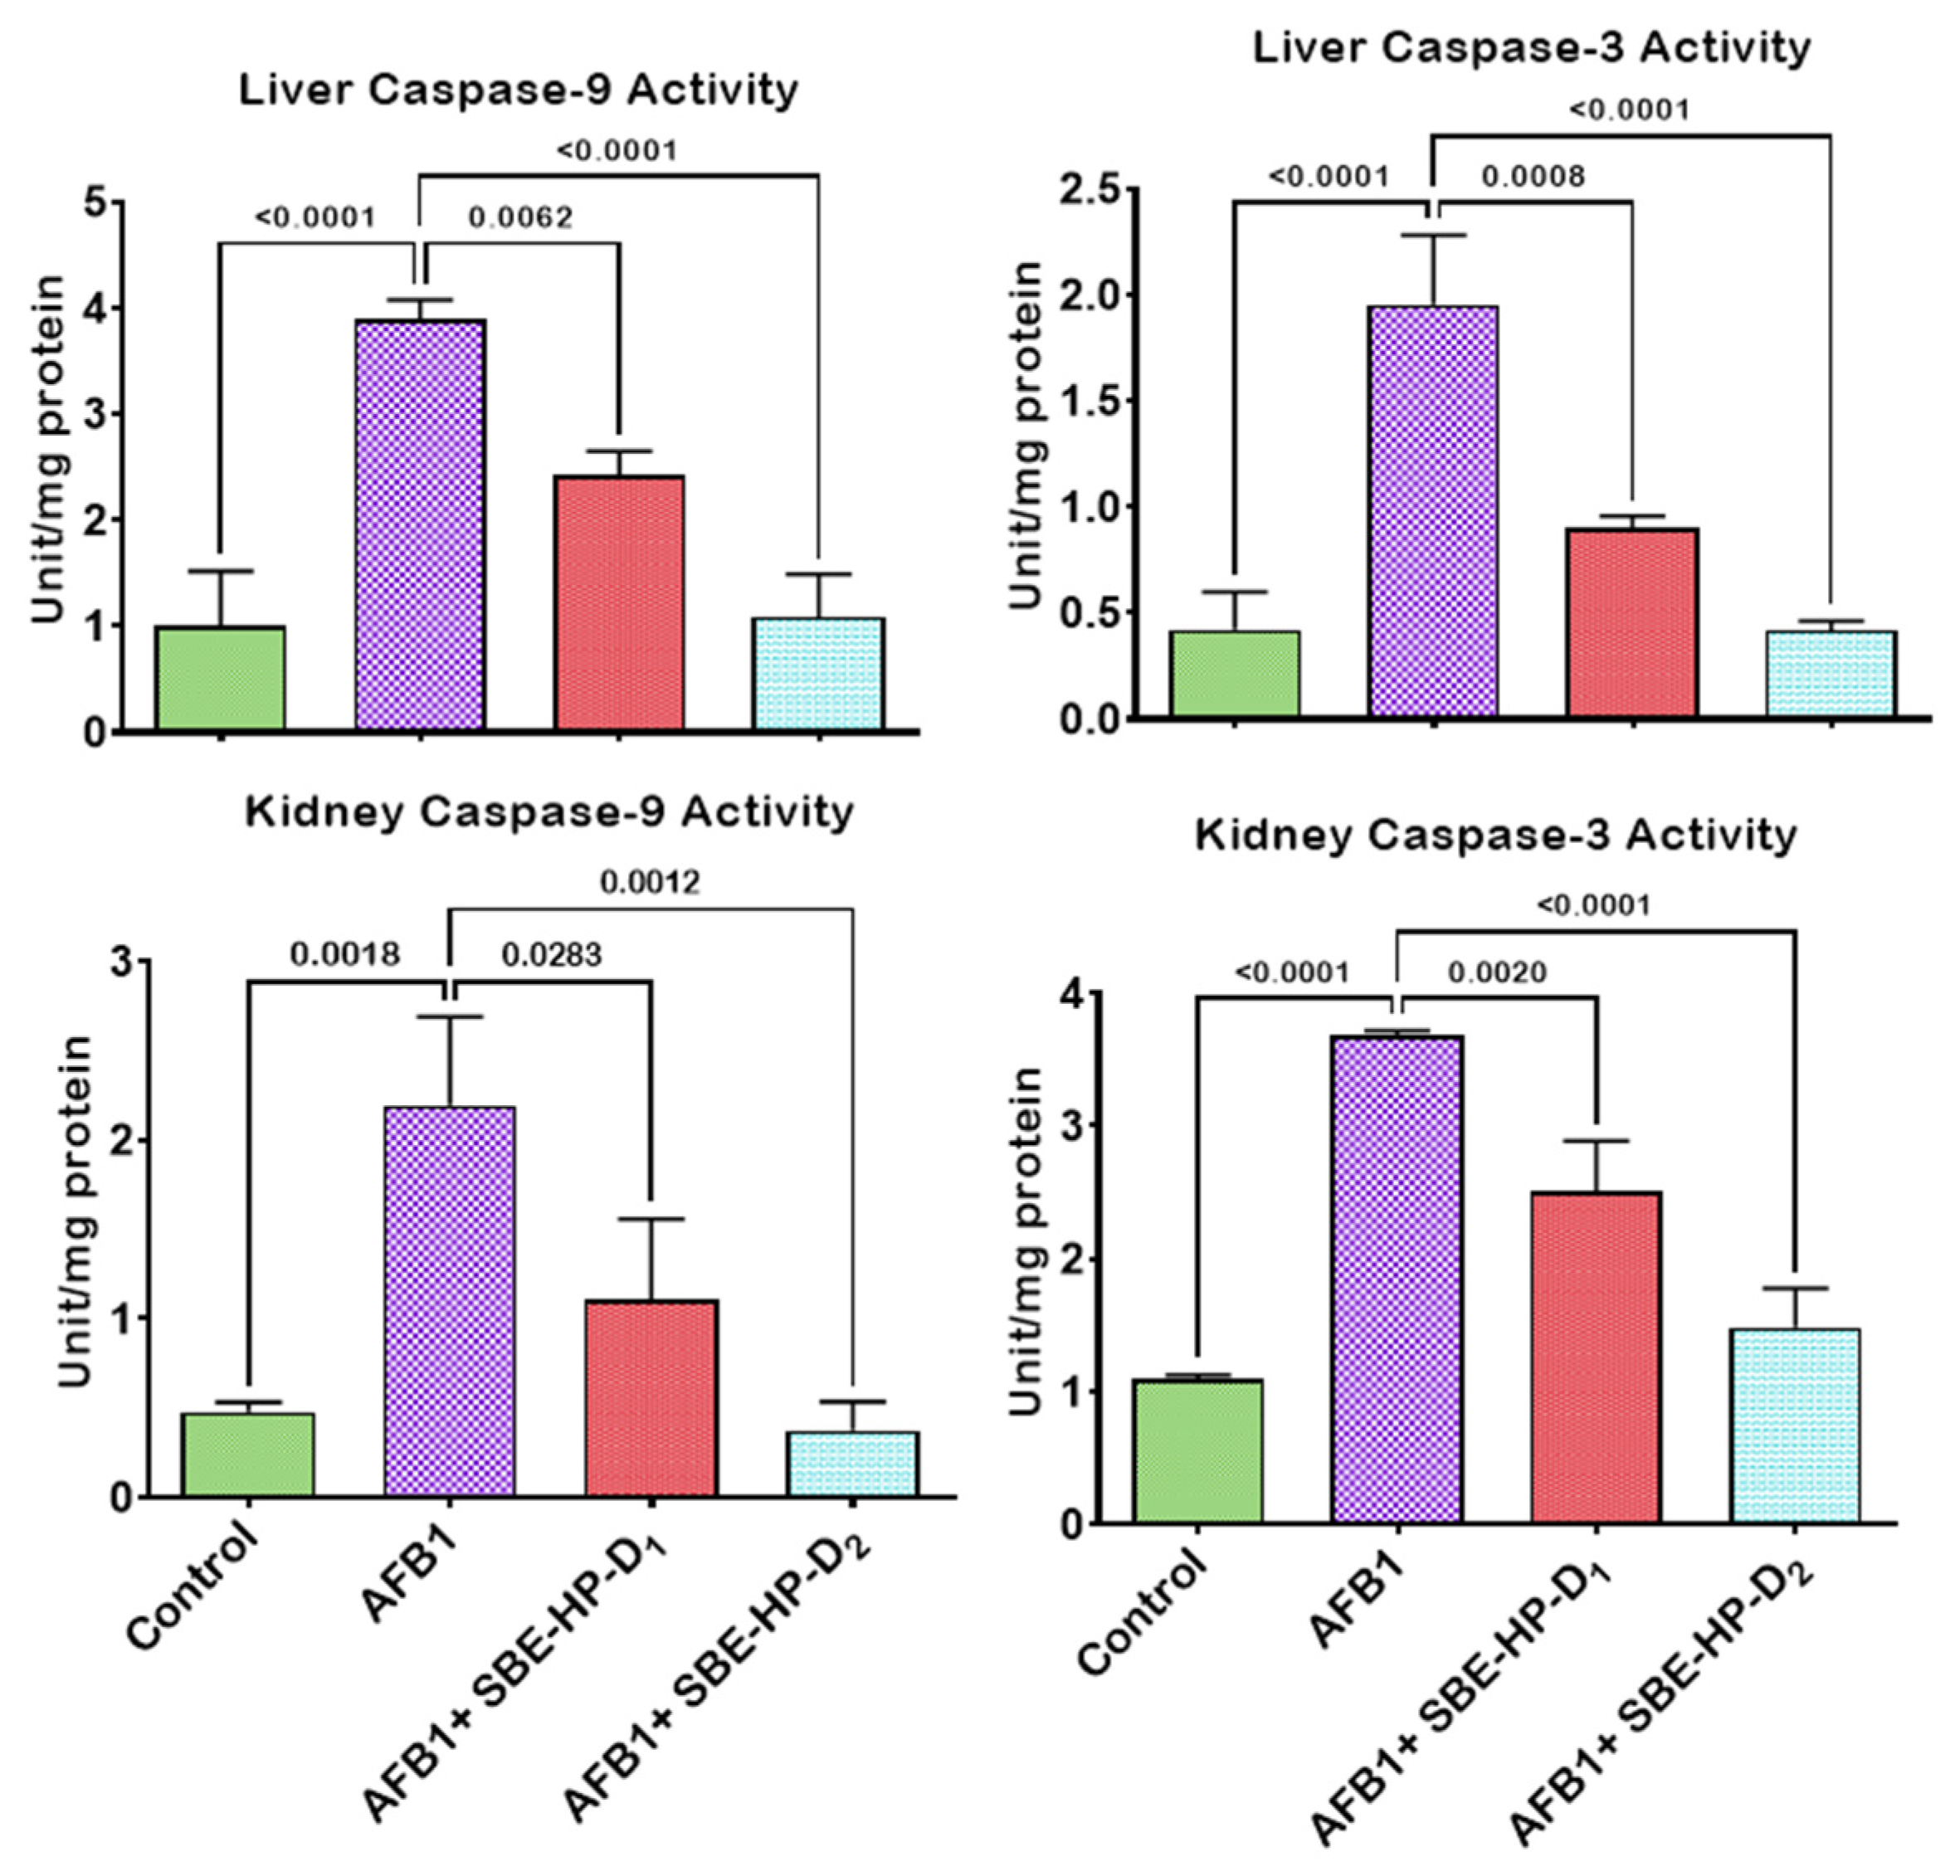
2.4. SBE-HP Resolves Inflammation and Abrogates Apoptosis in the Liver and Kidney of AFB1-Treated Rats

In the current study, we hypothesise that unquenched free radicals may trigger the release of pro-inflammatory molecules and initiate the programmed cell death pathways through extrinsic or intrinsic pathways. We, therefore, probe the ameliorative effect of SBE-HP against AFB1-mediated inflammation and apoptosis, as shown in Figure 8, Figure 9 and Figure 10. The treatment of rats with AFB1 significantly increased pro-inflammatory mediators, including XO, MPO, and NO, compared to the untreated group (p < 0.0001). However, co-treatment with SBE-HP counteracted the upsurge in pro-inflammatory mediators at the test doses. Specifically, 5 and 10 mg/kg of SBE-HP markedly waned (p < 0.0001) the activities of XO and MPO and the level of NO in the liver and kidney compared to the cohort of rats treated with AFB1, with the higher dose (10 mg/kg) exhibiting higher anti-inflammatory property (Figure 8). We hypothesise that the pro-inflammatory and anti-inflammatory cytokines ratio may induce hepatorenal toxicity. To this end, we probe the effect of SBE-HP in lowering the proportion of pro-inflammatory cytokines to anti-inflammatory in rats exposed to AFB1. Compared to the control, the rat cohort treated with AFB1 alone exhibited increased levels of IL-1β in the liver (p = 0.0031) and in the kidney (p < 0.0001) while reducing the level of IL-10 in the liver (p = 0.0014) and the kidney (p = 0.0003). In contrast, cohorts of rats co-treated with SBE-HP at the test doses decreased the hepatic and renal levels of IL-1β while elevating IL-10. At 5 mg/kg, SBE-HP reduced the level of IL-1β in the liver (p = 0.2208) and kidney (p = 0.0018) while increasing the level of IL-10 in the liver (p = 0.024) and kidney (p = 0.0043) of rats compared to AFB1 alone treated rats. The anti-inflammatory effect of SBE-HP was more prominent in cohorts of animals co-treated at 10 mg/kg, as this dose decreased the level of IL-1β in the liver (p = 0049) and kidney (p < 0.0001) while increasing the level of IL-10 in the liver (p < 0.0001) and kidney (0.0004). SBE-HP at both doses lowered IL-1β/IL-10, favouring anti-inflammatory cytokines (Figure 9). In addition, we hypothesised that if oxidative stress and inflammation are not resolved, they may drive apoptosis and therefore probe that SBE-HP can inhibit the ability of AFB1 to orchestrate apoptosis in the liver and kidney of rats. Our results showed that AFB1, compared to the untreated group, triggered apoptosis by increasing the hepatic activities of caspase-9 and caspase-3 (p < 0.0001) as well as renal activities of caspase-9 (p = 0.0018) and caspase-3 (p < 0.0001) compared to the control. In contrast, SBE-HP at the tested doses prevented apoptosis in the liver and kidney of rats. Cohorts of rats co-treated with 5 mg/kg SBE-HP decreased hepatic activities of caspase-9 (p = 0.0062) and caspase-3 (p = 0.0008) and renal activities of caspase-9 (p = 0.0283) and caspase-3 (p = 0.0020) compared to the AFB1 alone treated rats. This effect was enhanced in cohorts of rats co-treated with 10 mg/kg SBE-HP as this decreased the hepatic activities of caspase-9 and caspase-3 (p < 0.0001) as well as hepatic activities of caspase-9 (p = 0.0012) and caspase-3 (p < 0.0001) relative to the AFB1 alone treated rats (Figure 10).

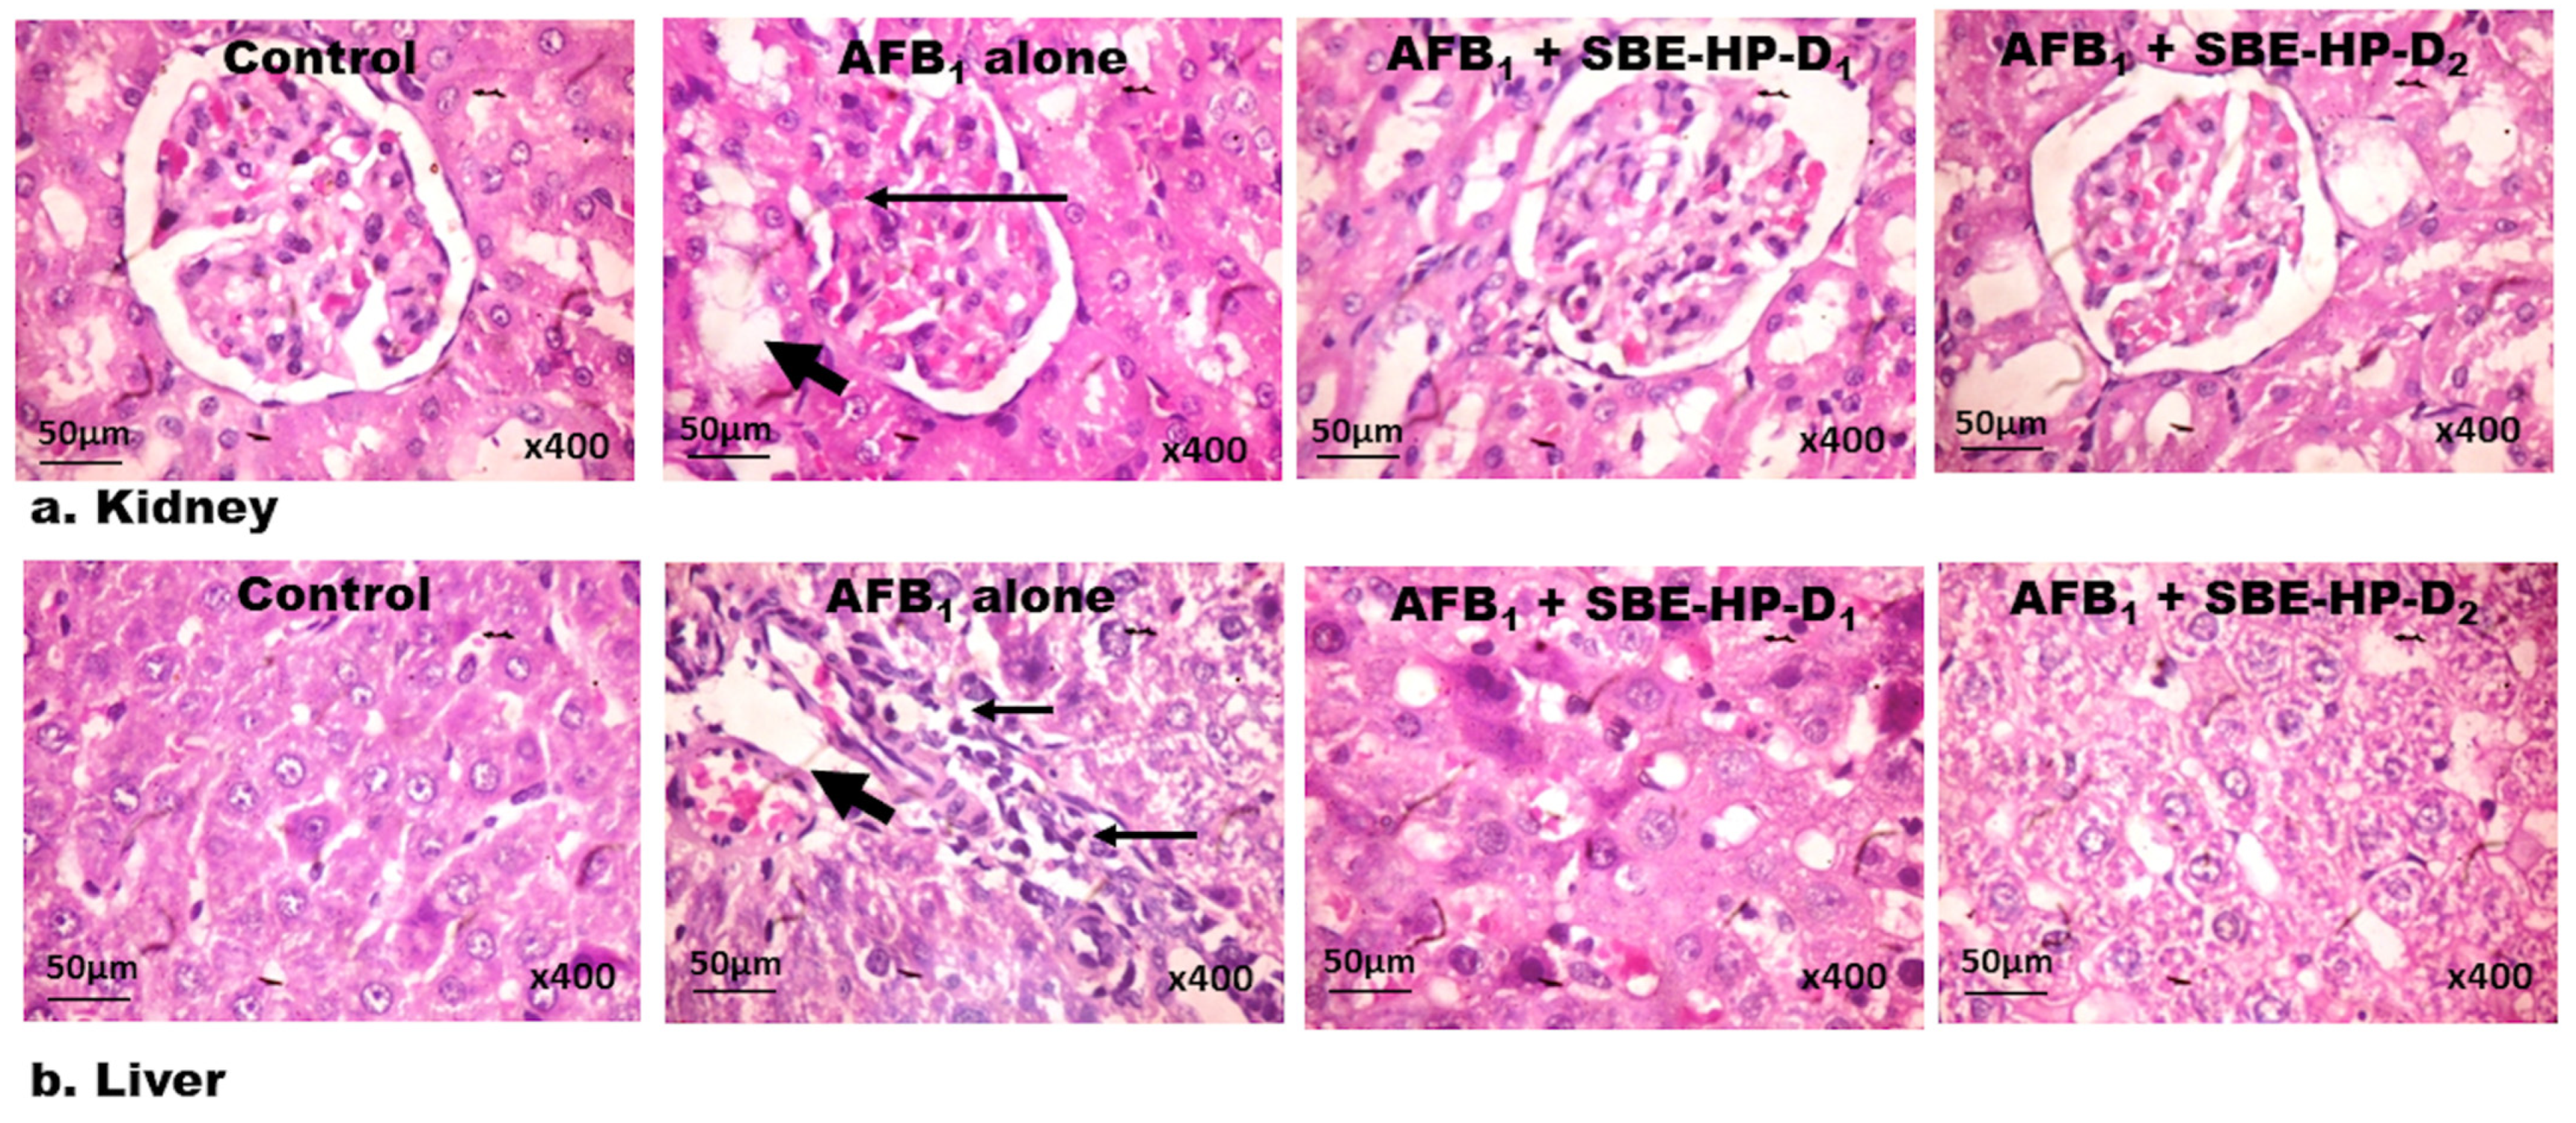
2.5. SBE-HP Abrogates Histological Lesions in the Liver and Kidney of AFB1-Exposed Rats
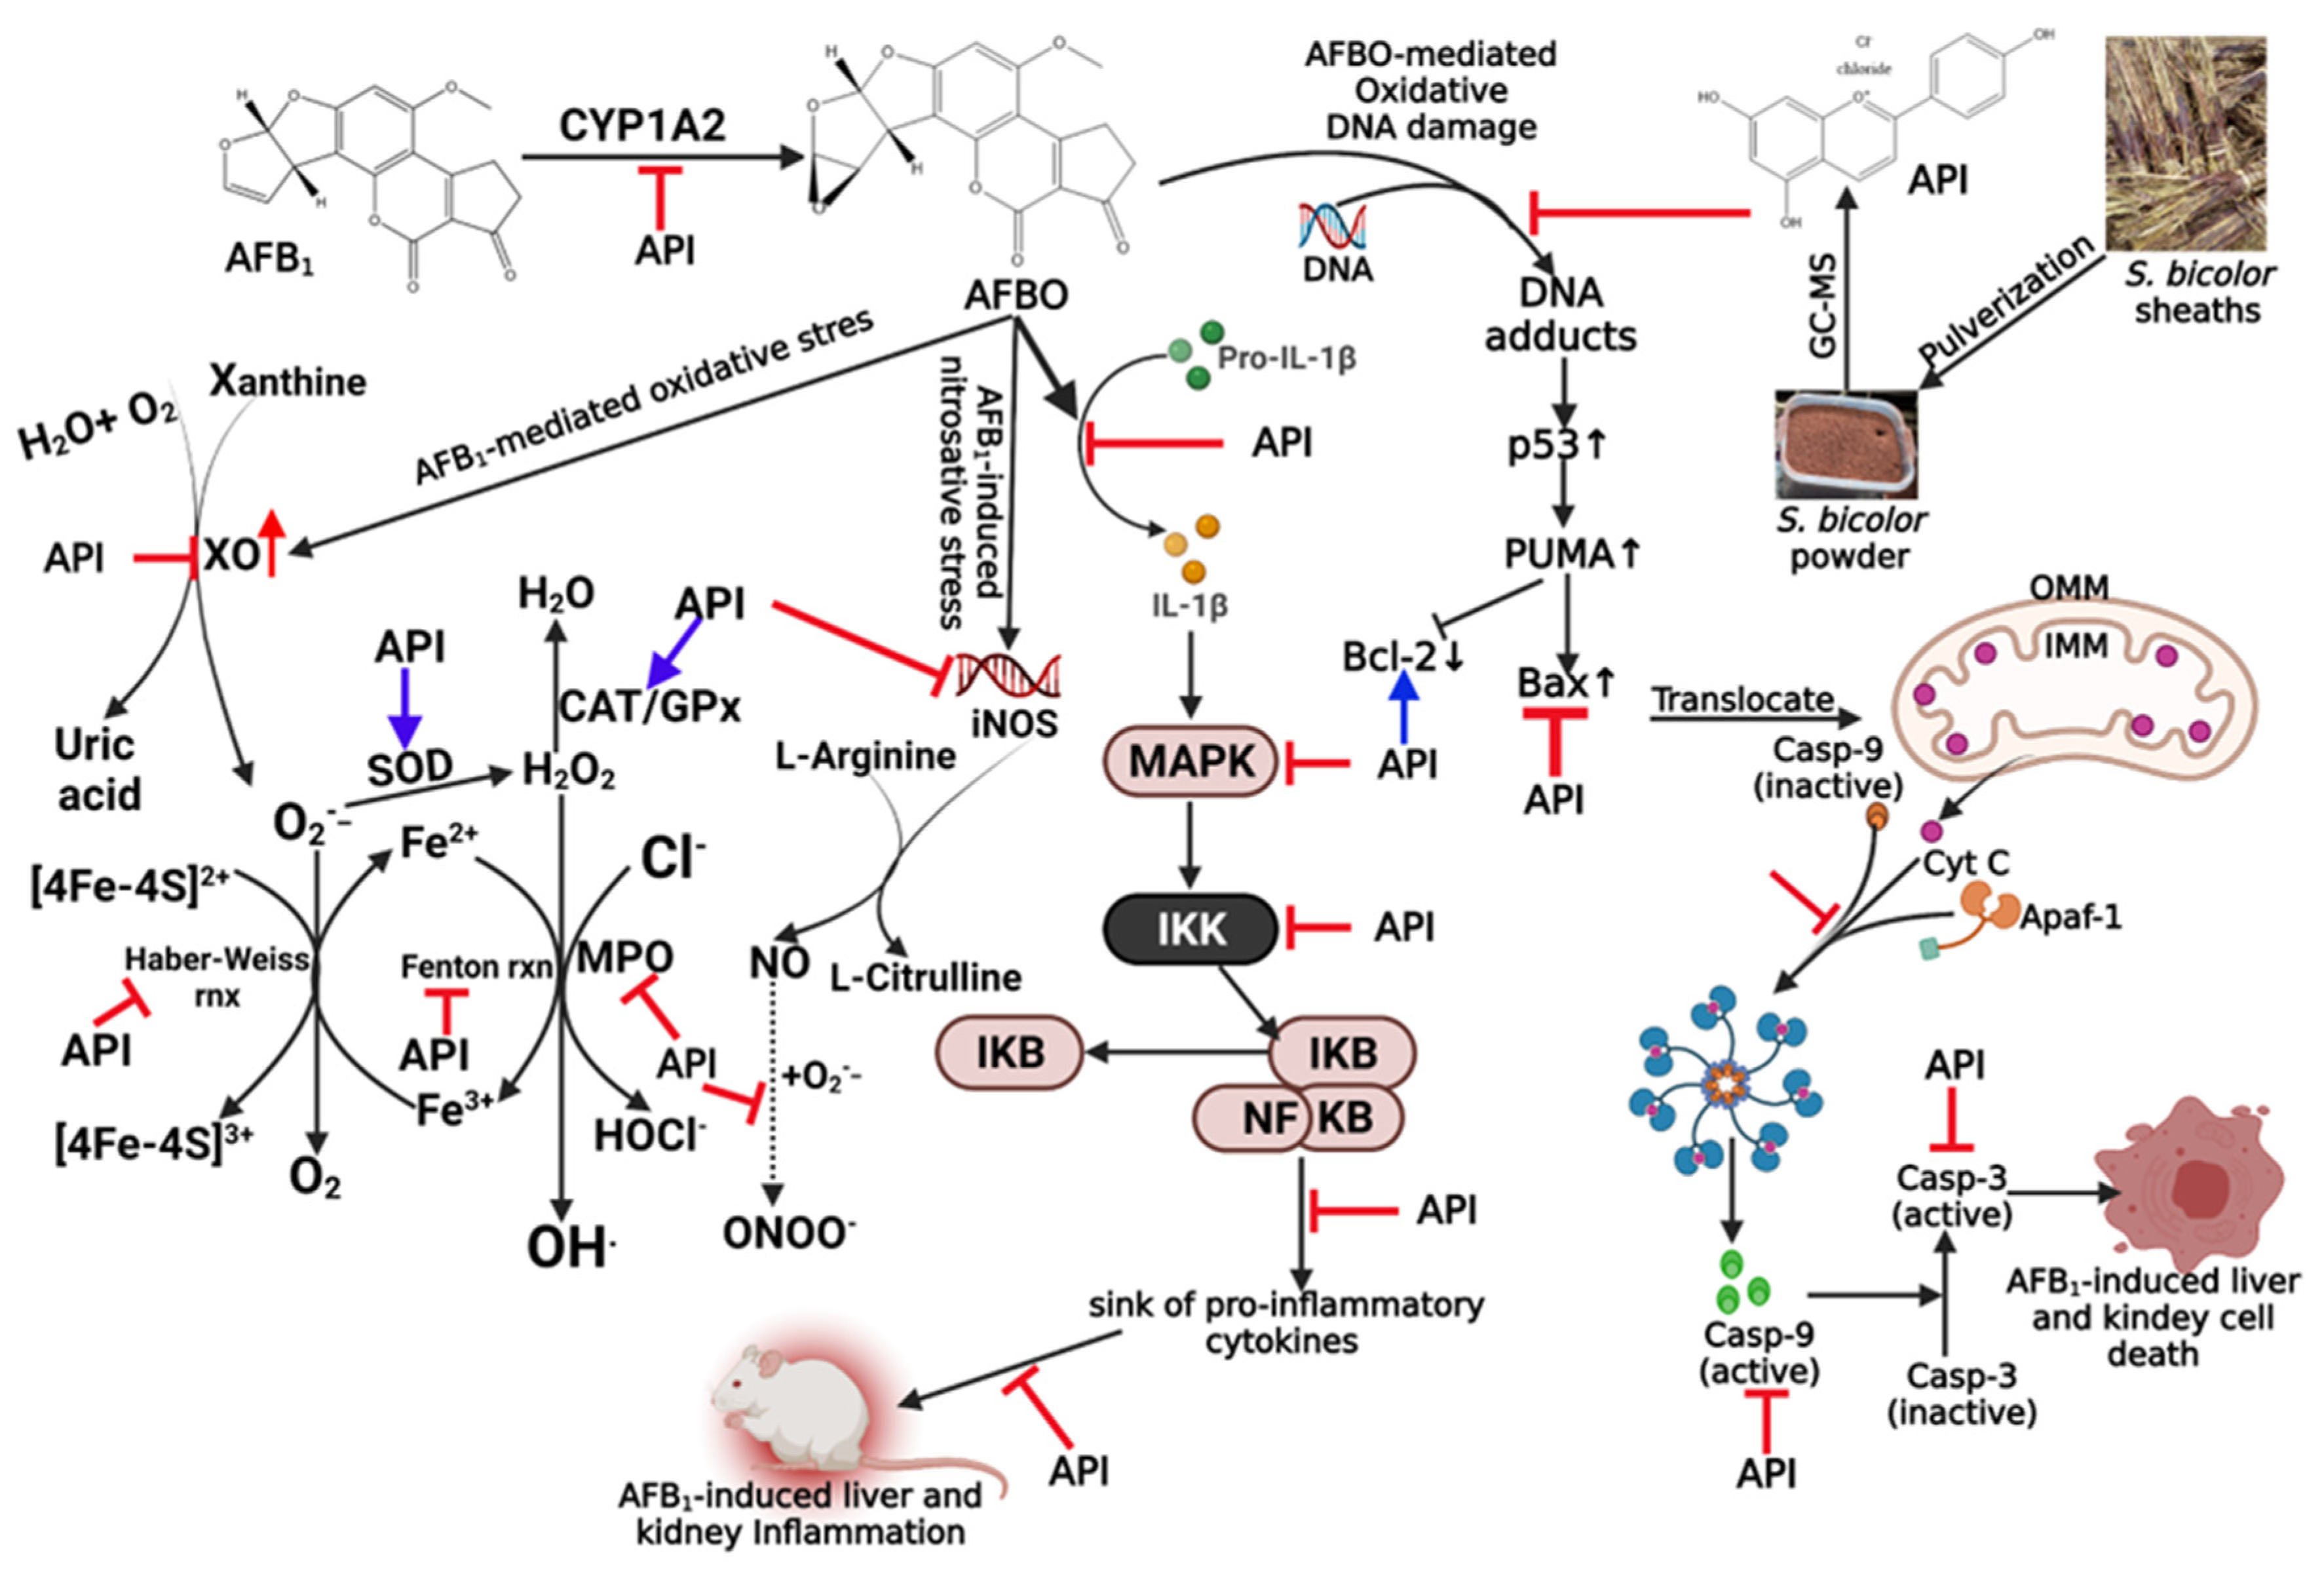
Finally, we probe that exposure to AFB1 after 28 days can orchestrate alterations in the architectural structures of the kidney and liver tissues and that co-treatment with SBE-HP can reduce the burden of AFB1-hepatorenal toxicity and preserve the architectural forms of the rat kidney and liver, as presented in Figure 11a,b. In comparison to the untreated group, cohorts of rats treated with AFB1 manifested dispersed glomerular messangialisation and infiltration of intraglomerular mesangial cells into the cortex in the kidney tissues (Figure 11a), as well as focal congestion, trafficking, and infiltration of Kupffer cells into zone 2, slight ballooning and degeneration of the liver cells and micro-vesicular steatosis in the liver tissues (Figure 11b). However, SBE-HP at 5 and 10 mg/kg minimised AFB1-mediated toxicities and preserved the histoarchitectural structures of the liver and kidney tissues, approximating histo-architecture like the control.

3. Discussion

Exposure of animals and humans to AFB1 continues to be of severe concern in semi-arid tropical regions of Asia and Africa. Accidental ingestion of AFB1 through contaminated food products can cause toxicity to organs such as the liver, kidney, hypothalamus, testis, epididymis, and heart [21,22,24,27]. The concomitant effects of AFB1-induced toxicities include growth retardation, malnutrition, and immune suppression [15,16]. Efforts to reduce AFB1 contamination in food products have continually waned due to the recalcitrant nature of the fungal species that mediate the biosynthesis of mycotoxins [38,39] and the induction of metabolic pathways for the breakdown of AFB1 [30,33,40]. Bioactive compounds in plants can remediate AFB1-mediated toxicities by inhibiting ROS production, resolution of inflammation, and preventing programmed cell death [41,42]. To further narrow the gap in the search for potential drug regimens that can effectively lessen the side events associated with AFB1 toxicity, the current study explores the ameliorative effects of the SBE-HP against AFB1-mediated hepatorenal derangements. The results show slight alterations in mean body weight and organosomatic indices and a significant increase (p < 0.05) in the activities of liver and kidney function biomarkers (ALT, AST, ALP, urea, and creatinine). There was a considerable decrease (p < 0.05) in the levels of antioxidant (SOD, CAT, GPx, GST, GSH, and TSH) and anti-inflammatory (IL-10) biomarkers; a significant increase (p < 0.05) in the levels of oxidative stress (MDA, RONS), pro-inflammatory (XO, MPO, NO, and IL-1β), and apoptotic (caspase-9 and -3) biomarkers; atypical histological structures observed in AFB1 alone treated group were reversed, counteracted, resolved, and refurbished by co-treatment with 5 and 10 mg/kg SBE-HP. This study established three definitive mechanisms for AFB1 toxicities: high ROS generation, dampening the innate antioxidant defences, and activating pro-inflammatory molecules to activate, expand, and differentiate pro-inflammatory cells. Collectively, these caused the release of pro-inflammatory cells and increased the ratio of pro-inflammation to anti-inflammation in the hepatorenal system, resulting in the induction of apoptosis via the intrinsic or extrinsic pathway.
Oxidative stress is established when an imbalance between the antioxidant defence system and the pro-oxidants occurs [43,44]. AFB1 is a known hepatoxic and nephrotoxic agent in humans and experimental animals [22,40,45]. AFB1 toxicity stems from the activities of CYP540 isoforms, which mediate the bioactivation of AFB1 into a toxic metabolite, AFBO [17,18]. Continual bioactivation of AFB1 into AFBO by these enzymes releases superoxide anion radicals (O2.-) into the hepatorenal system, thereby orchestrating SOD, an enzyme known to detoxify (O2.-) into hydrogen peroxide (H2O2), a less toxic free radical. The accumulation of H2O2 rouses the catalase activity to degrade the hepatic and renal levels of H2O2 into molecular water. GPx can detoxify H2O2 in the presence of GSH or TSH. These innate antioxidant defence systems, including SOD, CAT, GPx, GSH, and TSH, were diminished, as seen in the current study. Concomitantly, free radicals accumulate in the hepatocytes and nephrons and trigger the formation of hydroxyl radicals (HO-) in the presence of ferrous ions (Fe2+) in either the Haber–Weiss or Fenton reactions. These radicals interact with important biological molecules such as membrane lipids, proteins, and nucleic acids, triggering lipid peroxidation, as observed in this study. We observed that AFB1 significantly increased the hepatic and renal levels of MDA, a marker of lipid peroxidation and protein cross-link and DNA and RNA damage established in other studies [22,40]. These biochemical reactions evolve more ROS and RNS in the liver and kidney cells, further hampering the capacity of the innate antioxidant defence systems to mop up hepatic and renal free radicals.
As observed in this study following treatment with AFB1, a significant increase in RONS levels in tissues is correlated to hepatorenal toxicities [46]. Nevertheless, the toxicities associated with AFB1 and AFBO can be averted by the phase-2 antioxidant defence system via the expression of GST. GST interaction with AFBO mediated by GSH and other sundry enzymes forms the AFB1-S-G complex. This complex binds to MRP or p-glycoprotein and is excreted in the bile and urine. This study shows that suppressing GST’s hepatic and renal activities further exposes the target organs to ROS-mediated toxicities, as more AFBOs are formed with the simultaneous evolution of abundant free radicals. Findings from previous studies on the oxidative/nitrosative stress-promoting effects of AFB1 in rats agree with our current observations [22,47,48].
Interestingly, we observed that cohorts of rats co-treated with SBE-HP at 5 and 10 mg/kg remediated oxidative/nitrosative stress in the liver and kidney tissues by significantly increasing the hepatic and renal levels of SOD, CAT, GPx, GSH, TSH, and GST. At the same time, SBE-HP markedly decreased LPO and RONS levels in rats’ livers and kidneys. The observed antioxidative effect is attributed to the unique antioxidant activities of the key compounds in SBE-HP. API, apigenin methyl ether analogues (acacetin, glycitein (or genkwanin), apigenin dimethyl ethers, hispidulin or luteolin methyl ethers, luteolin dimethyl ether, naringenin, 7-O-methyl apigeninidin, and protocatechuic acid methyl ester identified in SBE-HP are antioxidants that have been previously detected in S. bicolor [49]. We show that API inhibited the activity of CYP1A2, one of the CYP isoforms involved in the bioactivation of AFB1 into a toxic intermediate.
Unquenched oxidative/nitrosative stress could activate signalling pathways, especially NF-κB, a known regulator of inflammation [49], and other pro-inflammatory mediators, including MPO, XO, and NO [22]. MPO, a member of the heme peroxidase superfamily, is expressed in pro-inflammatory cells such as neutrophils and monocytes [50]. It mediates the biochemical reaction in which H2O2, in the presence of chlorine, is converted to hypochlorous acid (HOCl), which decomposes to release harmful free radicals, including 1O2 and OH. An increase in MPO activity during inflammation has been shown to drive oxidative stress by promoting the release of more harmful pro-oxidants in the target tissues [51]. The interaction of these pro-oxidants and other free radicals with nucleic acid precursors such as purine bases may increase the activity of XO in the target tissues, leading to the transformation of hypoxanthine and xanthine into their end-product, urea acid, with concomitant release of O2. While O2 increases the hepatorenal system’s oxidative and nitrosative stress burdens, uric acid acts as a danger-associated molecular pattern (DAMP) to activate several inflammasome pathways and NF-κB within the hepatorenal system and orchestrate the expression of pro-inflammatory mediators [52,53]. As a biomarker of hepatorenal derangements, an increase in the level of NO in the tissues of rats correlates with prolonged oxidative stress and inflammation [44,54]. Under the basal condition, NO mediates an anti-inflammatory effect and regulates several biochemical processes, including vasodilation in the cardiovascular system, neurotransmission in the central nervous system, and cytokine-mediated activation of macrophages in the immune system [55]. However, NO may accumulate and induce chronic inflammation in tissues exposed to oxidative and inflammatory stimuli. In addition, loss of redox homeostasis can trigger an increase in NO synthase activities, an enzyme that converts L-arginine to L-ornithine and NO in the presence of reduced nicotinamide adenine dinucleotide phosphate (NADPH) and molecular O2 as co-factors. As NO accumulates in the hepatorenal system, it interacts with O2.- and produces another toxic free radical, peroxynitrite (ONOO). These reactive nitrogen species (RNS) mediate chronic information through DNA damage, increased Cox-2 expression, elevation in the expression of pro-inflammatory cytokines, angiogenesis, and nitration of functional proteins in the hepatorenal tissues [21,56]. In our findings, AFB1 orchestrated inflammation by increasing the hepatic and renal activities of MPO and XO and the levels of NO and IL-1β while decreasing the hepatic and renal levels of IL-10, an anti-inflammatory cytokine. These changes alter the pro-inflammatory/anti-inflammatory ratio favouring pro-inflammatory cues, thus increasing hepatic and renal inflammation. The induction of oxidative stress and subsequent inflammation creates suitable links between oxidative stress and inflammation. Alteration in the pro-inflammatory/anti-inflammatory ratio following exposure to AFB1 was reverted and normalised in cohorts of rats treated with API-containing SBE-HP as hepatic and renal MPO, XO, NO, and IL-1β in these rats significantly waned while that of IL-10 increased markedly. These alterations may have been possible due to bioactive compounds’ anti-inflammatory and antioxidative effects in the SBE-HP [30,36,57].
If the pro-oxidants resulting from the exposure to AFB1 are not scavenged, the resultant pro-inflammatory cues in rats’ liver and kidney tissues will not resolve. Signalling networks impairing mitochondrial dysfunction and committing cells to apoptosis may be switched upstream and downstream [58,59,60]. Specifically, free radicals produced during the metabolism of AFB1 and activating pro-inflammatory cells may bind to DNA and functional proteins to trigger the formation of DNA adducts in rats’ hepatic and renal tissues [22], causing genomic instability and committing the hepatocytes and nephrons to short-term cell cycle arrest. The duration of the cell cycle arrest will depend on when the AFB1 insults are completely detoxified and removed. However, programmed cell death may ensue if these insults persist in the liver and kidney cells. Specifically, p53 directs the expression of PUMA (p53 upregulated modulator of apoptosis), which alters the Bax/Bcl-2 ratio in favour of Bax [61]. The translocation of Bax into the hepatic and renal cells mitochondria causes cytochrome C release into the cytoplasm, where it interacts with apoptotic peptidase activating factor 1 (APAF-1) pro-caspase-9, forming apoptosome and active caspase-9, the initiator of apoptosis. Caspase-9 then activates caspase-3, the executioner of apoptosis, thereby committing the cells to die. Based on this syllogism, previous studies infer that increased activities of Caspase-9 and -3 in hepatic and renal tissue are an indication of programmed cell death of the affected tissues [22,23,62,63], and this was validated in the current studies where we observed that ingestion of AFB1 to rats significantly increased the activities of caspase-9 and -3. Any compound that can dampen the actions of these caspases could possess anti-apoptotic activity and might be used to construct a novel biologic against AFB intoxication.
Interestingly, the current study’s findings reveal that co-treatment of rats exposed to AFB1 with API-containing SBE-HP significantly decreased the activities of caspase-9 and -3, indicating an interruption in AFB1-mediated apoptosis and restoration of wholeness to the hepatorenal system. The role of bioactive compounds in S. bicolor on apoptosis depends on cell types. In normal hepatic and renal tissues, S. bicolor mediates the anti-apoptotic effect, thereby preserving the tissues from environmental toxicants capable of committing a cell to apoptosis. However, in tumours, these plant extractives portend a pro-apoptotic function, thus enhancing the death of cancer cells [30,39,64].
Alterations in the typical histological features of the liver and kidney tissues are clinically relevant in assessing the toxicities of AFB1. It also validates the outcomes of numerous biochemical assays, as established in this study. During oxidative stress, inflammation, and apoptosis, DAMPs are released into the cells, interacting with pattern recognition receptors expressed on the surface of pro-inflammatory cells [65,66]. The Kupffer cells and intraglomerular mesangial cells activate, proliferate, and differentiate into pro-inflammatory phenotypes in the liver and kidney. These cells release abundant soluble factors, including IL-1β, TNF-α, IL-17, IL-6, IL-8, NO, Cox-2, and PGE2, into the hepatocytes and nephrons, thus making the cell lose their normal histology [30], as seen in the current study. However, this effect was minimised by SBE-HP through the resolution of inflammation, inhibition of oxidative stress, and apoptosis, further validating the plant’s antioxidative, anti-inflammatory, and anti-apoptotic effects.

4. Materials and Methods

4.1. Chemicals, Reagents, and Kits

AFB1, thiobarbituric acid (TBA), 2’, 7′-dichlorodihydrofluorescin diacetate (DCFH-DA), 5’, 5’-dithiobis-2-nitrobenzoic acid (DTNB), 1-chloro-2,4-dinitrobenzene (CDNB), hydrogen peroxide (H2O2), potassium chloride (KCl), trichloroacetic acid (TCA), sodium azide, glutathione (GSH), epinephrine, sulphosalicylic acid, xanthine, Griess reagent, and O-dianisidine were bought from Sigma-Aldrich Chemical (St. Louis, MO, USA). Biomarkers of hepatic and renal functions such as alanine aminotransferase (ALT), aspartate aminotransferase (AST), alkaline phosphatase (ALP), urea, and creatinine were purchased from RandoxTM Laboratories Limited, (Crumlin, UK). Enzyme-linked immunosorbent assay (ELISA) kits for interleukin 1-beta (IL-1β), interleukin-10 (IL-10), caspase-9, and caspase-3 were purchased from Elabscience Biotechnology Company (Wuhan, China).

4.2. Collection, Identification, and Processing of Plant Sample

Overall, 5 kg dried S. bicolor sheaths were purchased from Bodija Market, Ibadan, Oyo State, Nigeria. The samples were brought to the Department of Botany, the University of Ibadan, Ibadan, Nigeria, in a polythene bag for taxonomist identification, and a voucher specimen (Accession No: UIH-23118) was deposited there for reference purposes. The plant was sorted to remove dirt and other extraneous materials and ground into fine powder.

4.3. Extraction and Phytochemical Characterisation of S. bicolor

SBE-HP was obtained as a CH2Cl2 extract of S. bicolor, as described previously [30]. The isolated brownish-red paste was analysed by thin-layer chromatography (TLC) (Supelco, TLC Silica gel 60 F254, 1.05554.0001; Sigma-Aldrich) and LC-MS (Figure 2A,B). For LC-MS analysis, 0.6 mL isopropanol, one scoop of 0.5 mm glass beads, and one scoop of 2 mm ZrO beads were added to the SBE-HP sample in a microcentrifuge vial. The mixture was homogenised in a Tissuelyzer II at 30 Hz for 5 min, vortexed, centrifuged at 21,100× g for 5 min, and transferred to an LC vial for analysis. Chromatography was performed on a Waters BEH C18 100 × 2.1 mm, a 1.7-micron column with Mobile Phase A: 60%acetonitrile 40%water 0.1% FA 10 mM ammonium formate and Mobile Phase B: 10% ACN 90% IPA, 0.1% FA 10 mM ammonium formate. The column temperature was maintained at 60 °C, and a 0.5 µL sample was injected for each run. MS data were acquired in positive and negative ion modes.

4.4. Animal Welfare, Sample Size Estimation, and Experimental Design

The 3R’s protocols, including replacement, reduction, and refinement, were adopted in this study. The sample size was estimated using the G*Power software version 3.1.9.4 [67]. With an effect size of 0.40, 95% power, and 0.05 p-value for one-way analysis of variance (ANOVA) [42], a sample size of 125 was estimated. Of this calculated value, 24 adult male Wistar Albino rats (consisting of n = six rats, i = 4) with a mean weight of approximately 165 g b.w. were bought from the experimental animal facility of the Faculty of Veterinary Medicine, University of Ibadan, Nigeria. The experimental rats were kept in the animal facility of the Department of Biochemistry, Faculty of Basic Medical Sciences, University of Ibadan, Nigeria, and humanely maintained in natural photoperiod conditions. Rats were fed with standard chows, allowed access to clean water ad libitum, and then acclimatised for 14 days before dosing with AFB1 and the hydrophobic S. bicolor extract (SBE-HP). The study was conducted in line with the ethics of animal use as certified by the Animal Care and Use Research Ethics Committee (ACUREC) of the University of Ibadan (Approval number: UI-ACUREC/032-0521/7).
The different cohorts of rats were exposed to 28 days of repeated treatment with AFB1 and SBE-HP (Figure 3A). AFB1 and the SBE-HP stocks for dosing were prepared each day and used for intubation per os (p.o). The AFB1 (50 µg/kg) dose used in this study was determined from previous reports [24,68], while the SBE-HP amount was extrapolated from a dose-response study [30]. Experimental rats were grouped as designated below:
Control: 0.05% Carboxymethyl cellulose (CMC);
AFB1 alone: Aflatoxin B1, 50 µg/kg;
AFB1+SBE-HP-D1: AFB1 (50 µg/kg) + SBE-HP-D1 (5 mg/kg);
AFB1+SBE-HP-D2: AFB1 (50 µg/kg) + SBE-HP-D2 (10 mg/kg).
CMC (0.05%) was used as a vehicle for the extracts. SBE-HP was prepared by dissolving in 0.05% CMC [69]. Control animals received 0.05% CMC (0.32 mL per rat), animals in AFB1 alone group received 0.16 mL AFB1, while animals in AFB1+SBE-HP-D1 and AFB1+SBE-HP-D1 received 0.16 mL and 0.32 mL of SBE-HP, respectively. Treatments were carried out between 09:30 and 11:30 h on the designated dates for 28 days. The 28-day treatment protocol was based on earlier experimental design and findings from our previous studies [22,30].

4.5. Termination of the Experiment, Organ Harvest, and Tissue Processing

At the expiration of 28 d, all the rats’ final body weight was measured 24 h after the last intubation, followed by exsanguination through the retro-orbital venous plexus system into well-labelled non-heparinised tubes. Afterwards, the rats were sacrificed through cervical dislocation. The whole blood was allowed to clot at 25 °C for 30 min, and the coagulated blood was subjected to centrifugation at 3000× g for 10 min at 4 °C. The clear supernatant (serum) was transferred into clean labelled Eppendorf tubes and preserved at −20 °C before quantifying the biomarkers of hepatorenal functions. In addition, the liver and kidney of the sacrificed rats were instantly removed, cleaned in ice-cold KCl solution, and then weighed using a USS-DBS16 Analytical Balance (Cleveland, OH, USA). The relative organ weights of the liver and kidney were determined as follows:
Organ   weight   Relative   to   the   bodyweight =   Weight   of   organ   g Weight   of   the   body   g × 100 .
Portions of the liver and kidney were used for biochemical and histological investigations. Samples for biochemical estimations were prepared by homogenising in a phosphate buffer (0.1 M, pH 7.4). The tissue homogenate was prepared by homogenising the liver (2 g in 8 mL of phosphate buffer) and the kidney (1.12 g in 4 mL of phosphate buffer) using a glass-Teflon homogeniser. The resultant homogenates were centrifuged at 12,000 rpm at 4 °C for 15 min to obtain a clear mitochondrial fraction. The supernatants were collected in aliquots and frozen before quantifying oxidative, inflammatory, and apoptotic biomarkers.

4.6. Estimation of Function and Integrity of the Hepatorenal System

The functionality and integrity of the liver and kidney of rats co-exposed to AFB1 and SBE-HP after 28 d was evaluated by measuring the activities and levels of ALT, AST, ALP, creatinine, and urea using commercial kits as previously reported [22].

4.7. Estimation of the Biomarkers of Oxidative Stress, Inflammation, and Apoptosis

The oxidative stress, inflammation, and apoptosis levels were measured in the liver and kidney of rats co-exposed to AFB1 and SBE-HP post 28 d. The levels of total protein in the liver and kidney of rats were estimated according to the method described by ref. [46]; hepatic and renal activities of superoxide dismutase (SOD) were assessed by the methods described by Misra and Fridovich [70], as previously reported [71]; hepatic and renal activities of catalase (CAT) were assessed by the protocols of Clairborne [72] using H2O2 as a substrate as previously reported [73]; hepatic and renal activities of Glutathione-S-transferase (GST) and glutathione peroxidase (GPx) were quantified by the procedures of Habig [74] and Rotruck et al. [75], respectively, as previously reported [76]; hepatic and renal levels of reduced glutathione (GSH) and total sulfhydryl group (TSH) were estimated by the method of Jollow et al. [77] and Ellman [78], as previously reported [22,57]; hepatic and renal activities of xanthine oxidase (XO) were measured by the procedures of Bergmeyer et al. [79]; hepatic and renal levels of malondialdehyde (MDA), otherwise termed lipid peroxidation (LPO) were assessed by the method described by Okhawa [80]; hepatic and renal levels of reactive oxygen and nitrogen species (RONS) were assayed by the protocols of Owumi and Dim [81]; hepatic and renal nitric oxide (NO) level and myeloperoxidase (MPO) activity were quantified by the protocols of Green et al. [60,82] and Granell et al. [83,84], respectively, as previously reported by Owumi et al. [85]; hepatic and renal levels of IL-1β and IL-10 and the caspase-9 and -3 activities were assayed using ELISA kits, as previously reported [22]. All measurements were carried out using a Spectra MaxTM plate reader.

4.8. Examination of the Histological Sections of the Liver and Kidney

The portions of the liver and kidney for histological assessment were fixed in neutral buffered formalin (10%) before the preparation of histological sectioning and staining. With the aid of a standard paraffin-wax method, the hepatic and renal tissues were processed for histopathological examination in line with the description of Bancroft and Gamble [86]. Approximately five μm thickness of the portion of the liver and kidney were dyed with haematoxylin and eosin and processed for light microscopy. All prepared slides were coded and probed with a Carl Zeiss Axio light microscope (Gottingen, Germany). On inspection, images were taken using a Zeiss Axiocam 512 camera (Gottingen, Germany) attached to the microscope by a pathologist unaware of the various treatment cohorts from which the slides were prepared.

4.9. Statistical Analysis of Results

At the end of the experiments, data were generated, quantified, and subjected to statistical analyses using quantitative measures such as mean and standard deviation. The results were expressed as the mean ± SD of replicates. A test of statistical inferences was performed by student t-test to compare the significance between the initial body weight (IBW) and final body weight (FBW) of rats. A one-way analysis of variance (ANOVA) followed by a post hoc test (Tukey’s test) set at a 95% probability level was used to test the significance difference across the four experimental groups using GraphPad Prism, version 8.3.0 for Mac (www.graphpad.com, accessed on 9 July 2022; GraphPad, San Diego, CA, USA).

5. Conclusions

We have shown that API-containing SBE-HP prevented, in adult male Wistar Albino rats, oxidative/nitrosative stress, inflammation, and apoptosis induction. The probable mechanisms may be activating the aryl hydrocarbon receptor (which promotes IL-10 expression), de-repression of estrogen receptor alpha (known to mediate anti-inflammatory activity), activation of the expression of p53 and mitochondrial membrane potential, and upregulation of Nrf2, NQO1, and HO-1 signalling. At the same time, mediating the suppression of cytochrome P450 (CYP) 1A2 expression, inhibition of NF-kB, upregulation of Bax expression and the activities of caspase-3 and caspase-3 and suppression of signalling along JNK, p38 MAKP, ERK, and Keap1 axis as depicted in our proposed mechanism of protection Figure 12. These findings recapitulate the ethnomedicinal relevance of the SBE-HP and emphasise its usefulness in preventing AFB1 intoxications, including hepatic steatosis, hepatitis, cirrhosis, hepatocellular carcinoma, and glomerulonephritis in animal and human models. Finally, our studies validate the three defined mechanisms of AFB1 intoxications, including oxidative stress, inflammation, and apoptosis, and warrant further investigation to explore more mechanistic pathways of AFB1 intoxication in rats and other experimental models.

Author Contributions

S.E.O. and A.K.O.: Conceptualisation; A.O.A., B.A. and S.O.N.: Data curation, Analysis, Investigation, and Project administration; S.E.O., B.A., A.O.A., S.O.N. and A.K.O.: Supervision and Visualisation; A.K.O.: Validation; S.E.O., A.K.O., A.O.A., B.A. and S.O.N.: Writing—review and editing. All authors have read and agreed to the published version of the manuscript.

Funding

The Georgia Institute of Technology partly supported this research through the Vassar-Woolley Fellowship and SoCB One-Time Grant (A.K.O.).

Institutional Review Board Statement

All experiments were performed according to relevant guidelines and regulations and adhered to the ARRIVE guidelines (https://arriveguidelines.org) (accessed on 5 May 2022) to report animal experiments. The protocols for the care and use of experimental animals in this study were approved by the University of Ibadan, Animal Care and Use in Research Ethical Committee with approval number: UI-ACUREC/032-0521-7. The experimental research on S. bicolor complied with all relevant institutional, national, and international guidelines and legislation. The sample of S. bicolor was identified correctly and deposited in the University of Ibadan, Department of Botany and a voucher specimen, Accession number: UIH-23118, was assigned for future reference.

Informed Consent Statement

Not Applicable.

Data Availability Statement

The datasets used and analysed during the current study are available from the corresponding author upon reasonable request.

Acknowledgments

The Georgia Institute of Technology partly supported this research through the Vassar-Woolley Fellowship and SoCB One-Time Grant (A.K.O.). The authors also wish to acknowledge Mercy Olubunmi of the Department of Biochemistry, the University of Ibadan, for her technical assistance. This manuscript is dedicated to the memory of the Late Professor Anthony Uwaifo, 1943–2020.

Conflicts of Interest

The authors (Solomon Owumi, Adenike O. Akinwunmi, Sarah Nwozo, and Adegboyega Oyelere) declare no conflict of interest.

References

  1. Pitt, J.I. Toxigenic fungi and mycotoxins. Br. Med. Bull. 2000, 56, 184–192. [Google Scholar] [CrossRef] [PubMed] [Green Version]
  2. Palacios, H.A.; Stefanello, A.; Gavilánez, M.S.G.; Demera, D.A.C.; Garcia, M.V.; Castillo, W.A.V.; Marcano, M.A.A.; Maigua, I.R.S.; Copetti, M.V. Relationship between the Fungal Incidence, Water Activity, Humidity, and Aflatoxin Content in Maize Samples from the Highlands and Coast of Ecuador. Toxins 2022, 14, 196. [Google Scholar] [CrossRef] [PubMed]
  3. Cotty, P.J.; Mellon, J.E. Ecology of aflatoxin producing fungi and biocontrol of aflatoxin contamination. Mycotoxin Res. 2006, 22, 110–117. [Google Scholar] [CrossRef]
  4. Schroeder, H.W. Factors influencing the development of aflatoxins in some field crops. J. Stored Prod. Res. 1969, 5, 187–192. [Google Scholar] [CrossRef]
  5. Benkerroum, N. Aflatoxins: Producing-Molds, Structure, Health Issues and Incidence in Southeast Asian and Sub-Saharan African Countries. Int. J. Environ. Res. Public Health 2020, 17, 1215. [Google Scholar] [CrossRef] [PubMed] [Green Version]
  6. Dai, H.; Huang, Z.; Liu, X.; Bi, J.; Shu, Z.; Xiao, A.; Wang, J. Colorimetric ELISA based on urease catalysis curcumin as a ratiometric indicator for the sensitive determination of aflatoxin B1 in grain products. Talanta 2022, 246, 123495. [Google Scholar] [CrossRef]
  7. Mitchell, N.J.; Bowers, E.; Hurburgh, C.; Wu, F. Potential economic losses to the US corn industry from aflatoxin contamination. Food Addit. Contam. Part A 2016, 33, 540–550. [Google Scholar] [CrossRef] [Green Version]
  8. Sudakin, D.L. Dietary Aflatoxin Exposure and Chemoprevention of Cancer: A Clinical Review. J. Toxicol. Clin. Toxicol. 2003, 41, 195–204. [Google Scholar] [CrossRef]
  9. Holcomb, M.; Wilson, D.; Trucksess, M.; Thompson, H. Determination of aflatoxins in food products by chromatography. J. Chromatogr. A 1992, 624, 341–352. [Google Scholar] [CrossRef]
  10. Zhang, K.; Banerjee, K. A Review: Sample Preparation and Chromatographic Technologies for Detection of Aflatoxins in Foods. Toxins 2020, 12, 539. [Google Scholar] [CrossRef]
  11. Salisu, B.; Anua, S.M.; Ishak, W.R.W.; Mazlan, N. Development and validation of quantitative thin layer chromatographic technique for determination of total aflatoxins in poultry feed and food grains without sample clean-up. J. Adv. Veter. Anim. Res. 2021, 8, 656–670. [Google Scholar] [CrossRef]
  12. IARC. IARC Monographs on the Identification of Carcinogenic Hazards to Humans. In Book IARC Monographs on the Identification of Carcinogenic Hazards to Humans; International Agency for Research on Cancer: Lyon, France, 2012; Volume 131, pp. 1–40. [Google Scholar]
  13. Hanigan, H.M.; Laishes, B.A. Toxicity of aflatoxin B1 in rat and mouse hepatocytes in vivo and in vitro. Toxicology 1984, 30, 185–193. [Google Scholar] [CrossRef]
  14. Jiang, Y.; Ogunade, I.; Vyas, D.; Adesogan, A. Aflatoxin in Dairy Cows: Toxicity, Occurrence in Feedstuffs and Milk and Dietary Mitigation Strategies. Toxins 2021, 13, 283. [Google Scholar] [CrossRef]
  15. Shephard, G.S. Risk assessment of aflatoxins in food in Africa. Food Addit. Contam. Part A 2008, 25, 1246–1256. [Google Scholar] [CrossRef] [PubMed]
  16. Kortei, N.K.; Annan, T.; Kyei-Baffour, V.; Essuman, E.K.; Okyere, H.; Tettey, C.O. Exposure and risk characterizations of ochratoxins A and aflatoxins through maize (Zea mays) consumed in different agro-ecological zones of Ghana. Sci. Rep. 2021, 11, 1–19. [Google Scholar] [CrossRef] [PubMed]
  17. Wang, C.; Bammler, T.K.; Guo, Y.; Kelly, E.J.; Eaton, D.L. Mu-class GSTs are responsible for aflatoxin B(1)-8, 9-epoxide-conjugating activity in the nonhuman primate macaca fascicularis liver. Toxicol. Sci. 2000, 56, 26–36. [Google Scholar] [CrossRef] [PubMed] [Green Version]
  18. Tulayakul, P.; Sakuda, S.; Dong, K.; Kumagai, S. Comparative activities of glutathione-S-transferase and dialdehyde reductase toward aflatoxin B1 in livers of experimental and farm animals. Toxicon 2005, 46, 204–209. [Google Scholar] [CrossRef]
  19. Min, L.; Fink-Gremmels, J.; Li, D.; Tong, X.; Tang, J.; Nan, X.; Yu, Z.; Chen, W.; Wang, G. An overview of aflatoxin B1 biotransformation and aflatoxin M1 secretion in lactating dairy cows. Anim. Nutr. 2021, 7, 42–48. [Google Scholar] [CrossRef]
  20. Shen, H.-M.; Ong, C.-N. Mutations of the p53 tumor suppressor gene and ras oncogenes in aflatoxin hepatocarcinogenesis. Mutat. Res. Genet. Toxicol. 1996, 366, 23–44. [Google Scholar] [CrossRef]
  21. Owumi, S.E.; Irozuru, C.E.; Arunsi, U.O.; Faleke, H.O.; Oyelere, A.K. Caffeic acid mitigates aflatoxin B1-mediated toxicity in the male rat reproductive system by modulating inflammatory and apoptotic responses, testicular function, and the redox-regulatory systems. J. Food Biochem. 2022, 46, e14090. [Google Scholar] [CrossRef]
  22. Owumi, S.E.; Irozuru, C.E.; Arunsi, U.O.; Oyelere, A.K. Caffeic acid protects against DNA damage, oxidative and inflammatory mediated toxicities, and upregulated caspases activation in the hepatorenal system of rats treated with aflatoxin B(1). Toxicon 2022, 207, 1–12. [Google Scholar] [CrossRef]
  23. Loe, D.W.; Stewart, R.K.; Massey, T.E.; Deeley, R.G.; Cole, S.P.C. ATP-Dependent Transport of Aflatoxin B1and Its Glutathione Conjugates by the Product of the Multidrug Resistance Protein (MRP) Gene. Mol. Pharmacol. 1997, 51, 1034–1041. [Google Scholar] [CrossRef] [Green Version]
  24. Owumi, S.; Najophe, E.S.; Farombi, E.O.; Oyelere, A.K. Gallic acid protects against Aflatoxin B1-induced oxidative and inflammatory stress damage in rats kidneys and liver. J. Food Biochem. 2020, 44, e13316. [Google Scholar] [CrossRef] [PubMed]
  25. Storvik, M.; Huuskonen, P.; Kyllonen, T.; Lehtonen, S.; El-Nezami, H.; Auriola, S.; Pasanen, M. Aflatoxin B1--a potential endocrine disruptor--up-regulates CYP19A1 in JEG-3 cells. Toxicol. Lett. 2011, 202, 161–167. [Google Scholar] [CrossRef] [PubMed]
  26. Gugliandolo, E.; Peritore, A.F.; D’Amico, R.; Licata, P.; Crupi, R. Evaluation of Neuroprotective Effects of Quercetin against Aflatoxin B1-Intoxicated Mice. Animals 2020, 10, 898. [Google Scholar] [CrossRef]
  27. Wang, W.-J.; Xu, Z.-L.; Yu, C.; Xu, X.-H. Effects of aflatoxin B1 on mitochondrial respiration, ROS generation and apoptosis in broiler cardiomyocytes. Anim. Sci. J. 2017, 88, 1561–1568. [Google Scholar] [CrossRef] [PubMed]
  28. Hinton, D.M.; Myers, M.J.; Raybourne, R.A.; Francke-Carroll, S.; Sotomayor, R.E.; Shaddock, J.; Warbritton, A.; Chou, M.W. Immunotoxicity of Aflatoxin B1 in Rats: Effects on Lymphocytes and the Inflammatory Response in a Chronic Intermittent Dosing Study. Toxicol. Sci. 2003, 73, 362–377. [Google Scholar] [CrossRef]
  29. Rooney, L.W.; Waniska, R.D. Sorghum Food and Industrial Utilization; John Wiley & Sons, Inc.: New York, NY, USA, 2000. [Google Scholar]
  30. Owumi, S.E.; Kazeem, A.I.; Wu, B.; Ishokare, L.O.; Arunsi, U.O.; Oyelere, A.K. Apigeninidin-rich Sorghum bicolor (L. Moench) extracts suppress A549 cells proliferation and ameliorate toxicity of aflatoxin B1-mediated liver and kidney derangement in rats. Sci. Rep. 2022, 12, 1–19. [Google Scholar] [CrossRef]
  31. Xu, J.; Wang, W.; Zhao, Y. Phenolic Compounds in Whole Grain Sorghum and Their Health Benefits. Foods 2021, 10, 1921. [Google Scholar] [CrossRef]
  32. de Morais Cardoso, L.; Pinheiro, S.S.; Martino, H.S.D.; Pinheiro-Sant’Ana, H.M. Sorghum (Sorghum bicolor L.): Nutrients, bioactive compounds, and potential impact on human health. Crit. Rev. Food Sci. Nutr. 2017, 57, 372–390. [Google Scholar] [CrossRef]
  33. Owumi, S.E.; Otunla, M.T.; Arunsi, U.O.; Oyelere, A.K. Apigeninidin-enriched Sorghum bicolor (L. Moench) extracts alleviate Aflatoxin B(1)-induced dysregulation of male rat hypothalamic-reproductive axis. Exp. Biol. Med. 2022, 247, 1301–1316. [Google Scholar] [CrossRef] [PubMed]
  34. Ademiluyi, A.O.; Oboh, G.; Agbebi, O.J.; Boligon, A.A.; Athayde, M.L. Sorghum [Sorghum bicolor(L.) Moench] Leaf Sheath Dye Protects Against Cisplatin-Induced Hepatotoxicity and Oxidative Stress in Rats. J. Med. Food 2014, 17, 1332–1338. [Google Scholar] [CrossRef] [PubMed] [Green Version]
  35. Espitia-Hernández, P.; González, M.L.C.; Ascacio-Valdés, J.A.; Dávila-Medina, D.; Flores-Naveda, A.; Silva, T.; Chacón, X.R.; Sepúlveda, L. Sorghum (Sorghum bicolor L.) as a potential source of bioactive substances and their biological properties. Crit. Rev. Food Sci. Nutr. 2020, 62, 2269–2280. [Google Scholar] [CrossRef] [PubMed]
  36. Garrett, A.R.; Weagel, E.; Martinez, A.D.; Heaton, M.; Robison, R.A.; O’Neill, K.L. A novel method for predicting antioxidant activity based on amino acid structure. Food Chem. 2014, 158, 490–496. [Google Scholar] [CrossRef] [PubMed]
  37. Benson, K.F.; Beaman, J.L.; Ou, B.; Okubena, A.; Okubena, O.; Jensen, G.S. West African Sorghum bicolor Leaf Sheaths Have Anti-Inflammatory and Immune-Modulating Properties In Vitro. J. Med. Food 2013, 16, 230–238. [Google Scholar] [CrossRef] [Green Version]
  38. Wuyts, J.; Van Dijck, P.; Holtappels, M. Fungal persister cells: The basis for recalcitrant infections? PLoS Pathog. 2018, 14, e1007301. [Google Scholar] [CrossRef]
  39. Smolensky, D.; Rhodes, D.; McVey, D.S.; Fawver, Z.; Perumal, R.; Herald, T.; Noronha, L. High-Polyphenol Sorghum Bran Extract Inhibits Cancer Cell Growth Through ROS Induction, Cell Cycle Arrest, and Apoptosis. J. Med. Food 2018, 21, 990–998. [Google Scholar] [CrossRef]
  40. Hua, Z.; Liu, R.; Chen, Y.; Liu, G.; Li, C.; Song, Y.; Cao, Z.; Li, W.; Li, W.; Lu, C.; et al. Contamination of Aflatoxins Induces Severe Hepatotoxicity Through Multiple Mechanisms. Front. Pharmacol. 2021, 11, 605823. [Google Scholar] [CrossRef] [PubMed]
  41. Pokharel, Y.R.; Han, E.H.; Kim, J.Y.; Oh, S.J.; Kim, S.K.; Woo, E.-R.; Jeong, H.G.; Kang, K.W. Potent protective effect of isoimperatorin against aflatoxin B1-inducible cytotoxicity in H4IIE cells: Bifunctional effects on glutathione S-transferase and CYP1A. Carcinogenesis 2006, 27, 2483–2490. [Google Scholar] [CrossRef] [PubMed] [Green Version]
  42. Owumi, S.E.; Otunla, M.T.; Najophe, E.S.; Oyelere, A.K. Decrease in reproductive dysfunction using aflatoxin B1 exposure: A treatment with 3-indolepropionic acid in albino Wistar rat. Andrologia 2021, 54, e14248. [Google Scholar] [CrossRef]
  43. Donato, M.T.; Jiménez, N.; Pelechá, M.; Tolosa, L. Oxidative-stress and long-term hepatotoxicity: Comparative study in Upcyte human hepatocytes and hepaRG cells. Arch. Toxicol. 2022, 96, 1021–1037. [Google Scholar] [CrossRef]
  44. Owumi, S.; Lewu, D.; Arunsi, U.; Oyelere, A. Luteolin attenuates doxorubicin-induced derangements of liver and kidney by reducing oxidative and inflammatory stress to suppress apoptosis. Hum. Exp. Toxicol. 2021, 40, 1656–1672. [Google Scholar] [CrossRef] [PubMed]
  45. Sun, L.-H.; Zhang, N.-Y.; Zhu, M.-K.; Zhao, L.; Zhou, J.-C.; Qi, D.-S. Prevention of Aflatoxin B1 Hepatoxicity by Dietary Selenium Is Associated with Inhibition of Cytochrome P450 Isozymes and Up-Regulation of 6 Selenoprotein Genes in Chick Liver. J. Nutr. 2016, 146, 655–661. [Google Scholar] [CrossRef] [PubMed] [Green Version]
  46. Vipin, A.V.; Rao, R.; Kurrey, N.K.; Anu, A.K.A.; Venkateswaran, G. Protective effects of phenolics rich extract of ginger against Aflatoxin B(1)-induced oxidative stress and hepatotoxicity. Biomed. Pharmacother. 2017, 91, 415–424. [Google Scholar]
  47. Akinrinde, A.S.; Adebiyi, O.E.; Asekun, A. Amelioration of Aflatoxin B1-induced gastrointestinal injuries by Eucalyptus oil in rats. J. Complement. Integr. Med. 2019, 17, 1–11. [Google Scholar] [CrossRef] [PubMed]
  48. Adedara, I.; Owumi, S.; Uwaifo, A.; Farombi, E. Aflatoxin B1 and ethanol co-exposure induces hepatic oxidative damage in mice. Toxicol. Ind. Health 2010, 26, 717–724. [Google Scholar] [CrossRef]
  49. Ofosu, F.K.; Elahi, F.; Daliri, E.B.-M.; Yeon, S.-J.; Ham, H.J.; Kim, J.-H.; Han, S.-I.; Oh, D.-H. Flavonoids in Decorticated Sorghum Grains Exert Antioxidant, Antidiabetic and Antiobesity Activities. Molecules 2020, 25, 2854. [Google Scholar] [CrossRef]
  50. Ndrepepa, G. Myeloperoxidase—A bridge linking inflammation and oxidative stress with cardiovascular disease. Clin. Chim. Acta 2019, 493, 36–51. [Google Scholar] [CrossRef]
  51. Aratani, Y. Myeloperoxidase: Its role for host defense, inflammation, and neutrophil function. Arch. Biochem. Biophys. 2018, 640, 47–52. [Google Scholar] [CrossRef]
  52. Pratomo, I.P.; Noor, D.R.; Kusmardi, K.; Rukmana, A.; Paramita, R.I.; Erlina, L.; Fadilah, F.; Gayatri, A.; Fitriani, M.; Purnomo, T.T.H.; et al. Xanthine Oxidase-Induced Inflammatory Responses in Respiratory Epithelial Cells: A Review in Immunopathology of COVID-19. Int. J. Inflamm. 2021, 2021, 1–10. [Google Scholar] [CrossRef]
  53. Romagnoli, M.; Gomez-Cabrera, M.C.; Perrelli, M.G.; Biasi, F.; Pallardo, F.V.; Sastre, J.; Poli, G.; Vina, J. Xanthine oxidase-induced oxidative stress causes activation of NF-kappaB and inflammation in the liver of type I diabetic rats. Free Radic. Biol. Med. 2010, 49, 171–177. [Google Scholar] [CrossRef]
  54. Owumi, S.E.; Otunla, M.T.; Arunsi, U.O.; Najophe, E.S. 3-Indolepropionic acid upturned male reproductive function by reducing oxido-inflammatory responses and apoptosis along the hypothalamic-pituitary-gonadal axis of adult rats exposed to chlorpyrifos. Toxicology 2021, 463, 152996. [Google Scholar] [CrossRef] [PubMed]
  55. Sharma, J.N.; Al-Omran, A.; Parvathy, S.S. Role of nitric oxide in inflammatory diseases. Inflammopharmacology 2007, 15, 252–259. [Google Scholar] [CrossRef]
  56. Grimm, E.A.; Sikora, A.G.; Ekmekcioglu, S. Molecular Pathways: Inflammation-Associated Nitric-Oxide Production as a Cancer-Supporting Redox Mechanism and a Potential Therapeutic Target. Clin. Cancer Res. 2013, 19, 5557–5563. [Google Scholar] [CrossRef] [PubMed] [Green Version]
  57. Owumi, S.E.; Aliyu-Banjo, N.O.; Danso, O.F. Fluoride and diethylnitrosamine coexposure enhances oxido-inflammatory responses and caspase-3 activation in liver and kidney of adult rats. J. Biochem. Mol. Toxicol. 2019, 33, e22327. [Google Scholar] [CrossRef]
  58. Meng, S.-J.; Yu, L.-J. Oxidative Stress, Molecular Inflammation and Sarcopenia. Int. J. Mol. Sci. 2010, 11, 1509–1526. [Google Scholar] [CrossRef] [PubMed] [Green Version]
  59. Kannan, K.; Jain, S.K. Oxidative stress and apoptosis. Pathophysiology 2000, 7, 153–163. [Google Scholar] [CrossRef] [PubMed]
  60. Turkmen, K. Inflammation, oxidative stress, apoptosis, and autophagy in diabetes mellitus and diabetic kidney disease: The Four Horsemen of the Apocalypse. Int. Urol. Nephrol. 2016, 49, 837–844. [Google Scholar] [CrossRef]
  61. Nakano, K.; Vousden, K.H. PUMA, a Novel Proapoptotic Gene, Is Induced by p53. Mol. Cell 2001, 7, 683–694. [Google Scholar] [CrossRef]
  62. Zhou, Y.; Wang, S.; Luo, H.; Xu, F.; Liang, J.; Ma, C.; Ren, L.; Wang, H.; Hou, Y. Aflatoxin B1 induces microglia cells apoptosis mediated by oxidative stress through NF-kappaB signaling pathway in mice spinal cords. Environ. Toxicol. Pharmacol. 2022, 90, 103794. [Google Scholar] [CrossRef]
  63. Mughal, M.J.; Xi, P.; Yi, Z.; Jing, F. Aflatoxin B1 invokes apoptosis via death receptor pathway in hepatocytes. Oncotarget 2017, 8, 8239–8249. [Google Scholar] [CrossRef] [PubMed]
  64. Ryu, J.-M.; Jang, G.Y.; Park, D.; Woo, K.S.; Kim, T.M.; Jeong, H.S.; Kim, D.J. Effect of sorghum ethyl-acetate extract on benign prostatic hyperplasia induced by testosterone in Sprague–Dawley rats. Biosci. Biotechnol. Biochem. 2018, 82, 2101–2108. [Google Scholar] [CrossRef] [PubMed]
  65. Tang, P.M.K.; Nikolic-Paterson, D.J.; Lan, H.-Y. Macrophages: Versatile players in renal inflammation and fibrosis. Nat. Rev. Nephrol. 2019, 15, 144–158. [Google Scholar] [CrossRef]
  66. Nalkurthi, C.; Schroder, W.A.; Melino, M.; Irvine, K.M.; Nyuydzefe, M.; Chen, W.; Liu, J.; Teng, M.W.; Hill, G.R.; Bertolino, P.; et al. ROCK2 inhibition attenuates profibrogenic immune cell function to reverse thioacetamide-induced liver fibrosis. JHEP Rep. 2021, 4, 100386. [Google Scholar] [CrossRef] [PubMed]
  67. Faul, F.; Erdfelder, E.; Lang, A.-G.; Buchner, A. G*Power 3: A flexible statistical power analysis program for the social, behavioral, and biomedical sciences. Behav. Res. Methods 2007, 39, 175–191. [Google Scholar] [CrossRef] [PubMed]
  68. Garud, M.S.; Kulkarni, Y.A. Gallic acid attenuates type I diabetic nephropathy in rats. Chem. Interact. 2018, 282, 69–76. [Google Scholar] [CrossRef]
  69. Javanbakht, S.; Shaabani, A. Carboxymethyl cellulose-based oral delivery systems. Int. J. Biol. Macromol. 2019, 133, 21–29. [Google Scholar] [CrossRef] [PubMed]
  70. Misra, H.P.; Fridovich, I. The role of superoxide anion in the autoxidation of epinephrine and a simple assay for superoxide dismutase. J. Biol. Chem. 1972, 247, 3170–3175. [Google Scholar] [CrossRef]
  71. Adefisan, A.O.; Madu, J.C.; Owumi, S.E.; Adaramoye, O.A. Calliandra portoricensis ameliorates ovarian and uterine oxido-inflammatory responses in N-methyl-N-nitrosourea and benzo[a] pyrene-treated rats. Exp. Biol. Med. 2020, 245, 1490–1503. [Google Scholar] [CrossRef]
  72. Clairborne, A. Catalase Activity; CRC Press: Boca Raton, FL, USA, 1995. [Google Scholar]
  73. Owumi, S.E.; Danso, O.F.; Nwozo, S.O. Gallic acid and omega-3 fatty acids mitigate epididymal and testicular toxicity in manganese-treated rats. Andrologia 2020, 52, e13630. [Google Scholar] [CrossRef]
  74. Habig, W.H.; Pabst, M.J.; Jakoby, W.B. Glutathione S-transferases. The first enzymatic step in mercapturic acid formation. J. Biol. Chem. 1974, 249, 7130–7139. [Google Scholar] [CrossRef] [PubMed]
  75. Rotruck, J.T.; Pope, A.L.; Ganther, H.E.; Swanson, A.B.; Hafeman, D.G.; Hoekstra, W.G. Selenium: Biochemical Role as a Component of Glutathione Peroxidase. Science 1973, 179, 588–590. [Google Scholar] [CrossRef] [PubMed]
  76. Owumi, S.E.; Nwozo, S.O.; Effiong, M.E.; Najophe, E.S. Gallic acid and omega-3 fatty acids decrease inflammatory and oxidative stress in manganese-treated rats. Exp. Biol. Med. 2020, 245, 835–844. [Google Scholar] [CrossRef]
  77. Jollow, D.; Mitchell, J.; Zampaglione, N.; Gillette, J. Bromobenzene-Induced Liver Necrosis. Protective Role of Glutathione and Evidence for 3,4-Bromobenzene Oxide as the Hepatotoxic Metabolite. Pharmacology 1974, 11, 151–169. [Google Scholar] [CrossRef]
  78. Ellman, G.L. Tissue sulfhydryl groups. Arch Biochem. Biophys. 1959, 82, 70–77. [Google Scholar] [CrossRef] [PubMed]
  79. Bergmeyer, H.I.; Gawehn, K.; Grassl, M. Methods of Enzymatic Analysis, 2nd ed.; Academic Press Inc.: New York, NY, USA, 1974; Volume 1. [Google Scholar]
  80. Ohkawa, H.O.N.; Yagi, K. Assay for lipid peroxidation in animal tissues by Thiobarbituric acid reaction. Anal. Biochem. 1979, 95, 351–358. [Google Scholar] [CrossRef]
  81. Owumi, S.E.; Dim, U.J. Manganese suppresses oxidative stress, inflammation and caspase-3 activation in rats exposed to chlorpyrifos. Toxicol. Rep. 2019, 6, 202–209. [Google Scholar] [CrossRef] [PubMed]
  82. Green, L.C.; Wagner, D.A.; Glogowski, J.; Skipper, P.L.; Wishnok, J.S.; Tannenbaum, S.R. Analysis of nitrate, nitrite, and [15N] nitrate in biological fluids. Anal. Biochem. 1982, 126, 131–138. [Google Scholar] [CrossRef]
  83. Granell, S.; Gironella, M.; Bulbena, O.; Panés, J.; Mauri, M.; Sabater, L.; Aparisi, L.; Gelpí, E.; Closa, D. Heparin mobilizes xanthine oxidase and induces lung inflammation in acute pancreatitis. Crit. Care Med. 2003, 31, 525–530. [Google Scholar] [CrossRef]
  84. Owumi, S.E.; Adedara, I.A.; Akomolafe, A.P.; Farombi, E.O.; Oyelere, A.K. Gallic acid enhances reproductive function by modulating oxido-inflammatory and apoptosis mediators in rats exposed to aflatoxin-B1. Exp. Biol. Med. 2020, 245, 1016–1028. [Google Scholar] [CrossRef]
  85. Owumi, S.E.; Nwozo, S.O.; Arunsi, U.O.; Oyelere, A.K.; Odunola, O.A. Co-administration of Luteolin mitigated toxicity in rats’ lungs associated with doxorubicin treatment. Toxicol. Appl. Pharmacol. 2020, 411, 115380. [Google Scholar] [CrossRef] [PubMed]
  86. Bancroft, J.D.; Gamble, M. Theory and Practise of Histological Techniques, 6th ed.; Churchill Livingstone Elsevier: Philadelphia, PA, USA, 2008; pp. 83–134. [Google Scholar]
Figure 1. Metabolism of AFB1. Following chronic exposure to AFB1, AFB1 is rapidly absorbed into the enterocytes by passive diffusion and is absorbed into the liver for metabolism by arrays of CYP isoforms. Specifically, NADPH-dependent reductase converts AFB1 into aflatoxicol (AFL), CYP3A4 and CYP1A2 convert AFB1 into aflatoxin Q1 (AFQ1), CYP1A1 and CYP1A2 convert AFB1 into aflatoxin M1 (AFM1), or aflatoxin P1 (AFP1) through an O-demethylation reaction. These intermediates are clinically irrelevant as they are not heavily implicated in mutagenicity, carcinogenicity, and teratogenicity. The hepatic expression of CYP1A1, CYP1A2, CYP2E6, CPY3A4, and CYP3A5 is associated with AFBO formation, a clinically relevant intermediate, implicated in AFB1 toxicity and carcinogenicity. The mechanisms of AFBO toxicity are through the formation of protein adducts, DNA adducts, and lipid peroxidation. Specifically, epoxide hydrolase at PH 7.4 hydrolyses AFBO to AFB1 8,9-dihydrodiol, which can form a Schiff’s base with primary amino groups in lysine residues, forming a protein adduct with lysine. This adduct is known to inhibit protein synthesis. In addition, AFBO binds to the guanine of DNA and forms a DNA adduct known as 8,9-dihydro-8-(N7-guanyl)-9-hydroxy-AFB1, leading to double-strand break, point mutation, activation of pro-oncogenes, and suppression of tumour suppressor genes. There is a safe pathway (blue arrow) for degrading AFBO, mediated by GST, an enzyme that mediates the conjugation of AFBO and GSH to form the AFB1-S-G complex. MRP binds to this complex and removes them from the hepatocytes for excretion in the bile and urine. Created by ChemDraw.
Molecules 28 03013 g001
Figure 2. Characterisation of the key components in SBE-HP using TLC and LC-MS analyses. (A) TLC analysis on a normal phase silica plate, eluted with CH2Cl2/MeOH 12:1, revealed that SBE-HP separated into three clusters with RFs of 0.27, 0.83, and approx. 1. (B) LC-MS traces of key compounds in SBE-HP. Negative ion mode was presented for clarity.
Molecules 28 03013 g002
Figure 3. Experimental protocol of AFB1 and API-rich hydrophobic fraction of S. bicolor extracts 28 consecutive days. (A) In vivo screening of the hepatoprotective effect of SBE-HP on AFB1-challenged adult male Wistar Albino rats for 28 consecutive days, (B) effect of SBE-HP on the mean body weight change of AFB1-treated treated, and (C) Kaplan-Meier curve of rats treated with SBE-HP and AFB1. Created by https://app.biorender.com/ (accessed on 8 July 2022).
Molecules 28 03013 g003
Figure 4. Effect of SBE-HP on the liver and kidney function of rats treated with AFB1 for 28 d. Experimental doses: AFB1 at 50 μg/kg; SBE-HP-D1 at 5 mg/kg; SBE-HP-D2 at 10 mg/kg. Values are expressed as mean ± SD for six rats per treatment cohort. Connecting lines indicate groups compared to one another. The significance level was set at (p < 0.05); p < 0.05 suggests the level of significance; p > 0.05: not significant. AFB1: Aflatoxin B1; D1: lower dose; D2: higher quantity; ALT: Alanine aminotransferase; AST: aspartate aminotransferase, ALP: Alkaline phosphatase; GGT: gamma-glutamyl transferase.
Molecules 28 03013 g004
Figure 5. Effect of SBE-HP on the tissue concentrations of CAT, SOD, and GPx in the liver and kidney of rats treated with AFB1 for 28 d. AFB1 at 50μg/kg; SBE-HP-D1 at 5 mg/kg; SBE-HP-D2 at 10 mg/kg. Values are expressed as mean ± SD for six rats per treatment cohort. Connecting lines indicate groups compared to one another. The significance level was set at (p < 0.05); p < 0.05 indicates the level of significance; p > 0.05: not significant. AFB1: Aflatoxin B1; D1: lower dose; D2: higher dose; SOD: Superoxide dismutase; CAT: Catalase; GPx: Glutathione peroxidase.
Molecules 28 03013 g005
Figure 6. Effect of SBE-HP on the tissue concentrations of GST, GSH, and TSH in the liver and kidney of rats treated with AFB1 for 28 d. AFB1 at 50 μg/kg; SBE-HP-D1 at 5 mg/kg; SBE-HP-D2 at 10 mg/kg. Values are expressed as mean ± SD for six rats per treatment cohort. Connecting lines indicate groups compared to one another. The significance level was set at (p < 0.05); p < 0.05 suggests the level of significance; p > 0.05: not significant. AFB1: Aflatoxin B1; D1: lower dose; D2: higher dose; GST: Glutathione S-transferase; GSH: reduced glutathione; TSH: Total sulfhydryl group.
Molecules 28 03013 g006
Figure 7. Effect of SBE-HP on the concentrations of LPO and RONS in the liver and kidney of rats treated with AFB1 for 28 d. AFB1 at 50 μg/kg; SBE-HP-D1 at 5 mg/kg; SBE-HP-D2 at 10 mg/kg. Values are expressed as mean ± SD for six rats per treatment cohort. Connecting lines indicate groups compared to one another. The significance level was set at (p < 0.05); p < 0.05 suggests the level of significance; p > 0.05: not significant. AFB1: Aflatoxin B1; D1: lower dose; D2: higher dose; LPO: Lipid peroxidation; RONS: Reactive oxygen and nitrogen species.
Molecules 28 03013 g007
Figure 8. Effect of SBE-HP on the tissue concentrations of XO, MPO, and NO in the liver and kidney of rats treated with AFB1 for 28 d. AFB1 at 50 μg/kg; SBE-HP-D1 at 5 mg/kg; SBE-HP-D2 at 10 mg/kg. Values are expressed as mean ± SD for six rats per treatment cohort. Connecting lines indicate groups compared to one another. The significance level was set at (p < 0.05); p < 0.05 indicates the level of significance; p > 0.05: not significant. AFB1: Aflatoxin B1; D1: lower dose; D2: higher dose; XO: Xanthine oxidase; MPO: Myeloperoxidase; NO: Nitric oxide.
Molecules 28 03013 g008
Figure 9. Effect of SBE-HP on tissue concentrations of IL-1β and IL-10 in the liver and kidney of rats treated with AFB1 for 28 d. AFB1 at 50 μg/kg; SBE-HP-D1 at 5 mg/kg; SBE-HP-D2 at 10 mg/kg. Values are expressed as mean ± SD for six rats per treatment cohort. Connecting lines indicate groups compared to one another. The significance level was set at (p < 0.05); p < 0.05 suggests the level of significance; p > 0.05: not significant. AFB1: Aflatoxin B1; D1: lower dose; D2: higher dose; IL-1β: Interleukin-1beta; IL-10: Interleukin-10.
Molecules 28 03013 g009
Figure 10. Effect of SBE-HP on tissue concentrations of caspase-9 and caspase-3 in the liver and kidney of rats treated with AFB1 for 28 d. AFB1 at 50 μg/kg; SBE-HP-D1 at 5 mg/kg; SBE-HP-D2 at 10 mg/kg. Values are expressed as mean ± SD for six rats per treatment cohort. Connecting lines indicate groups compared to one another. The significance level was set at (p < 0.05); p < 0.05 suggests the level of significance; p > 0.05: not significant. AFB1: Aflatoxin B1; D1: lower dose; D2: higher dose.
Molecules 28 03013 g010
Figure 11. (a) Control Plates of the kidney show a focal area of mild congestion and apoptotic bodies with typical tissue architecture. AFB1 alone plates show disseminated glomerular messangialisation (thin arrow) and the extent of infiltration of the cortex by inflammatory cells (bold arrowhead). SBE-HP alone plate (not shown) tissues appear normal and relatively like those from control tissue sections. AFB1 with SBE-HP-D1 and SBE-HP-D2 plates dose-dependently improved histo-architecture of the kidney with the mild presence of inflammatory cells. (b) AFB1 alone shows areas of focal congestion (bold arrows), infiltration of zone 2 by inflammatory cells, mild hydropic/ballooning degeneration of the hepatocytes, and moderate microvesicular steatosis (tiny arrows). SBE-HP alone (plate not shown) tissue morphologies are similar to the control plate. AFB1 with SBE-HP-D1 and SBE-HP-D2 plates improved hepatic cytoarchitecture with mild focal congestion and infiltration of zone 2 by inflammatory cells. H and E-stained sections; magnification at ×400.
Molecules 28 03013 g011
Figure 12. Proposed mechanism of SBE-HP ameliorative effect on AFB1-mediated toxicities in the liver and kidney of an experimental rat model. SBE-HP prevented AFB1-induced oxidative and nitrosative stress and inflammation by reducing the activity of CYP1A2, NF-kB-mediated generation of pro-inflammatory cytokines, and IL-1β. SBE-HP also reduced apoptosis by altering the Bcl-2/Bax ratio favouring caspase 9 and caspase 3 activity. Created by https://app.biorender.com/ (accessed on 9 July 2022).
Molecules 28 03013 g012
Disclaimer/Publisher’s Note: The statements, opinions and data contained in all publications are solely those of the individual author(s) and contributor(s) and not of MDPI and/or the editor(s). MDPI and/or the editor(s) disclaim responsibility for any injury to people or property resulting from any ideas, methods, instructions or products referred to in the content.

