Article

Controllable Synthesis of N2-Intercalated WO3 Nanorod Photoanode Harvesting a Wide Range of Visible Light for Photoelectrochemical Water Oxidation

1
School of Material Science and Engineering, North Minzu University, Yinchuan 750021, China
2
International Scientific & Technological Cooperation Base of Industrial Waste Recycling and Advanced Materials, Yinchuan 750021, China
3
Chemical Science and Engineering College, North Minzu University, Yinchuan 750021, China
*
Authors to whom correspondence should be addressed.
Molecules 2023, 28(7), 2987; https://doi.org/10.3390/molecules28072987
Submission received: 6 March 2023 / Revised: 22 March 2023 / Accepted: 24 March 2023 / Published: 27 March 2023
(This article belongs to the Special Issue Development of Electrochemical Energy Storage Materials)

Abstract

:
A highly efficient visible-light-driven photoanode, N2-intercalated tungsten trioxide (WO3) nanorod, has been controllably synthesized by using the dual role of hydrazine (N2H4), which functioned simultaneously as a structure directing agent and as a nitrogen source for N2 intercalation. The SEM results indicated that the controllable formation of WO3 nanorod by changing the amount of N2H4. The β values of lattice parameters of the monoclinic phase and the lattice volume changed significantly with the nW: nN2H4 ratio. This is consistent with the addition of N2H4 dependence of the N content, clarifying the intercalation of N2 in the WO3 lattice. The UV-visible diffuse reflectance spectra (DRS) of N2-intercalated exhibited a significant redshift in the absorption edge with new shoulders appearing at 470–600 nm, which became more intense as the nW:nN2H4 ratio increased from 1:1.2 and then decreased up to 1:5 through the maximum at 1:2.5. This addition of N2H4 dependence is consistent with the case of the N contents. This suggests that N2 intercalating into the WO3 lattice is responsible for the considerable red shift in the absorption edge, with a new shoulder appearing at 470−600 nm owing to formation of an intra-bandgap above the VB edges and a dopant energy level below the CB of WO3. The N2 intercalated WO3 photoanode generated a photoanodic current under visible light irradiation below 530 nm due to the photoelectrochemical (PEC) water oxidation, compared with pure WO3 doing so below 470 nm. The high incident photon-to-current conversion efficiency (IPCE) of the WO3-2.5 photoanode is due to efficient electron transport through the WO3 nanorod film.

1. Introduction

In order to solve both the energy crisis and environmental problems, it is urgent to explore a sustainable, and environmental-friendly energy resources to replace the non-renewable fossil energy [1,2,3]. Hydrogen, as an energy carrier of solar energy, has the advantages of high energy density, storage, and pollution-free. So, it can be used as an ideal new energy to replace the traditional energy. To date, among the different strategies for producing hydrogen, PEC water splitting is considered to be a promising process in which solar energy can be directly convert into hydrogen and oxygen using a semiconductor [4]. However, the overall efficiency of PEC water splitting is still relatively low due to the high kinetic overpotentials for the water oxidation reaction. Therefore, the key to improving the efficiency of PEC water splitting is to develop a robust semiconductor photoanode for visible-light-driven water oxidation. Since TiO2 was first reported as photoanode by Fujishima and Honda in 1972 [5], numerous semiconductors (WO3, Fe2O3, Ta3N5, TaON, etc.) have been employed for photoanode materials [6,7,8,9,10,11,12,13].
WO3 was investigated as a visible-light-driven photoanode material for PEC water oxidation by Hodes in1976 [14]. Since then, considerable efforts [15,16,17,18,19,20,21] have been devoted to investigating the PEC performances of WO3 due to the following intrinsic properties: (1) a relatively narrow band gap energy (2.5 eV–2.7 eV), (2) a positive valence band edge position for water oxidation, (3) high stability in acidic condition, (4) a suitable hole diffusion length (~150 nm) for superior electron transport. However, the solar spectrum utilization of WO3 photoanode is still too low to be used for actual application due to its narrow visible light response range (λ < 460 nm). To enhance the PEC performance, many tactics have been employed to develop efficient WO3 photoanode for water oxidation, including forming heterojunction, doping, loading co-catalysts, nanostructuring, tuning vacancies and so on [1,4,22,23,24,25,26,27,28,29,30]. Nanostructured WO3 photoanodes have attracted more and more research attention to improve their PEC performance, because they offer superior performances than that of unspecified ones because of larger electrode/electrolyte interface area, efficient light absorption, and other structural benefits of nanostructures. So far, various nanostructured WO3 photoanodes have been synthesized, such as nanosheet [31], nanoplatelets [32], nanoparticles [33,34], nanoflakes [35,36], nanotubes [37], nanobelts [38], nanowire [39,40], and nanorods [41,42], to improve performances in PEC water oxidation. Although the PEC performance of WO3 photoanode for water oxidation can be enhanced by nanostructure control, the light absorption at long wavelength is difficult to improve. Nowadays, many studies are focusing on extension of light absorption to longer wavelength (λ > 480 nm) by band gap engineering of WO3, because efficient light absorption at longer wavelength is significant to improve the efficiency of a photoanode for solar energy conversion. To date, doping WO3 with transition/other metals [43,44,45,46], nonmetallic elements [25,26,47], or selective molecule [27] to improve its the light absorption at longer wavelengths have been regarded as the most common strategies for band gap engineering.
We previously reported an in situ N2-intercalated WO3 nanorod photoanode, in which N2H4 was used as a dual-functional structure-directing agent for nanorod as well as a nitrogen source for in situ N2 intercalation [17]. Not only the light absorption at longer wavelengths, but also the PEC performance for water oxidation was dramatically improved. Therefore, a difficult issue of compatibility between nanostructure control and strategy for band gap engineering of WO3 was resolved. However, we only discussed the calcination temperature dependence on the physiochemical properties. The PEC performance, the effect of addition of N2H4 on the content of N2 into the WO3 lattice, as well as the morphology of the N2-intercalated WO3 and the PEC performance for water oxidation have not been investigated yet. Thus, it is necessary to reveal the effect of addition of N2H4 on the morphology and band gap of N2-intercalated WO3. Herein, we first report the controllable synthesis of N2-intercalated WO3 with different morphologies and band gap using N2H4 as a dual-functional surfactant template. Especially, there is an extremely significant mutually dependent relation between the addition of N2H4 and the PEC performance of N2-intercalated WO3 for water oxidation.

2. Results and Discussion

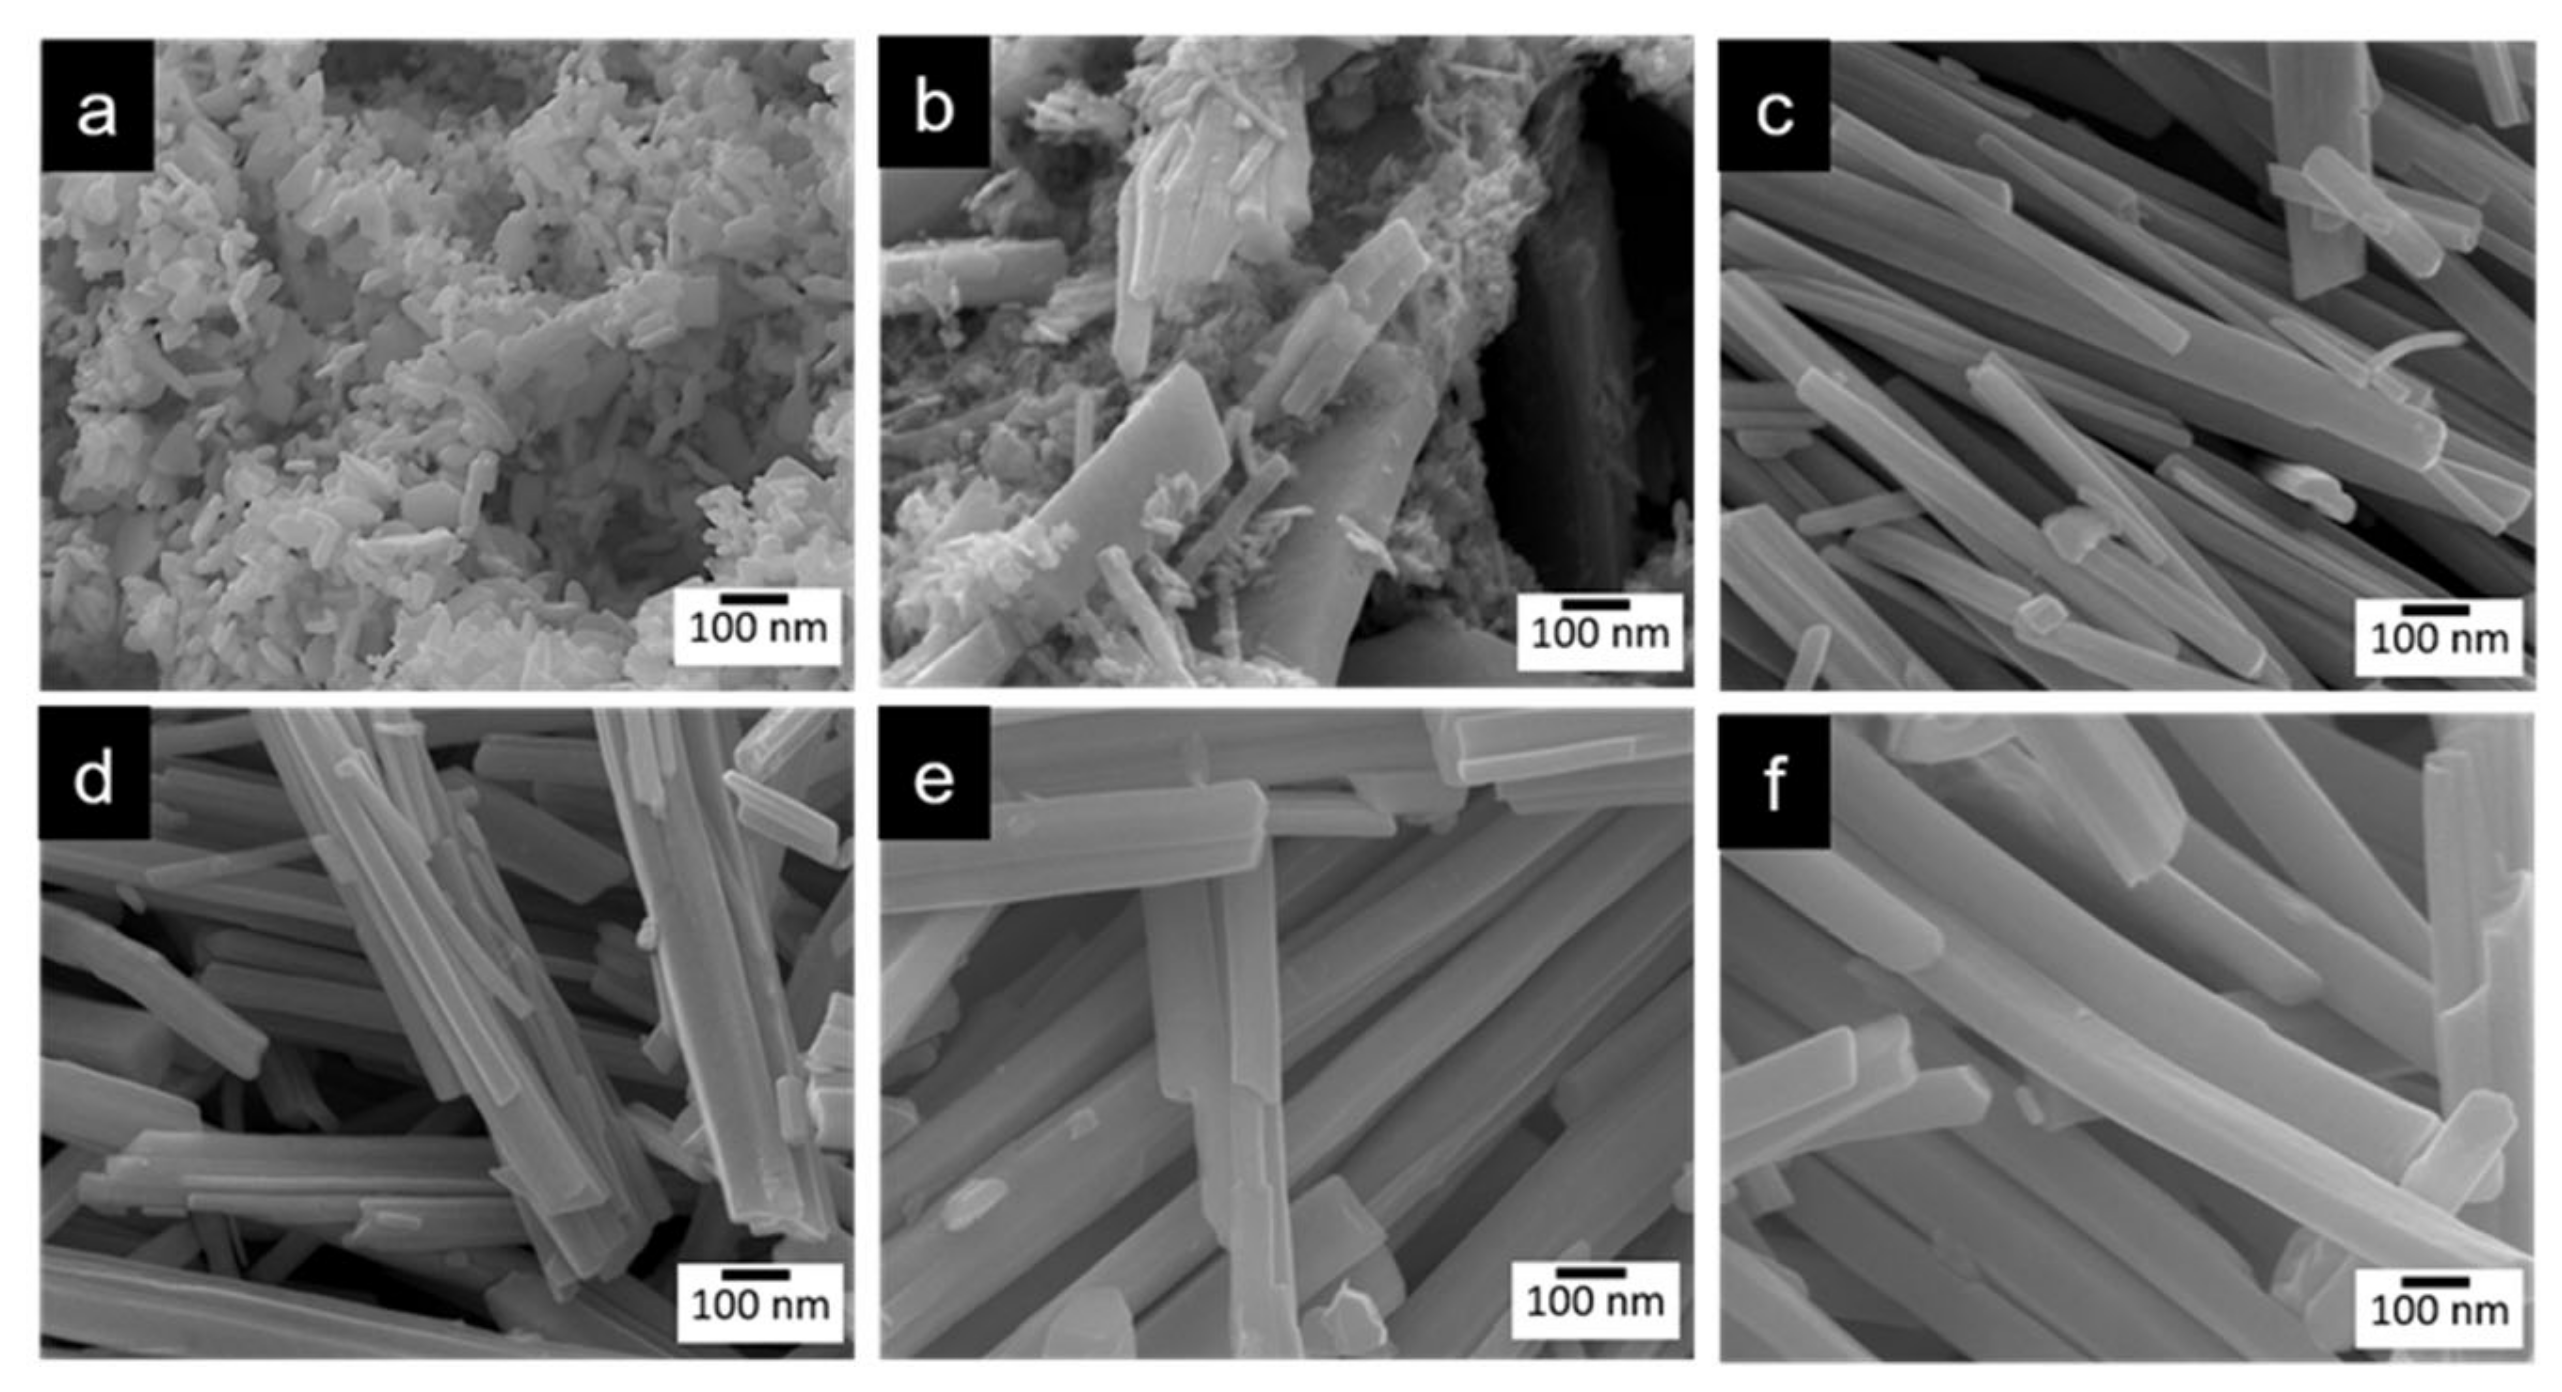
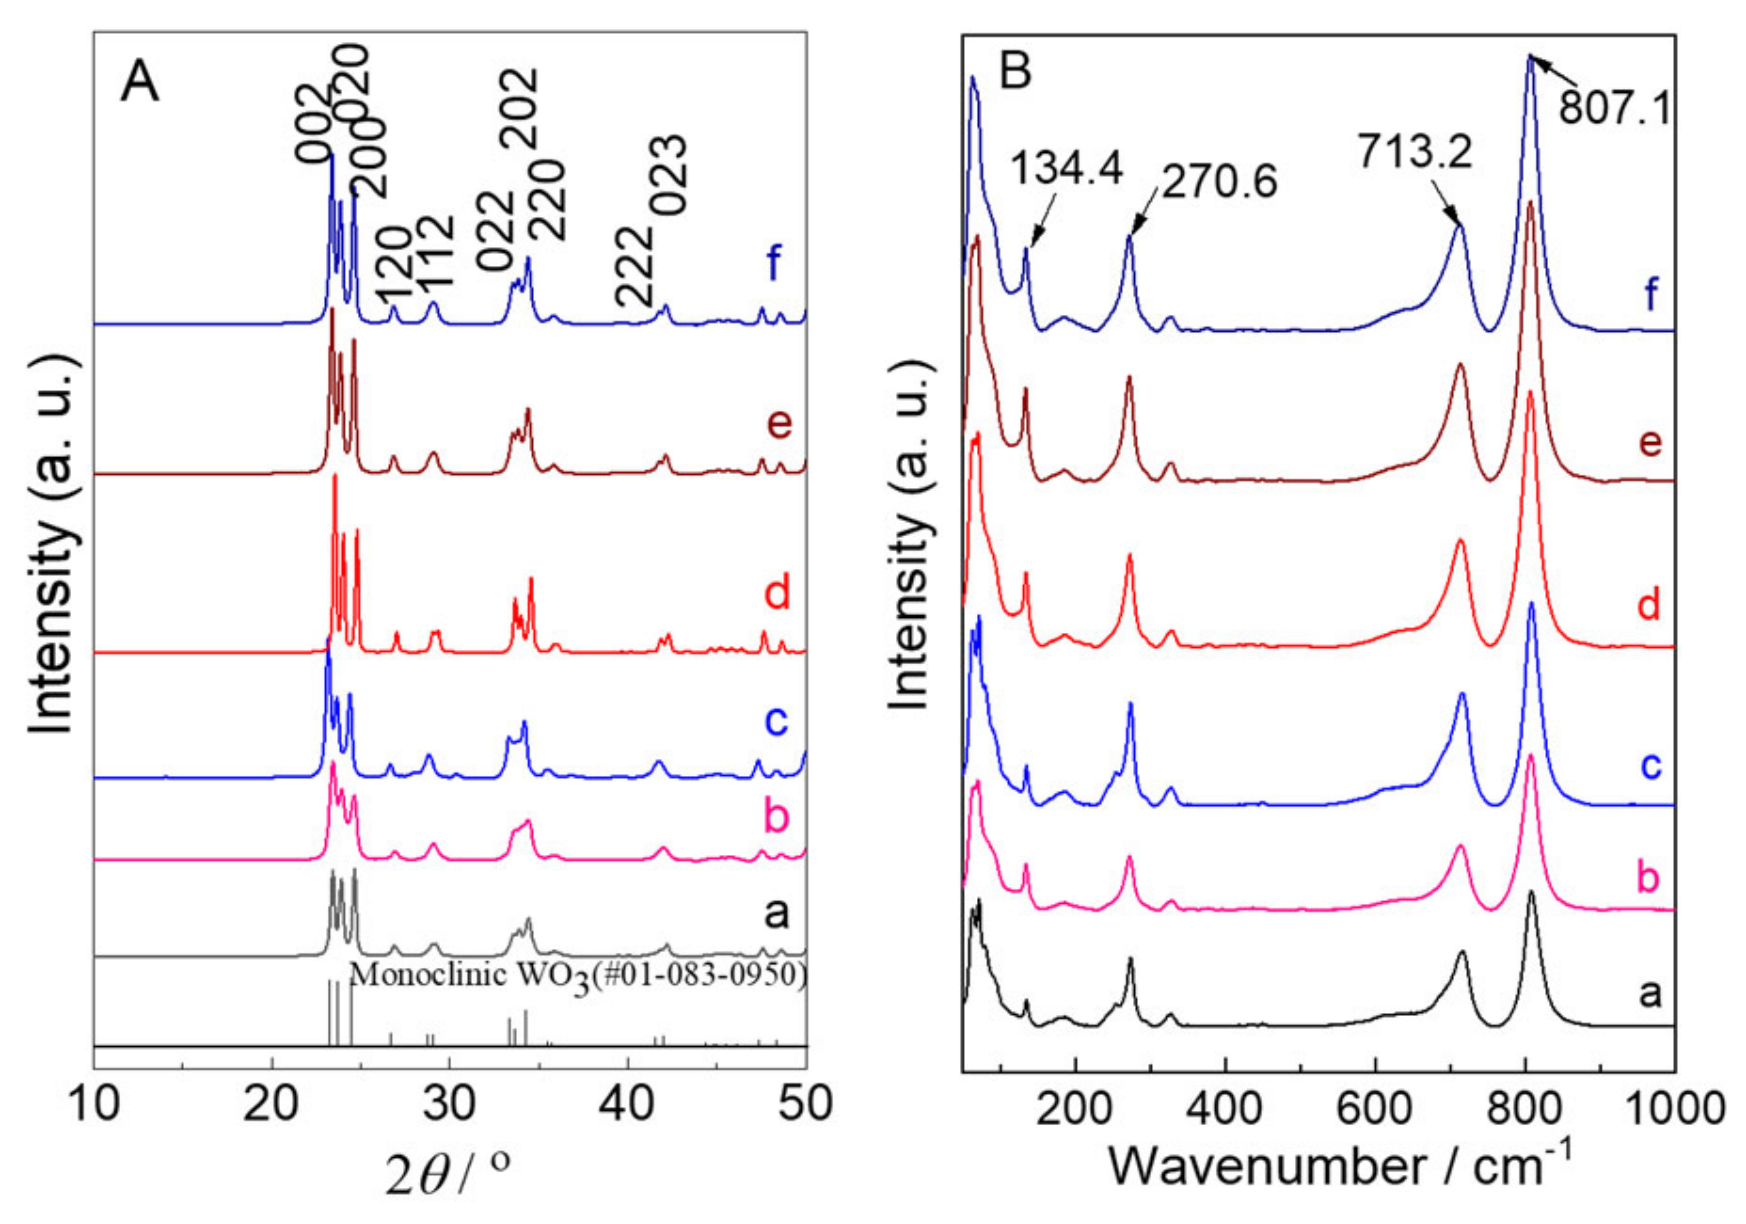
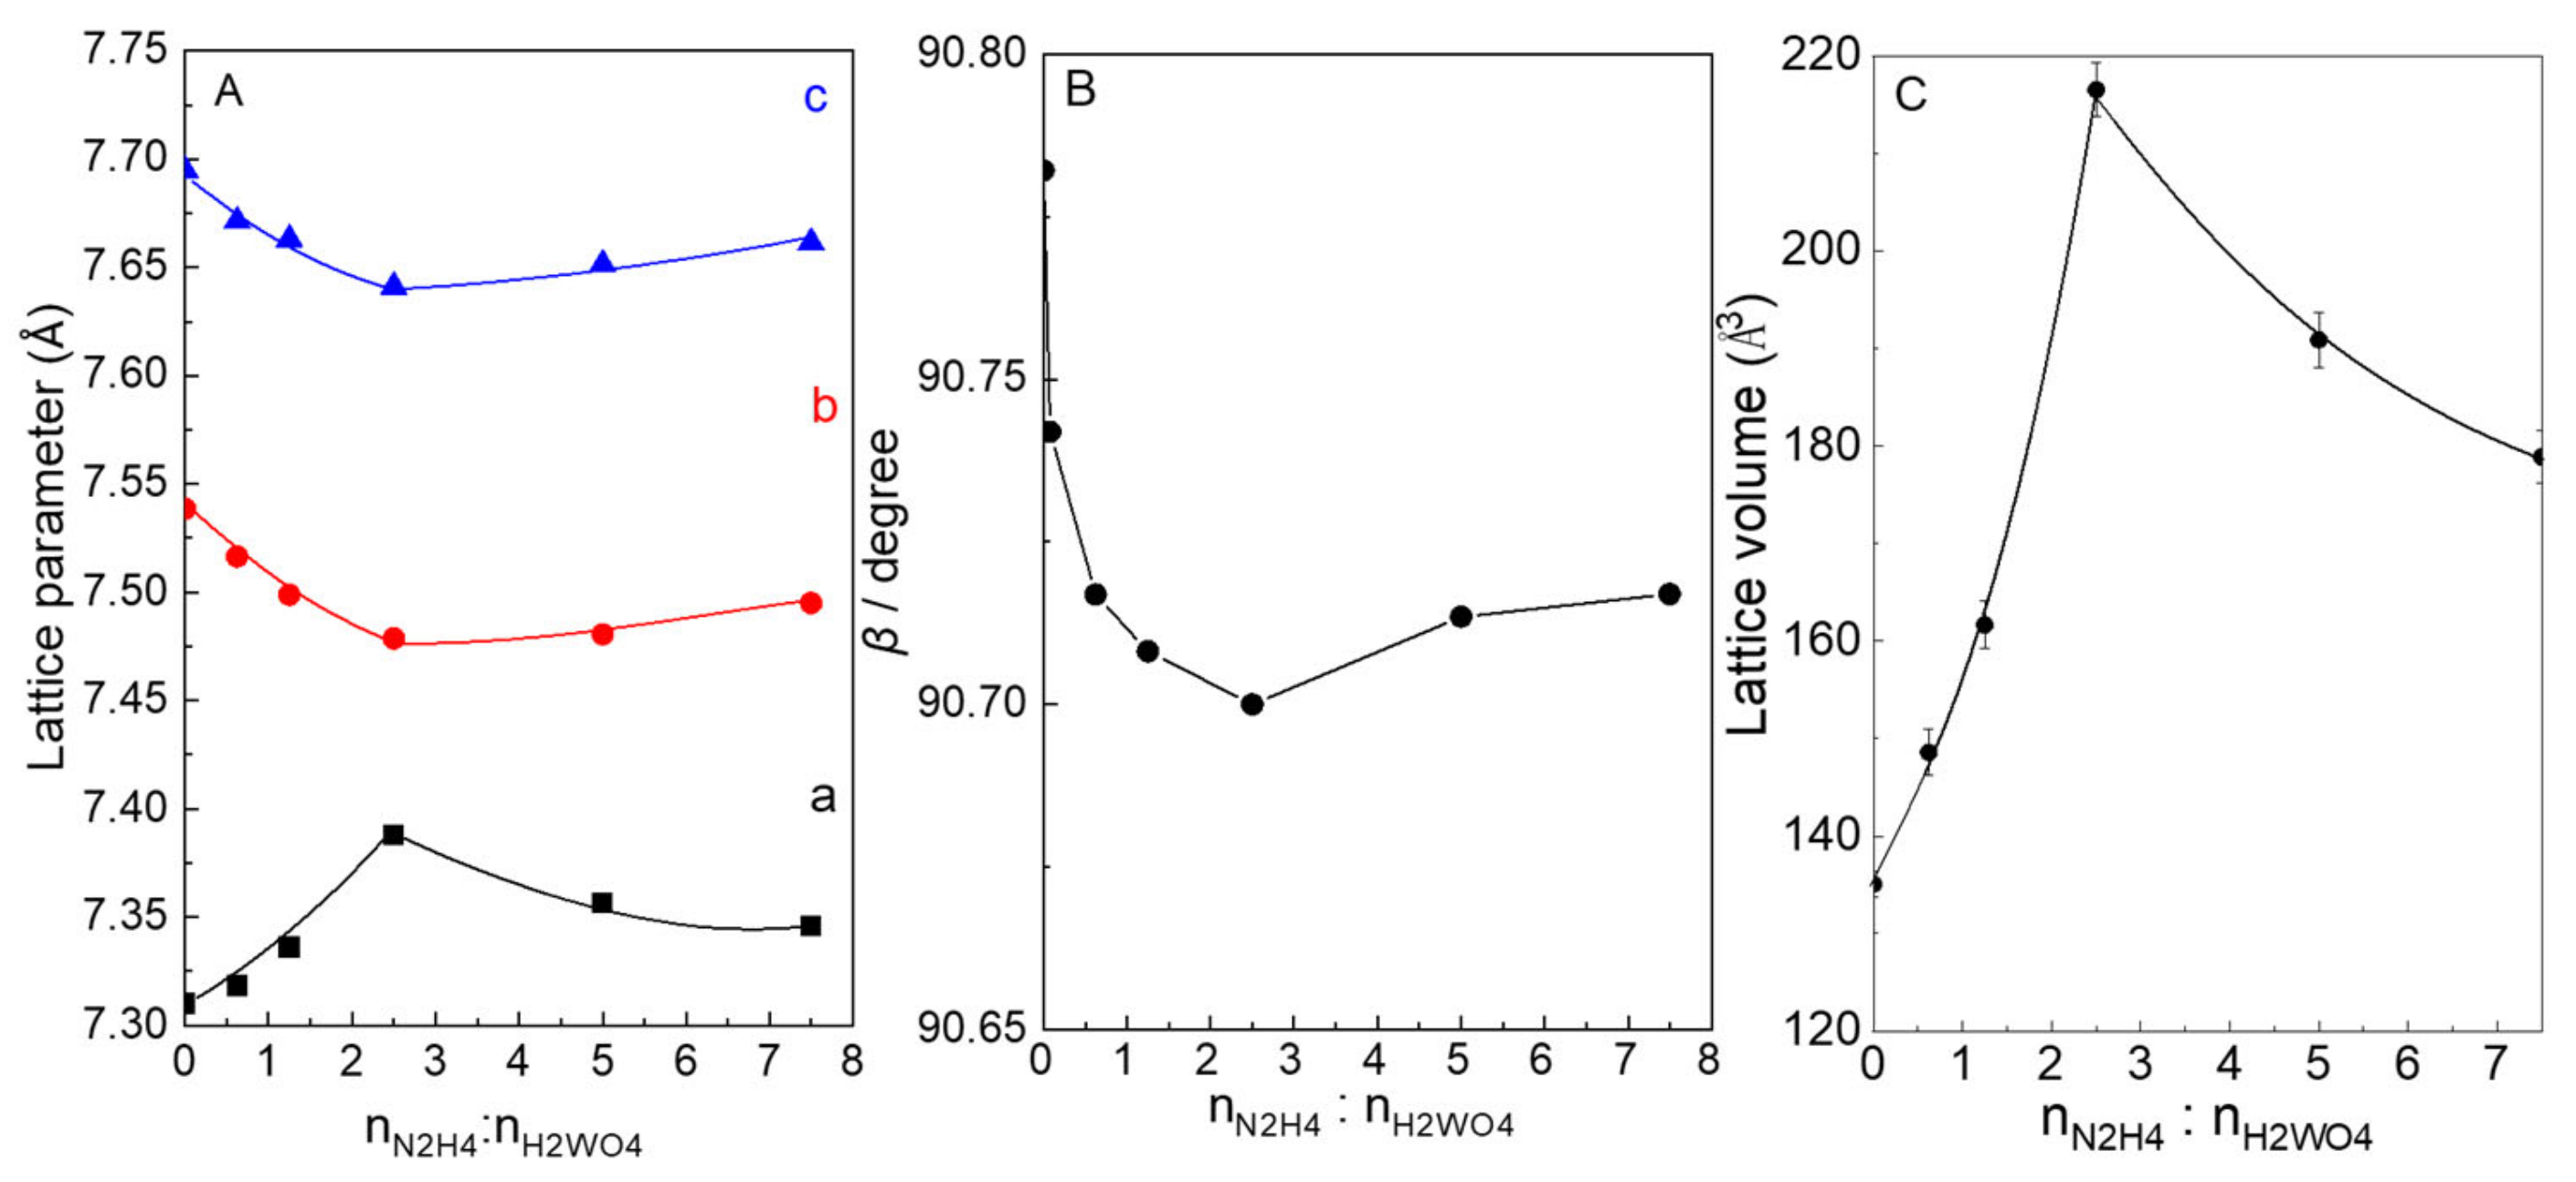
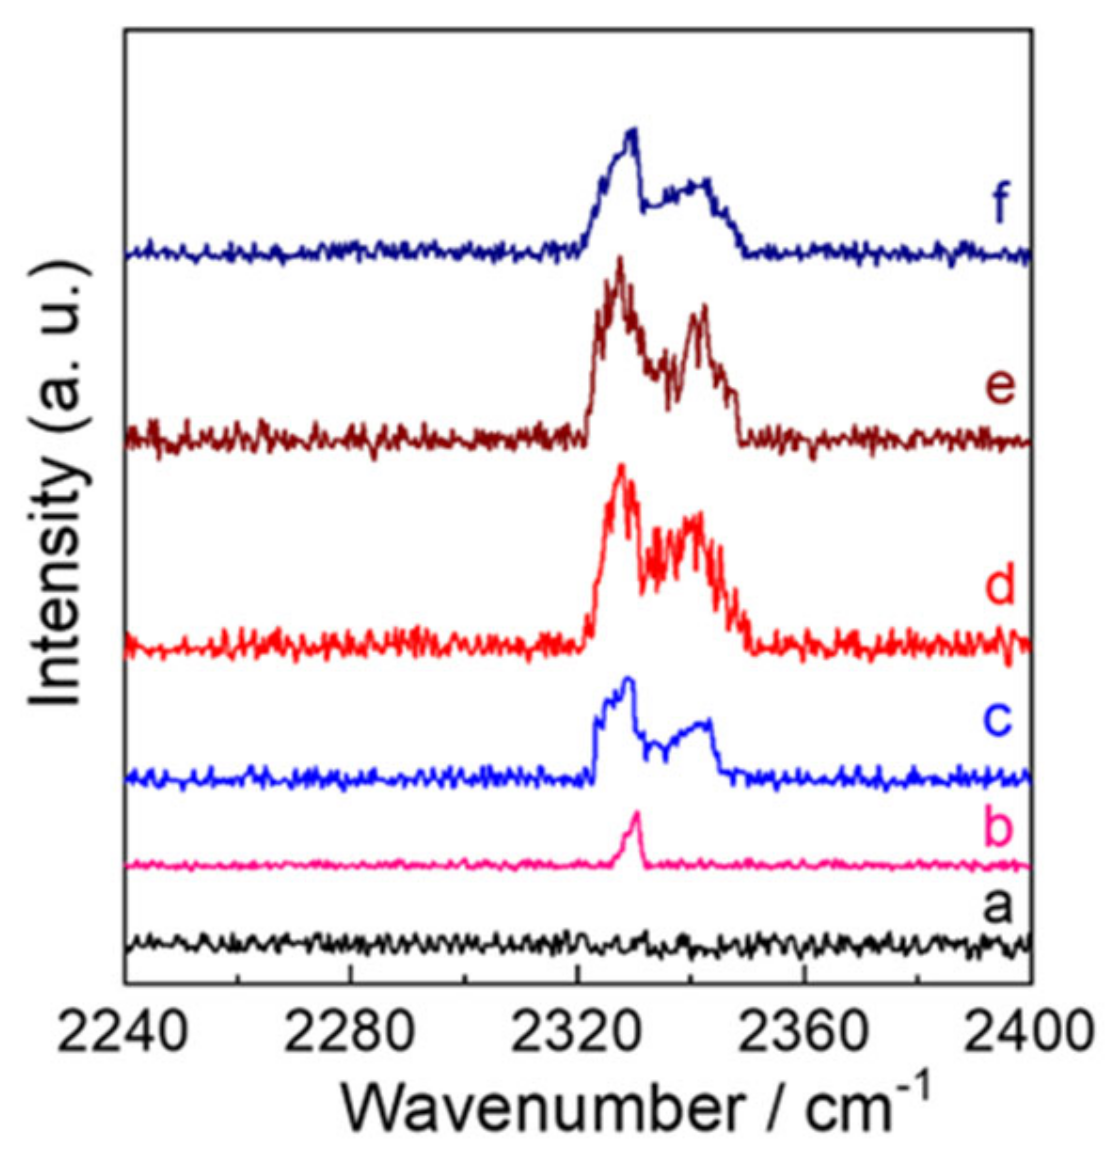
2.1. Characterization Structure of N2-Intercalated WO3 Samples

The SEM images showed different morphologies depending on the addition of N2H4. WO3-0 is composed of small irregular nanoblocks with diameters of 10−50 nm (Figure 1a). Figure 1b−f shows the images of N2-intercalated WO3 prepared using different addition of N2H4. It can be clearly found that the mixed morphologies of nanorods in large scale and small nanoblocks start to be observed from nW:nN2H4 of 1:0.62 (Figure 1b). There are not so many differences in the length and width of the nanorods which are obtained from nW:nN2H4 ratio of 1:1.25 to 1:2.5. However, the length and width increased as the nW:nN2H4 ratio increased from 1:5 to 1:7.5.
The specific surface area of WO3−2.5 was 2.2 times higher than that of WO3-0 (9.6 m2g−1). The surface area of N2-intercalated WO3 samples decreased to 20.4–17.3 m2g−1 with increasing nW:nN2H4 ratio from 1:5 to 1:7.5 due to the agglomeration of nanorod surfaces.
The EDS data of N2-intercalated WO3 indicate the existence of the N element, which derived from N2H4 in precursors, because none of the N element was detected in WO3-0; see Figure 2.
The W/N atomic ratio was calculated from the EDS data to reveal the dependence of the nW:nN2H4 ratio on it. The results indicate that the W/N atomic ratio increased from 1:0.004 to 1:0.096 with increasing nW:nN2H4 ratio from 1:0.62 to 1:2.5 and thereafter decreased over the 1:2.5 (Table 1).
To instigate the effect of the addition of N2H4 on the crystal structures, the N2-intercalated WO3 samples are ascertained by XRD (Figure 3A) and Raman (Figure 3B). As shown in Figure 2A, it can be clearly observed that all of samples exhibited the monoclinic WO3 crystals (PDF # 01-083-0950). Additionally, the crystalline structure of N2-intercalated WO3 samples can be significantly affected by the addition of N2H4. Especially, the intensity of the (002) peak is higher than those of the other neighbor peaks of (020) and (200) for N2-intercalated WO3 samples, which is different from that of WO3-0 sample. This could suggest anisotropic progress of crystallization involving the predominant crystallization of (002) from nW:nN2H4 ratio of 1:0.32 to 1:2.5 followed by progressive crystallization of (020) and (200) with the ratio increased to 1:7.5, as depicted by calculation of the crystallite diameter of (002). The larger crystallite diameter of N2-intercalated WO3 samples (27–31 nm) than that of WO3-0 (17 nm) can be clearly observed, as shown in Table 1. The PEC performance of WO3 photoanodes for water splitting was extremely enhanced with highly uniform alignment along the (002) facet [48]. In the Raman spectra, the WO3 samples exhibited the characteristic peaks of the monoclinic WO3 at 134.4 cm−1 (lattice vibration), 270.6 cm−1 (δ (O-W-O) deformation vibration), 713.2cm−1, and 807.1 cm−1 (δ (O-W-O) stretching vibration) in the range of Raman shift from 100~1000 cm−1. Raman analysis also showed the tendency of Raman peaks to sharpen as the nW:n(NH4)2S ratio increased, which is well consistent with the results of XRD analysis.
As shown in Figure 4, it could be seen that the lattice parameters a, b, c and β were remarkably influenced by the addition of N2H4 for the N2-intercalated WO3 samples (a = 7.3121(2)–7.3878 (3) Å, b = 7.4786(4)–7.5348 (2) Å, c = 7.6411 (2)–7.6948 (4) Å, β = 90.70(3)–90.78(2)). The values of parameters b, c, and β for all of samples decreased with the addition of N2H4 increase up to 1:2.5, and then increased at higher molar ratio of nW:nN2H4. However, the value of parameters an increased below 1:2.5 and then decreased with molar ratio of nW:nN2H4 increased. The lattice volumes of N2-intercalated WO3 samples were larger than that of WO3−0, and the largest lattice volume of 216.54(1) Å3 for WO3−2.5 was observed due to the insertion of highest contents for N2 into the lattice. Therefore, it can be confirmed that the N2 was intercalated into WO3 lattice by analyzing the change of lattice parameters and volume.
Raman spectra at high wavenumber (Figure 5) were investigated to clarify the configuration and existence of N2 into the WO3 lattice, which is responsible for the N content. No peak was observed for WO3-0, however, Raman spectra of N2-intercalated WO3 samples exhibited signals at 2327−2342 cm−1, which can be ascribed to the N≡N vibration of N2 in the WO3 lattice on the basis of N≡N vibration of gaseous N2 (2330 cm−1) and the N2-intercalated WO3 reported previously as well as relevant compounds [49,50,51,52]. Additionally, only one peak at 2330 cm−1 was observed for WO3−0.62. It can be attribute to the lower amount of N2 into the WO3−0.62 lattice, because such one peak was observed for N2-intercalted WO3 prepared by dodecylamine according to ours earlier report [30]. However, it is amazing to note that two peaks at 2328 cm−1 and 2342 cm−1 began to be observed from nW:nN2H4 of 1:1.2 as the content of N2 increased. This significant difference confirms that the addition of N2H4 affect not only the N content but also the configuration of N2 into the WO3 lattice. Further, The N2 intercalation can be also proved by our previously reported [17,30], the XPS spectrum in an W 4f region was deconvoluted by four bands at 37.0, 34.9, 32.9, 31.2 eV for N2 intercalated WO3 The bands at 37.0 and 34.9 eV in higher energy for N2 intercalated WO3 (37.1 and 34.9 eV for NH3-WO3) are assigned to 4f5/2 and W 4f7/2 of the WO3 lattice similarly to WO3−0. The bands at 32.9 and 31.2 eV in lower energy for N2 intercalated WO3 can be assigned to the binding energies of 4f5/2 and W 4f7/2 interacted with N2 intercalated. XPS data of WO3-N2H4, in which a peak at 396.9 eV assigned to the intercalated nitrogen bound with the tungsten center. This is obviously different from the band at 396 eV of N-doped metal oxides (WO3, TiO2, etc.) [53,54] and metal nitrides (TiN) [55]. Additionally, the nitrogen intercalation hardly causes the oxygen defects, which can be beneficial to improving the optical properties of WO3.

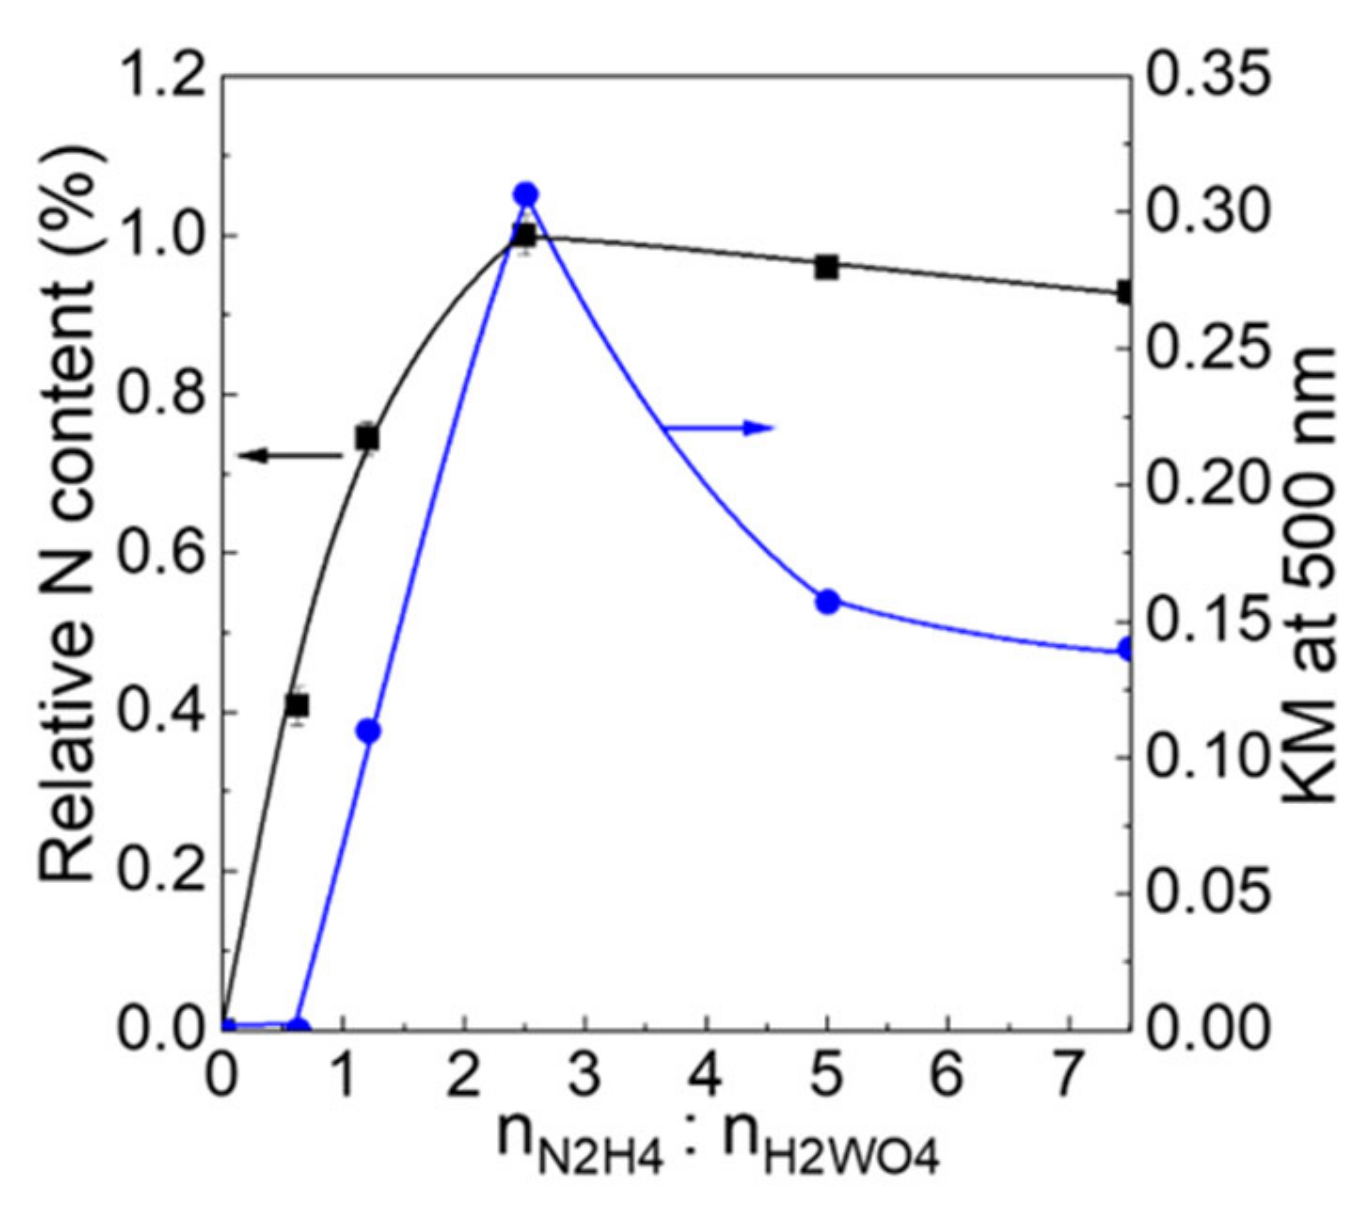
2.2. The Optical Properties of N2 Intercalated WO3

The optical properties of WO3 samples were investigated by UV-vis DRS (Figure 6A) and the corresponding Tauc plots (Figure 6B) of the WO3−0 (a) and N2 intercalated WO3 (b–f) samples with changes in the ratio of nH2WO4:nN2H4. Compared to the WO3−0 (469 nm), only a slight redshift of 11 nm in the absorption edge was observed for the WO3−0.62 (480 nm). However, a significant redshift can be seen in the absorption edge with new shoulders appeared in a longer wavelength region than WO3−0 with increased the ratio of nH2WO4:nN2H4. It is obvious that the absorption edges extended to the longer wavelength as the ratio of nH2WO4:nN2H4 was increased below 1:2.5, and then they decreased when further increased the addition of N2H4. Furthermore, the formation of the absorption shoulders exhibited the same trend as the formation of the peak at 2342 cm−1 in the Raman spectra, implying that the formation of this peak is beneficial to the generation of the absorption shoulders. According to the Tauc plots, the bandgap of WO3−0.62 (2.58 eV) was slightly reduced by 0.06 eV than WO3−0 (2.64 eV) due to the formation of a new intermediate N 2p orbital between the CB and the VB after intercalation of N2 into the WO3 lattice, as indicated by the earlier report [17,27,30]. As the ratio of nH2WO4:nN2H4 was increased from 1:1.2, the Tauc plots exhibited two different slopes due to the existence of the new shoulders, with the absorption energies derived from the slopes, as shown in Table 2.
Figure 7 illustrates the relation between the KM values at 500 nm (KM500). It was observed that the KM500 value is a measure of the increase/decrease of the shoulders at 470–600 nm. Compared with both WO3−0 and WO3-0.62, the KM500 increased from 0.11 to 0.31 with an increase in the ratio of nH2WO4:nN2H4 from 1:1.2 to 1:2.5, and thereafter, decreased from 1:2.5 to 0.13 at 1:7.5. The dependency of KM500 on the nH2WO4:nN2H4 ratios applies to the case of the N content, suggesting that the longer wavelength absorption due to the shoulders can be attributed to the intercalation of N2 into a WO3 lattice.
Mott–Schottky plots from alternating-current impedance measurements were taken to reveal the band structure of the N2 intercalated WO3 electrodes. As shown in Figure 8, typical behavior for n-type semiconductors was confirmed for all WO3 samples, because the reciprocal of the square of capacitance (C−2 [F−2 cm4]) linearly increased with the applied potentials beyond the flat band (EFB) potentials. The EFB and the donor carrier densities (ND [cm−3]) were provided from the x-intercept and the slopes of the straight line, respectively (Table 2). EFB value of the WO3-0 electrode was 0.38 V, which was closed to those of earlier-reported WO3 electrodes (0.36–0.41 V vs. Ag/AgCl) [32,33]. However, the EFB values of the N2 intercalated WO3 electrodes (0.23–0.36 V) were lower than that of WO3-0 electrode. The ND values of the N2 intercalated WO3 electrodes were higher than that for WO3-0 electrode. Especially, the highest ND value for WO3−2.5 (4.15 × 1019 cm−3) was calculated, which was 1.12, 1.09, 1.08, 1.03, and 1.06 times higher than those of WO3−0, WO3−0.62, WO3−1.2, WO3−5, and WO3−7.5 electrodes. The negative shift of the EFB potential and the increase of the ND are usually beneficial to the improvement of the PEC performance for water oxidation.
The band structures of the electrodes were estimated, and their energies are summarized in Table 2. As suggested by the previous report, for the N2 intercalated WO3, a new intermediate N 2p orbital could be formed between the CB and the VB of WO3 due to the intercalation of N2. The lower energies for the WO3−1.2, WO3−2.5, WO3−5, and WO3−7.5 were 2.17, 1.92, 2.01, and 2.08 eV, respectively, which can be attributed to excitation from the intermediate N 2p orbital to the CB of WO3. the different amount of N2 intercalated could be possible as an explanation of these difference in the lower energy values. The lower value for WO3−2.5 is caused by the high amount of N2 intercalated. The potentials of the intermediate bands (EIB) were calculated from the EFB and the excitation energies to be 2.51, 2.15, 2.31, and 2.41 V vs. Ag/AgCl for WO3−1.2, WO3−2.5, WO3−5, and WO3−7.5, respectively. The higher energies (2.58, 2.55, 2.45, 2.52, and 2.51 eV) for WO3−0.62, WO3−1.2, WO3−2.5, WO3−5, and WO3−7.5 can be ascribed to the main band gap excitation. The VB potentials (EVB) are calculated to be 2.94, 2.89, 2.68, 2.82, and 2.83 V vs. Ag/AgCl for WO3-0.62, WO3-1.2, WO3-2.5, WO3-5, and WO3-7.5, respectively.

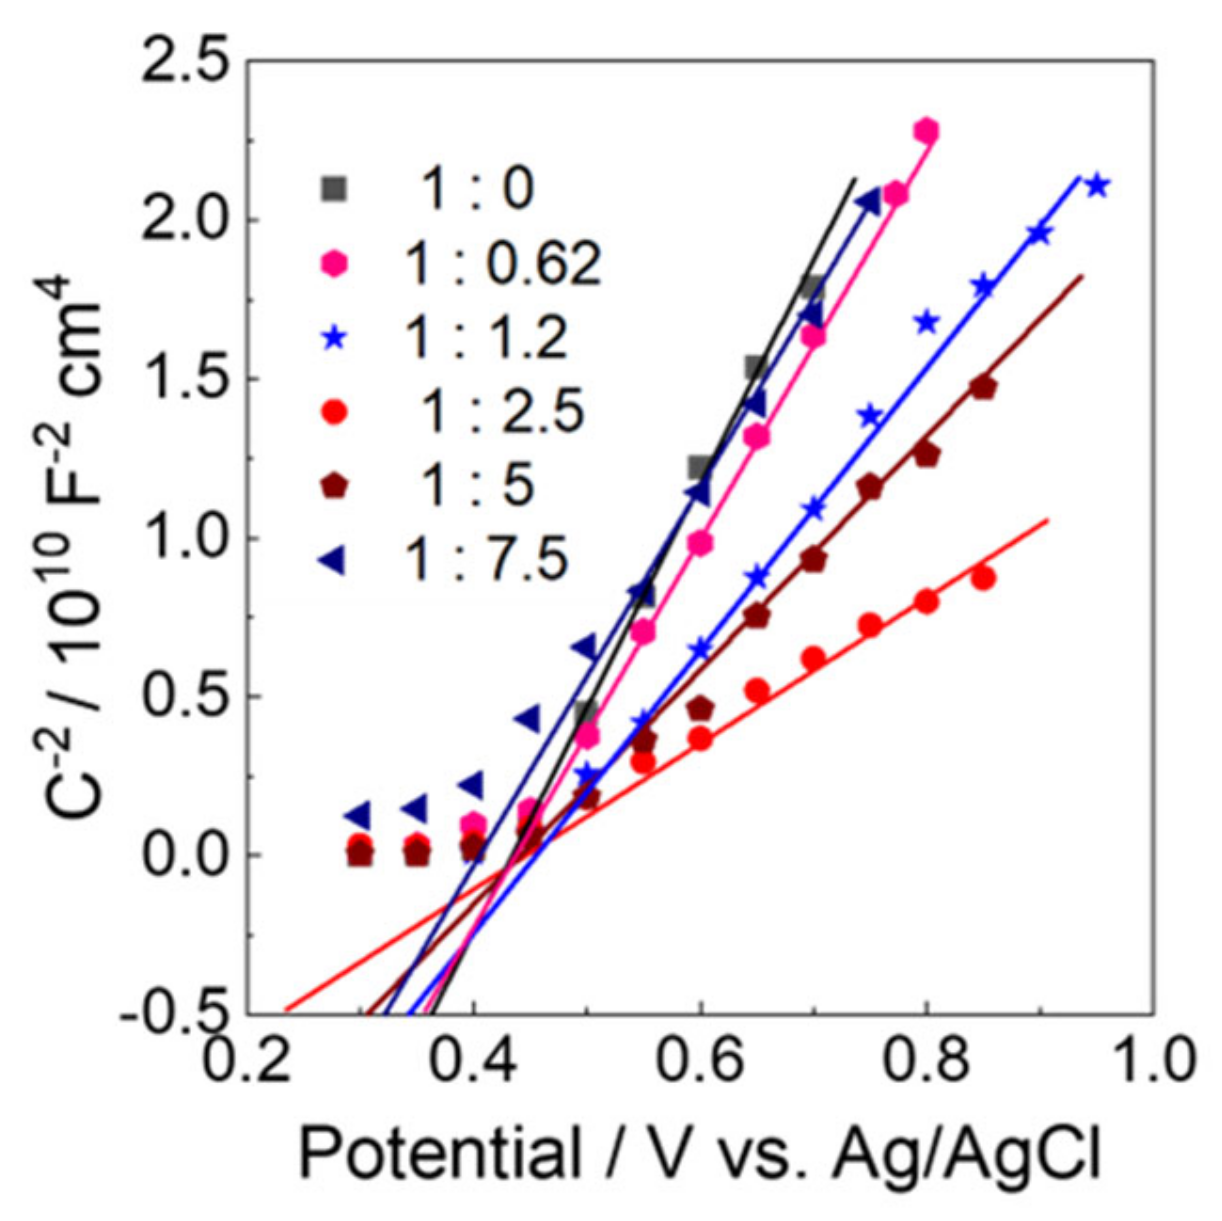
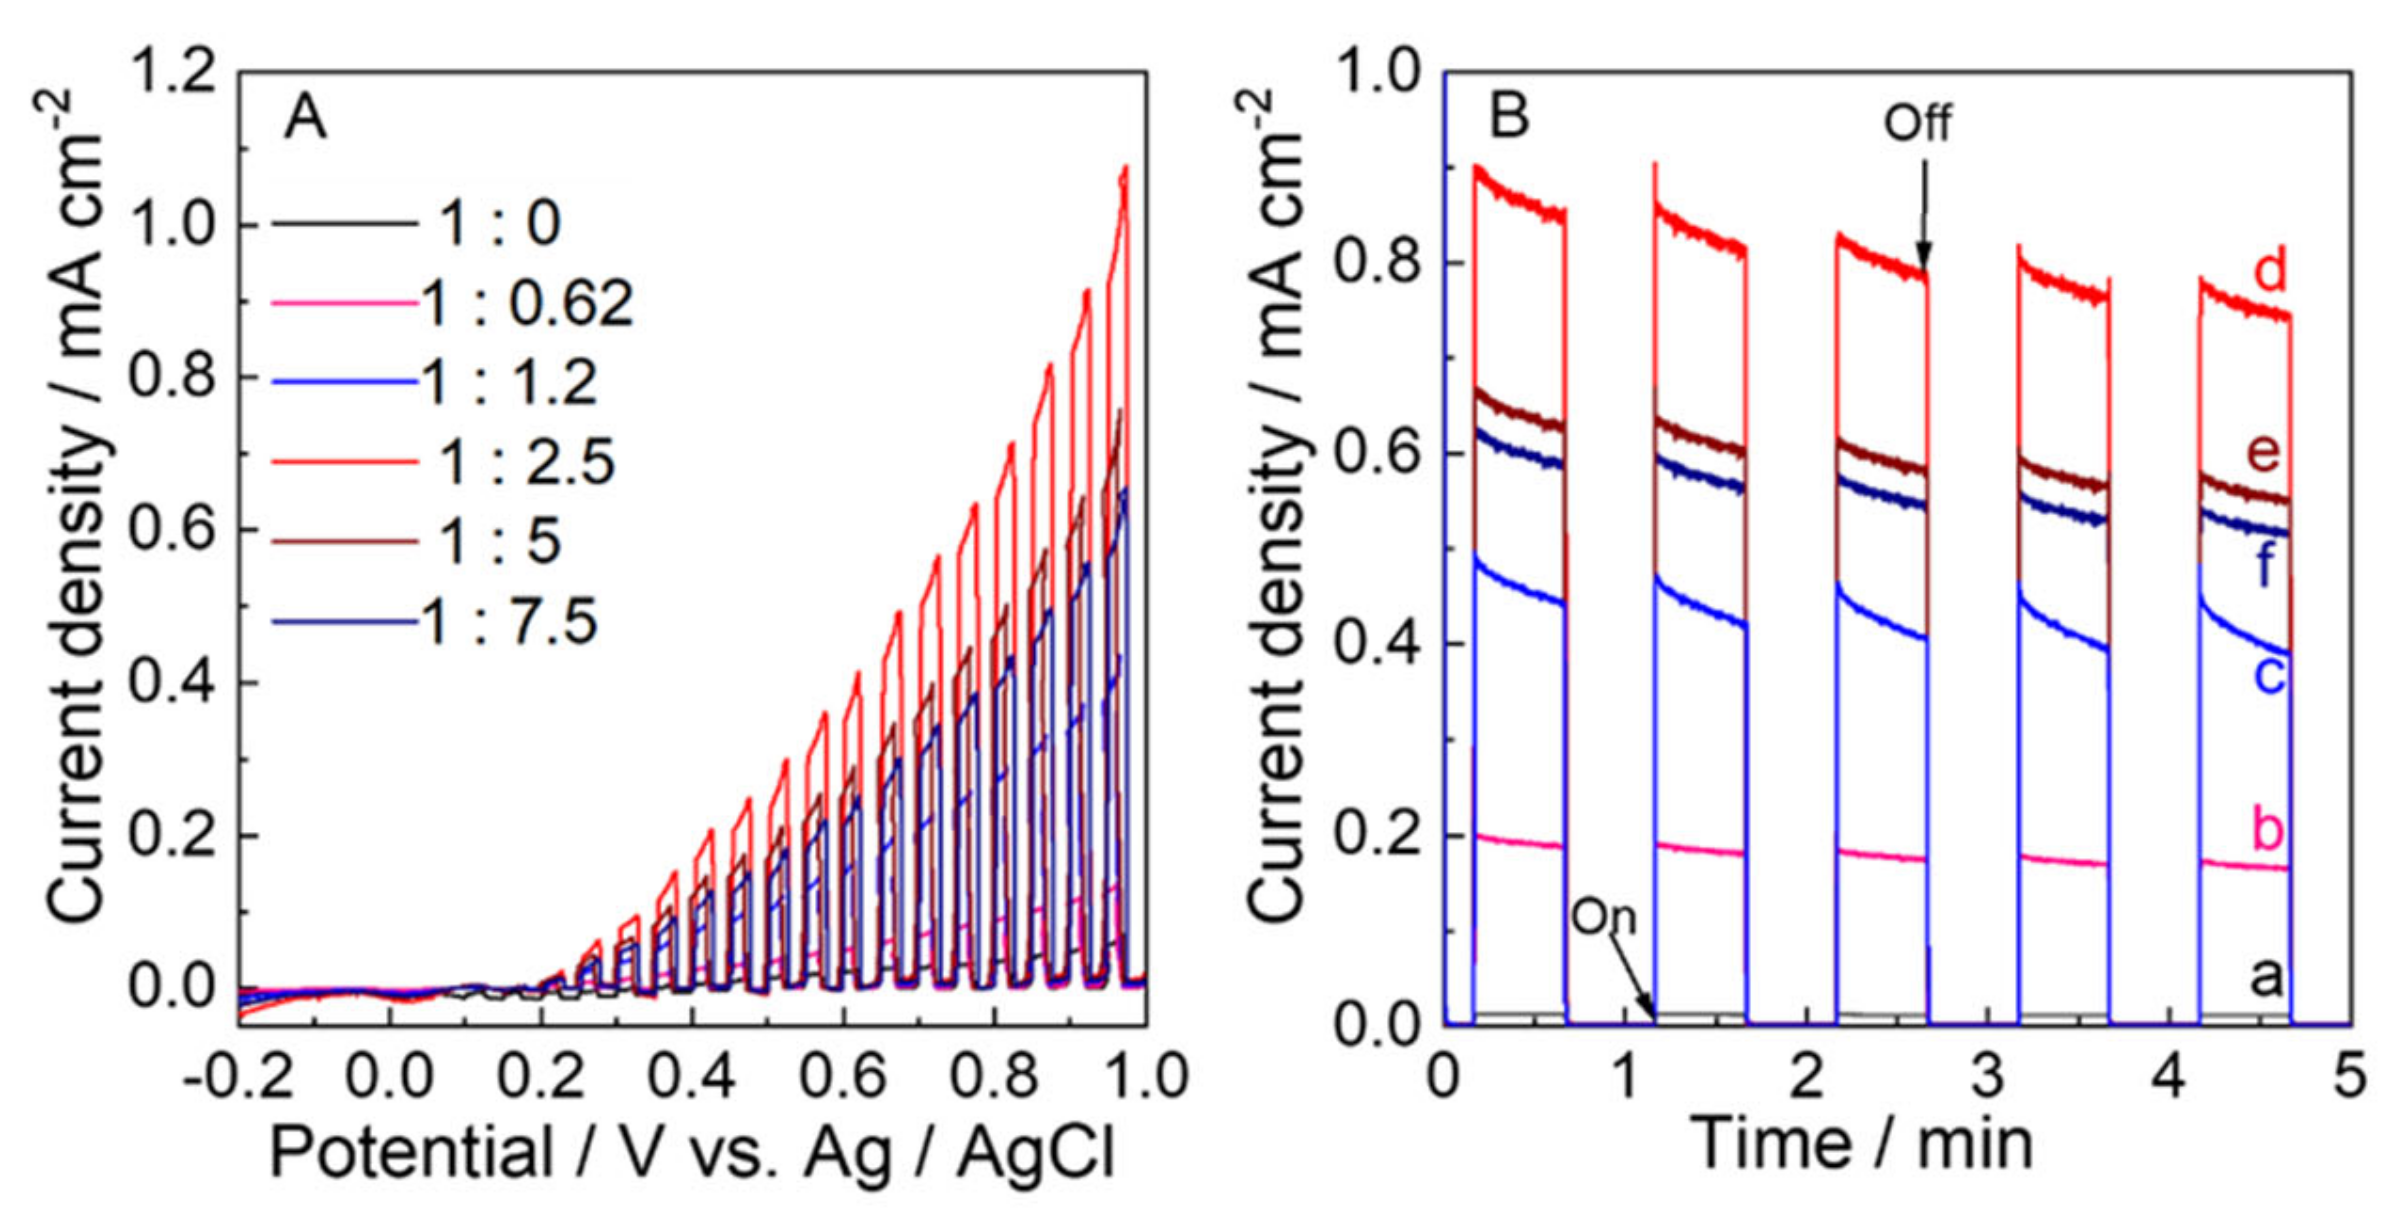
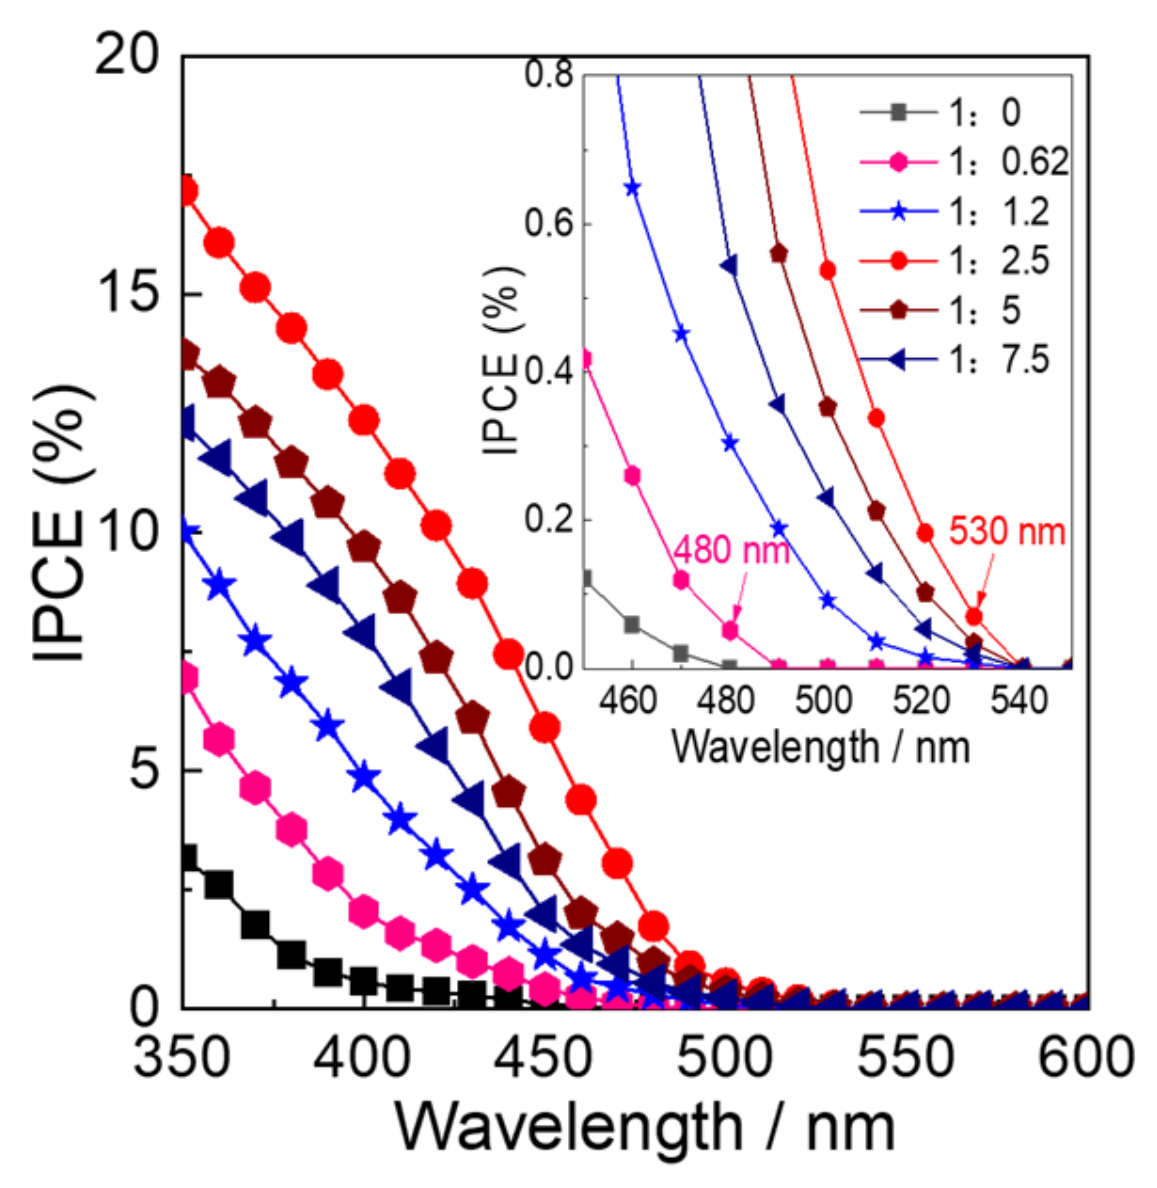
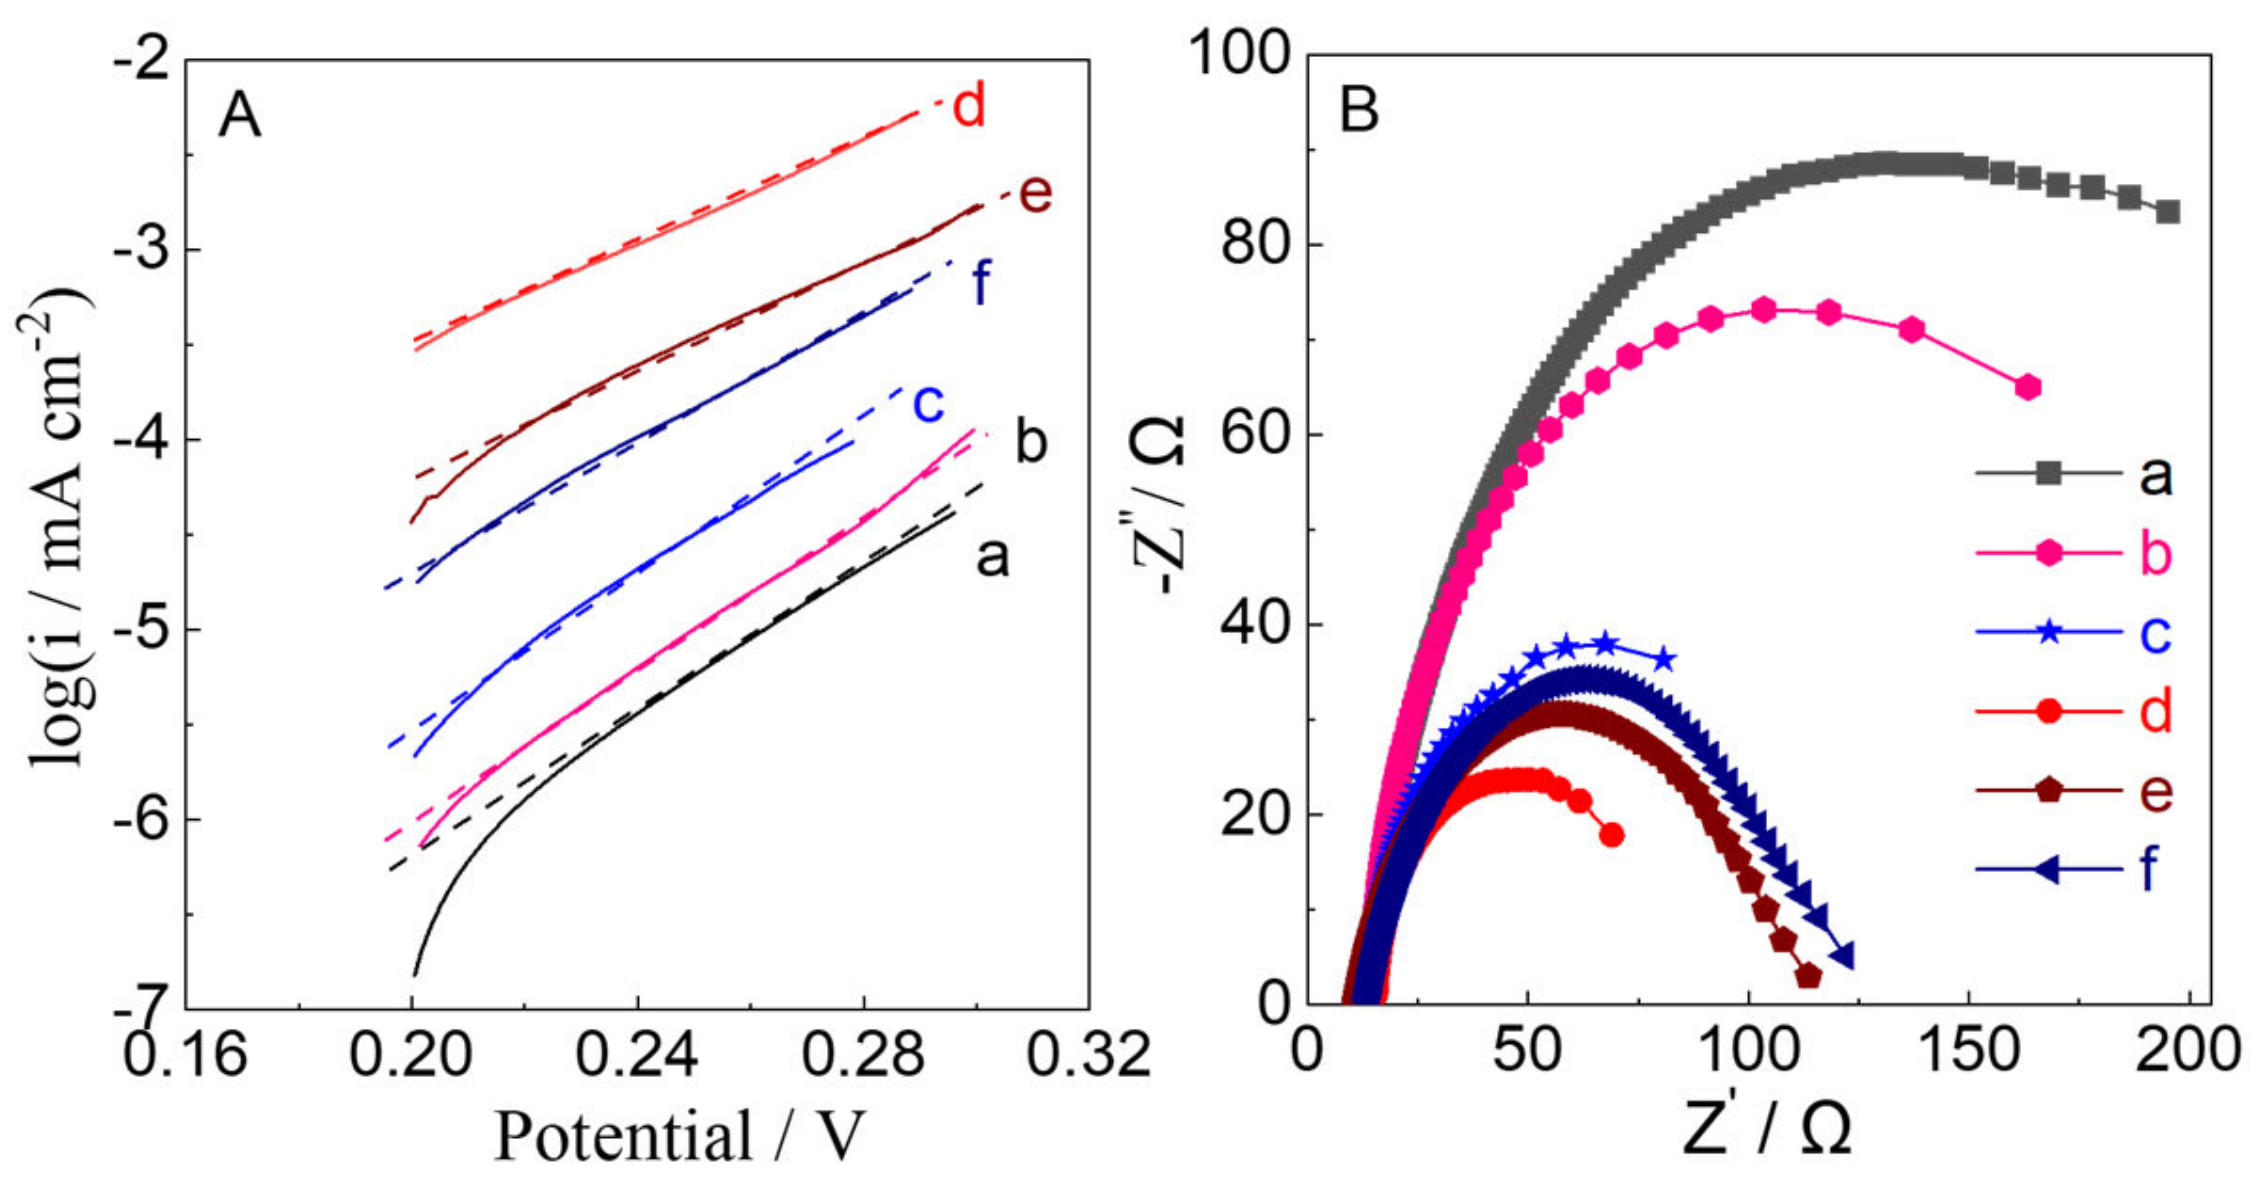
2.3. Photoelectrochemical Properties

The LSVs for these electrodes were measured with chopped visible light irradiation to study their PEC water oxidation performance. The onset potential for photocurrents was 0.2 V vs. Ag/AgCl on visible-light irradiation for these electrodes due to water oxidation (Figure 9A). The photocurrent of 1.08 mA cm−2 at 1.0 V for WO3−2.5 was the highest.
Figure 9B exhibits that the photocurrent at 0.68 V vs. Ag/AgCl under visible-light irradiation chopped was stable during PEC water oxidation (5 min) for all of electrodes. The photocurrent of the WO3−2.5 electrode (0.85 mA cm−2) was higher than those of the WO3−0 (0.02 mA cm−2), WO3−0.62 (0.19 mA cm−2), WO3−1.2 (0.43 mA cm−2), WO3−5 (0.63 mA cm−2), and WO3−7.5 (0.58 mA cm−2) by a factor of 42.5, 4.5, 2.0, 1.3, and 1.5, respectively.
Figure 10 shows the action spectra of IPCE at 0.5 V vs. Ag/AgCl for different electrodes. The photocurrent could only be observed below 470 nm for WO3−0, which is consistent with the bandgap energy of WO3 [1]. For the WO3−0.62 electrode, the onset wavelength for photocurrent generation was at 480 nm (2.58 eV) after N2 intercalation. The onset wavelengths for WO3−1.2, WO3−2.5, WO3−5, and WO3−7.5 are considerably shifted to the wavelengths (530 nm) longer than that of WO3−0.62. Moreover, the IPCE results suggest that the photocurrent was generated based on the bandgap excitation, and the bandgap excitation occurs through collateral excitation from intermediate N 2p orbital to CB for the N2 intercalated WO3 electrodes. However, for all N2 intercalated electrodes, the photocurrent at wavelengths longer than 530 nm could not be detected due to the limited current detection level of the employed apparatus.
Photoelectrocatalysis was conducted under the visible light irradiation (λ > 450 nm, 100 mW cm−2) at potentiostatic conditions of 0.5 V vs. Ag/AgCl (1.05 V vs. RHE) in a 0.1 M phosphate buffer (pH 6.0) for 1 h using different electrodes (Figure 11). A higher photoanodic current due to water oxidation was observed for the WO3−2.5 electrode. The highest charge amount passed and the amount (nO2) of O2 evolved during the 1 h photoelectrocatalysis for WO3−2.5 was 2.05 C and 5.19 mmol (97% Faradaic efficiency), respectively, compared with the electrodes prepared at other conditions (Table 3). These results clearly prove that the intercalation of N2 enhances the PEC performance of WO3−2.5 in application to water oxidation. The decay of photoanodic currents was observed for all electrodes. This can be attributed to the formation of inactive tungsten-peroxo adducts [15] and adherence of O2 bubbles [56].
The Tafel plots and the measurement of electrochemical impedance are useful to evaluate the electron transport and its influence on PEC performance for water oxidation. In the Figure 12A, the Tafel plots of WO3−2.5 for water oxidation exhibited the lowest Tafel slope (d, 25 ± 0.3 mVdec−1) compared that of WO3-0 (a, 35 ± 0.2 mVdec−1), WO3−0.62 (b, 33 ± 0.4 mVdec−1), WO3−1.2 (c, 30 ± 0.3 mVdec−1), WO3−5 (e, 28 ± 0.5 mVdec−1)and WO3−7.5 (f, 29 ± 0.4 mVdec−1), suggesting the resistance of electrochemical reaction of WO3−2.5 electrodes is less than those of the other WO3 electrodes. As shown in the Figure 12B, only one semicircle was observed for all WO3 electrodes in Nyquist plots, indicating that charge transfer process plays an important role in the PEC reaction. WO3−2.5 gave smaller semicircles than those of WO3 electrodes, which implies that the WO3−2.5 electrode has lower charge transfer resistance and higher separation efficiency of photogenerated electron-hole pairs than others electrodes. As the ratio of nH2WO4:nN2H4 increased from 1:0 to 1:2.5, the semicircles decreased and then increased from 1:5 to 1:7.5, corresponding to the amounts of N2 into the WO3 lattice.

3. Materials and Methods

3.1. Materials

Tungstic acid (H2WO4), hydrazine monohydrate (N2H4·H2O), Marpolose (60MP-50), and Polyethylene glycol (PEG, Mw = 2000) were obtained from McLean’s Reagent (Shanghai Macklin Biochemical Co.,Ltd., shanghai, China). A Fluorine doped tin oxide (FTO)-coated glass substrate was obtained from Dalian HeptaChroma Co. Ltd. (Dalian, China), Millipore water (DIRECT-Q 3UV, Merck Ltd. Merck Ltd., Shanghai, China) was used to prepare the solutions. All of the chemicals were of analytical grade and were used as received unless mentioned otherwise.

3.2. Synthesis of N2-Intercalated WO3

According to the approach we reported previously [17], N2H4·H2O (36.5–438 μL, 0.75–9.0 mmol) solution were added to H2WO4 (0.3 g, 1.2 mmol) under vigorous stirring at room temperature to form a yellow suspension with H2WO4:N2H4 molar ratio (nW:nN2H4) of 1:0.62–7.5 in 3 mL water. The white N2H4-derived precursor was obtained after the suspension was slowly evaporated. The N2H4-derived precursor powders were heated at 420 °C (1 °C min−1) for 1.5 h in flowing O2 to obtain different WO3 samples. A control WO3 sample was prepared in the same manner without addition of N2H4·H2O.

3.3. Fabrication of Electrodes

In a typical procedure, 0.6 mL of water was added to the N2H4-derived precursor powder (0.8 g), PEG (0.2 mg), and Marpolose (80.0 mg), and it was slowly stirred until a smooth paste without bubbles was formed. A doctor-blading method was employed to coat the resulting paste over a clean FTO glass substrate (1.0 cm−2 area) and dried at 80 °C for 15 min. The N2H4-derived precursor electrodes were calcined at 420 °C in flowing O2 flow to give different WO3 electrodes, which are denoted as WO3-0.62, WO3-1.2, WO3-2.5, WO3-5 and WO3-7.5, respectively. The control WO3 electrode was fabricated by the same method using a precursor prepared without addition of N2H4·H2O, denoted as WO3-0.

3.4. Measurement

Characterization of the crystalline phase was performed by powder X-ray diffraction (XRD) using a monochromated (Shimadzu International Trade (Shanghai) Co., Ltd., Shanghai, China, XRD-6000, Cu Kα λ = 1.54 Å). The electron microscopy images of surface morphology were observed using a field emission scanning electron microscope (JEOL, TSM-6510LV, Japan). The energy-dispersive X-ray spectroscopic (EDS) data were collected using an electron probe microanalysis (JED-2300, JEOL, Tokyo, Japan) operated at an accelerating voltage of 10 kV. Raman spectra were collected using a Raman microspectroscopic apparatus (Horiba-Jobin-Yvon LabRAM HR, Paris, France) using 532 nm excitation and silicon standard wavenumber (520.7 cm−1). A Thermo Fisher Scientific (Thermo Fisher Scientific (China) Co., Ltd., Shanghai, China) ESCALAB Xi+ instrument was employed to collect the XPS spectra, and calibrated by the C 1s peak, appearing at 284.2 eV. A spectrophotometer (Shimadzu UV-2700) in a DR mode with an integrating sphere (ISN-723) was taken to record the UV-visible DRS were recorded.
PEC measurements were examined using an electrochemical analyzer (Shanghai Chenhua Instrument Co., Ltd., CHI760E). A two-compartment PEC cell separated by a Nafion membrane. A three-electrode system has been employed using a WO3 electrode and Ag/AgCl electrode as the working and reference electrodes in one compartment, and a Pt wire in the other compartment as the counter electrode. All the PEC experiments were taken in an aqueous 0.1 M phosphate buffer solution (pH 6.0). The linear sweep voltammograms (LSV) were measured at a scan rate of 5 mV s−1 between −0.2 V and 1.0 V. Light (λ > 450 nm, 100 mW cm−2) was irradiated from the backside of the working electrode using a 500W xenon lamp with a UV-cut filter (λ > 450 nm) and liquid filter (0.2 M CuSO4, 5.0 cm light pass length) for cutting of heat ray. Electrochemical impedance spectra were measured at an applied potential of 0.68 V vs. Ag/AgCl (1.23 V vs. RHE) in a frequency range from 10 mHz to 20 kHz (amplitude of 50 mV). The output of light intensity was calibrated as 100 mW cm−2 using a spectroradiometer (Ushio Inc., USR-40, Ushio Shanghai Inc., Shanghai, China). Photoelectrocatalysis was conducted under the potentiostatic conditions at 0.5 V at 25 °C with illumination of light (λ > 450 nm, 100 mW cm−2) for 1 h. The amounts of H2 and O2 evolved were determined from the analysis of the gas phase of counter and working electrode compartments, respectively, using gas chromatography (Shimadzu GC-8A with a TCD detector and molecular sieve 5A column and Ar carrier gas). A monochromic light with 10 nm of bandwidth was employed using a 500 W xenon lamp with a monochromator for IPCE measurements.

4. Conclusions

N2 intercalated WO3 was controllably synthesized using N2H4 with a dual functional role, namely as an N atom source for N2 intercalation and as a structure-directing agent for the nanorod architecture. The addition of N2H4 dependence on the physiochemical properties and the performance of the PEC water oxidation of the WO3-0 and N2 intercalated WO3 electrodes were investigated to characterize N2 intercalation into the WO3 lattice and reveal the mechanism of the superior performance of PEC water oxidation for the N2 intercalated WO3 photoanode. The N2 intercalated WO3 exhibited the optimum nW:n(NH4)2S ratio at 1:2.5 for the high concentration of N elements. The N2 intercalation is responsible for the significant red shift in the absorption edge, with a new shoulder appearing at 470–600 nm compared to that of WO3-0. The N2 intercalated WO3 photoanode is able to utilize visible light in longer wavelengths below 530 nm for PEC water oxidation, in contrast to utilization below 470 nm for the WO3-0 photoanode. The N2 intercalated WO3 photoanode is expected to be applied for PEC water splitting cells in artificial photosynthesis to improve the solar energy conversion efficiency.

Author Contributions

Conceptualization, D.L., B.L. and F.H.; methodology, B.L., S.T. and H.S.; investigation and data curation, Z.C.; formal analysis, C.G.; supervision, D.L.; writing—original draft preparation, D.L.; writing—review and editing, D.L. All authors have read and agreed to the published version of the manuscript.

Funding

This project was supported by the Natural Science Foundation of Ningxia Province, grant number 2021AAC03170; 2022AAC03218.

Institutional Review Board Statement

Not applicable.

Informed Consent Statement

Not applicable.

Data Availability Statement

Not applicable.

Conflicts of Interest

The authors declare no conflict of interest.

Sample Availability

Samples of the compounds are available from the authors. Data are contained within the article.

References

  1. Wang, Y.; Tian, W.; Chen, C.; Xu, W.; Li, L. Tungsten Trioxide Nanostructures for Photoelectrochemical Water Splitting: Material Engineering and Charge Carrier Dynamic Manipulation. Adv. Func. Mater. 2019, 29, 1809036–1809060. [Google Scholar] [CrossRef]
  2. Cook, T.R.; Dogutan, D.K.; Reece, S.Y.; Surendranath, Y.; Nocera, D.G. Solar Energy Supply and Storage for the Legacy and Non legacy Worlds. Chem. Rev. 2010, 110, 6474–6502. [Google Scholar] [CrossRef] [PubMed]
  3. Dahl, S.; Chorkendorff, I. Towards practical implementation. Nat. Mater. 2012, 11, 100–101. [Google Scholar] [CrossRef] [PubMed]
  4. Chatterjee, P.; Chakraborty, A.K. Enhanced solar water oxidation by CoWO4-WO3 heterojunction photoanode. Sol. Energy 2022, 232, 312–319. [Google Scholar] [CrossRef]
  5. Fujishima, A.; Honda, K. Electrochemical Photolysis of Water at a Semiconductor Electrode. Nature 1972, 238, 37–38. [Google Scholar] [CrossRef] [PubMed]
  6. Yang, M.; Li, J.; Ke, G.; Liu, B.; Dong, F.; Yang, L.; He, H.; Zhou, Y. WO3 homojunction photoanode: Integrating the advantages of WO3 different facets for efficient water oxidation. J. Energy Chem. 2021, 56, 37–45. [Google Scholar] [CrossRef]
  7. Li, D.; Wu, F.; Gao, C.; Shen, H.; Han, F.; Han, F.; Chen, Z. Fabrication of an Efficient N, S Co-Doped WO3 Operated in Wide-Range of Visible-Light for Photoelectrochemical Water Oxidation. Nanomaterials 2022, 12, 2079–2091. [Google Scholar] [CrossRef]
  8. Chandra, D.; Saito, K.; Yui, T.; Yagi, M. Crystallization of Tungsten Trioxide Having Small Mesopores: Highly Efficient Photoanode for Visible-Light-Driven Water Oxidation. Angew.Chem. Int. Ed. 2013, 52, 12606–12609. [Google Scholar] [CrossRef]
  9. Kay, A.; Cesar, I.; Grätzel, M. New Benchmark for Water Photooxidation by Nanostructured α-Fe2O3 Films. J. Am. Chem. Soc. 2006, 128, 15714–15721. [Google Scholar] [CrossRef]
  10. Zhang, R.; Fang, Y.; Chen, T.; Qu, F.; Liu, Z.; Du, G.; Asiri, A.M.; Gao, T.; Sun, X. Enhanced Photoelectrochemical Water Oxidation Performance of Fe2O3 Nanorods Array by S Doping. ACS Sustain. Chem. Eng. 2017, 5, 7502–7506. [Google Scholar] [CrossRef]
  11. Li, Y.; Takata, T.; Cha, D.; Takanabe, K.; Minegishi, T.; Kubota, J.; Domen, K. Vertically aligned Ta3N5 nanorod arrays for solar-driven photoelectrochemical water splitting. Adv. Mater. 2013, 25, 125–131. [Google Scholar] [CrossRef] [PubMed]
  12. Abe, R.; Higashi, R.; Domen, R. Facile fabrication of an efficient oxynitride TaON photoanode for overall water splitting into H2 and O2 under visible light irradiation. J. Am. Chem. Soc. 2010, 132, 11828–11829. [Google Scholar] [CrossRef] [PubMed]
  13. Higashi, M.; Domen, K.; Abe, R. Fabrication of an Efficient BaTaO2N Photoanode Harvesting a Wide Range of Visible Light for Water Splitting. J. Am. Chem. Soc. 2013, 135, 10238–10241. [Google Scholar] [CrossRef]
  14. Hodes, G.; Cahen, D.; Manassen, J. Tungsten trioxide as a photoanode for a photoelectrochemical cell (PEC). Nature 1976, 260, 312–313. [Google Scholar] [CrossRef]
  15. Santato, C.; Ulmann, M.; Augustynski, J. Photoelectrochemical Properties of Nanostructured Tungsten Trioxide Films. J. Phys. Chem. B 2001, 105, 936–940. [Google Scholar] [CrossRef]
  16. Kim, J.K.; Shin, K.; Cho, S.M.; Lee, T.-W.; Park, J.H. Synthesis of transparent mesoporous tungsten trioxide films with enhanced photoelectrochemical response: Application to unassisted solar water splitting. Energy Environ. Sci. 2011, 4, 1465–1470. [Google Scholar] [CrossRef] [Green Version]
  17. Li, D.; Takeuchi, R.; Chandra, D.; Saito, K.; Yui, T.; Yagi, M. Visible light-driven water oxidation on an in situ N2-intercalated WO3 nanorod photoanode synthesized by a dual-functional structure-directing agent. ChemSusChem 2018, 11, 1151–1156. [Google Scholar] [CrossRef]
  18. Jadwiszczak, M.; Jakubow-Piotrowska, K.; Kedzierzawski, P.; Bienkowski, K.; Augustynski, J. Highly Efficient Sunlight-Driven Seawater Splitting in a Photoelectrochemical Cell with Chlorine Evolved at Nanostructured WO3 Photoanode and Hydrogen Stored as Hydride within Metallic Cathode. Adv. Energy Mater. 2020, 10, 1903213.1–1903213.8. [Google Scholar] [CrossRef]
  19. Zhu, T.; Chong, M.N.; Chan, E.S. Nanostructured Tungsten Trioxide Thin Films Synthesized for Photoelectrocatalytic Water Oxidation: A review. ChemSusChem 2014, 7, 2974–2997. [Google Scholar] [CrossRef]
  20. Seabold, J.A.; Choi, K.S. Effect of a Cobalt-Based Oxygen Evolution Catalyst on the Stability and the Selectivity of Photo-Oxidation Reactions of a WO3 Photoanode. Chem. Mater. 2011, 23, 1105–1112. [Google Scholar] [CrossRef]
  21. Zhang, Q.; Liu, R.; Liu, T. Role of oxygen vacancies on surface reaction of water oxidation in WO3 studied by density functional theory (DFT) and experiment. Mol. Catal. 2023, 539, 113005. [Google Scholar] [CrossRef]
  22. Samuel, E.; Joshi, B.; Kim, M.W.; Swihart, M.T.; Yoon, S.S. Morphology engineering of photoelectrodes for efficient photoelectrochemical water splitting. Nano Energy 2020, 72, 104648. [Google Scholar] [CrossRef]
  23. Wang, N.; Wang, D.G.; Li, M.R.; Shi, J.Y.; Li, C. Photoelectrochemical water oxidation on photoanodes fabricated with hexagonal nanoflower and nanoblock WO3. Nanocsale 2014, 6, 2061–2066. [Google Scholar] [CrossRef] [PubMed]
  24. Li, Z.; Luo, W.; Zhang, M.; Feng, J.; Zou, Z. Photoelectrochemical cells for solar hydrogen production: Current state of promising photoelectrodes, methods to improve their properties, and outlook. Energy Environ. Sci. 2013, 6, 347–370. [Google Scholar] [CrossRef]
  25. Sun, Y.; Murphy, C.J.; Reyes-Gil, K.R.; Reyes-Garcia, E.A.; Thornton, J.M.; Morris, N.A.; Raftery, D. Photoelectrochemical and structural characterization of carbon-doped WO3 films prepared via spray pyrolysis. Int. J. Hydrog. Energ. 2009, 34, 8476–8484. [Google Scholar] [CrossRef]
  26. Li, W.; Li, J.; Wang, X.; Chen, Q. Preparation and water-splitting photocatalytic behavior of S-doped WO3. Appl. Surf. Sci. 2012, 263, 157–162. [Google Scholar] [CrossRef]
  27. Mi, Q.; Ping, Y.; Li, Y.; Cao, B.; Brunschwig, B.S.; Khalifah, P.G.; Galli, G.A.; Gray, H.B.; Lewis, N.S. Thermally Stable N2-Intercalated WO3 Photoanodes for Water Oxidation. J. Am. Chem. Soc. 2012, 134, 18318–18324. [Google Scholar] [CrossRef] [Green Version]
  28. Wang, Y.; Tian, W.; Chen, L.; Cao, F.; Guo, J.; Li, L. Three-Dimensional WO3 Nanoplate/Bi2S3 Nanorod Heterojunction as a Highly Efficient Photoanode for Improved Photoelectrochemical Water Splitting. ACS Appl. Mater. Interfaces 2017, 9, 40235–40243. [Google Scholar] [CrossRef] [PubMed]
  29. Hu, Z.; Xu, M.; Shen, Z.; Yu, J.C. A nanostructured chromium(iii) oxide/tungsten(vi) oxide p–n junction photoanode toward enhanced efficiency for water oxidation. J. Mater.Chem. A 2015, 3, 14046–14053. [Google Scholar] [CrossRef]
  30. Li, D.; Chandra, D.; Takeuchi, R.; Togashi, T.; Kurihara, M.; Saito, K.; Yui, T.; Yagi, M. Dual-Functional Surfactant-Templated Strategy for Synthesis of an In Situ N2-Intercalated Mesoporous WO3 Photoanode for Efficient Visible-Light-Driven Water Oxidation. Chem. Eur. J. 2017, 23, 6596–6604. [Google Scholar] [CrossRef]
  31. Jiao, Z.; Wang, J.; Ke, L.; Sun, X.W.; Demir, H.V. Morphology-Tailored Synthesis of Tungsten Trioxide (Hydrate) Thin Films and Their Photocatalytic Properties. ACS Appl. Mater. Interfaces 2011, 3, 229–236. [Google Scholar] [CrossRef] [PubMed] [Green Version]
  32. Yagi, M.; Maruyama, S.; Sone, K.; Nagai, K.; Norimatsu, T. Preparation and photoelectrocatalytic activity of a nano-structured WO3 platelet film. J. Solid State Chem. 2008, 181, 175–182. [Google Scholar] [CrossRef]
  33. Sivakumar, R.; Raj, A.M.E.; Subramanian, B.; Jayachandran, M.; Trivedi, D.C.; Sanjeeviraja, C. Preparation and characterization of spray deposited n-type WO3 thin films for electrochromic devices. Mater. Res. Bull. 2004, 39, 1479–1489. [Google Scholar] [CrossRef]
  34. Li, W.; Jie, L.; Xuan, W.; Ma, J.; Chen, Q. Photoelectrochemical and physical properties of WO3 films obtained by the polymeric precursor method. Int. J. Hydrog. Energ. 2010, 35, 13137–13145. [Google Scholar] [CrossRef]
  35. Wang, G.; Ling, Y.; Wang, H.; Yang, X.; Wang, C.; Zhang, J.Z.; Li, Y. Hydrogen-treated WO3 nanoflakes show enhanced photostability. Energy Environ. Sci. 2012, 5, 6180–6187. [Google Scholar] [CrossRef]
  36. Amano, F.; Li, D.; Ohtani, B. Fabrication and photoelectrochemical property of tungsten(vi) oxide films with a flake-wall structure. Chem. Commun. 2010, 46, 2769–2771. [Google Scholar] [CrossRef] [Green Version]
  37. Liu, X.; Wang, F.; Wang, Q. Nanostructure-based WO3 photoanodes for photoelectrochemical water splitting. Phys. Chem. Chem. Phys. 2012, 14, 7894–7911. [Google Scholar] [CrossRef]
  38. Bi, Y.; Li, D.; Nie, H. Preparation and catalytic properties of tungsten oxides with different morphologies. Mater. Chem. Phys. 2010, 123, 225–230. [Google Scholar] [CrossRef]
  39. Zhang, J.; Tu, J.P.; Xia, X.H.; Wang, X.L.; Gu, C.D. Hydrothermally synthesized WO3 nanowire arrays with highly improved electrochromic performance. J. Mater. Chem. 2011, 21, 5492–5498. [Google Scholar] [CrossRef]
  40. Su, J.; Feng, X.; Sloppy, J.D.; Guo, L.; Grimes, C.A. Vertically Aligned WO3 Nanowire Arrays Grown Directly on Transparent Conducting Oxide Coated Glass: Synthesis and Photoelectrochemical Properties. Nano Lett. 2011, 11, 203–208. [Google Scholar] [CrossRef]
  41. Pihosh, Y.; Turkevych, I.; Mawatari, K.; Asai, T.; Hisatomi, T.; Uemura, J.; Tosa, M.; Shimamura, K.; Kubota, J.; Domen, K.; et al. Nanostructured WO3/BiVO4 Photoanodes for Efficient Photoelectrochemical Water Splitting. Small 2014, 10, 3692–3699. [Google Scholar] [CrossRef] [PubMed]
  42. Kalanur, S.S.; Hwang, Y.J.; Chae, S.Y.; Joo, O.S. Facile growth of aligned WO3 nanorods on FTO substrate for enhanced photoanodic water oxidation activity. J. Mater. Chem. A 2013, 1, 3479–3488. [Google Scholar] [CrossRef]
  43. Radecka, M.; Sobas, P.; Wierzbicka, M.; Rekas, M. Photoelectrochemical properties of undoped and Ti-doped WO3. Phys. B 2005, 364, 85–92. [Google Scholar] [CrossRef]
  44. Hameed, A.; Gondal, M.A.; Yamani, Z.H. Effect of transition metal doping on photocatalytic activity of WO3 for water splitting under laser illumination: Role of 3d-orbitals. Catal. Comm. 2004, 5, 715–719. [Google Scholar] [CrossRef]
  45. Bär, M.; Weinhardt, L.; Marsen, B.; Cole, B.; Gaillard, N.; Miller, E.; Heske, C. Mo incorporation in WO3 thin film photoanodes: Tailoring the electronic structure for photoelectrochemical hydrogen production. Appl. Phys. Lett. 2010, 96, 032107–032109. [Google Scholar] [CrossRef]
  46. Yang, B.; Luca, V. Enhanced long-wavelength transient photoresponsiveness of WO3 induced by tellurium doping. Chem. Commun. 2008, 32, 4454–4456. [Google Scholar] [CrossRef]
  47. Cole, B.; Marsen, B.; Miller, E.; Yan, Y.; To, B.; Jones, K.; Al-Jassim, M. Evaluation of Nitrogen Doping of Tungsten Oxide for Photoelectrochemical Water Splitting. J. Phys. Chem. C 2008, 112, 5213–5220. [Google Scholar] [CrossRef]
  48. Lin, W.; Zhang, B.; Liu, K.; Zhang, J.; Wang, J.; Ma, G. Facet Engineering on WO3 Mono-Particle-Layer Electrode for Photoelectrochemical Water Splitting. Chem. Eur. J. 2022, 28, e202201169–e202201177. [Google Scholar] [CrossRef]
  49. Tessier, F.; Le Gendre, L.; Cheviré, F.; Marchand, R.; Navrotsky, A. Thermochemistry of a New Class of Materials Containing Dinitrogen Pairs in an Oxide Matrix. Chem. Mater. 2005, 17, 3570–3574. [Google Scholar] [CrossRef]
  50. Ebbinghaus, S.G.; Abicht, H.P.; Dronskowski, R.; Müller, T.; Reller, A.; Weidenkaff, A. Perovskite-related oxynitrides – Recent developments in synthesis, characterisation and investigations of physical properties. Prog. Solid State Chem. 2009, 37, 173–205. [Google Scholar] [CrossRef] [Green Version]
  51. Rachel, A.; Ebbinghaus, S.G.; Güngerich, M.; Klar, P.J.; Reller, A. Tantalum and niobium perovskite oxynitrides: Synthesis and analysis of the thermal behaviour. Thermochim. Acta 2005, 438, 134–143. [Google Scholar] [CrossRef]
  52. Bendtsen, J.; Rasmussen, F. High-resolution incoherent Fourier transform Raman spectrum of the fundamental band of 14N2. J. Raman Spectrosc. 2000, 31, 433–438. [Google Scholar] [CrossRef]
  53. Liu, Y.; Li, Y.; Li, W.; Han, S.; Liu, C. Photoelectrochemical properties and photocatalytic activity of nitrogen-doped nanoporous WO3 photoelectrodes under visible light. App. Surf. Sci. 2012, 258, 5038–5045. [Google Scholar] [CrossRef]
  54. Ghicov, A.; Macak, J.M.; Tsuchiya, H.; Kunze, J.; Haeublein, V.; Frey, L.; Schmuki, P. Ion Implantation and Annealing for an Efficient N-Doping of TiO2 Nanotubes. Nano Lett. 2006, 6, 1080–1082. [Google Scholar] [CrossRef]
  55. Saha, N.C.; Tompkins, H.G. Titanium nitride oxidation chemistry: An x-ray photoelectron spectroscopy study. J. Appl. Phys. 1992, 72, 3072–3079. [Google Scholar] [CrossRef]
  56. Hernández, S.; Barbero, G.; Saracco, G.; Alexe-Ionescu, A.L. Considerations on Oxygen Bubble Formation and Evolution on BiVO4 Porous Anodes Used in Water Splitting Photoelectrochemical Cells. J. Phys. Chem. C 2015, 119, 9916–9925. [Google Scholar] [CrossRef]
Figure 1. SEM images of (a) WO3−0, (b) WO3−0.62, (c) WO3−1.2, (d) WO3−2.5, (e) WO3−5, and (f) WO3−7.5.
Molecules 28 02987 g001
Figure 2. The EDS data of (A) WO3−0 and (B) WO3−2.5 in the range of 0–11 keV. (Insert) The magnified EDS data of WO3−0 and WO3−2.5 in the range of 0.2–0.8 keV, respectively.
Molecules 28 02987 g002
Figure 3. (A) XRD patterns and (B) Raman spectra of (a) WO3−0, (b) WO3−0.62, (c) WO3−1.2, (d) WO3−2.5, (e) WO3−5, and (f) WO3−7.5, respectively.
Molecules 28 02987 g003
Figure 4. (A) Plots of lattice parameters of (a), (b), and (c) versus the addition of N2H4. (B) Plots of β versus the addition of N2H4, and (C) Lattice volumes of N2-intercalated WO3 samples prepared with addition of N2H4. The lattice volume (V) was calculated according to equation: V = abc(sinβ), β is the angle between a and c.
Molecules 28 02987 g004
Figure 5. Raman spectra in the wavenumber region of 2240–2400 cm−1 for (a) WO3−0, (b) WO3−0.62, (c) WO3−1.2, (d) WO3−2.5, (e) WO3−5, and (f) WO3−7.5, respectively.
Molecules 28 02987 g005
Figure 6. (A) UV-Visible DRS and (B) Tauc plots based on (a) WO3−0, (b) WO3−0.62, (c) WO3−1.2, (d) WO3−2.5, (e) WO3−5, and (f) WO3−7.5. Insets show the magnified spectra near the edges.
Molecules 28 02987 g006
Figure 7. Relationship between the relative contents of N and nH2WO4:nN2H4 ratio. The relative N contents were measured in EDS data and normalized by the highest contents for nH2WO4:nN2H4 of 1:2.5.
Molecules 28 02987 g007
Figure 8. Mott-Schottky plots of (black) WO3−0, (pink) WO3−0.62, (blue) WO3−1.2, (red) WO3−2.5, (wine) WO3−5, and (navy) WO3−7.5 electrodes in a 0.1 M phosphate buffer solution of pH 6.0. frequency, 0.1 Hz; amplitude potential, 10 mV.
Molecules 28 02987 g008
Figure 9. (A) Linear sweep voltammograms (LSV), and (B) Time course of the photocurrent at 0.68 V vs. Ag/AgCl (1.23 V vs. RHE) of the (a) WO3−0, (b) WO3−0.62, (c) WO3−1.2, (d) WO3−2.5, (e) WO3−5, and (f) WO3−7.5 electrodes with visible-light irradiation chopped in a 0.1 M phosphate buffer solution of pH 6.0 with visible-light irradiation (λ > 450 nm, 100 mW cm−2).
Molecules 28 02987 g009
Figure 10. Action spectra of IPCE of the (black) WO3−0, (pink) WO3−0.62, (blue) WO3−1.2, (red) WO3−2.5, (wine) WO3−5, and (navy) WO3−7.5 electrodes.
Molecules 28 02987 g010
Figure 11. Photocurrent density versus time profiles during PEC water oxidation in a 0.1m phosphate buffer solution of pH 6.0 at 0.68 V vs. Ag/AgCl (1.23 V vs. RHE) upon visible-light irradiation (λ > 450 nm, 100 mWcm−2) using (a) WO3−0, (b) WO3−0.62, (c) WO3−1.2, (d) WO3−2.5, (e) WO3−5, and (f) WO3−7.5 electrodes.
Molecules 28 02987 g011
Figure 12. (A) Tafel plots and (B) Nyquist plots of (a) WO3−0, (b) WO3−0.62, (c) WO3−1.2, (d) WO3−2.5, (e) WO3−5, and (f) WO3−7.5 electrodes for photoelectrocatalytic water oxidation in a 0.1 M phosphate buffer solution (pH = 6).
Molecules 28 02987 g012
Table 1. Summary of physicochemical properties of different WO3 samples.
SamplesMolar Ratio of W:N aCrystallite
Diameter b
(nm)
Surface Area c
(m2 g−1)
WO3−01:0179.6
WO3−0.621:0.0402212.1
WO3−1.21:0.0732516.6
WO3−2.51:0.0983121.2
WO3−51:0.0963020.4
WO3−7.51:0.0932717.3
a The local content of N was analysed according to the approach we reported previously [17,30]. b The crystallite diameters were calculated from XRD data according to Scherrer equation. c The surface areas were provided form N2 sorption isotherms.
Table 2. Summary of optical and electrochemical properties and energies of band structures of various WO3 samples.
SamplesAbsorption
Energies
EFBND (1019 cm−3)EIBEVB
WO3−02.64, -0.383.68-3.02
WO3−0.622.58, -0.363.78-2.94
WO3−1.22.55, 2.170.343.822.512.89
WO3−2.52.45, 1.920.234.152.152.68
WO3−52.52, 2.010.304.012.312.82
WO3−7.52.51, 2.080.323.912.412.83
Table 3. Summary of PEC water oxidation in a 0.1 M phosphate buffer solution (pH 6.0) for 1 h using different WO3 electrodes calcined at 420 °C.
SamplesCharge
/C
nO2
/μmol
F.E.O2 a
(%)
nH2b
/μmol
F.E.H2 c
(%)
WO3−00.080.11540.3483
WO3−0.620.320.75911.5695
WO3−1.20.711.72923.5396
WO3−2.52.055.199710.6100
WO3−51.293.16946.5898
WO3−7.51.182.83925.9898
a Faradic efficiency of O2 evolution. b nH2 is the amount of H2 evolved in the Pt counter electrode compartment. c Faradic efficiency of H2 evolution.
Disclaimer/Publisher’s Note: The statements, opinions and data contained in all publications are solely those of the individual author(s) and contributor(s) and not of MDPI and/or the editor(s). MDPI and/or the editor(s) disclaim responsibility for any injury to people or property resulting from any ideas, methods, instructions or products referred to in the content.

