
Investigation of Newly Synthesized Bis-Acyl-Thiourea Derivatives of 4-Nitrobenzene-1,2-Diamine for Their DNA Binding, Urease Inhibition, and Anti-Brain-Tumor Activities


 , ,
, ,  ,
,
Abstract
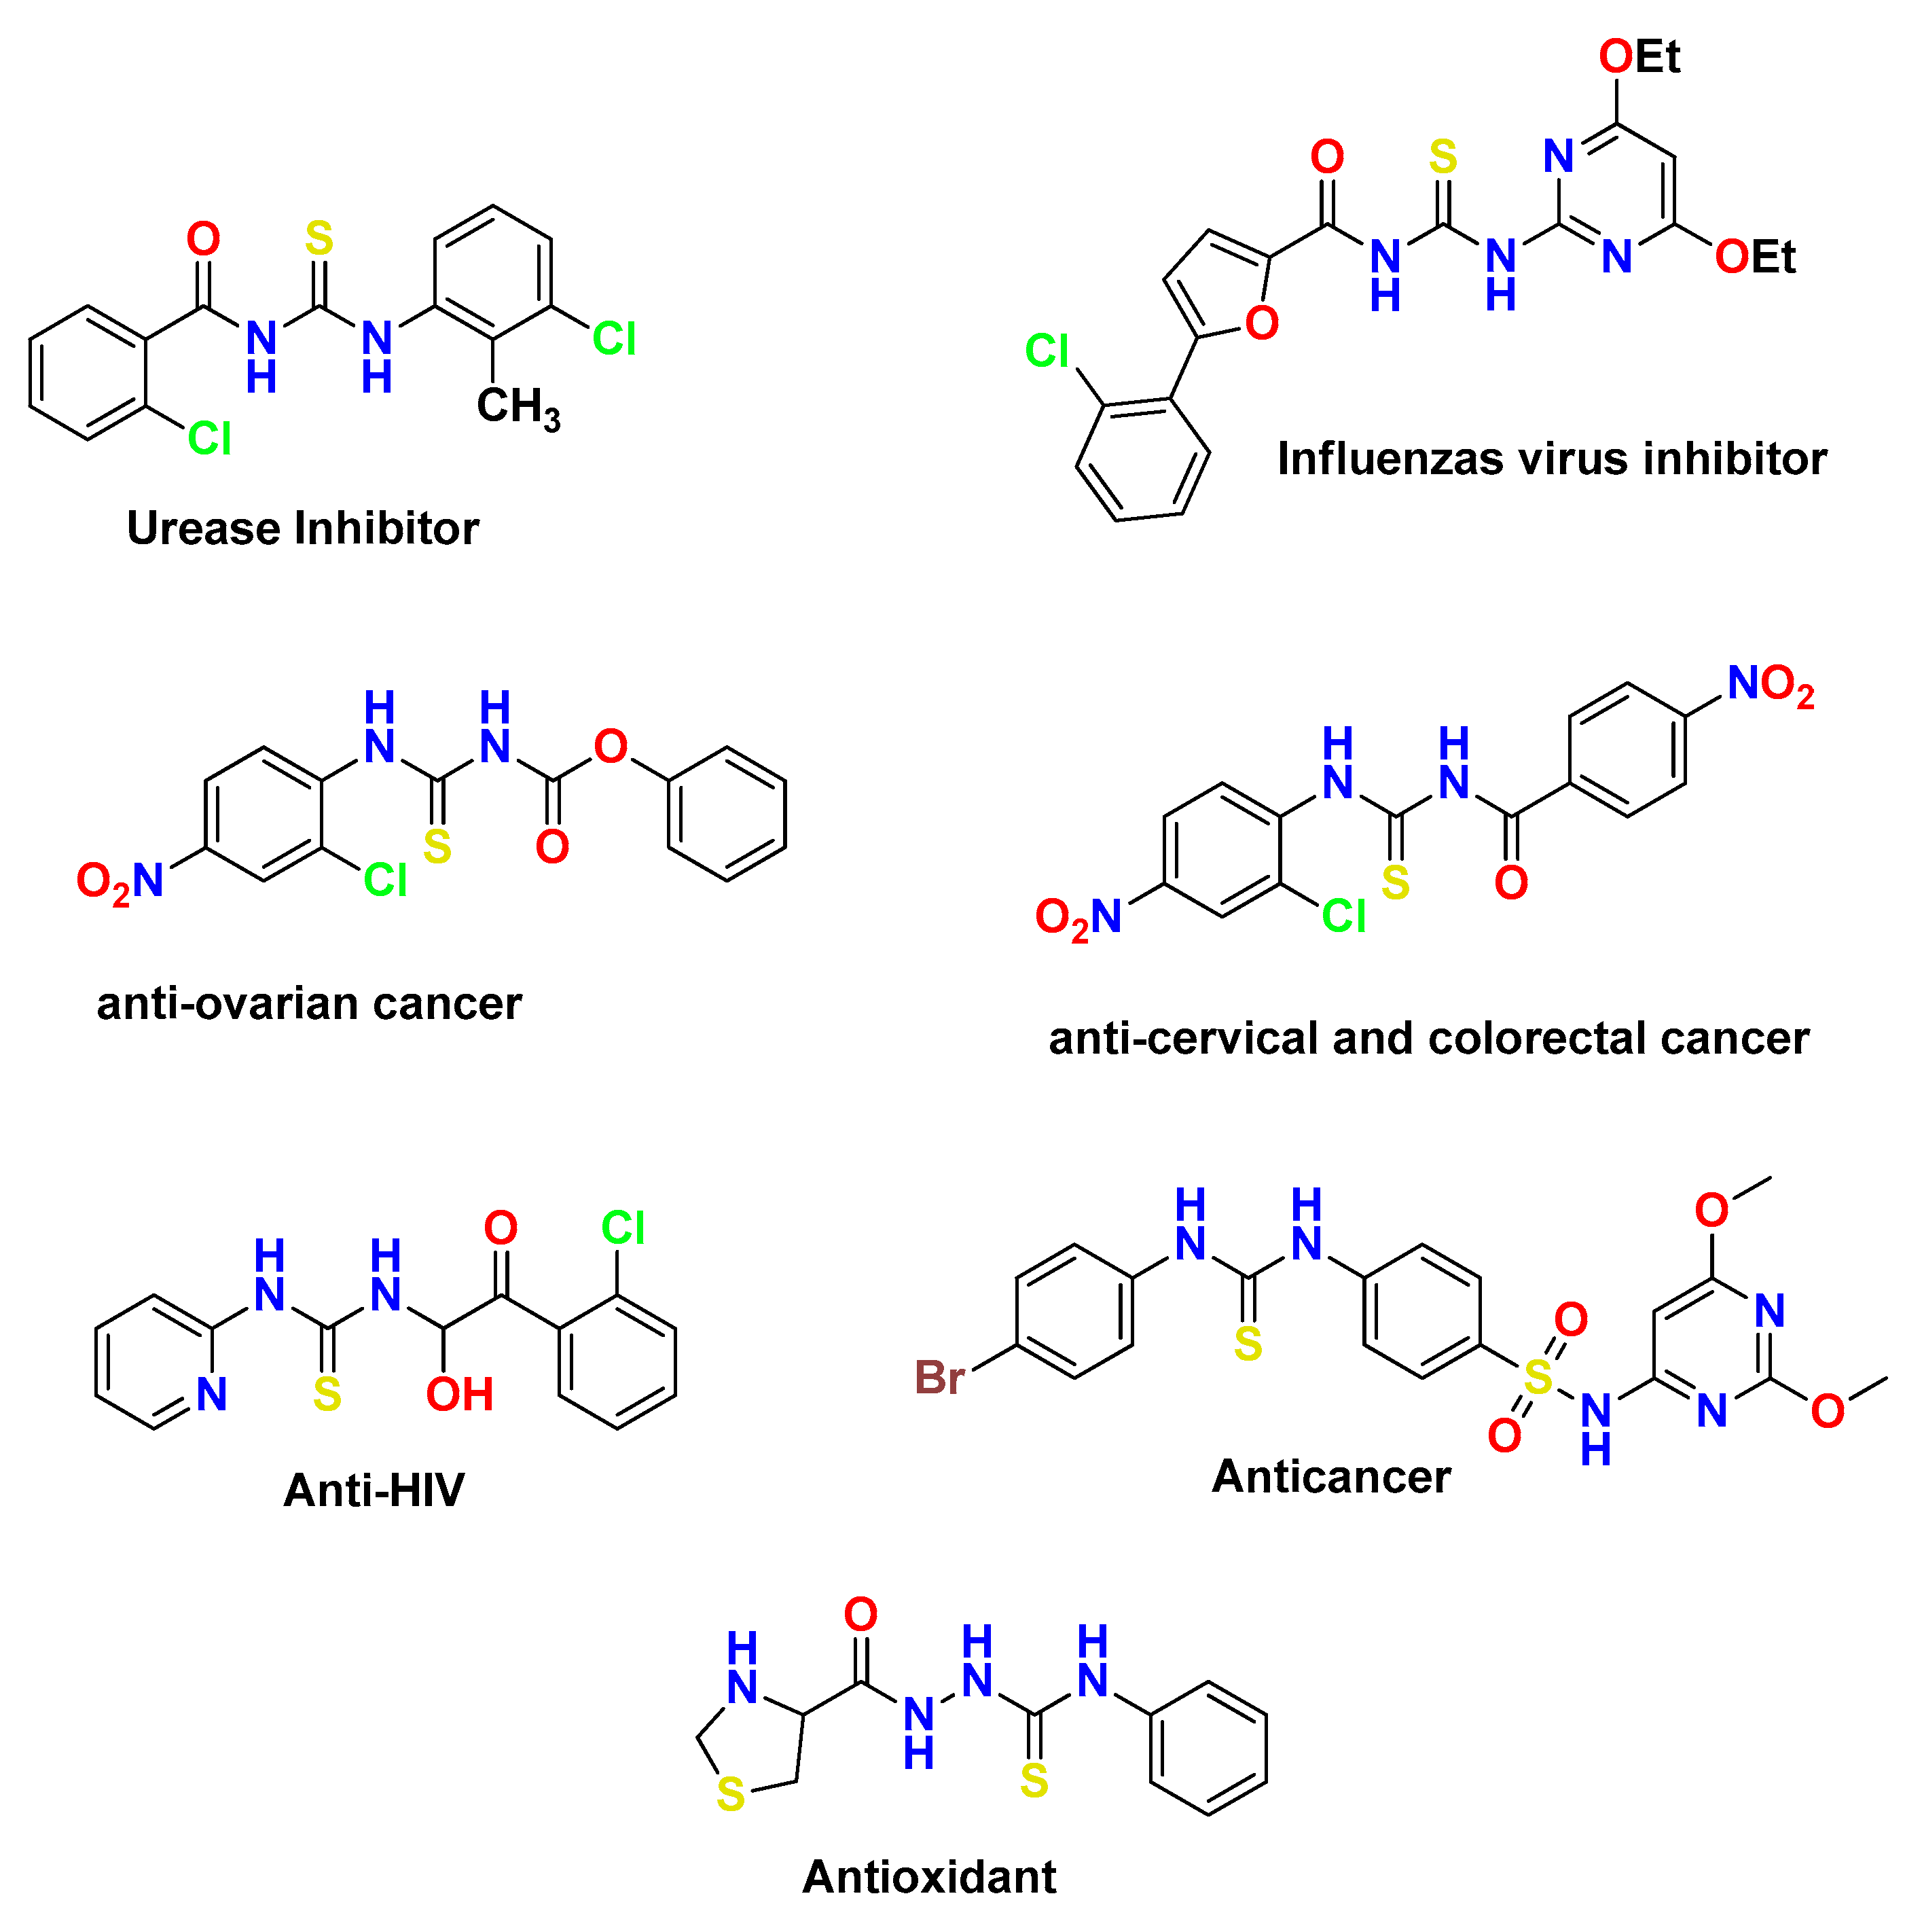
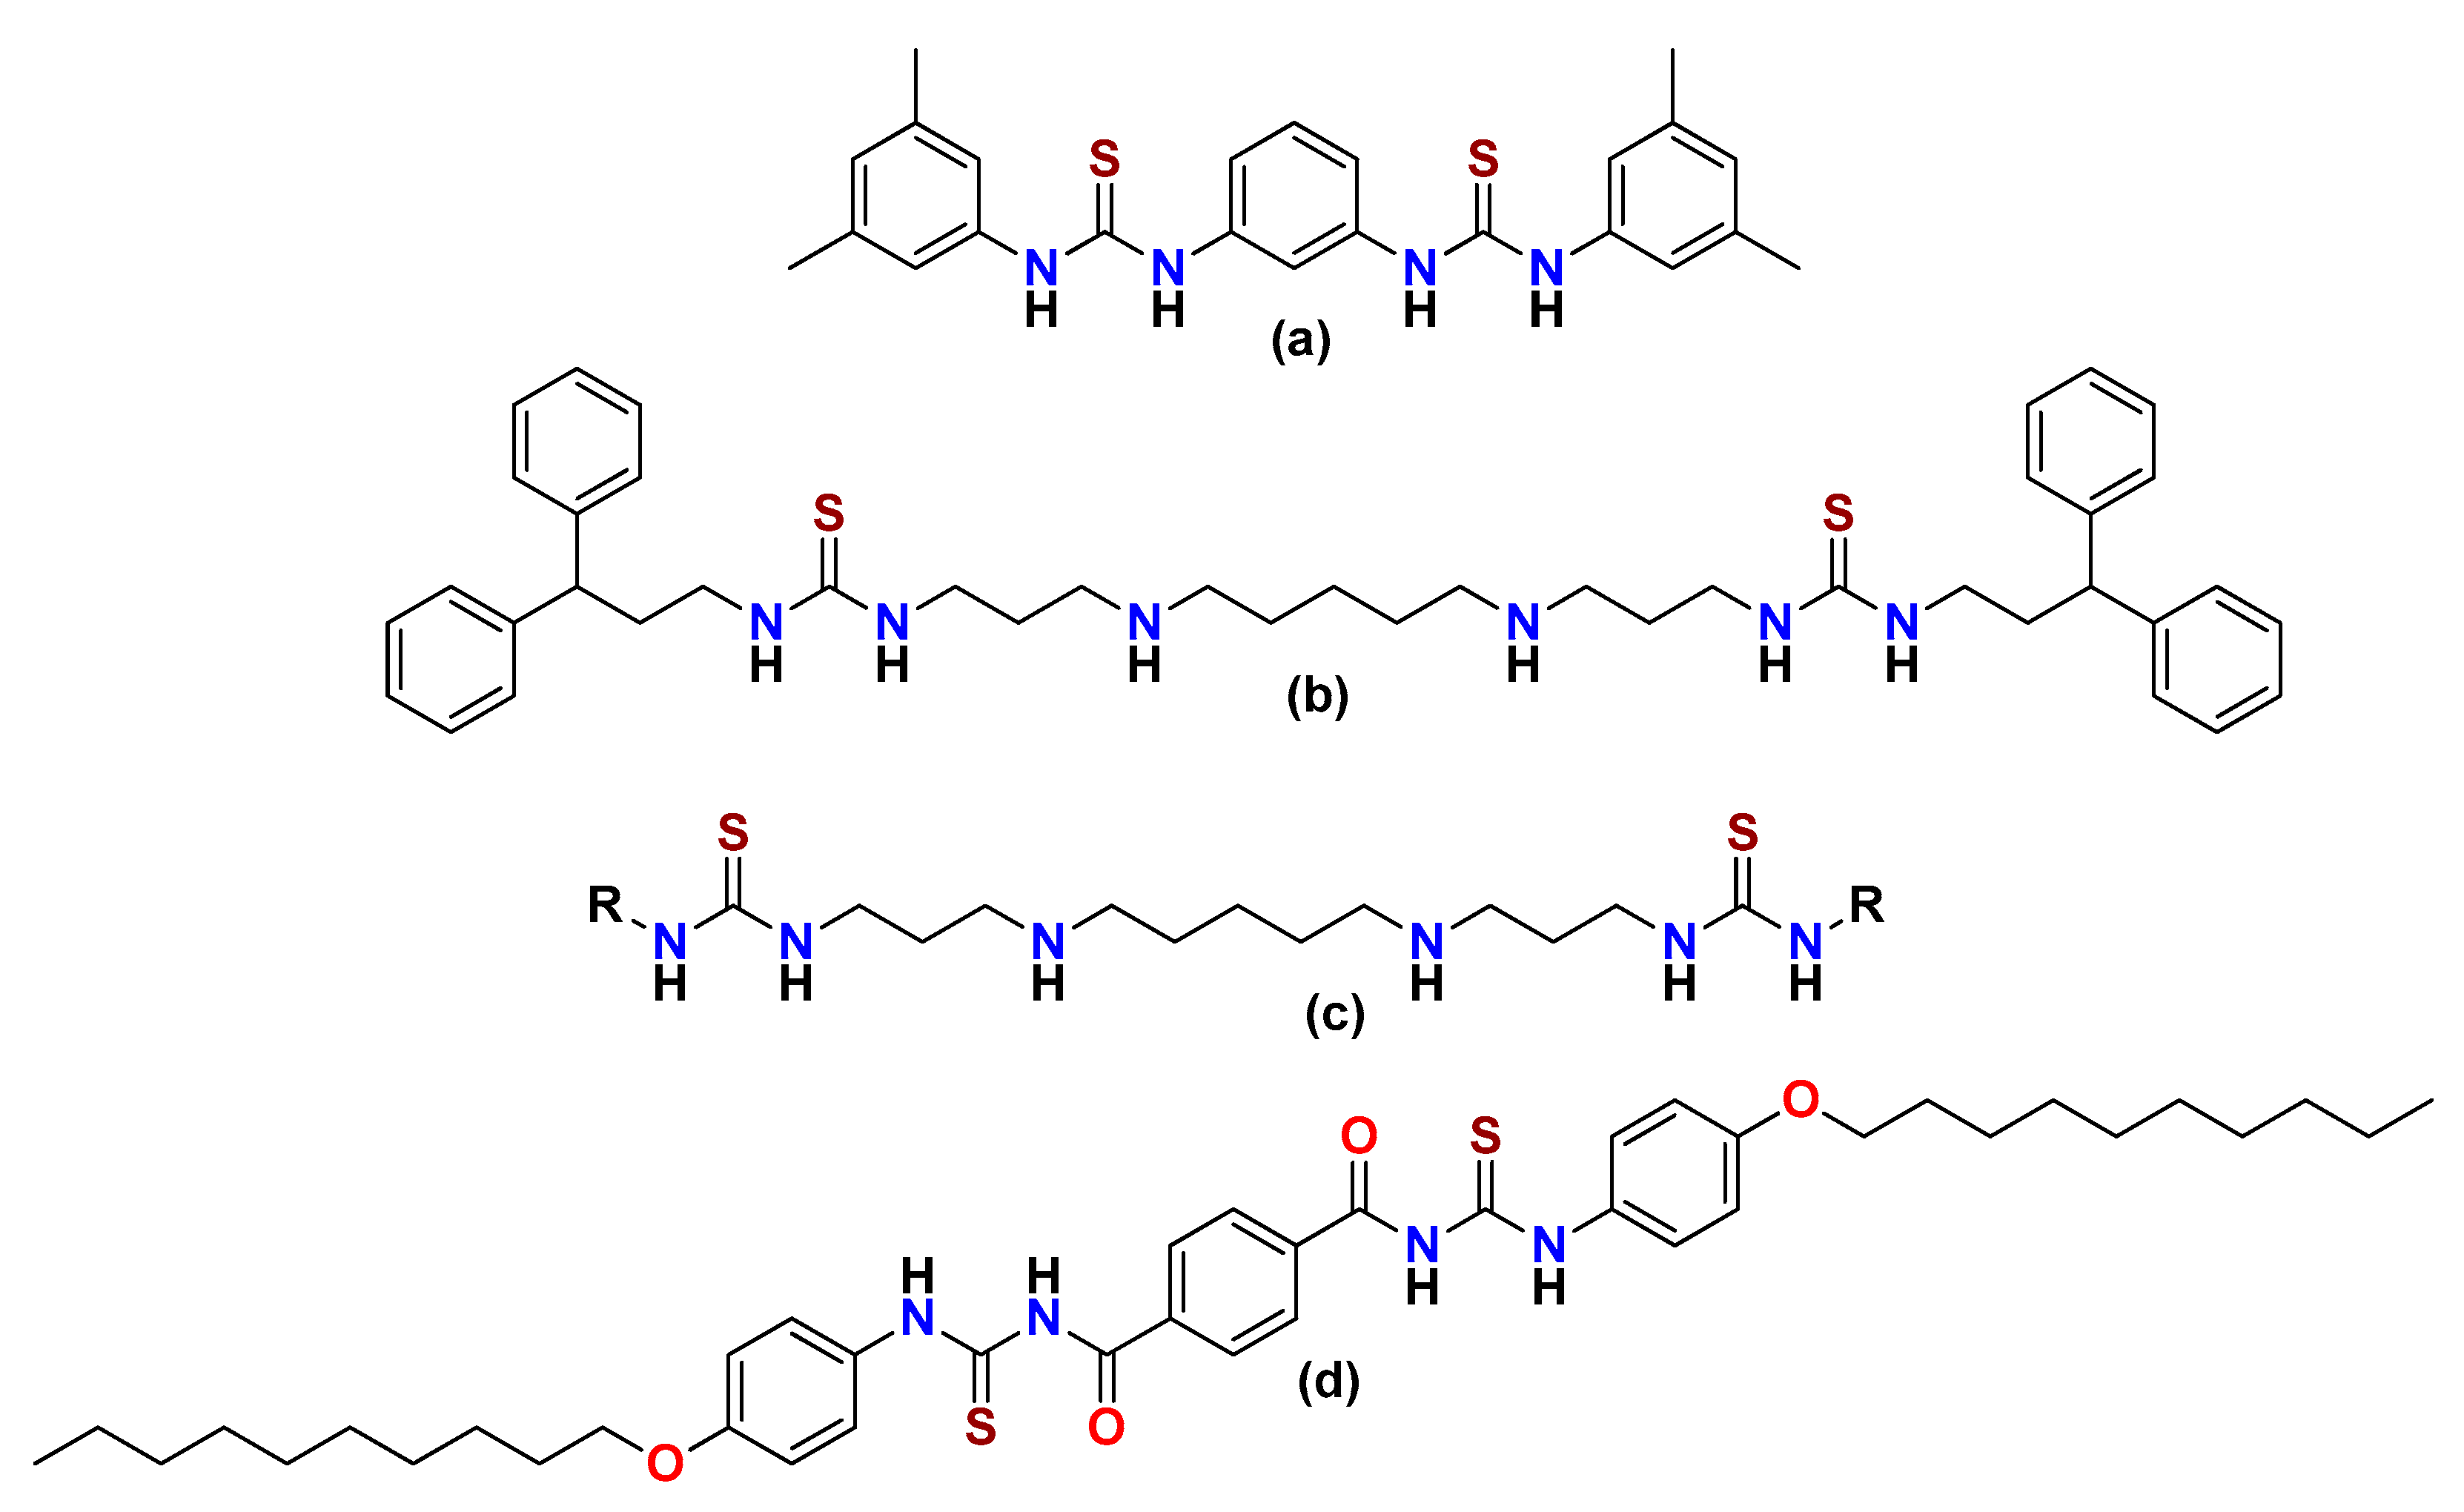
:1. Introduction
2. Results and Discussion
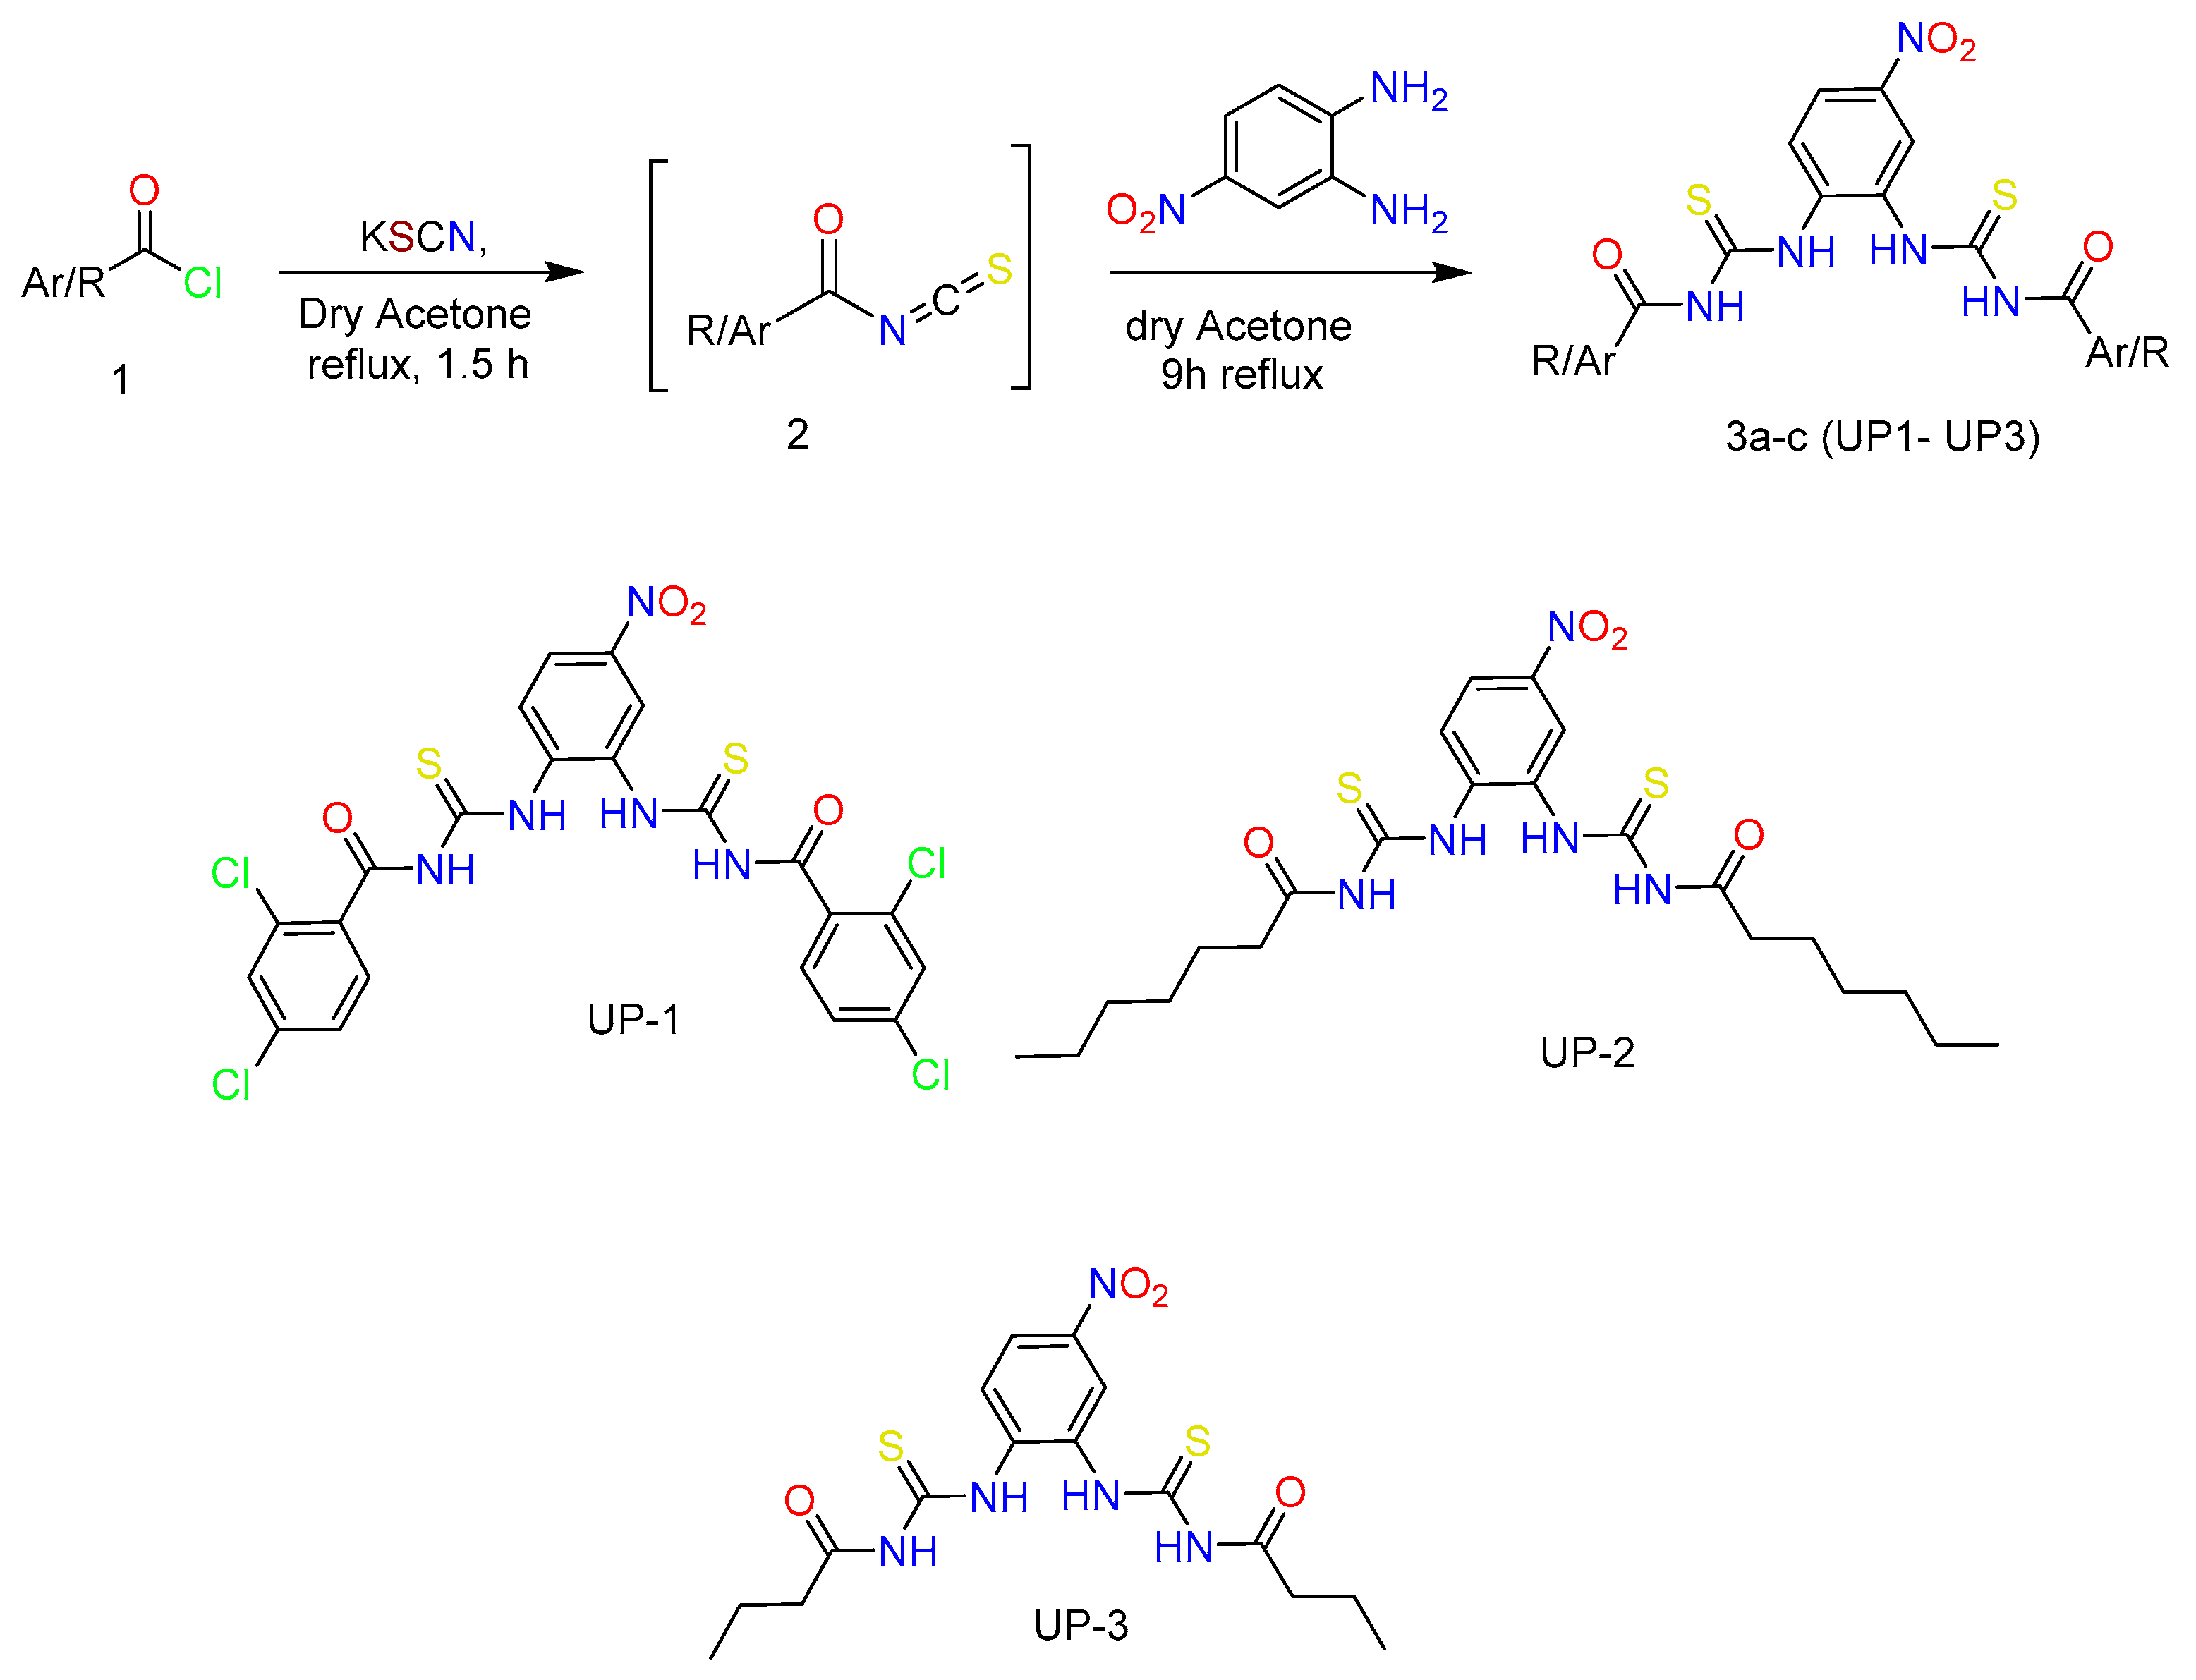
2.1. Chemistry of the Synthesized Bis-Thioureas
2.2. In Silico Investigations
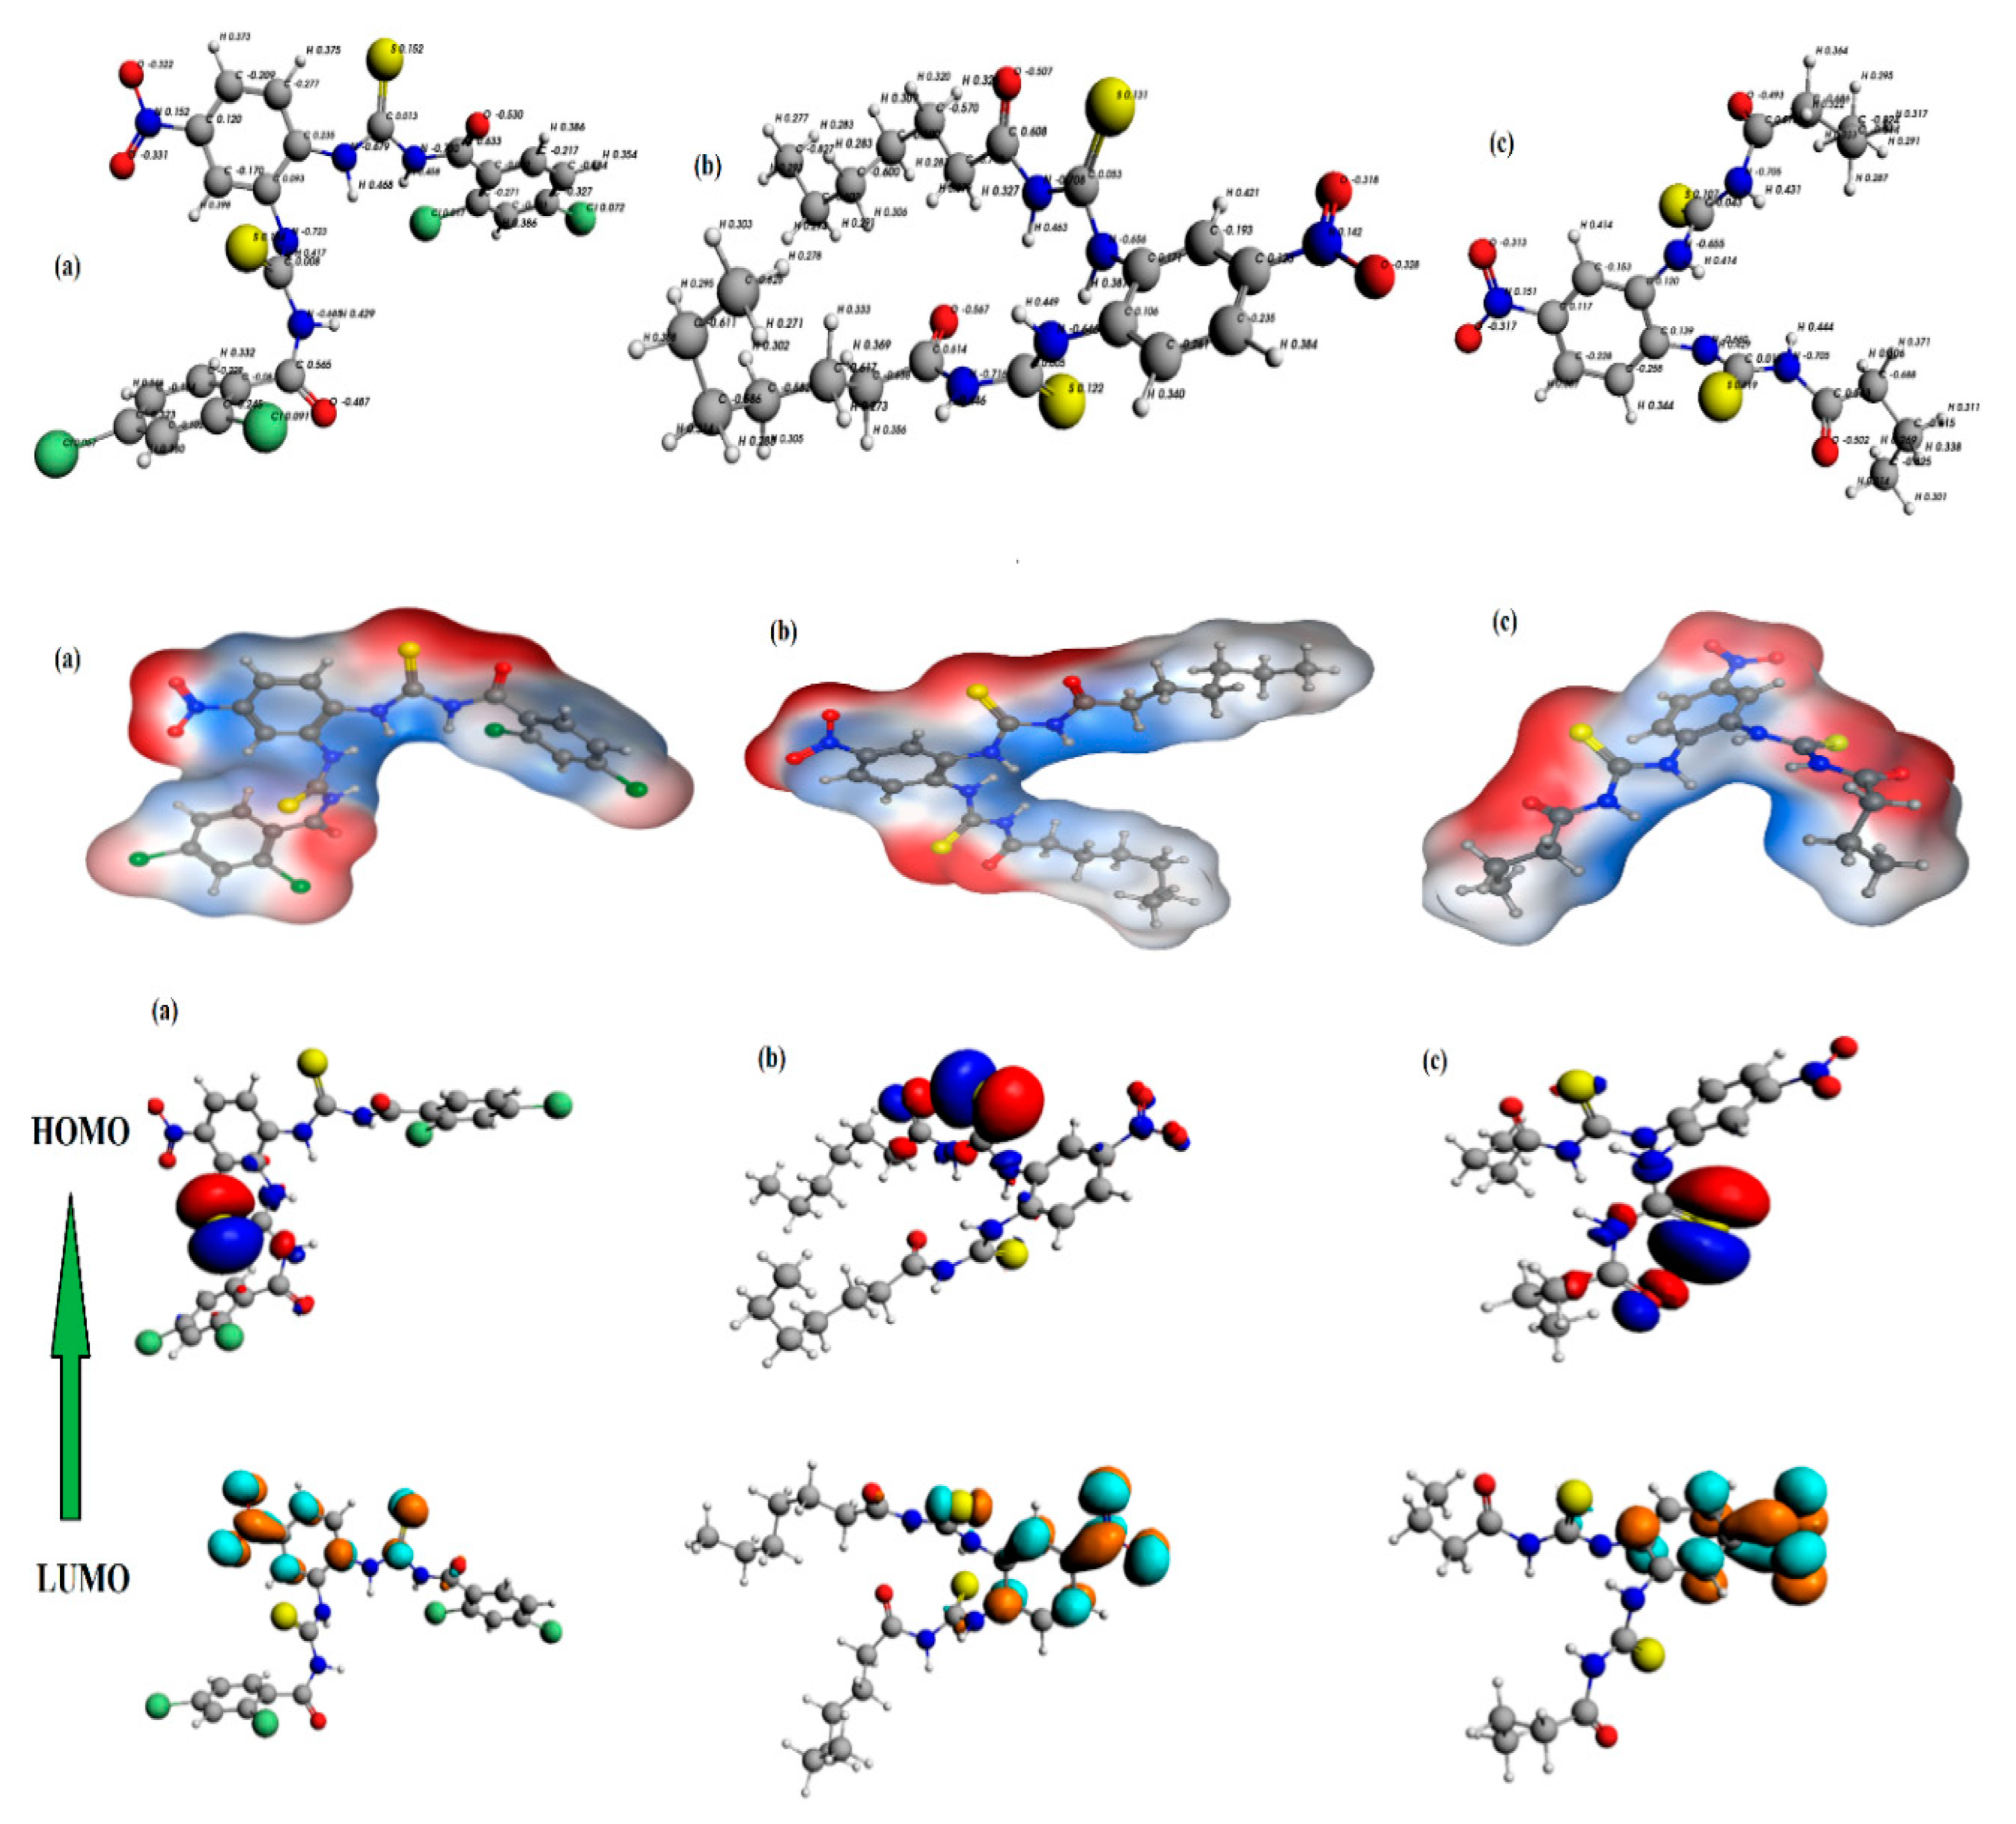
2.2.1. DFT Studies
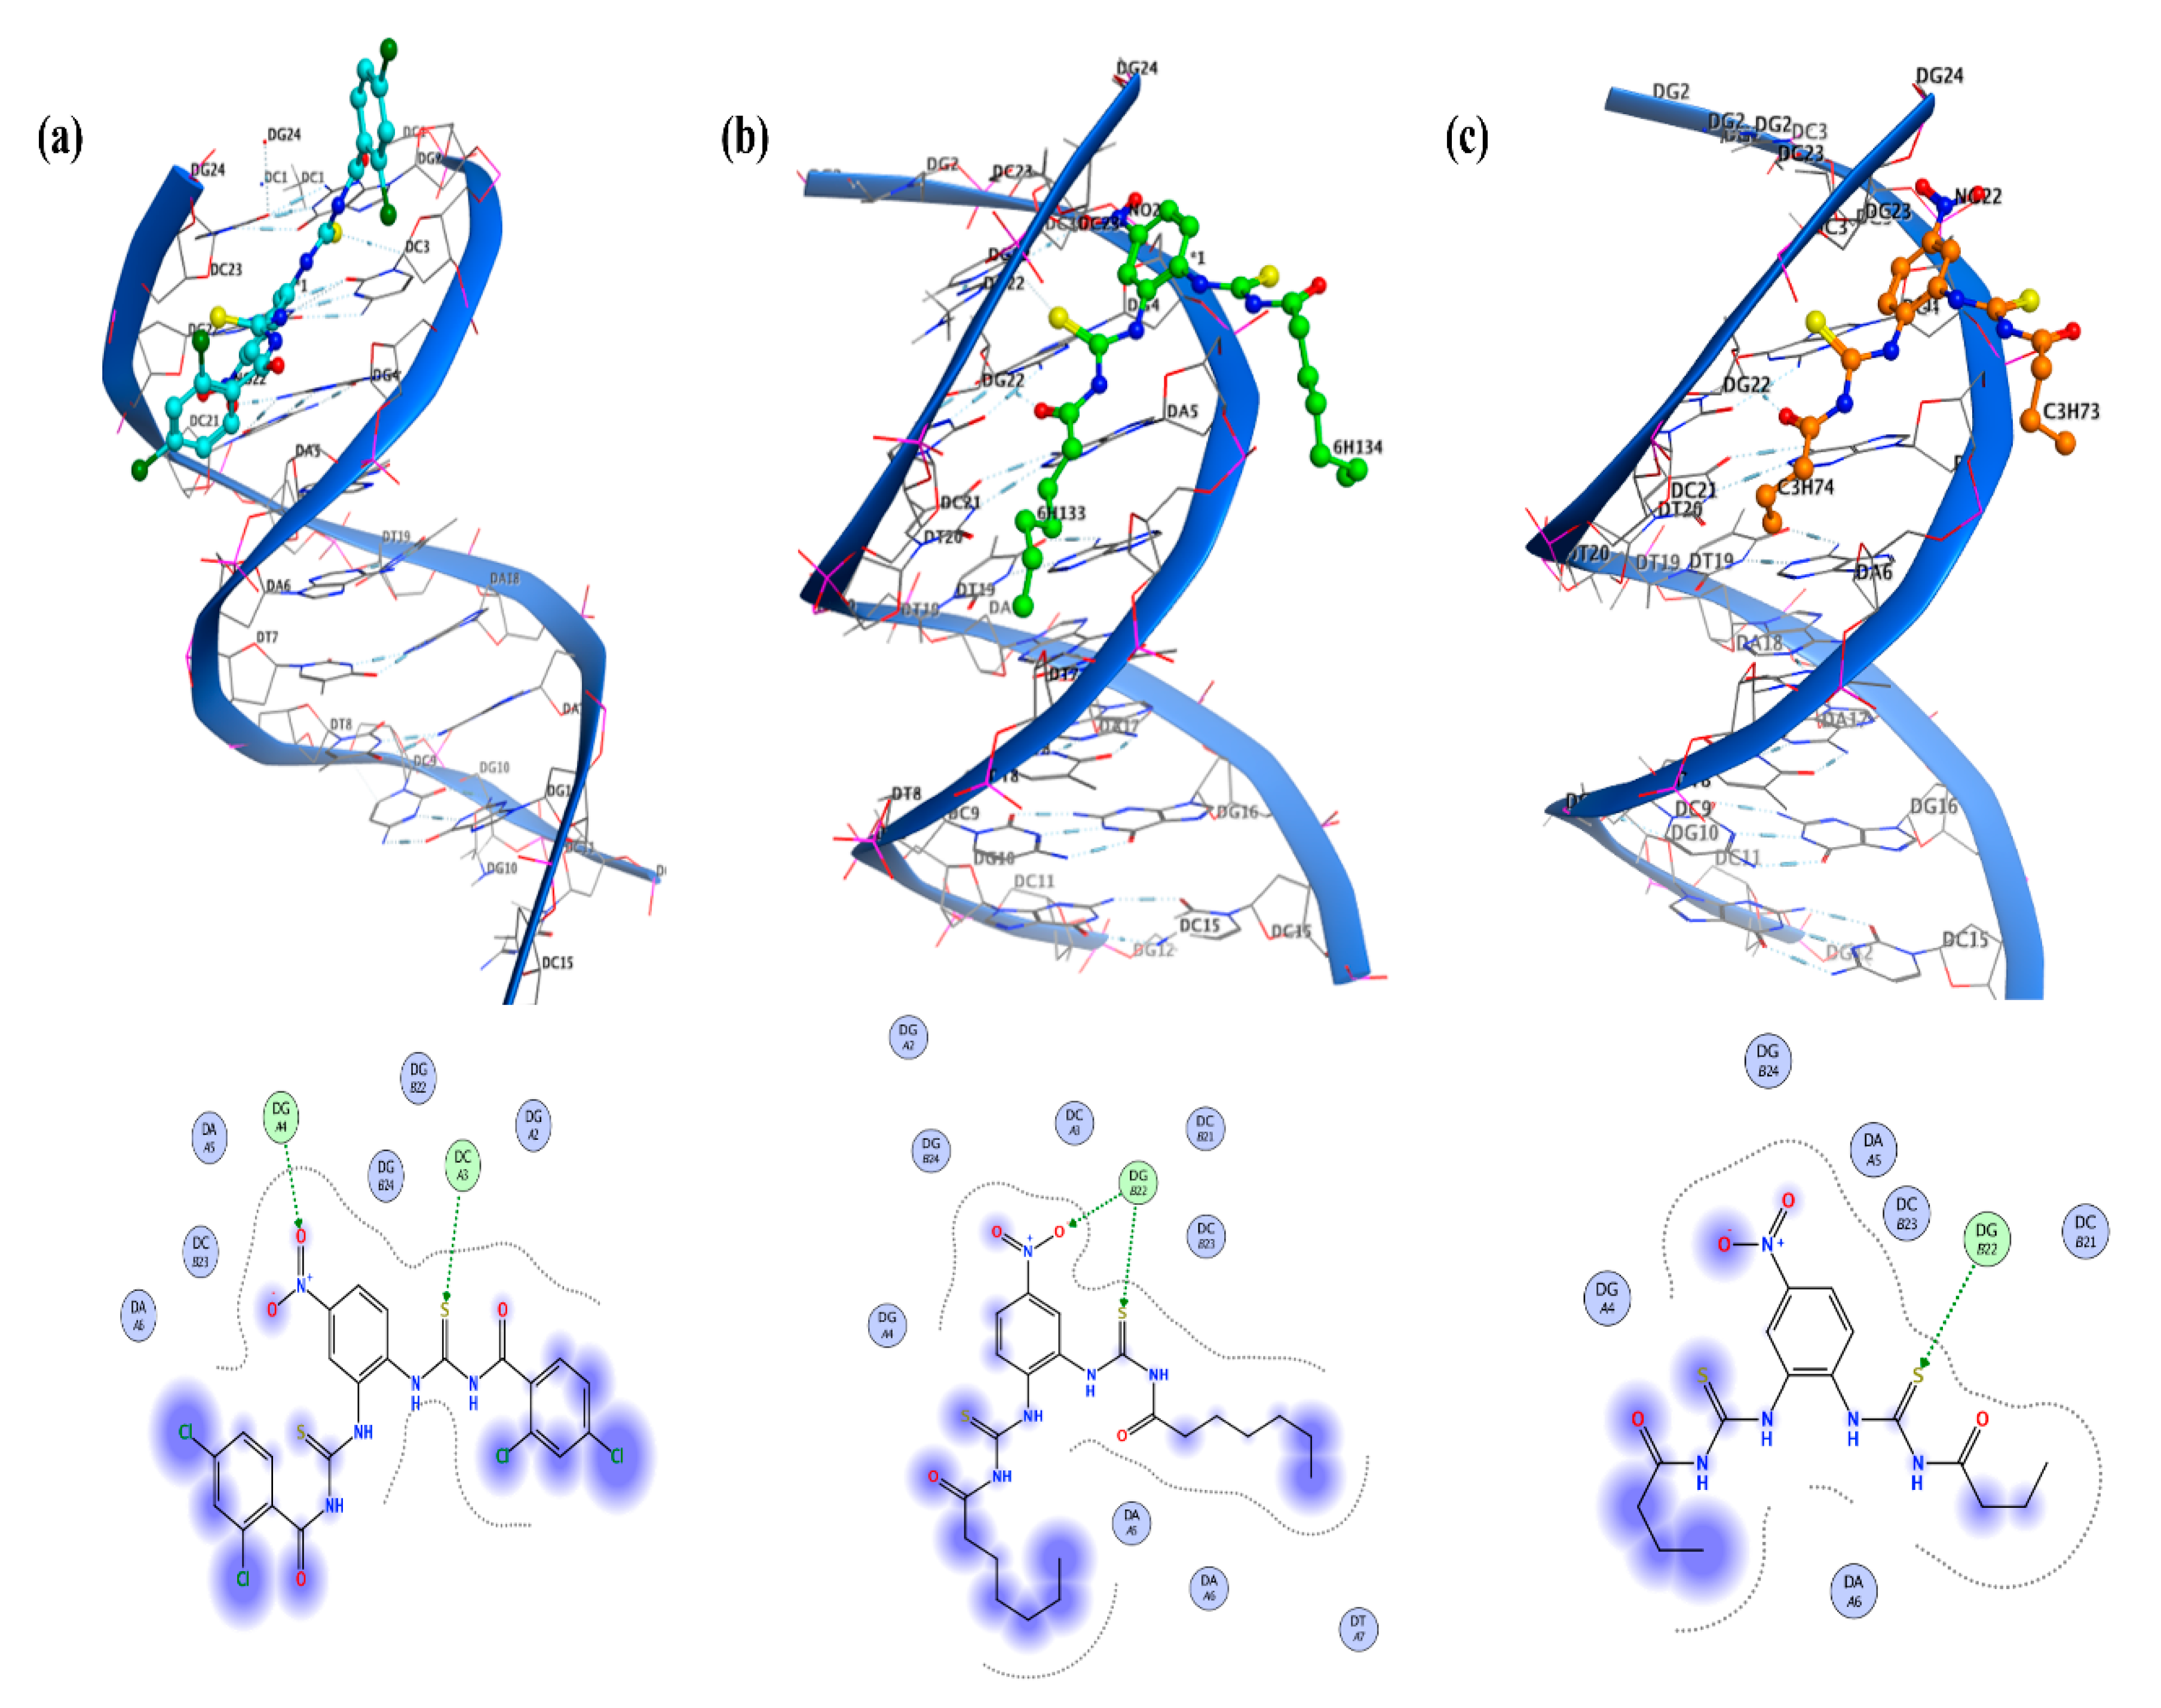
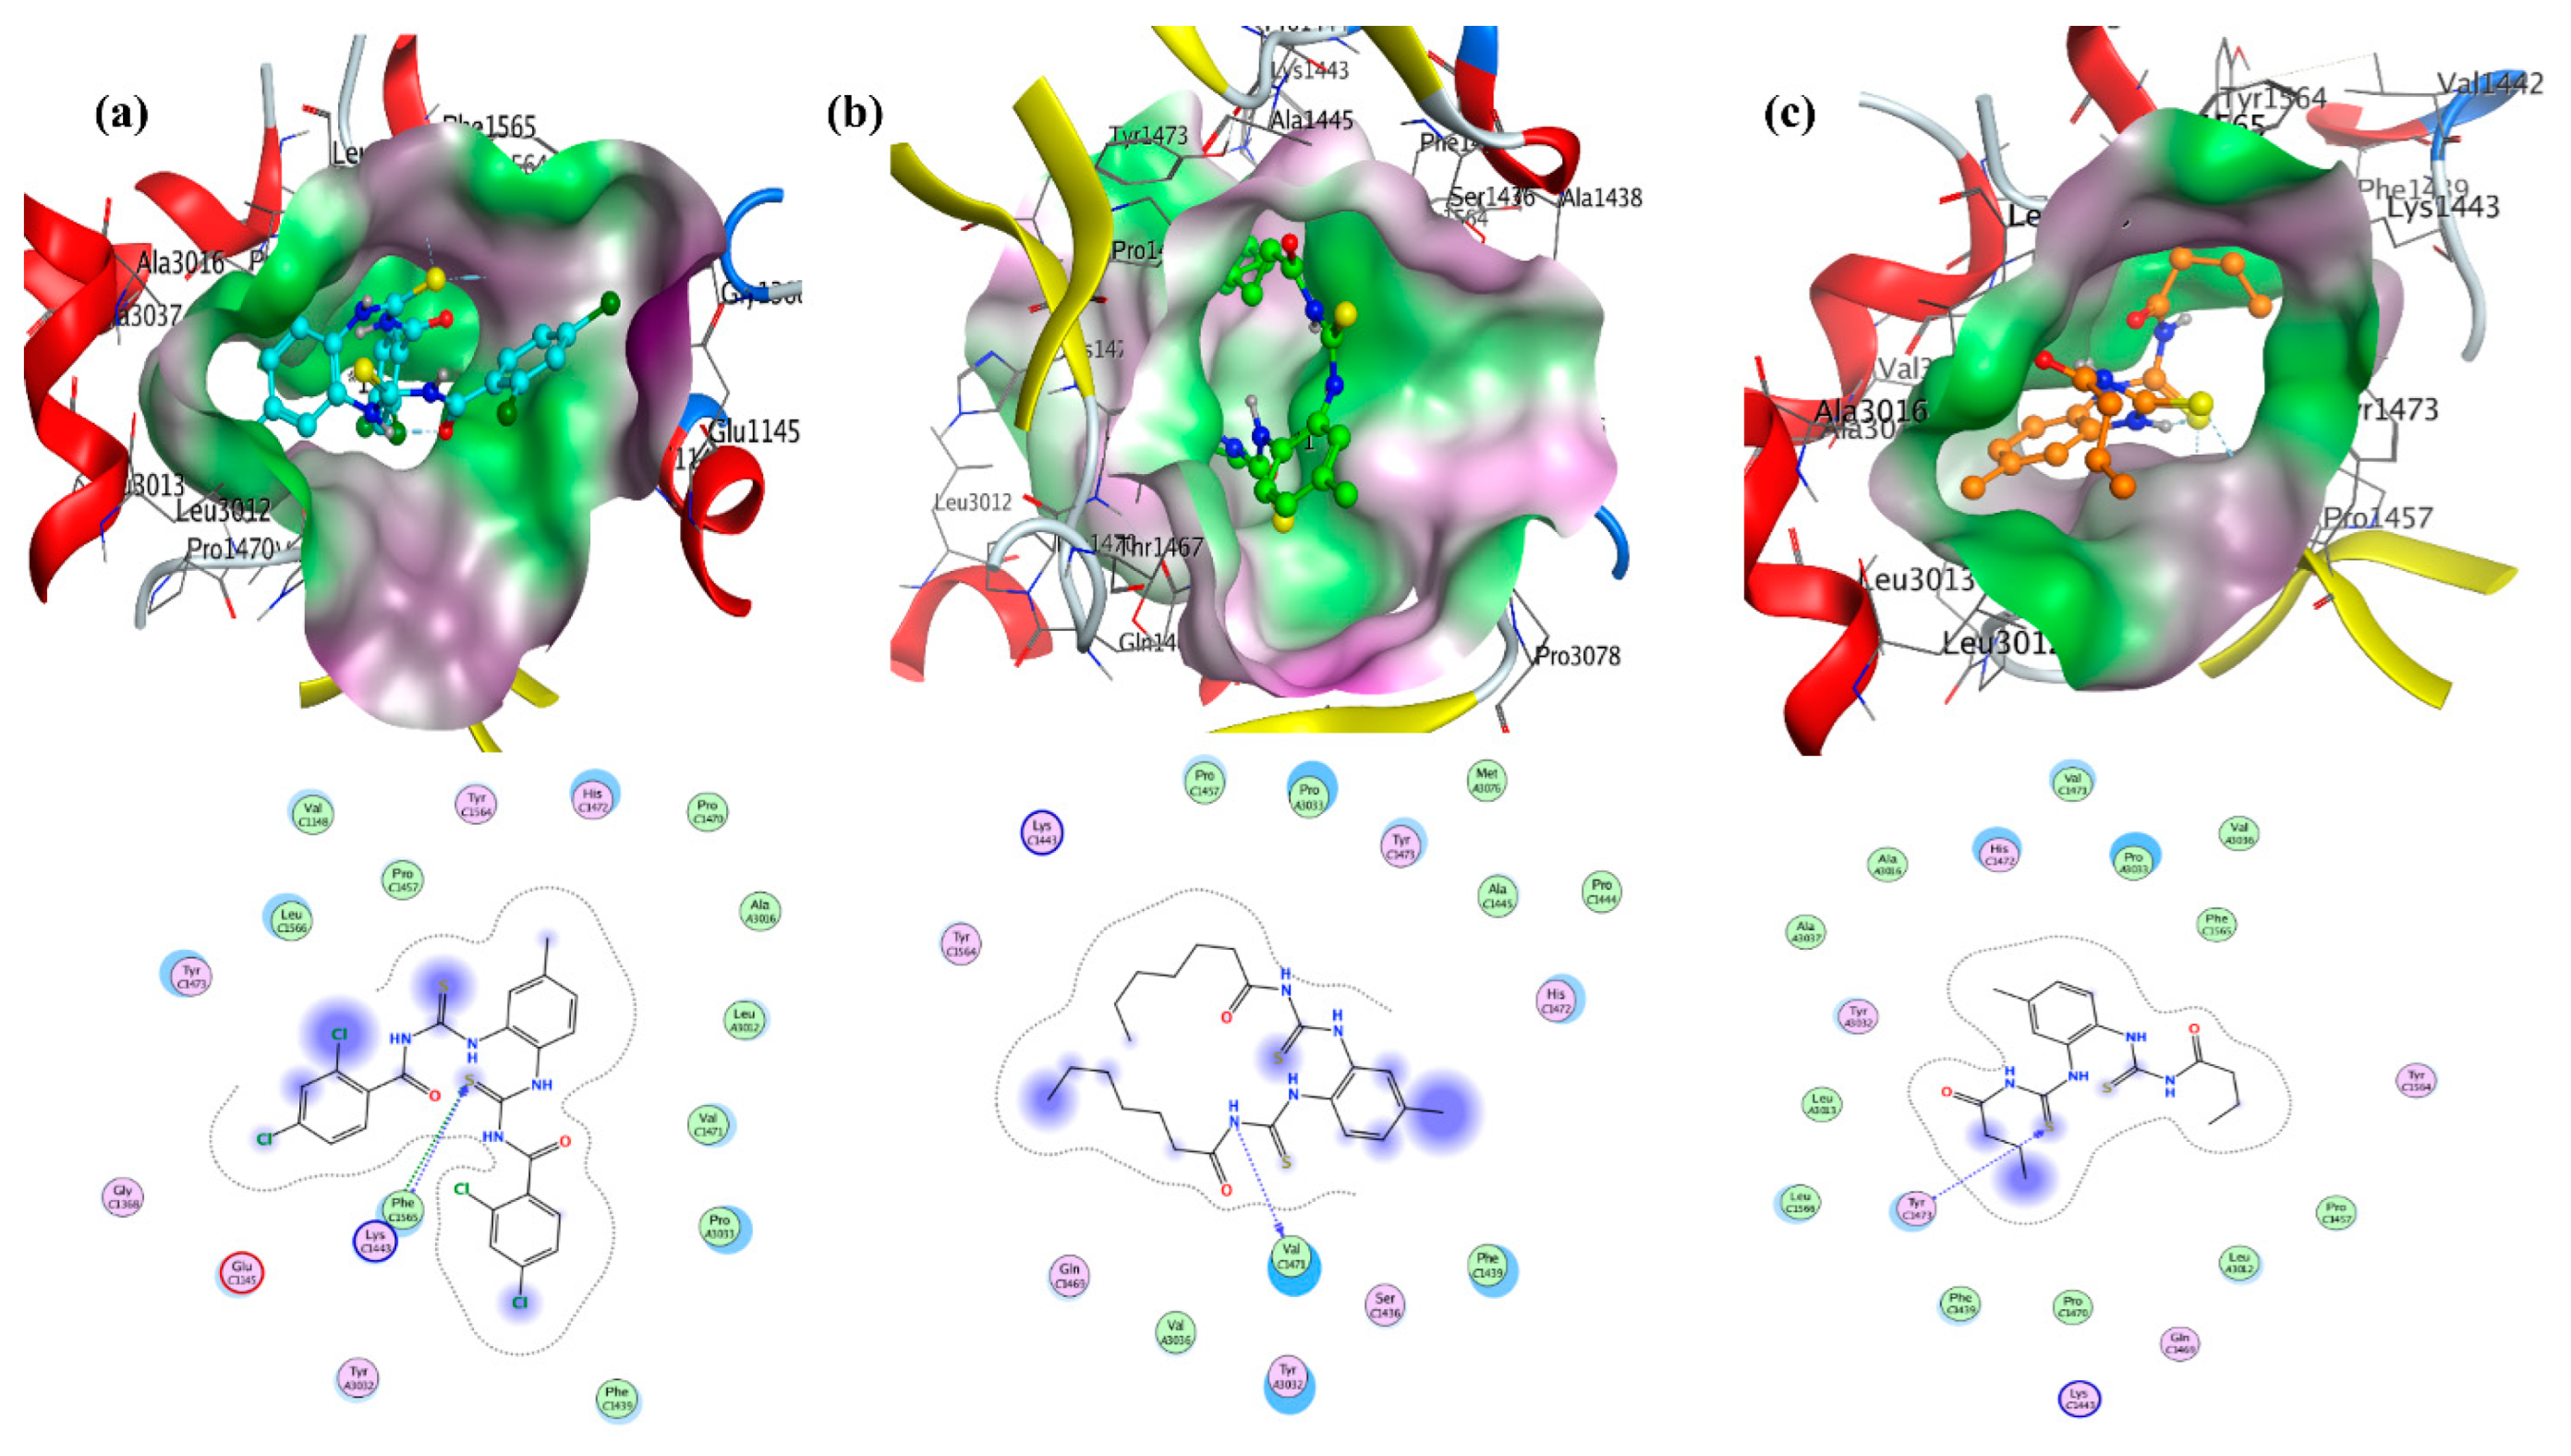
2.2.2. Molecular Docking—DNA Binding and Anti-Urease Activity
2.3. DNA Binding—Experimental Investigations
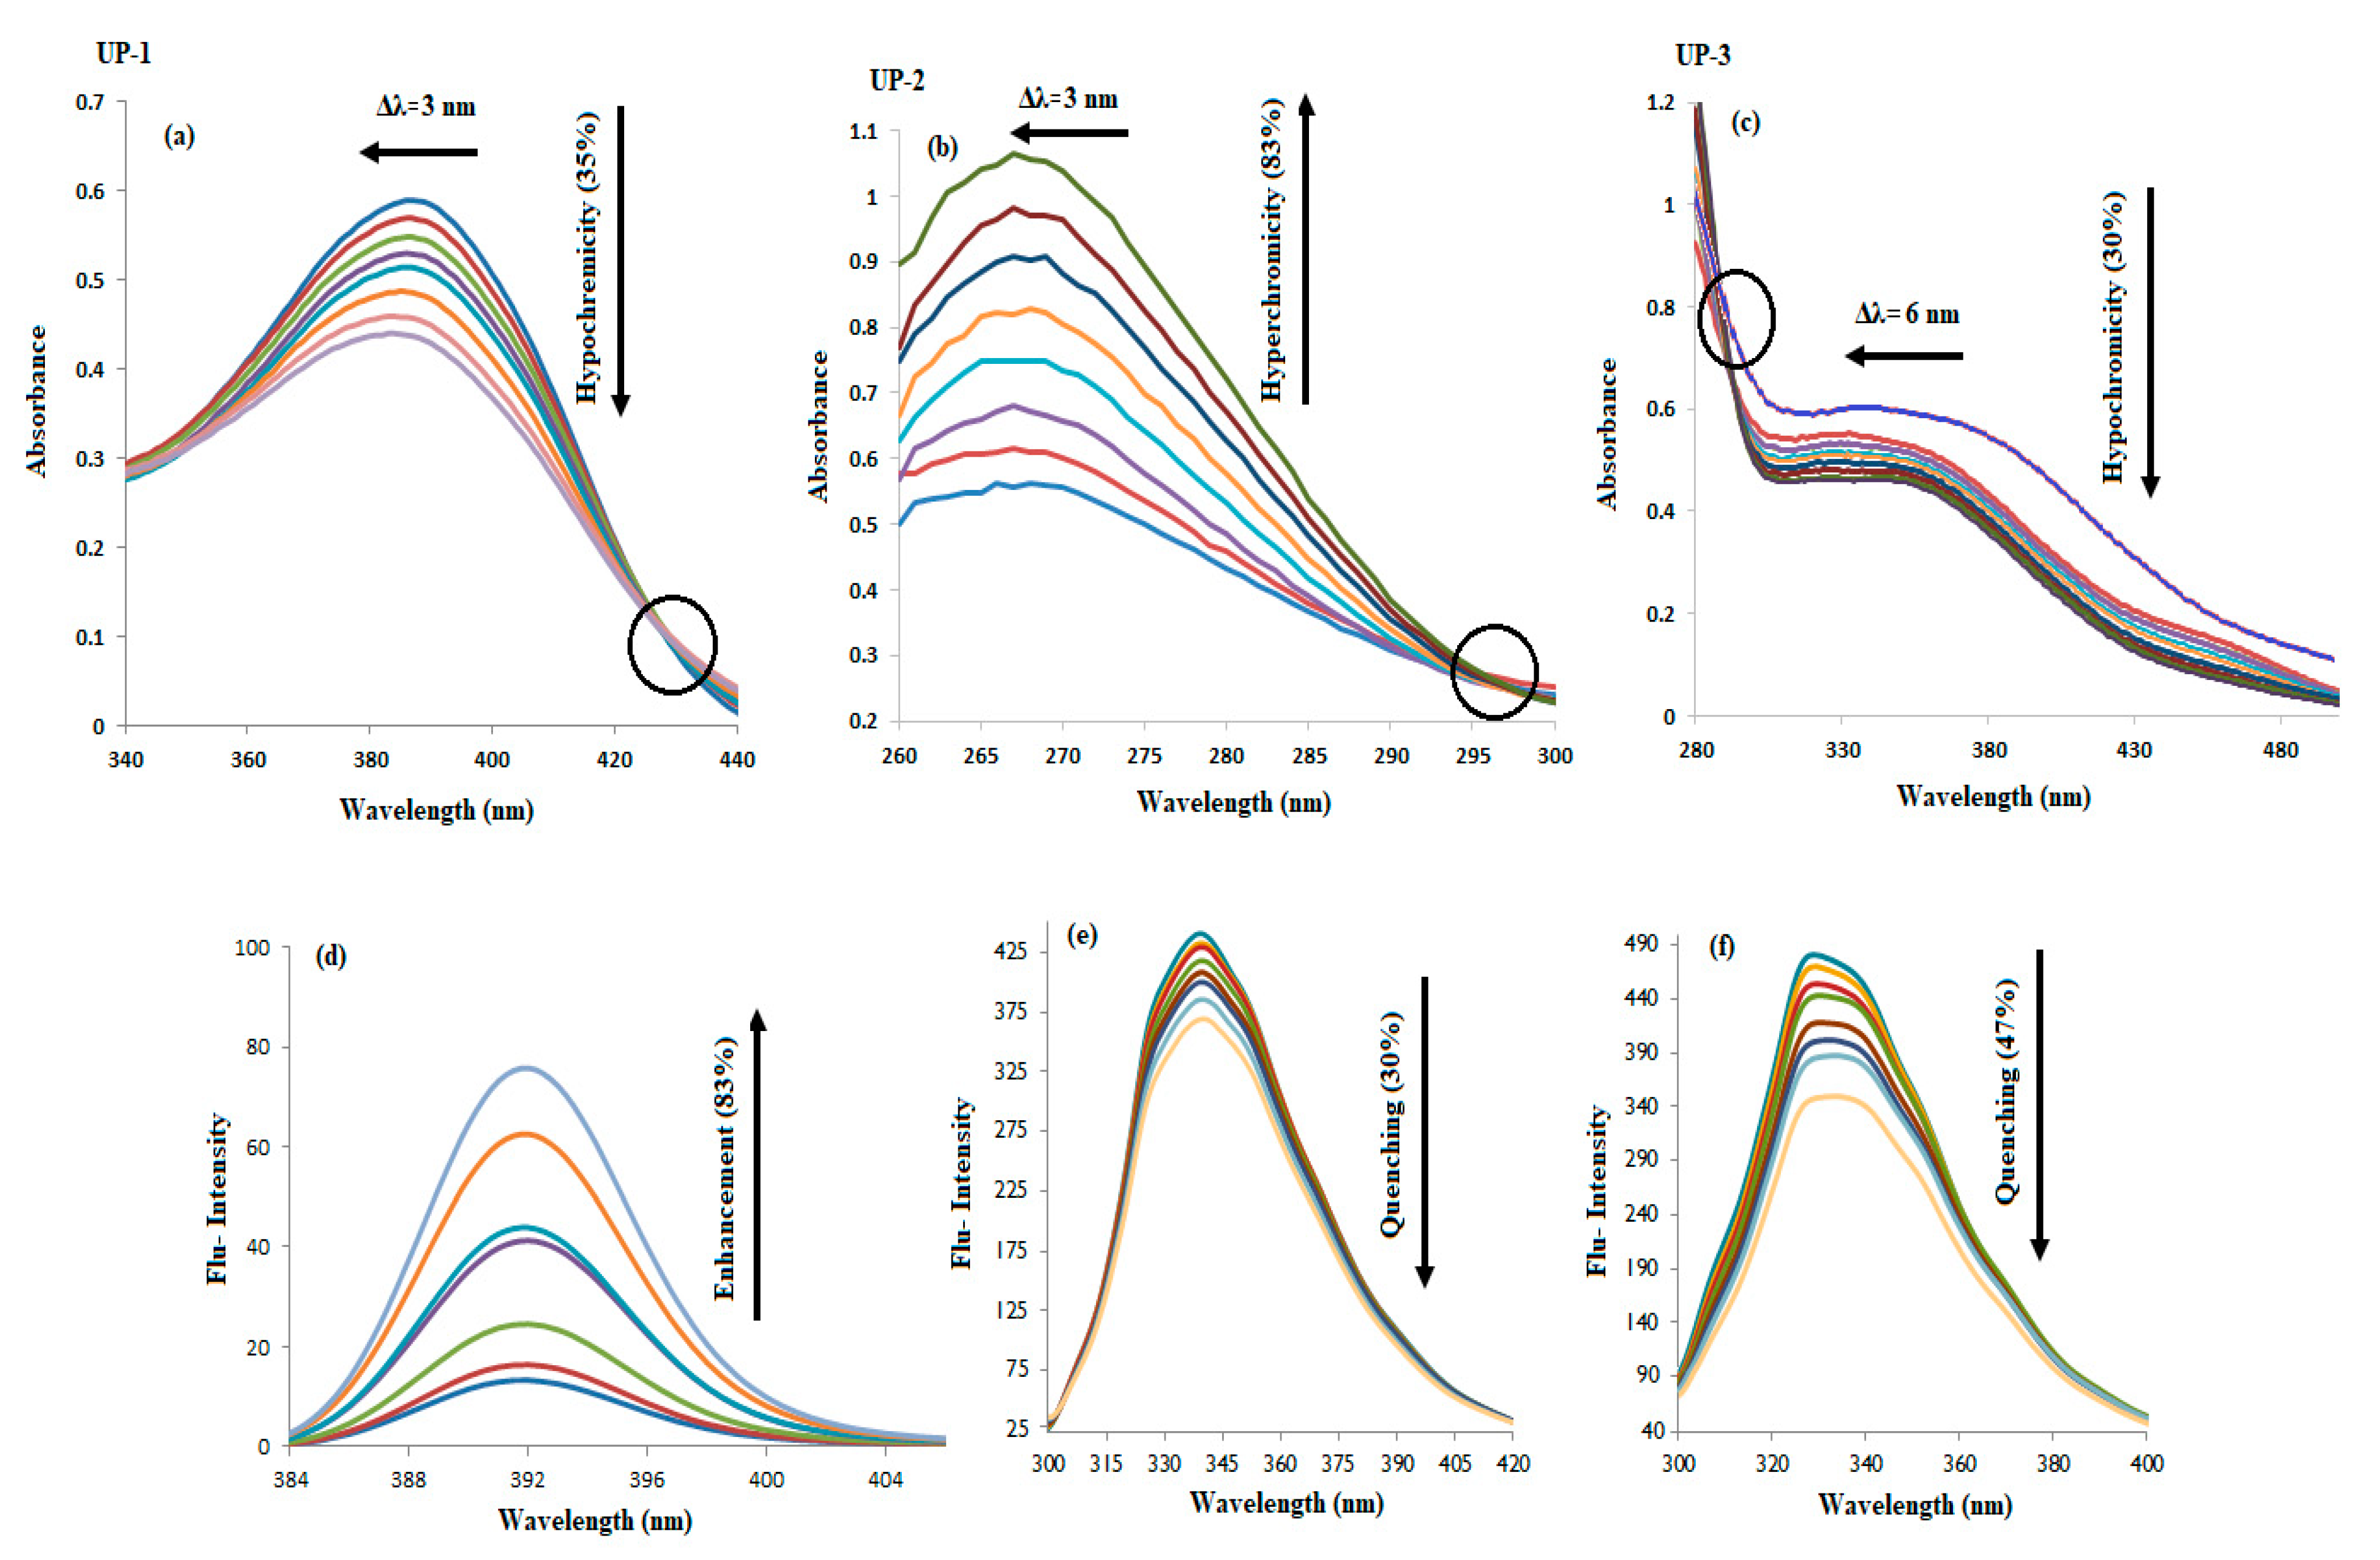
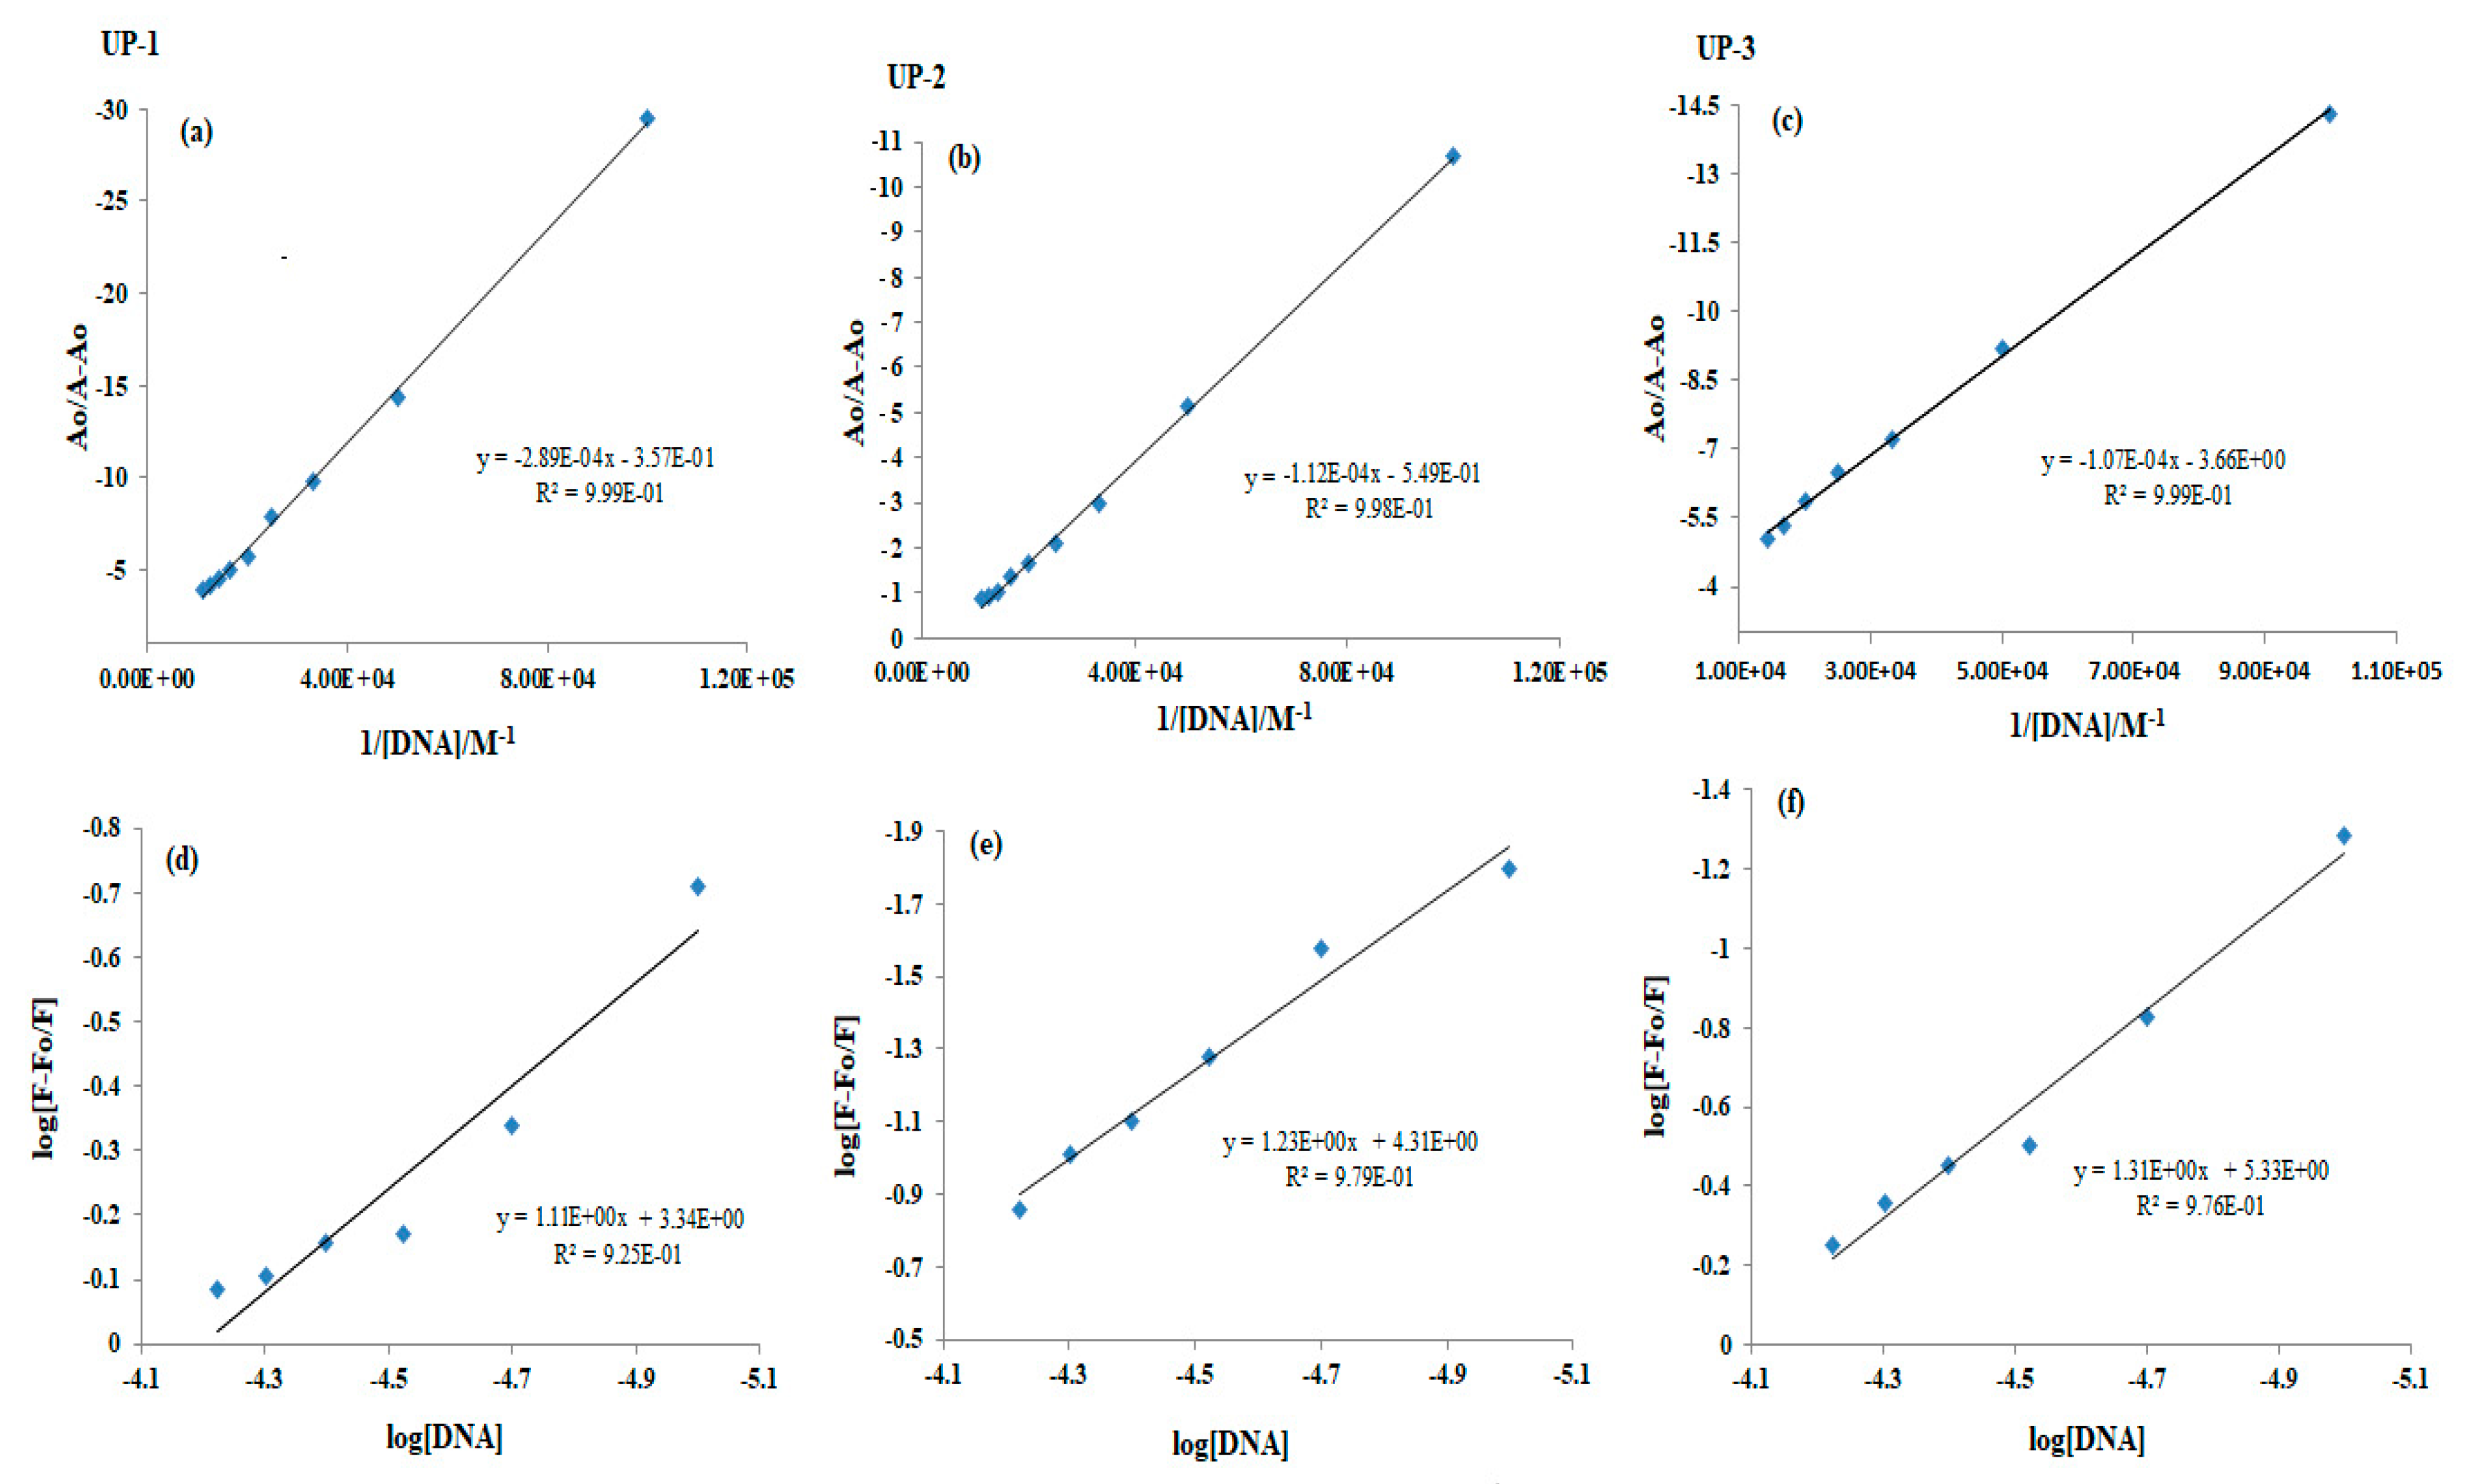
2.3.1. Spectral UV-Visible and Fluorescence Studies
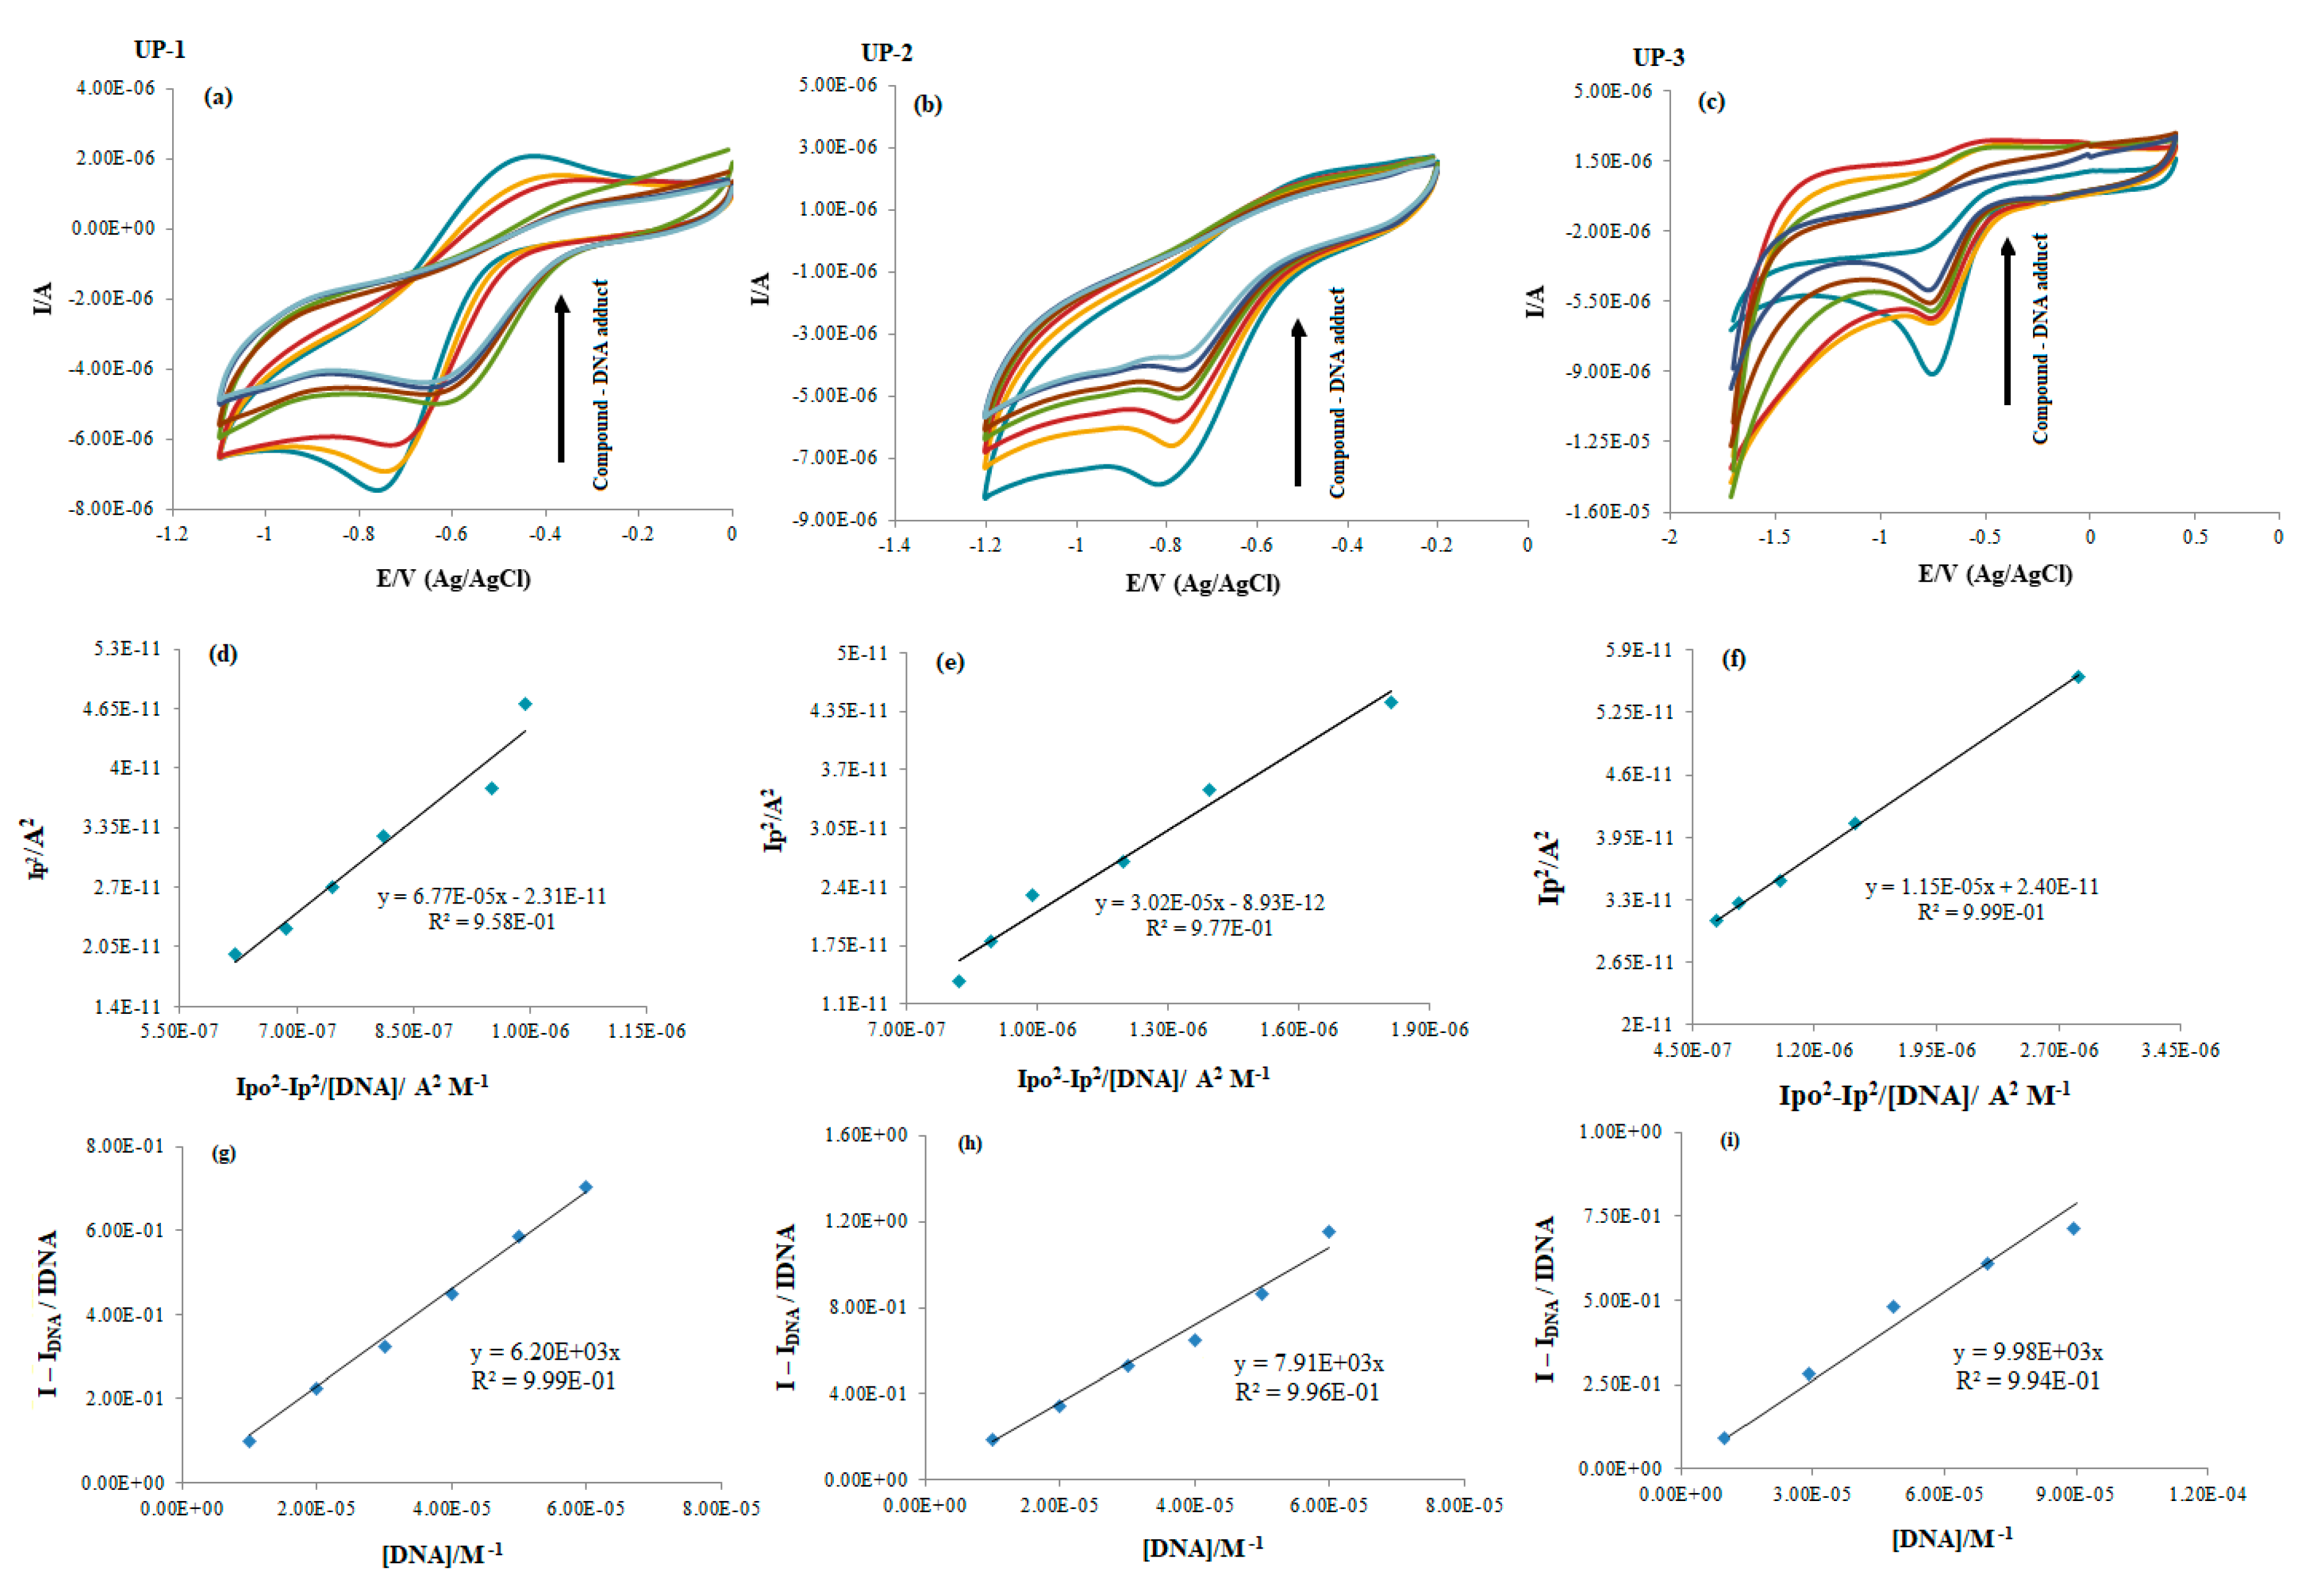
2.3.2. Electrochemical CV Studies
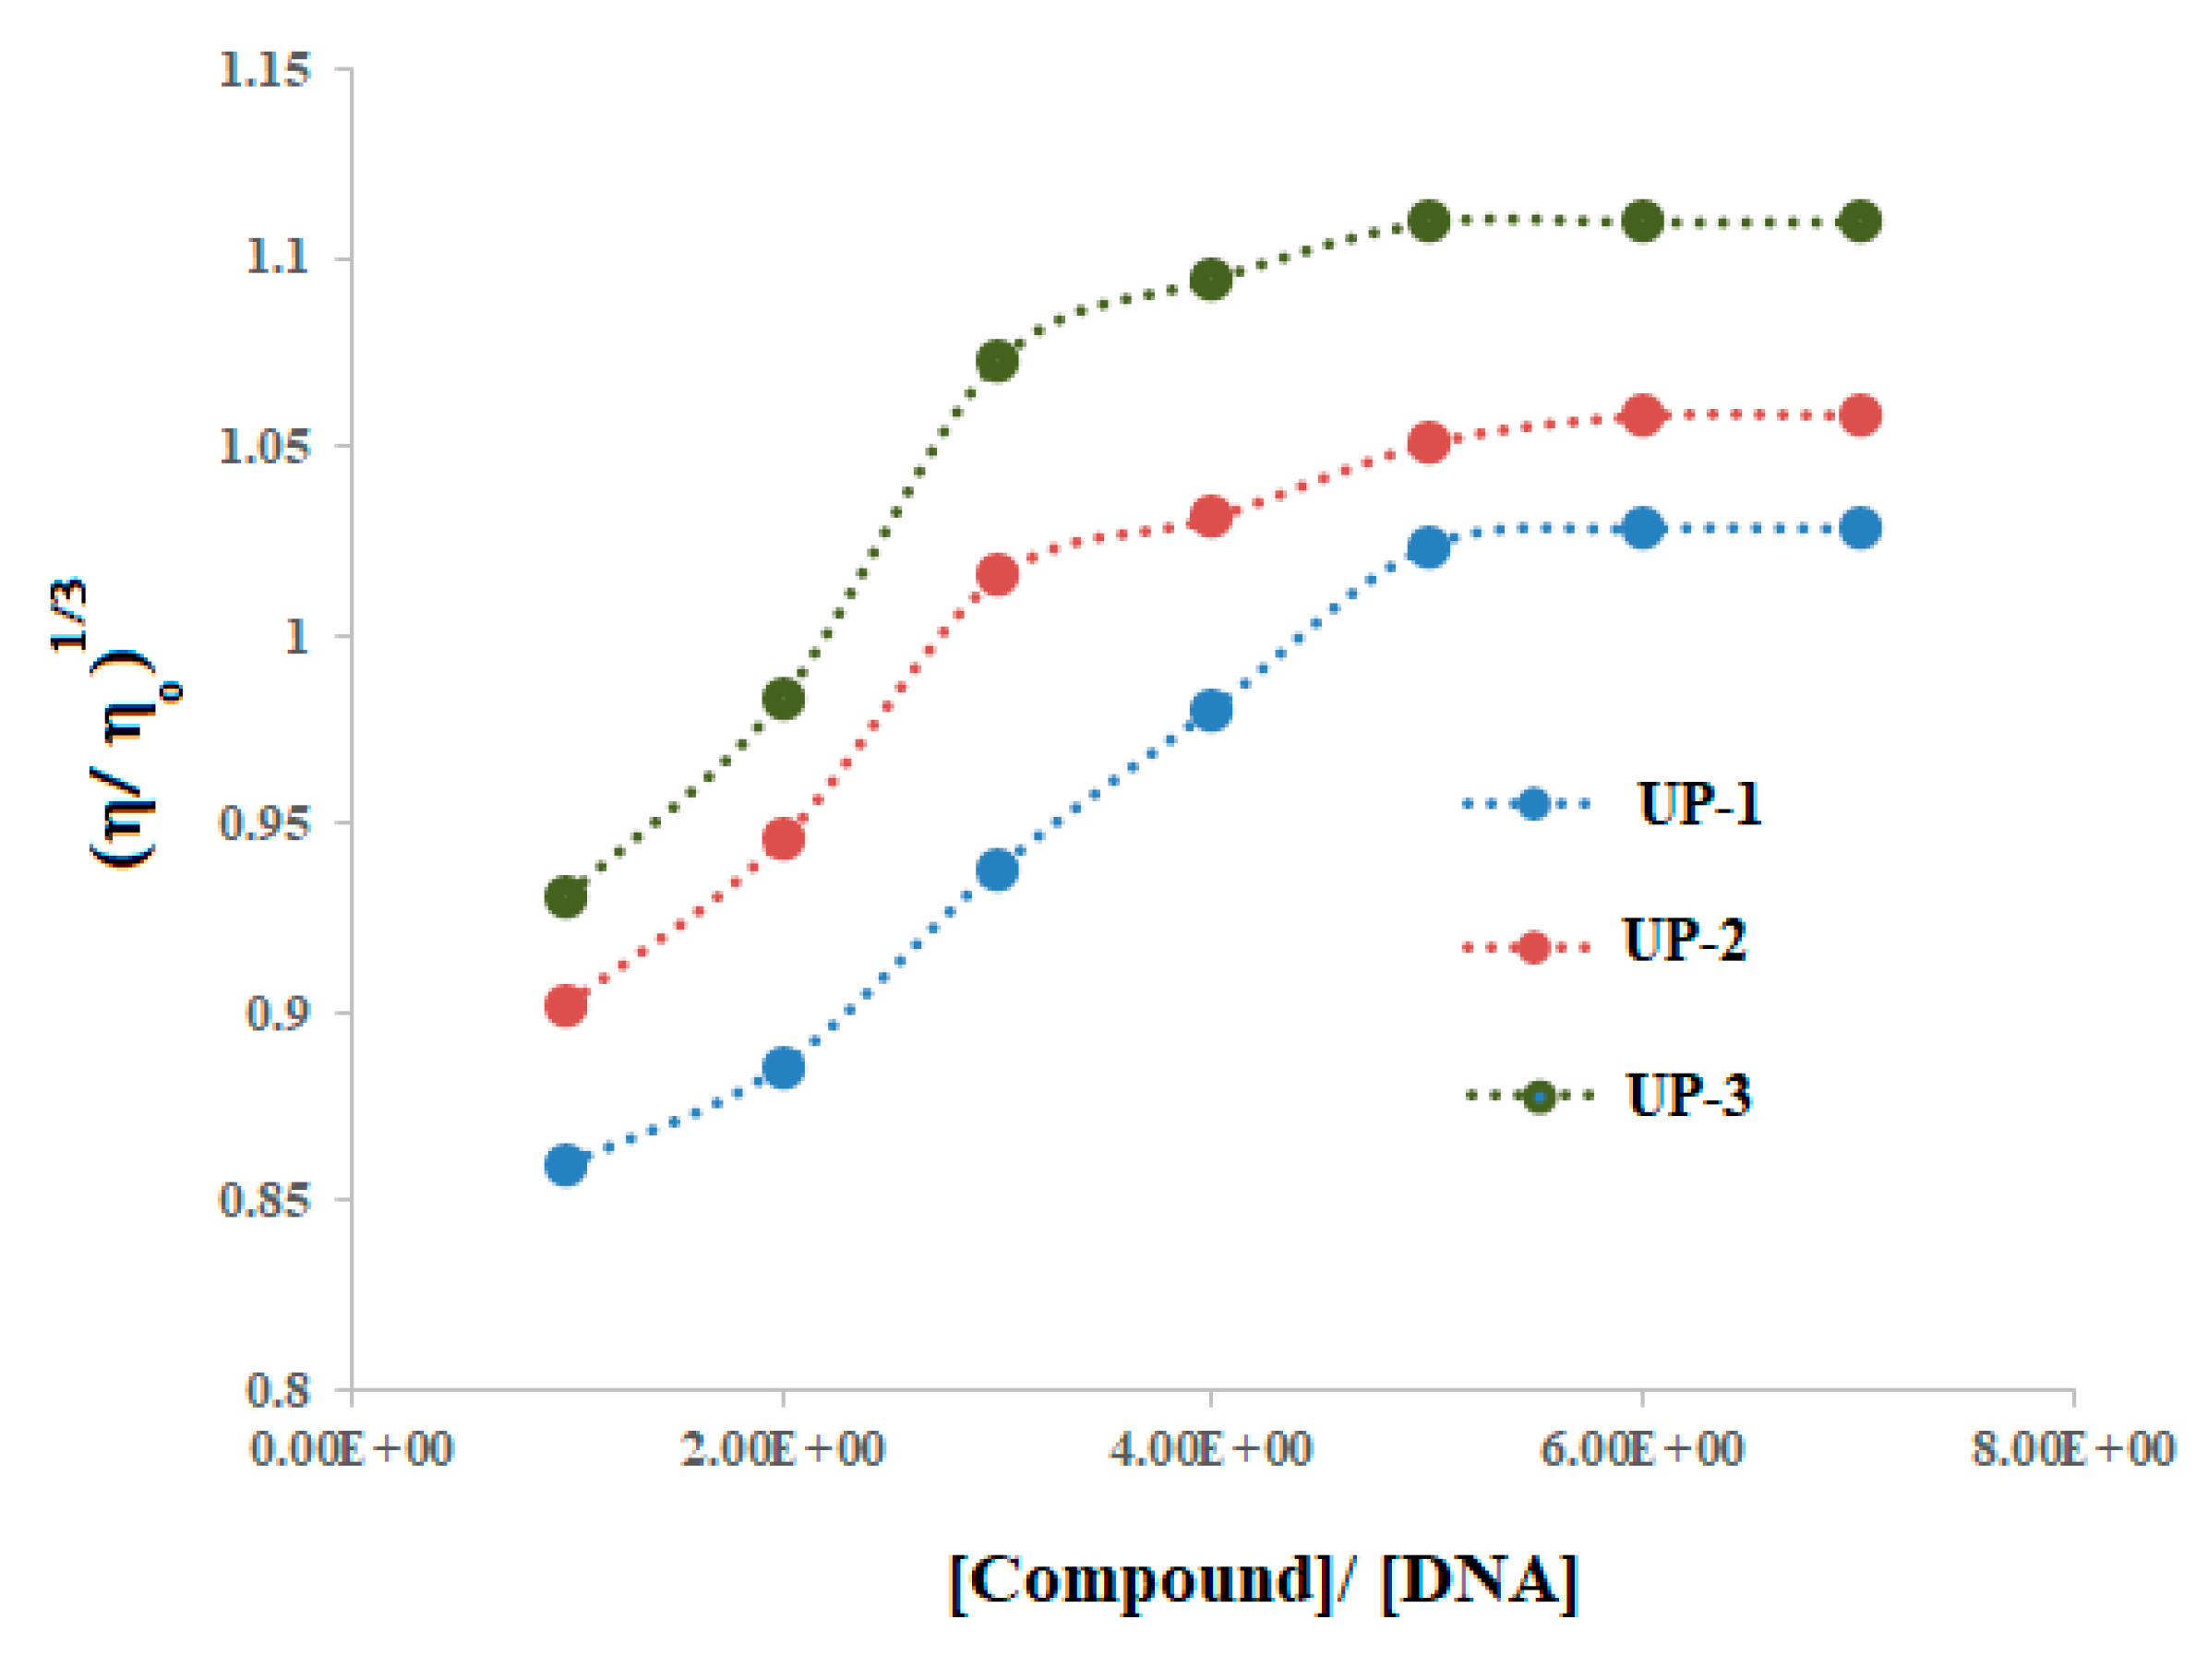
2.3.3. Viscosity Studies
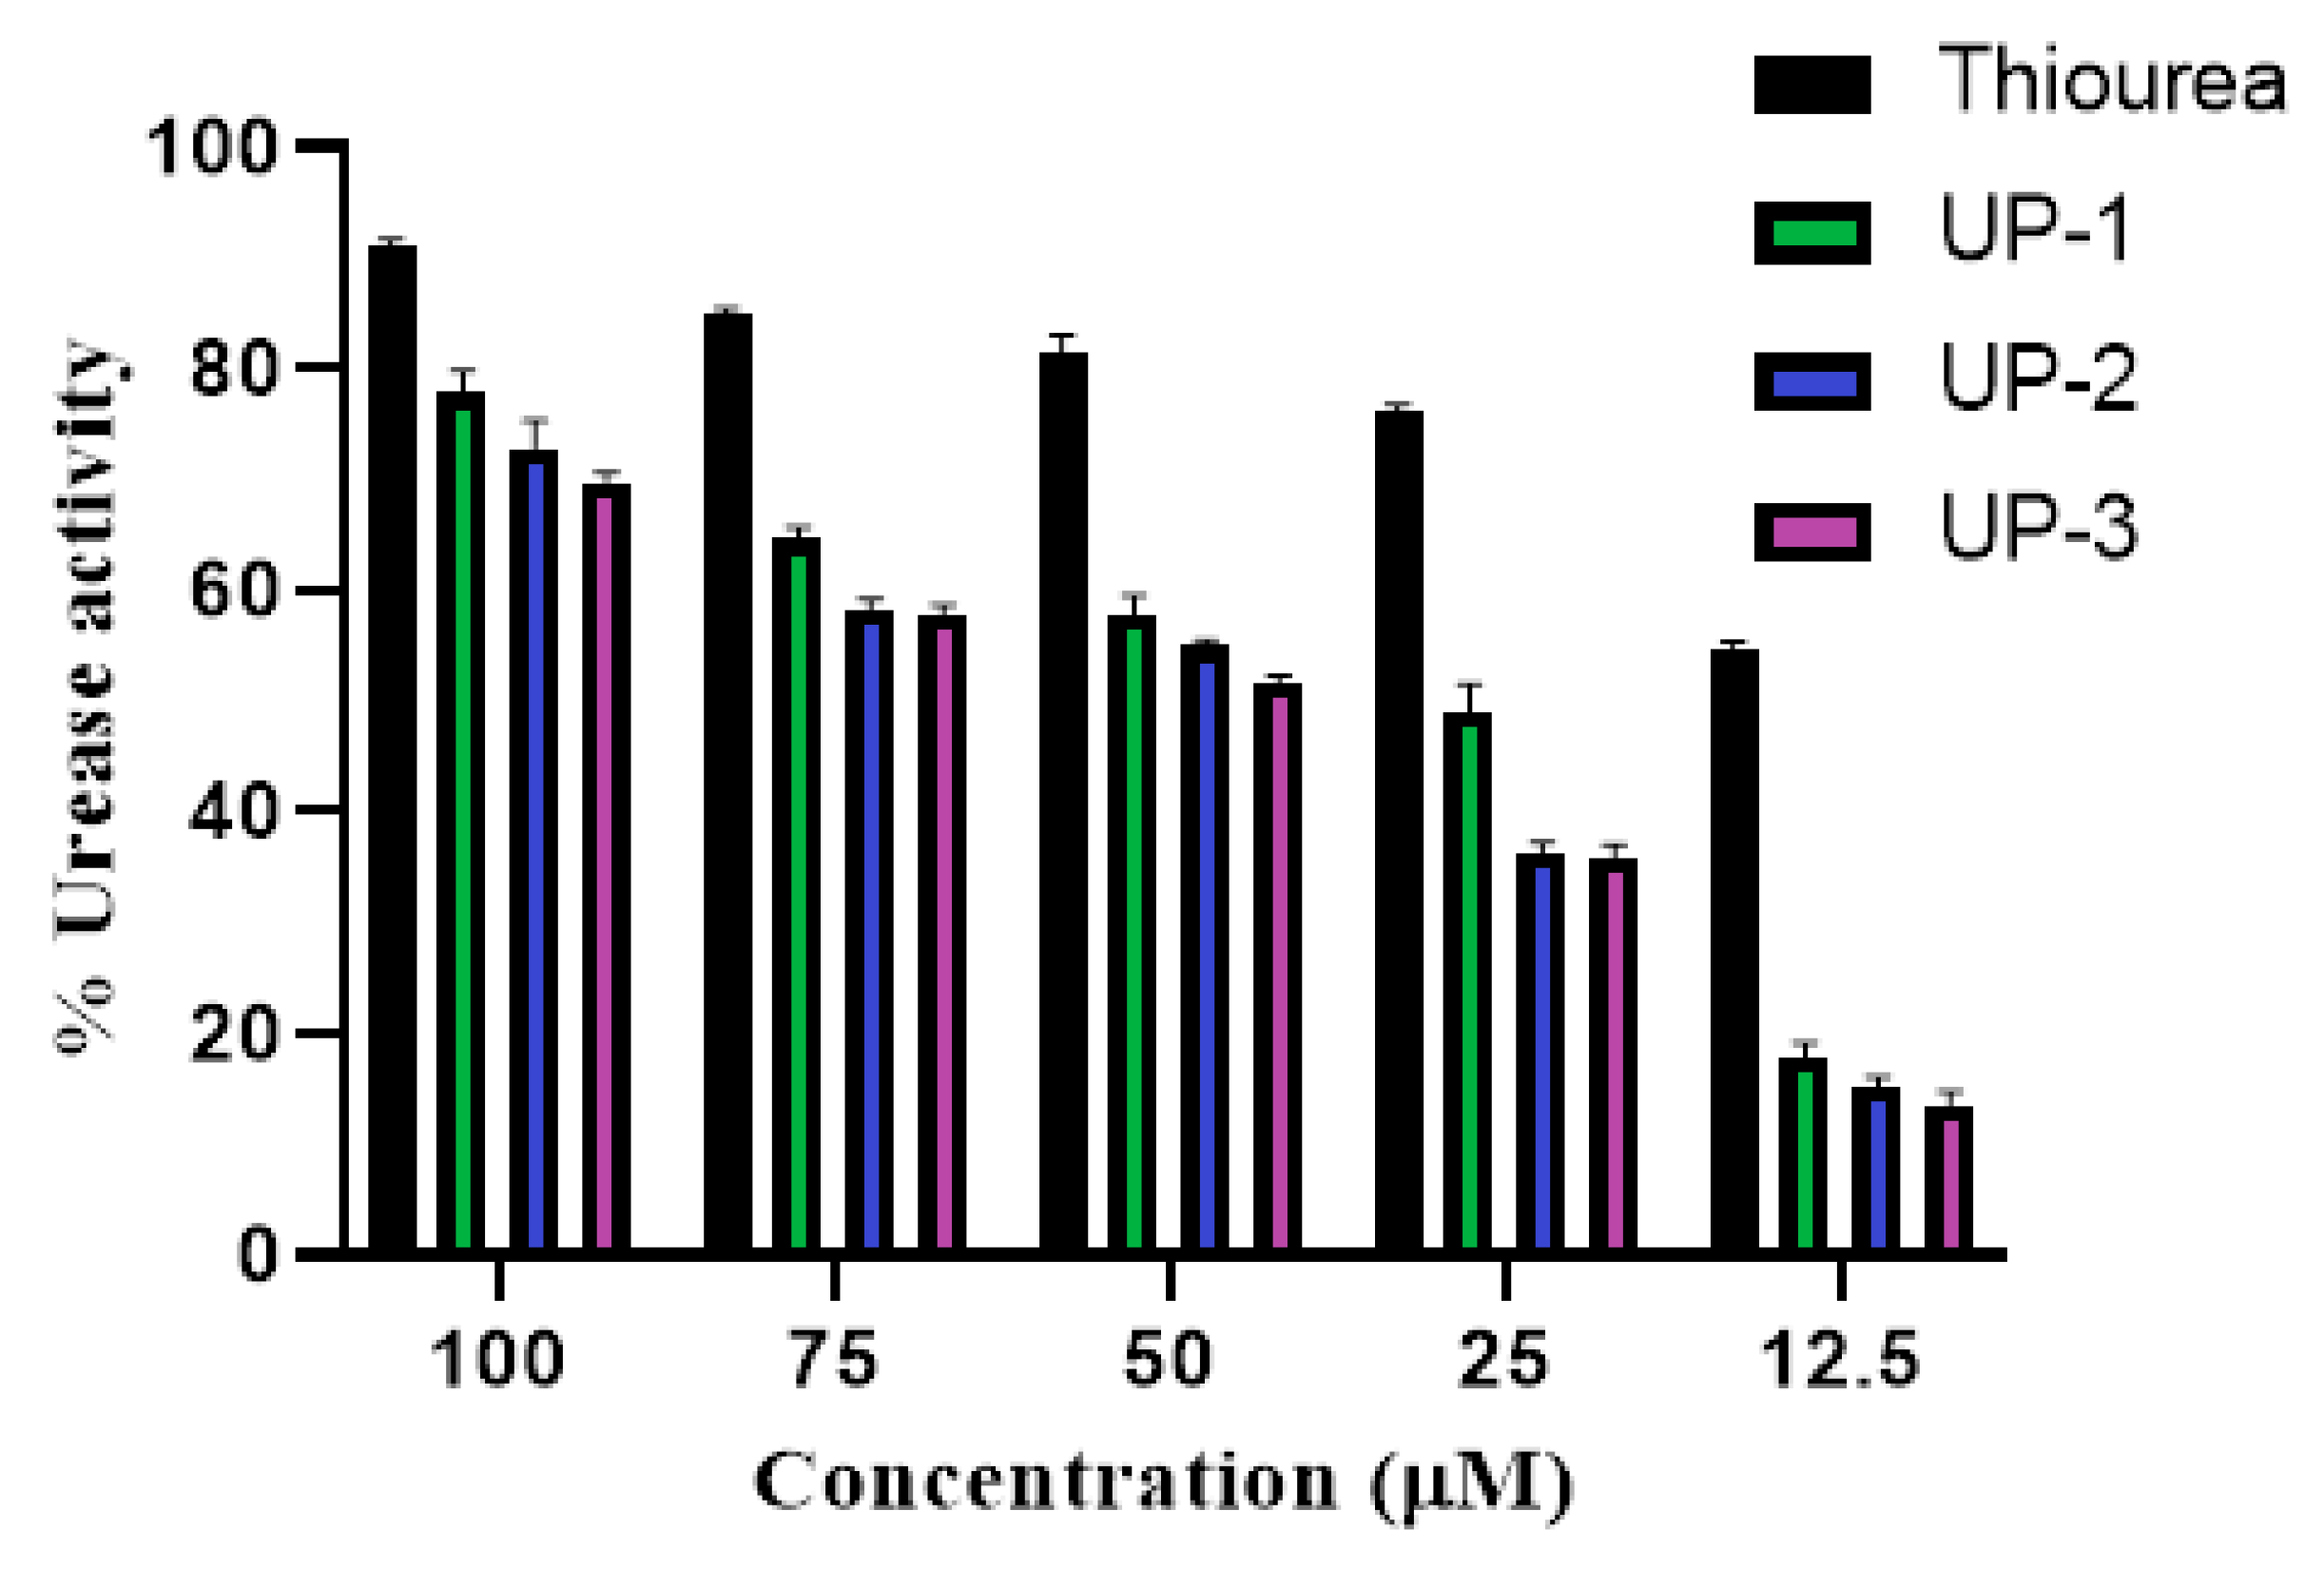
2.4. Anti-Urease Activity Studies
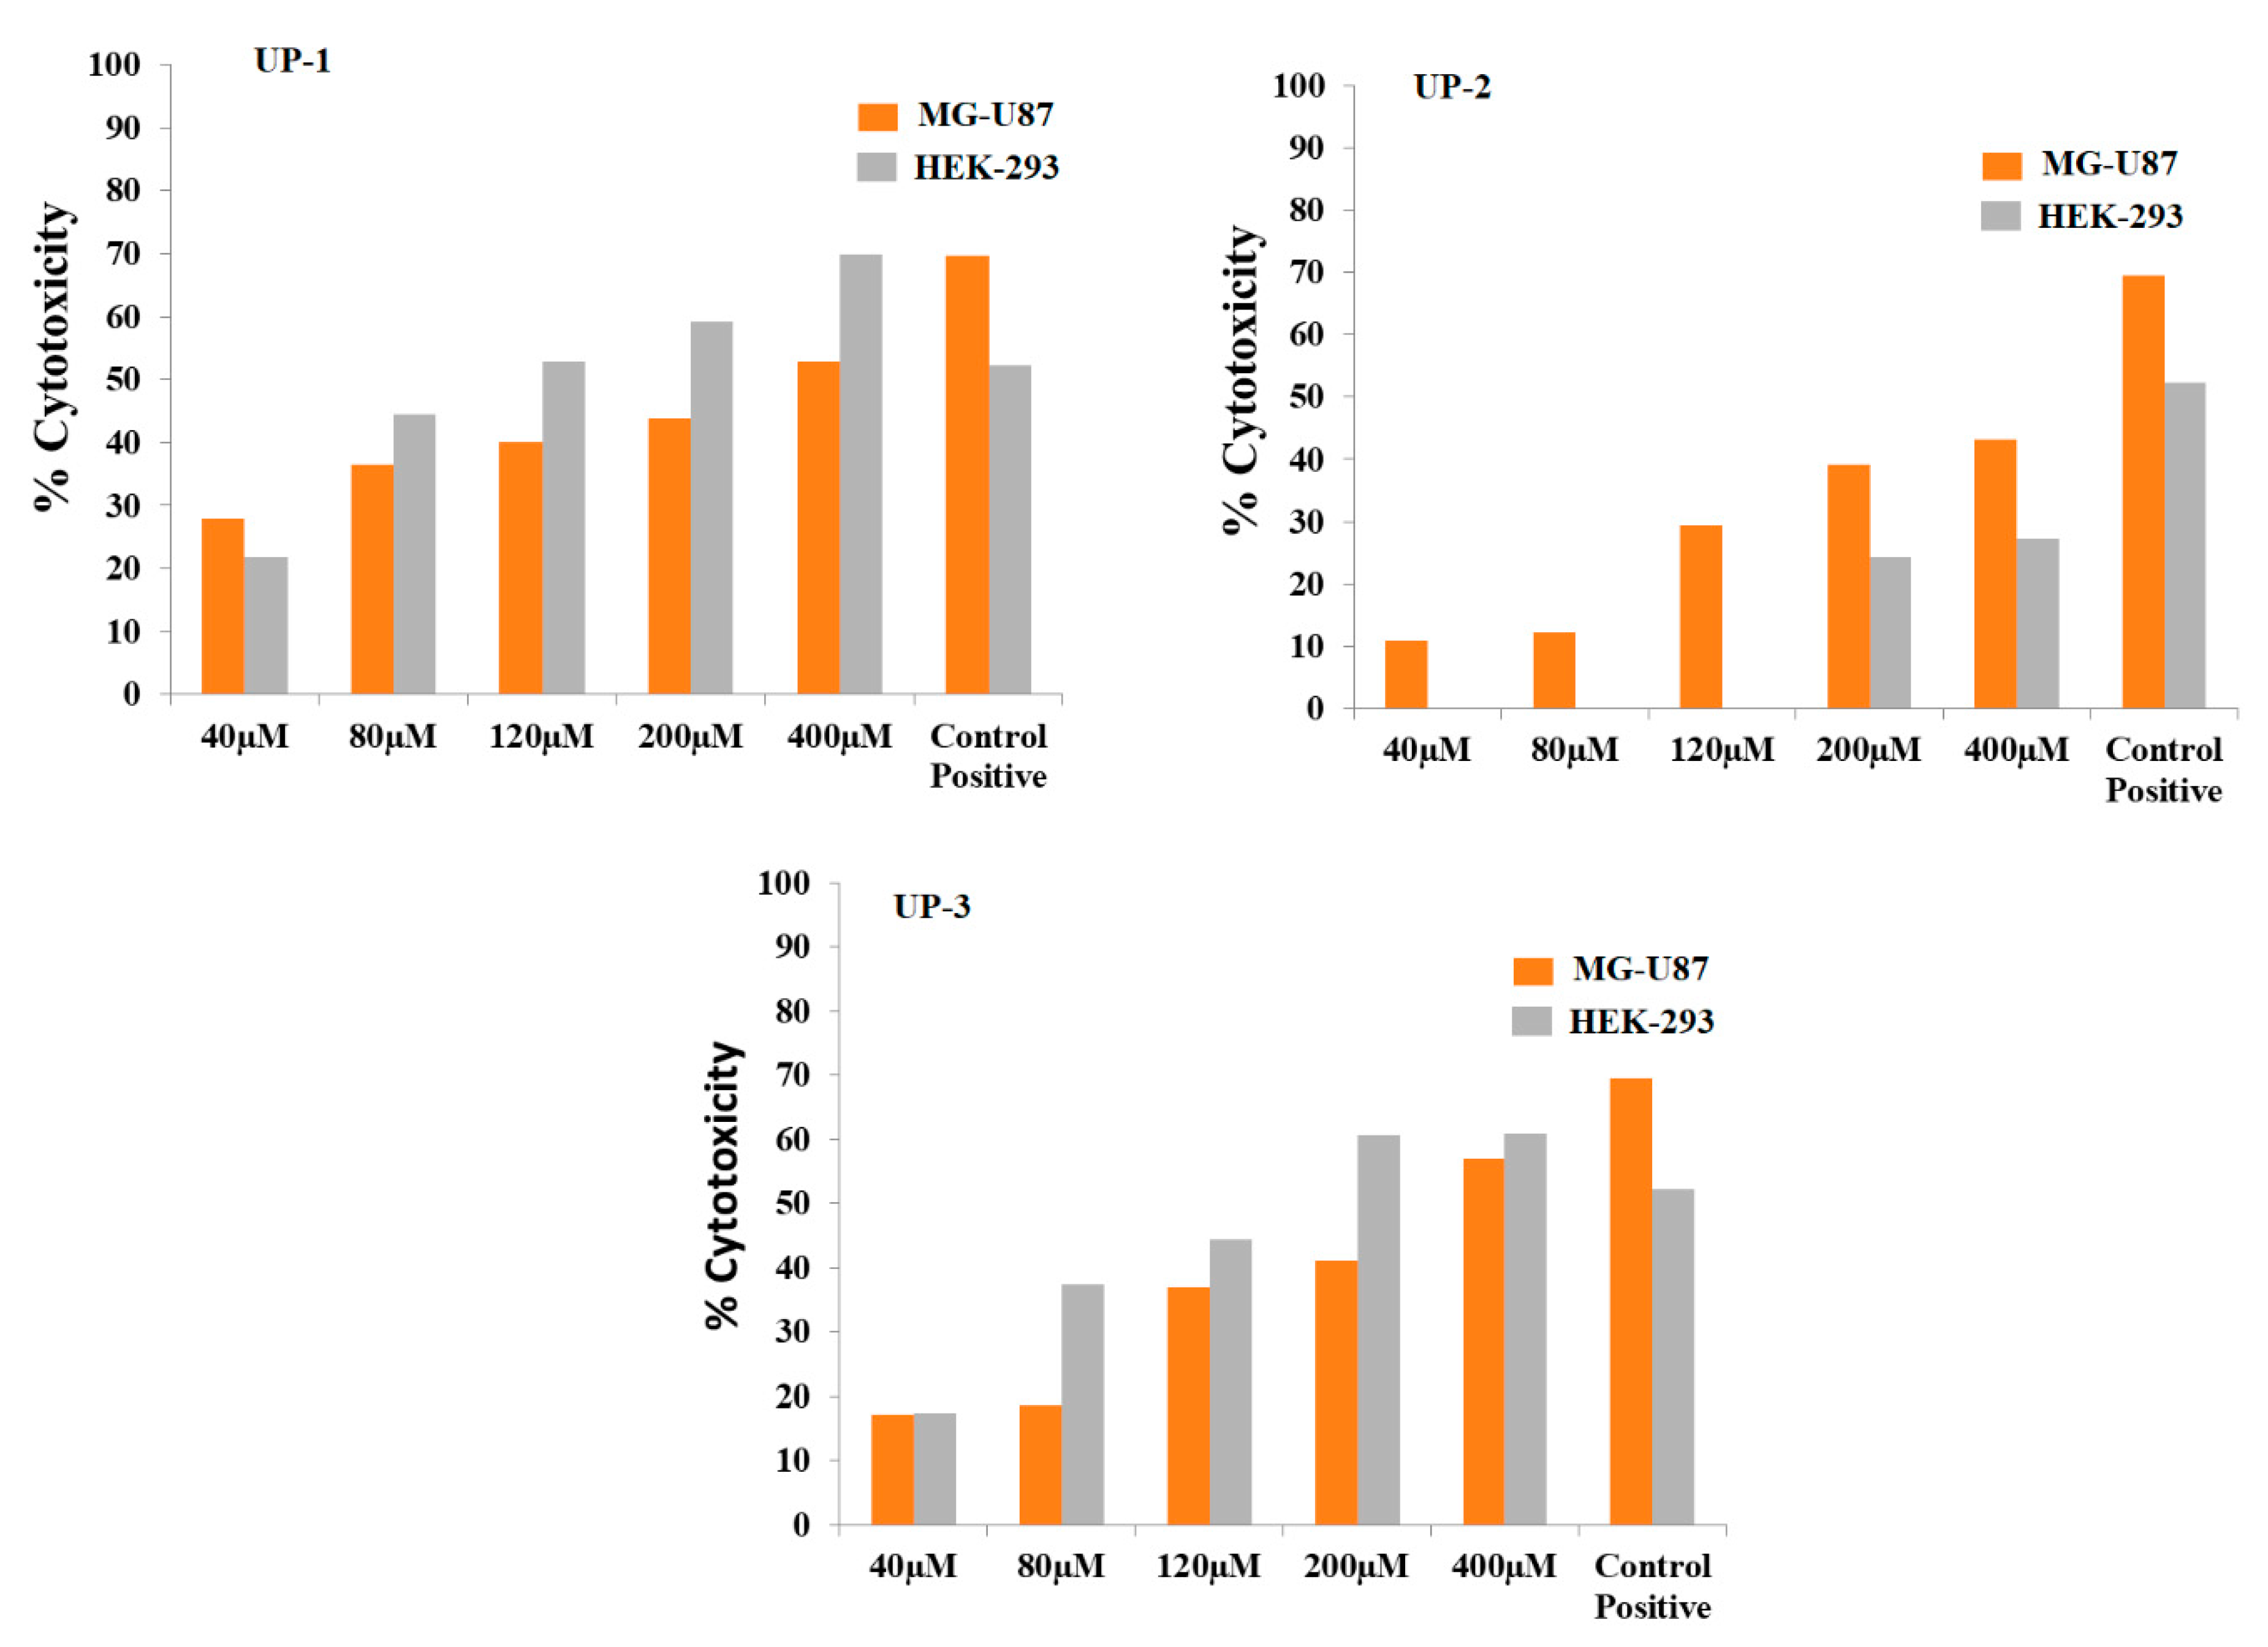
2.5. Cytotoxicity Studies against Brain Tumor and Normal Cell Lines
3. Experimental
3.1. Materials and Methods
3.2. Instrumentations
3.3. Synthesis of Nitrophenylene Derivatives of Symmetrical Bis-Acyl-Thiourea
3.4. Characterization Data
3.5. DFT and Docking—Theoretical Procedures
3.6. DNA Binding—Experimental Procedures
3.7. Anti-Urease Assay
3.8. Cell Line Assay
4. Conclusions
Supplementary Materials
Author Contributions
Funding
Institutional Review Board Statement
Informed Consent Statement
Data Availability Statement
Acknowledgments
Conflicts of Interest
Sample Availability
References
- Cui, P.; Li, X.; Zhu, M.; Wang, B.; Liu, J.; Chen, H. Design, synthesis and antibacterial activities of thiouracil derivatives containing acyl thiourea as Sec A inhibitors. Bioorg. Med. Chem. Lett. 2017, 27, 2234–2237. [Google Scholar] [CrossRef] [PubMed]
- Yang, M.; Zhao, W.; Sun, Z.; Tan, C.; Weng, J.; Liu, X. Synthesis and biological activity of acylthiourea derivatives contain 1, 2, 3-thiadiazole and 1, 3, 4-thiadiazole. Lett. Drug Des.Discov. 2015, 12, 314–318. [Google Scholar]
- Mohamed, N.; Al-mehbad, N. Novel terephthaloyl thiourea cross-linked chitosan hydrogels as antibacterial and antifungal agents. Int. J. Biol. Macromol. 2013, 57, 111–117. [Google Scholar] [CrossRef] [PubMed]
- Sun, J.; Cai, S.; Mei, H.; Li, J.; Yan, N.; Wang, Q.; Lin, Z.; Huo, D. Molecular docking and QSAR studies on substituted acyl(thio)urea and thiadiazolo [2,3-alpha] pyrimidine derivatives as potent inhibitors of influenza virus neuraminidase. Chem. Biol. Drug Des. 2010, 76, 245–254. [Google Scholar]
- Thakur, A.; Deshmukh, R.; Jha, A.; Kumar, P. Molecular docking study and anticonvulsant activity of synthesized 4-((4,6-dimethyl-6H-1,3-thiazin-2-yl)phenylsulfonyl)urea/thiourea derivatives. J. King Saud Univ. Sci. 2018, 30, 330–336. [Google Scholar] [CrossRef]
- Venkatachalam, T.; Mao, C.; Uckun, F. Effect of stereochemistry on the anti-HIV activity of chiral thiourea compounds. Bioorg. Med. Chem. 2004, 12, 4275–4284. [Google Scholar] [CrossRef]
- Venkatachalam, T.; Sudbeck, E.; Mao, C.; Uckun, F. Anti-HIV activity of aromatic and heterocyclic thiazolyl thiourea compounds. Bioorg. Med. Chem. Lett. 2001, 11, 523–528. [Google Scholar] [CrossRef]
- Wang, N.; Budde, W. Determination of carbamate, urea, and thiourea pesticides and herbicides in water. Anal. Chem. 2001, 73, 997–1006. [Google Scholar] [CrossRef]
- Lambert, W.; Goldsmith, M.; Sparks, T. Insecticidal activity of novel thioureas and isothioureas. Pest Manag. Sci. 2017, 73, 743–751. [Google Scholar] [CrossRef]
- Huong, D.; Bay, M.V.; Nam, P.C. Antioxidant activity of thiourea derivatives: An experimental and theoretical study. J. Mol. Liq. 2021, 340, 117149. [Google Scholar] [CrossRef]
- Özgeriş, B. Design, synthesis, characterization, and biological evaluation of nicotinoyl thioureas as antimicrobial and antioxidant agents. J. Antibiot. 2021, 74, 233–243. [Google Scholar] [CrossRef] [PubMed]
- Mishra, A.; Batra, S. Thiourea and guanidine derivatives as antimalarial and antimicrobial agents. Curr. Top. Med. Chem. 2013, 13, 2011–2025. [Google Scholar] [CrossRef] [PubMed]
- Saeed, A.; Flörke, U.; Erben, M. A review on the chemistry, coordination, structure and biological properties of 1-(acyl/aroyl)-3-(substituted) thioureas. J. Sulphur Chem. 2014, 35, 318–355. [Google Scholar] [CrossRef]
- Wanka, L.; Iqbal, K.; Schreiner, P. The lipophilic bullet hits the targets: Medicinal chemistry of adamantane derivatives. Chem. Rev. 2013, 113, 3516–3604. [Google Scholar] [CrossRef] [PubMed] [Green Version]
- Rasheed, S.; Aziz, M.; Saeed, A.; Ejaz, S.; Channar, P.; Zargar, S.; Abbas, Q.; Alanazi, H.; Hussain, M.; Alharbi, M.; et al. Analysis of 1-Aroyl-3-[3-chloro-2-methylphenyl] Thiourea Hybrids as Potent Urease Inhibitors: Synthesis, Biochemical Evaluation and Computational Approach. Int. J. Mol. Sci. 2022, 23, 11646. [Google Scholar] [CrossRef] [PubMed]
- Nair, P.; Sobhia, M. Quantitative structure activity relationship studies on thiourea analogues as influenza virus neuraminidase inhibitors. Eur. J. Med. Chem. 2008, 43, 293–299. [Google Scholar] [CrossRef]
- Zahra, U.; Saeed, A.; Fattah, T.; Flörke, U.; Erben, M. Recent trends in chemistry, structure, and various applications of 1-acyl-3-substituted thioureas: A detailed review. RSC Adv. 2022, 12, 12710–12745. [Google Scholar] [CrossRef] [PubMed]
- Ettari, R.; Pinto, A.; Micale, N. Synthesis and anti-HIV activity evaluation of new phenyl ethyl thiourea (PET) derivatives. ARKIVOC 2009, 14, 227–234. [Google Scholar] [CrossRef] [Green Version]
- Ghorab, M.M.; El-Gaby, M.; Alsaid, M.; Elshaier, M.; Soliman, A.; El-Senduny, F.; Badria, F.; Sherif, A. Novel thiourea derivatives bearing sulfonamide moiety as anticancer agents through COX-2 inhibition. Anticancer Agents Med. Chem. 2017, 17, 1411–1425. [Google Scholar] [CrossRef]
- da Silva, T.; Miolo, L.; Sousa, F.; Brod, L.; Savegnago, L.; Schneider, P. New thioureas based on thiazolidines with antioxidant potential. Tetrahedron Lett. 2015, 56, 6674–6680. [Google Scholar] [CrossRef]
- Shing, J.C.; Choi, J.; Chapman, R.; Schroeder, M.; Sarkaria, J.; Fauq, A.; Bram, R.J. A novel synthetic 1, 3-phenyl bis-thiourea compound targets microtubule polymerization to cause cancer cell death. Cancer Biol. Ther. 2014, 15, 895–905. [Google Scholar] [CrossRef] [Green Version]
- Nowotarski, S.L.; Pachaiyappan, B.; Holshouser, S.; Kutz, C.; Li, Y.; Huang, Y.; Woster, P. Structure–activity study for (bis) ureidopropyl-and (bis) thioureidopropyldiamine LSD1 inhibitors with 3–5-3 and 3-6-3 carbon backbone architectures. Bioorg. Med. Chem. 2015, 23, 1601–1612. [Google Scholar] [CrossRef] [PubMed] [Green Version]
- Verlinden, B.; de Beer, M.; Pachaiyappan, B.; Besaans, E.; Andayi, W.; Reader, J.; Niemand, J.; van Biljon, R.; Guy, K.; Egan, T.; et al. Interrogating alkyl and arylalkylpolyamino (bis) urea and (bis) thiourea isosteres as potent antimalarial chemotypes against multiple lifecycle forms of Plasmodium falciparum parasites. Bioorg. Med. Chem. 2015, 23, 5131–5143. [Google Scholar] [CrossRef] [PubMed] [Green Version]
- Halim, A.; Ngaini, Z. Synthesis and bacteriostatic activities of bis (thiourea) derivatives with variable chain length. J. Chem. 2016, 2016, 7. [Google Scholar]
- Perveen, F.; Qureshi, R.; Ansari, F.; Kalsoom, S.; Safeer, S. Investigations of drug–DNA interactions using molecular docking, cyclic voltammetry and UV–Vis spectroscopy. J. Mol. Struct. 2011, 1004, 67–73. [Google Scholar] [CrossRef]
- Perveen, F.; Arshad, N.; Qureshi, R.; Nowsherwan, J.; Sultan, A.; Nosheen, A. Electrochemical, spectroscopic and theoretical monitoring of anthracyclines’ interactions with DNA and ascorbic acid by adopting two routes: Cancer cell line studies. PLoS ONE 2018, 13, e0205764. [Google Scholar] [CrossRef]
- Jamali, A.; Tavakoli, A.; Dolatabadi, J.E.N. Analytical overview of DNA interaction with Morin and its metal complexes. Eur. Food Res. Technol. 2012, 235, 367–373. [Google Scholar] [CrossRef]
- Rehman, Z.; Shah, A.; Muhammad, N.; Ali, S.; Qureshi, R.; Meetsma, A.; Butler, I. Synthesis, spectroscopic characterization, X-ray structure and evaluation of binding parameters of new triorganotin(IV) dithiocarboxylates with DNA. Eur. J. Med. Chem. 2009, 44, 3986–3993. [Google Scholar] [CrossRef]
- Arshad, N.; Farooqi, S.; Bhatti, M.; Saleem, S.; Mirza, B. Electrochemical and spectroscopic investigations of carboxylic acid ligand and its triorganotin complexes for their binding with ds.DNA: In vitro biological studies. J. Photochem. Photobiol. B Biol. 2013, 125, 70–82. [Google Scholar] [CrossRef]
- Arshad, N.; Rafiq, M.; Ujan, R.; Saeed, A.; Farooqi, S.; Perveen, F.; Channar, P.A.; Ashraf, S.; Abbas, Q.; Ahmed, A.; et al. Synthesis, X-ray crystal structure elucidation and Hirshfeld surface analysis of N-((4-(1H-benzo[d]imidazole-2-yl) phenyl) carbamothioyl) benzamide: Investigations for elastase inhibition, antioxidant and DNA binding potentials for biological applications. RSC Adv. 2020, 10, 20837–20851. [Google Scholar] [CrossRef]
- Arshad, N.; Mir, M.; Perveen, F.; Javed, A.; Javaid, M.; Saeed, A.; Channar, P.; Farooqi, S.; Alkahtani, S.; Anwar, J. Investigations on Anticancer Potentials by DNA Binding and Cytotoxicity Studies for Newly Synthesized and Characterized Imidazolidine and Thiazolidine-Based Isatin Derivatives. Molecules 2022, 27, 354. [Google Scholar] [CrossRef] [PubMed]
- Farooqi, S.I.; Arshad, N.; Channar, P.; Perveen, F.; Saeed, A.; Larik, F.; Javed, A. Synthesis, theoretical, spectroscopic and electrochemical DNA binding investigations of 1, 3, 4-thiadiazole derivatives of ibuprofen and ciprofloxacin: Cancer cell line studies. J. Photochem. Photobiol. B Biol. 2018, 189, 104–118. [Google Scholar] [CrossRef] [PubMed]
- Arshad, N.; Abbas, N.; Perveen, F.; Mirza, B.; Almuhaini, A.; Alkahtani, S. Molecular docking analysis and spectroscopic investigations of zinc(II), nickel(II) N-phthaloyl-balanine complexes for DNA binding: Evaluation of antibacterial and antitumor activities. J. Saudi Chem. Soc. 2021, 25, 101323. [Google Scholar] [CrossRef]
- Arshad, N.; Farooqi, S. Cyclic voltammetric DNA binding investigations on some anticancer potential metal complexes: A review. Appl. Biochem. Biotechnol. 2018, 186, 1090–1110. [Google Scholar] [CrossRef] [PubMed]
- Farooqi, S.I.; Arshad, N.; Channar, P.; Perveen, F.; Saeed, A.; Larik, F.; Javed, A.; Yamin, M. New aryl Schiff bases of thiadiazole derivative of ibuprofen as DNA binders and potential anti-cancer drug candidates. J. Biomol. Struct. Dyn. 2021, 39, 3548–3564. [Google Scholar] [CrossRef]
- Arshad, N.; Saeed, A.; Perveen, F.; Ujan, R.; Farooqi, S.; Channar, P.; Shabir, G.; El-Seedi, H.; Javed, A.; Yamin, M.; et al. Synthesis, X-ray, Hirshfeld surface analysis, exploration of DNA binding, urease enzyme inhibition and anticancer activities of novel adamantane-naphthyl thiourea conjugate. Bioorg. Chem. 2021, 109, 104707. [Google Scholar] [CrossRef]
- Farooqi, S.I.; Arshad, N.; Perveen, F.; Channar, P.; Saeed, A.; Javed, A.; Hökelek, T.; Flörke, U. Structure and surface analysis of ibuprofen-organotin conjugate: Potential anti-cancer drug candidacy of the compound is proven by in-vitro DNA binding and cytotoxicity studies. Polyhedron 2020, 192, 114845. [Google Scholar] [CrossRef]
- Arshad, N.; Channar, P.; Saeed, A.; Farooqi, S.; Javed, A.; Larik, F.; Abbasi, W.; Fl, U. Structure elucidation, DNA binding, DFT, molecular docking and cytotoxic activity studies on novel single crystal (E)-1-(2-fluorobenzylidene) thiosemicarbazide. J. Saudi Chem. Soc. 2018, 22, 1003–1013. [Google Scholar] [CrossRef]
- Indrayanto, G.; Putra, G.; Suhud, F. Chapter Six–Validation of in-vitro bioassay methods: Application in herbal drug research. Profiles Drug Subst. Excip. Relat. Methodol. 2021, 46, 273–307. [Google Scholar]
- Al-Harbi, R.A.K.; El-Sharief, M.; Abbas, S.Y. Synthesis and anticancer activity of bis-benzo[d][1,3]dioxol-5-yl thiourea derivatives with molecular docking study. Bioorg.Chem. 2019, 90, 103088. [Google Scholar] [CrossRef]
- Pingaew, R.; Prachayasittikul, V.; Worachartcheewan, A.; Thongnum, A.; Prachayasittikul, S.; Ruchirawat, S. Anticancer activity and QSAR study of sulfur-containing thiourea and sulfonamide derivatives. Heliyon 2022, 8, e10067. [Google Scholar] [CrossRef] [PubMed]
- Prachayasittikul, V.; Arafa, W.A.; Ghoneim, A.; Mourad, A.K. N-Naphthoyl Thiourea Derivatives: An Efficient Ultrasonic-Assisted Synthesis, Reaction, and In Vitro Anticancer Evaluations. ACS Omega 2022, 7, 6210–6222. [Google Scholar]
- Khan, H.; Nazir, S.; Farooq, R.; Khan, I.; Javed, A. Fabrication and Assessment of Diosgenin Encapsulated Stearic Acid Solid Lipid Nanoparticles for Its Anticancer and Antidepressant Effects Using in vitro and in vivo Models. Neuroscience 2021, 15, 806713. [Google Scholar] [CrossRef] [PubMed]
- Ahmadian, E.; Janas, D.; Zare, A.E.N. Application of carbon nanotubes in sensing/monitoring of pancreas and liver cancer. Chemosphere 2022, 302, 134826. [Google Scholar] [CrossRef] [PubMed]
- Chodari, L.; Aytemir, M.; Vahedi, P.; Alipour, M.; Vahed, S.; Khatibi, S.; Ahmadian, E.; Ardalan, M.; Eftekhari, A. Targeting Mitochondrial Biogenesis with Polyphenol Compounds. Oxid. Med. Cell. Longev. 2021, 2021, 20. [Google Scholar] [CrossRef]
- Gaussian, R.A.; Frisch, M.; Trucks, G.; Schlegel, H.; Scuseria, G.E.; Robb, M.; Cheeseman, J.R.; Scalmani, G.; Barone, V.; Mennucci, B.; et al. GaussView, Version 5; Gaussian, Inc.: Wallingford, CT, USA, 2009; Volume 121, pp. 150–166. [Google Scholar]
- Velde, G.; Bickelhaupt, F.; Baerends, E.; Guerra, C.F.; van Gisbergen, S.; Snijders, J.; Ziegler, T. Chemistry with ADF. J. Comput. Chem. 2001, 22, 93. [Google Scholar] [CrossRef]
- Furness, J.W.; Kaplan, A.; Ning, J.; Perdew, J.; Sun, J. Accurate and Numerically Efficient r2 SCAN Meta-Generalized Gradient Approximation. J. Phys. Chem. Lett. 2020, 11, 8208–8215. [Google Scholar] [CrossRef]
- Available online: https://www.rcsb.org/structure/1bna (accessed on 12 February 2023).
- Available online: https://www.rcsb.org/structure/1eju (accessed on 12 February 2023).
- Khalid, A.; Arshad, N.; Channar, P.; Saeed, A.; Mir, M.; Abbas, Q.; Ejaz, S.; Hökelek, T.; Saeed, A.; Tehzeeb, A. Structure and surface analyses of a newly synthesized acyl thiourea derivative along with its in-silico and in-vitro investigations for RNR, DNA binding, urease inhibition and radical scavenging activities. RSC Adv. 2022, 12, 17194–17207. [Google Scholar] [CrossRef]
- Muhammad, R.; Rafique, H.; Roshan, S.; Shamas, S.; Iqbal, Z.; Ashraf, Z.; Abbas, Q.; Qureshi, M.; Asad, M. Enzyme Inhibitory Kinetics and Molecular Docking Studies of Halo-Substituted Mixed Ester/Amide-Based Derivatives as Jack Bean Urease Inhibitors. BioMed. Res. Int. 2020, 2020, 11. [Google Scholar]
- Berridge, M.; Herst, P.; Tan, A. Tetrazolium dyes as tools in cell biology: New insights into their cellular reduction. Biotechnol. Annu. Rev. 2005, 11, 127–152. [Google Scholar]


| DFT | Molecular Docking | ||||||
|---|---|---|---|---|---|---|---|
| Compounds | Electronic Descriptors | Compound—DNA | Compound—Urease | ||||
| EHOMO/(eV) | ELUMO/(eV) | ΔE/(eV) | Kb/M−1 | ∆G/kJ mol−1 | Kb/M−1 | ∆G/kJ mol−1 | |
| UP-1 | −6.36 | −4.96 | 1.40 | 1.48 × 10² | −12.39 | 6.73 × 10⁵ | −33.25 |
| UP-2 | −5.42 | −4.75 | 0.67 | 4.33 × 10³ | −20.76 | 3.71 × 10⁴ | −26.07 |
| UP-3 | −5.51 | −4.96 | 0.55 | 5.23 × 10³ | −21.21 | 5.56 × 10³ | −21.37 |
| Chemical descriptors calculated based on frontier orbital analysis | |||||||
| Compounds | I/(eV) | A/(eV) | η/(eV) | μ/(eV) | χ/(eV) | S/(eV) | |
| UP-1 | 6.36 | 4.96 | 0.70 | −0.7 | 5.66 | 0.71 | |
| UP-2 | 5.42 | 4.75 | 0.33 | −0.33 | 5.08 | 1.51 | |
| UP-3 | 5.51 | 4.96 | 0.27 | −0.27 | 5.23 | 1.85 | |
| Compound–DNA | Binding Parameters | UV/Visible | Flu- | CV |
|---|---|---|---|---|
| UP-1–DNA | kb/M−1 | 1.24 × 10³ | 2.19 × 10³ | 1.47 × 10⁴ |
| −∆G/kJ mol−1 | −18.274 | −19.824 | −24.73 | |
| n | ------- | 1.11 | 1.19 | |
| UP-2–DNA | kb/M−1 | 4.90 × 10³ | 2.04 × 10⁴ | 3.31 × 10⁴ |
| −∆G/kJ mol−1 | −21.952 | −25.525 | −26.82 | |
| n | ------- | 1.23 | 2.09 | |
| UP-3–DNA | kb/M−1 | 3.42 × 10⁴ | 2.14 × 10⁵ | 8.69 × 10⁴ |
| −∆G/kJ mol−1 | −27.739 | −31.633 | −29.32 | |
| n | ------- | 1.31 | 4.35 |
| Sr. No. | Compounds | Cell Lines | IC50 (µM) | References |
|---|---|---|---|---|
| 1. | Bis-acyl-thiourea derivatives of 4-nitrobenzene-1,2-diamine, Up-1, UP-2, UP-3 | MG-U87 | 2.496 ± 0.0324, 2.664 ± 0.1298 2.459 ± 0.0656 | Current work |
| 2. | 1,1′-(1,4-phenylene) bis(3-(benzo[d][1,3]dioxol-5-yl)thiourea), 5 | HepG2, HCT116, and MCF7 | 2.38 1.54 4.52 | [40] |
| 3. | Sulfur-containing thiourea and Sulfonamide derivatives, 13, 14, 22 | HuCCA-1 (HepG2, A549, and MDA-MB-231) T47D | 14.47 (1.50–16.67) 7.10 | [41] |
| 4. | N-naphthoyl thioureas | MCF-7, HCT116, and A549 | >76 | [42] |
Disclaimer/Publisher’s Note: The statements, opinions and data contained in all publications are solely those of the individual author(s) and contributor(s) and not of MDPI and/or the editor(s). MDPI and/or the editor(s) disclaim responsibility for any injury to people or property resulting from any ideas, methods, instructions or products referred to in the content. |
© 2023 by the authors. Licensee MDPI, Basel, Switzerland. This article is an open access article distributed under the terms and conditions of the Creative Commons Attribution (CC BY) license (https://creativecommons.org/licenses/by/4.0/).
Share and Cite
Arshad, N.; Parveen, U.; Channar, P.A.; Saeed, A.; Saeed, W.S.; Perveen, F.; Javed, A.; Ismail, H.; Mir, M.I.; Ahmed, A.; et al. Investigation of Newly Synthesized Bis-Acyl-Thiourea Derivatives of 4-Nitrobenzene-1,2-Diamine for Their DNA Binding, Urease Inhibition, and Anti-Brain-Tumor Activities. Molecules 2023, 28, 2707. https://doi.org/10.3390/molecules28062707
Arshad N, Parveen U, Channar PA, Saeed A, Saeed WS, Perveen F, Javed A, Ismail H, Mir MI, Ahmed A, et al. Investigation of Newly Synthesized Bis-Acyl-Thiourea Derivatives of 4-Nitrobenzene-1,2-Diamine for Their DNA Binding, Urease Inhibition, and Anti-Brain-Tumor Activities. Molecules. 2023; 28(6):2707. https://doi.org/10.3390/molecules28062707
Chicago/Turabian StyleArshad, Nasima, Uzma Parveen, Pervaiz Ali Channar, Aamer Saeed, Waseem Sharaf Saeed, Fouzia Perveen, Aneela Javed, Hammad Ismail, Muhammad Ismail Mir, Atteeque Ahmed, and et al. 2023. "Investigation of Newly Synthesized Bis-Acyl-Thiourea Derivatives of 4-Nitrobenzene-1,2-Diamine for Their DNA Binding, Urease Inhibition, and Anti-Brain-Tumor Activities" Molecules 28, no. 6: 2707. https://doi.org/10.3390/molecules28062707