
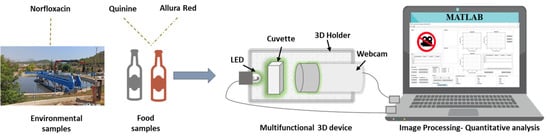
Multifunctional Portable System Based on Digital Images for In-Situ Detecting of Environmental and Food Samples


Abstract
:
1. Introduction
2. Results and Discussions
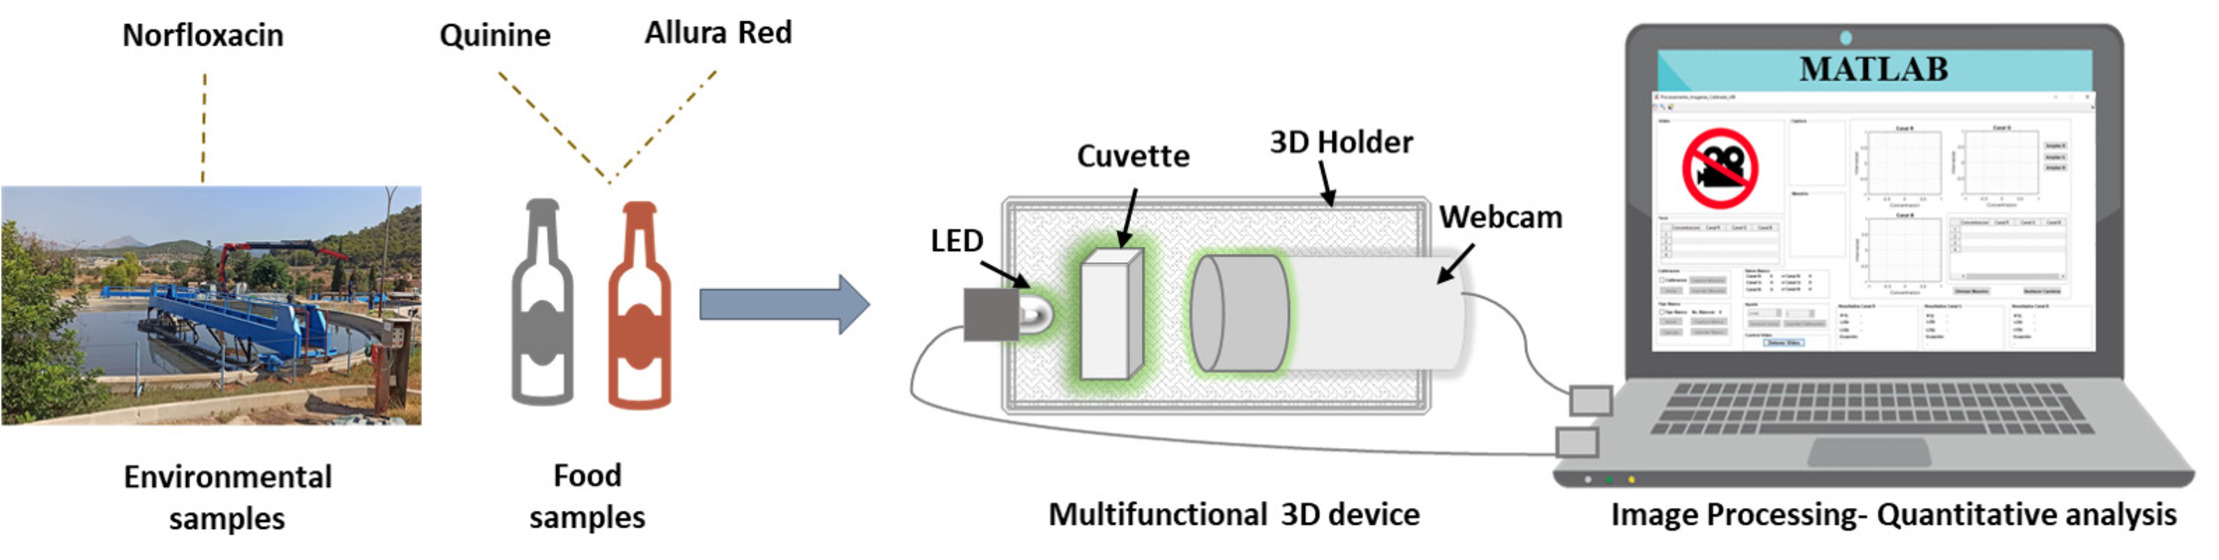
2.1. Optimization of Parameters of the Proposed System
2.2. Method Quality Assurance
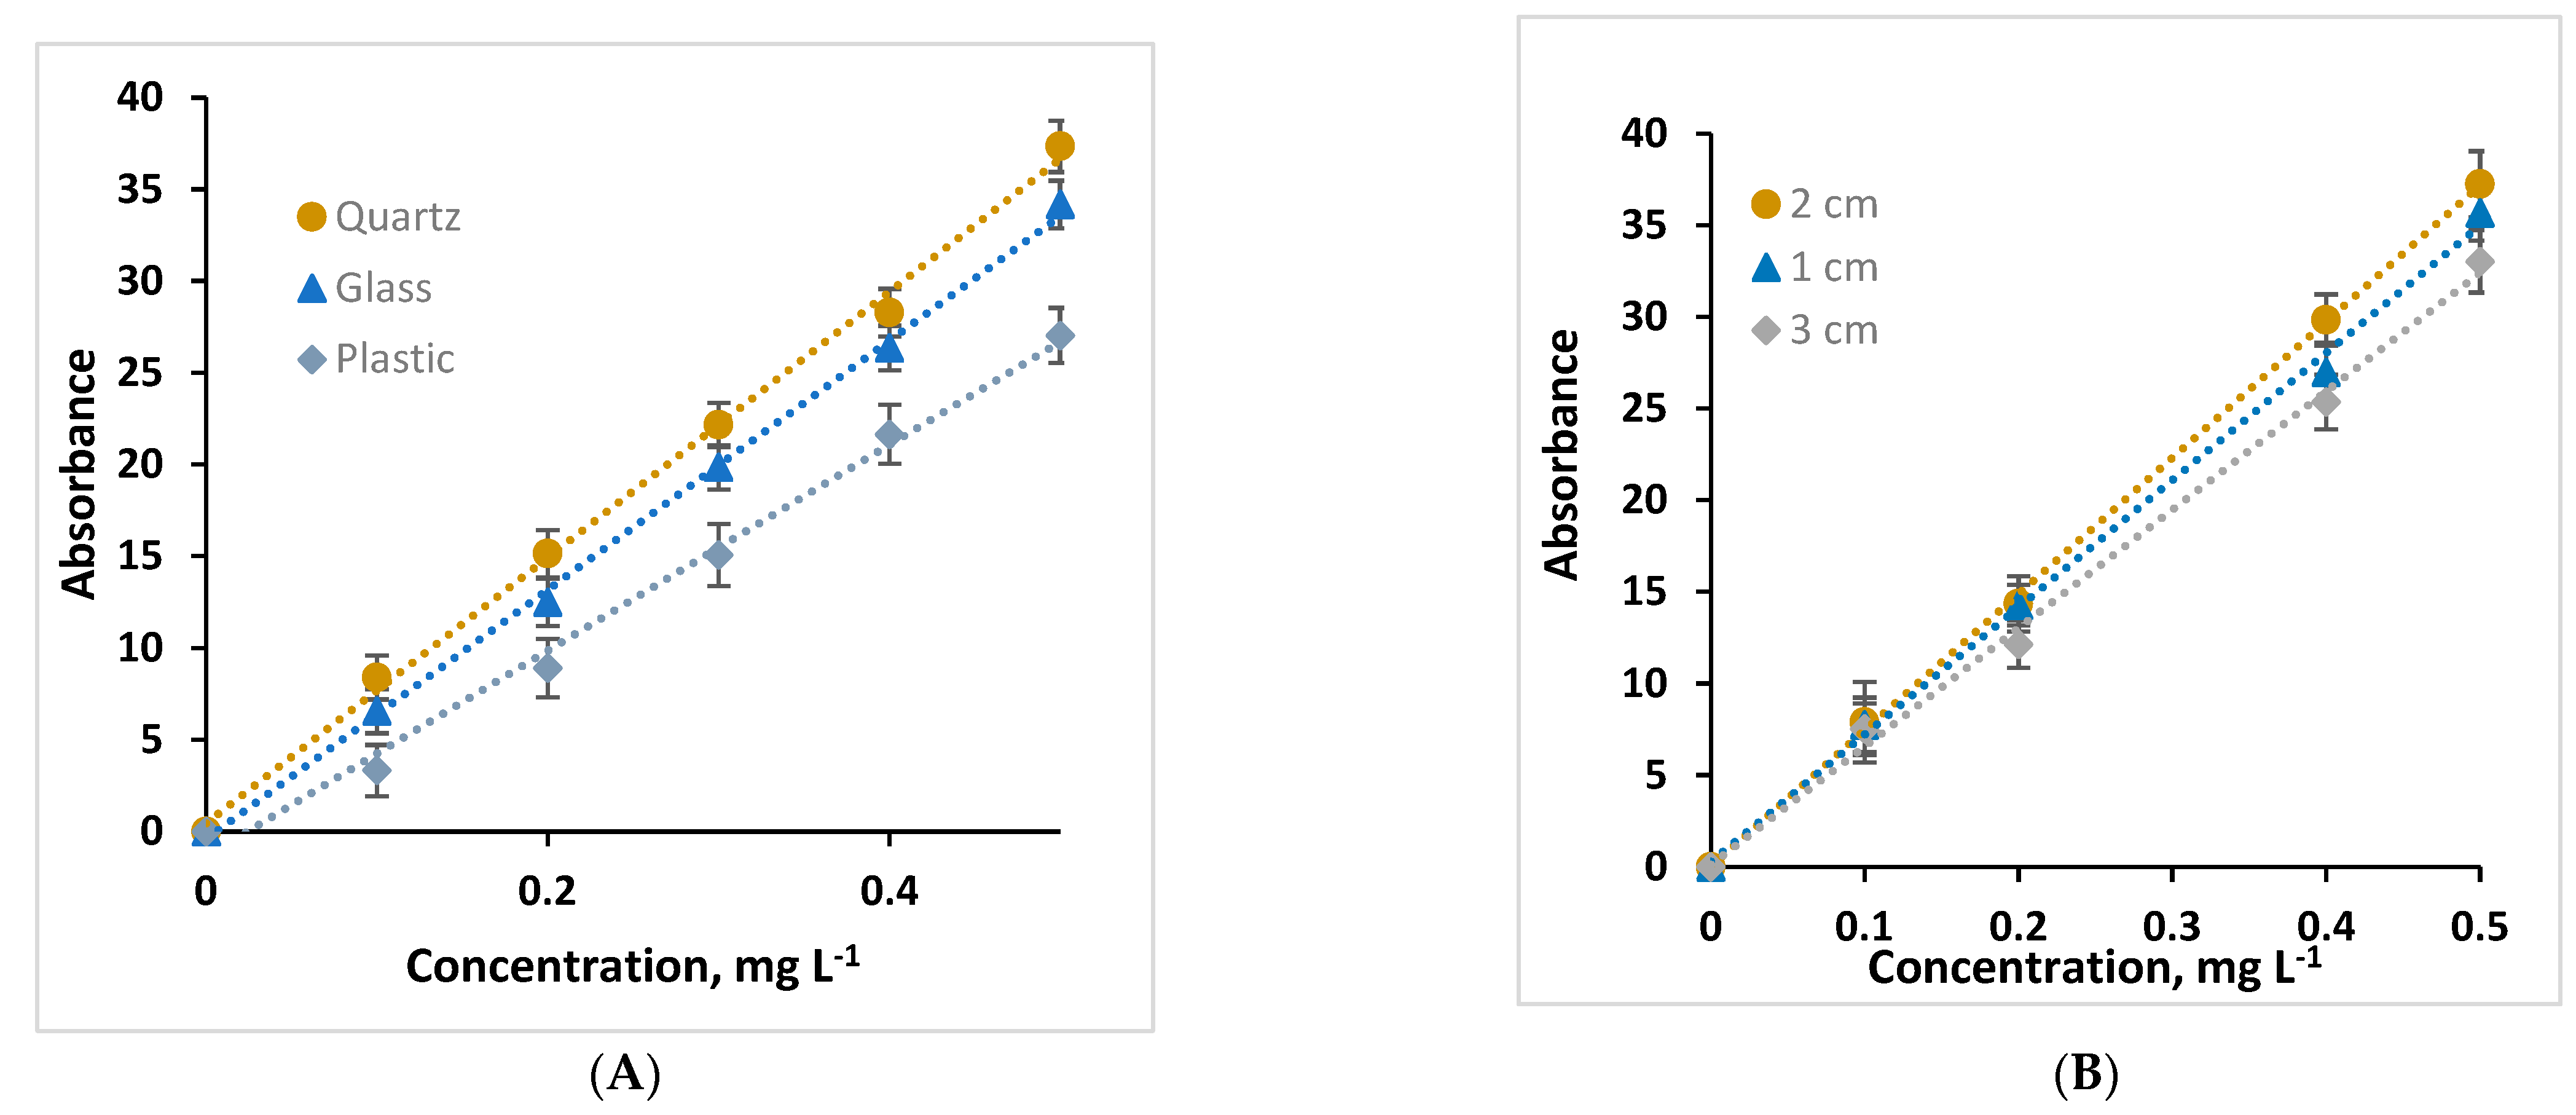
2.3. Analytical Parameters
2.4. Application and Validation
2.5. Comparison with Other Previous Methodologies
3. Methods and Materials
3.1. Chemicals and Samples
3.2. Environmental and Food Samples
3.3. Column Preparation for Environmental Samples
3.4. Preconcentration Procedure and Colorimetric Analysis
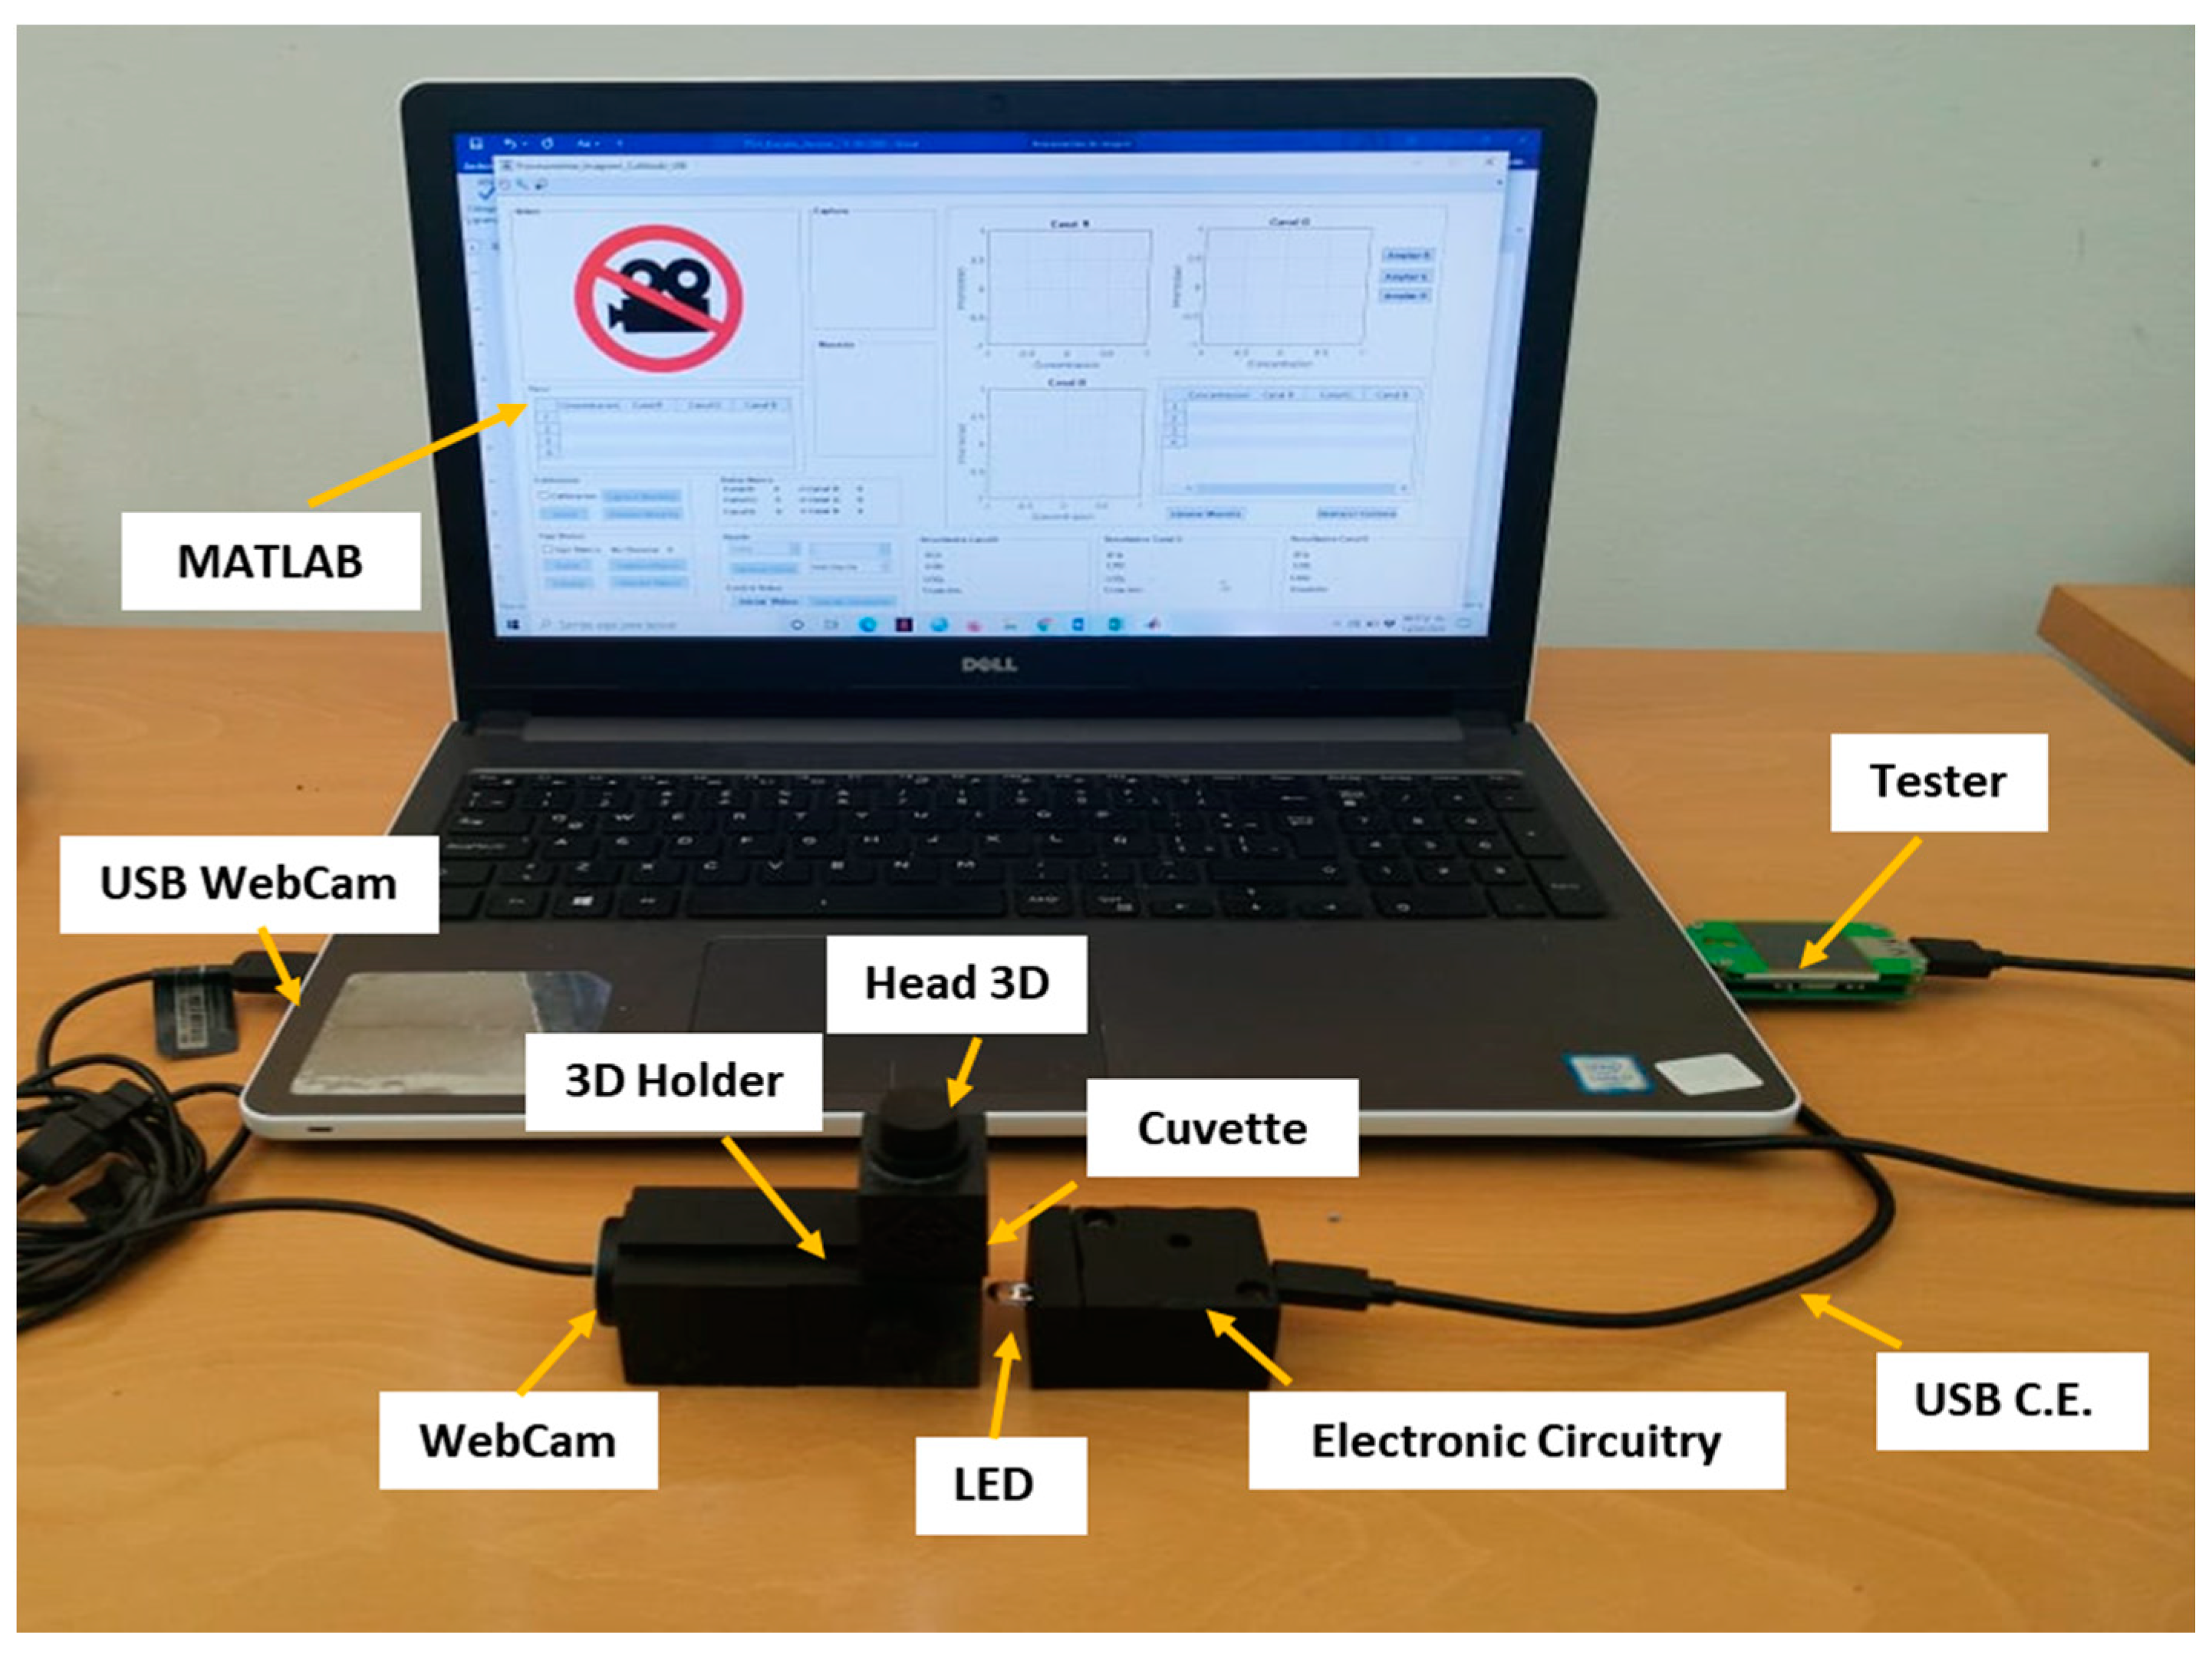
4. System Description
4.1. Components
4.1.1. 3D Holder
4.1.2. Radiation Source
4.1.3. Detector
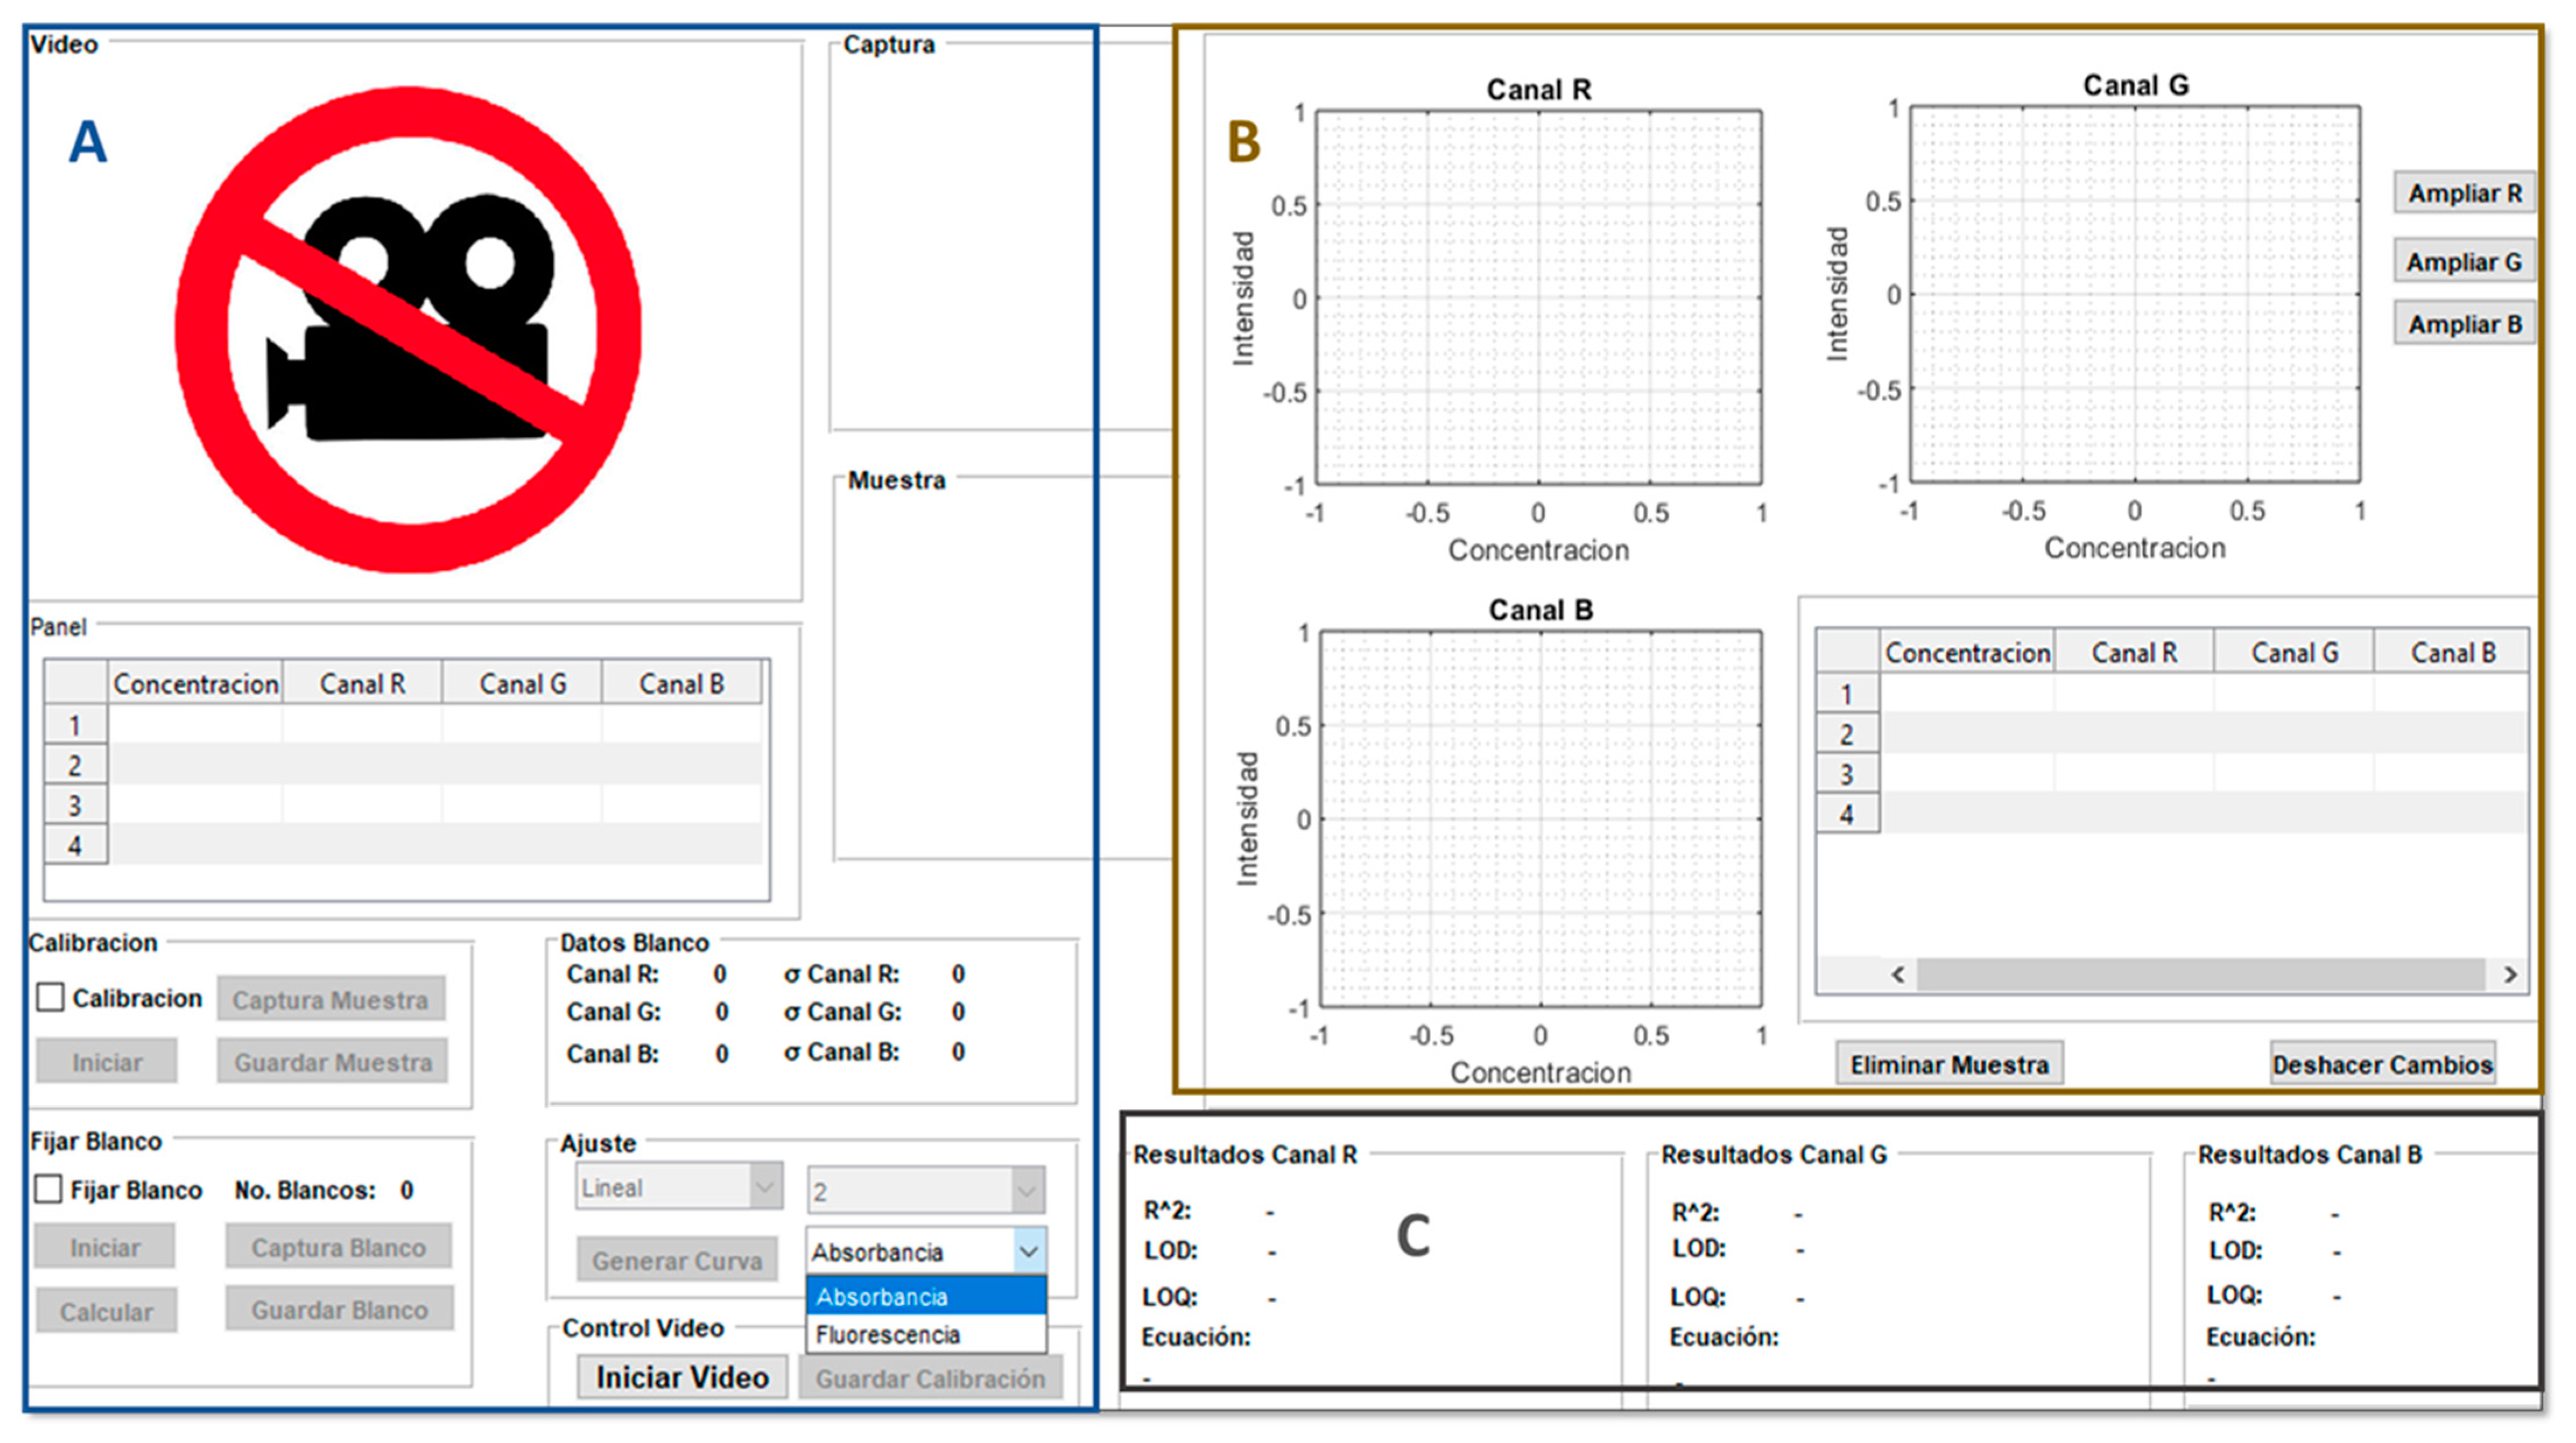
4.2. Matlab Program
4.2.1. Programming Language Development
4.2.2. Quantitative Analysis of Digital Images
4.2.3. Digital Image Processing
4.3. Spectrophotometer and Spectrofluorometer for Comparative Purposes
5. Conclusions
Supplementary Materials
Author Contributions
Funding
Institutional Review Board Statement
Informed Consent Statement
Data Availability Statement
Acknowledgments
Conflicts of Interest
Sample Availability
References
- Šafranko, S.; Živković, P.; Stanković, A.; Medvidović-Kosanović, M.; Széchenyi, A.; Jokić, S. Designing ColorX, Image Processing Software for Colorimetric Determination of Concentration, to Facilitate Students’ Investigation of Analytical Chemistry Concepts Using Digital Imaging Technology. J. Chem. Educ. 2019, 96, 1928–1937. [Google Scholar] [CrossRef]
- Pujol-Vila, F.; Giménez-Gómez, P.; Santamaria, N.; Antúnez, B.; Vigués, N.; Díaz-González, M.; Jiménez-Jorquera, C.; Mas, J.; Sacristán, J.; Muñoz-Berbel, X. Portable and miniaturized optofluidic analysis system with ambient light correction for fast in situ determination of environmental pollution. Sens. Actuators B Chem. 2016, 222, 55–62. [Google Scholar] [CrossRef]
- Sández, N.; Calvo-López, A.; Vidigal, S.S.M.P.; Rangel, A.O.S.S.; Alonso-Chamarro, J. Automated analytical microsystem for the spectrophotometric monitoring of titratable acidity in white, rosé and red wines. Anal. Chim. Acta 2019, 1091, 50–58. [Google Scholar] [CrossRef] [PubMed] [Green Version]
- Alahmad, W.; Uraisin, K.; Nacapricha, D.; Kaneta, T. A miniaturized chemiluminescence detection system for a microfluidic paper-based analytical device and its application to the determination of chromium(iii). Anal. Methods 2016, 8, 5414–5420. [Google Scholar] [CrossRef]
- Al-Tamrah, S.A.; Abdalla, M.A.; Al-Otibi, A.A. Spectrophotometric determination of norfloxacin using bromophenol blue. Arab. J. Chem. 2019, 12, 3993–3997. [Google Scholar] [CrossRef] [Green Version]
- Mostafa, S.; El-Sadek, M.; Alla, E.A. Spectrophotometric determination of ciprofloxacin, enrofloxacin and pefloxacin through charge transfer complex formation. J. Pharm. Biomed. Anal. 2001, 27, 133–142. [Google Scholar] [CrossRef] [PubMed]
- Firdaus, M.L.; Saputra, E.; Ginting, S.M.; Wyantuti, S.; Eddy, D.R.; Rahmidar, L.; Yuliarto, B. Smartphone-based digital image colorimetry for non-enzymatic detection of glucose using gold nanoparticles. Sens. Bio-Sens. Res. 2022, 35, 100472. [Google Scholar] [CrossRef]
- El Walily, A.F.M.; Belal, S.F.; Bakry, R.S. Spectrophotometric and spectrofluorimetric estimation of ciprofloxacin and norfloxacin by ternary complex formation with eosin and palladium(II). J. Pharm. Biomed. Anal. 1996, 14, 561–569. [Google Scholar] [CrossRef]
- Ren, K.; Liang, Q.; Mu, X.; Luo, G.; Wang, Y. Miniaturized high throughput detection system for capillary array electrophoresis on chip with integrated light emitting diode array as addressed ring-shaped light source. Lab Chip 2008, 9, 733–736. [Google Scholar] [CrossRef]
- Yao, B.; Luo, G.; Wang, L.; Gao, Y.; Lei, G.; Ren, K.; Chen, L.; Wang, Y.; Hu, Y.; Qiu, Y. A microfluidic device using a green organic light emitting diode as an integrated excitation source. Lab Chip 2005, 5, 1041–1047. [Google Scholar] [CrossRef]
- Barzallo, D.; Danchana, K.; Cerdà, V.; Palacio, E. Design of an automatic spectrophotometric system. Talanta 2020, 218, 121163. [Google Scholar] [CrossRef] [PubMed]
- Santos, F.G.; Maya, F.; dos Reis, B.F.; Zagatto, E.A.G.; Cerdà, V. Flow-based determination of lead exploiting in-syringe dispersive liquid-liquid micro-extraction in xylene and integrated spectrophotometric detection. Talanta 2022, 247, 123528. [Google Scholar] [CrossRef] [PubMed]
- Firdaus, M.L.; Alwi, W.; Trinoveldi, F.; Rahayu, I.; Rahmidar, L.; Warsito, K. Determination of Chromium and Iron Using Digital Image-based Colorimetry. Procedia Environ. Sci. 2014, 20, 298–304. [Google Scholar] [CrossRef] [Green Version]
- Lamarca, R.S.; de Lima Gomes, P.C.F. A low cost method for carbamazepine, ciprofloxacin and norfloxacin determination in pharmaceutical formulations based on spot-test and smartphone images. Microchem. J. 2020, 152, 104297. [Google Scholar] [CrossRef]
- da Silva, E.K.; dos Santos, V.B.; Resque, I.S.; Neves, C.A.; Moreira, S.G.C.; Franco, M.D.O.K.; Suarez, E.W.T. A fluorescence digital image-based method using a 3D-printed platform and a UV-LED chamber made of polyacid lactic for quinine quantification in beverages. Microchem. J. 2020, 157, 104986. [Google Scholar] [CrossRef]
- Yang, K.; Peretz-Soroka, H.; Liu, Y.; Lin, F. Novel developments in mobile sensing based on the integration of microfluidic devices and smartphones. Lab Chip 2016, 16, 943–958. [Google Scholar] [CrossRef] [Green Version]
- Cocovi-Solberg, D.J.; Miró, M. 3D printed extraction devices in the analytical laboratory—A case study of Soxhlet extraction. Anal. Bioanal. Chem. 2021, 413, 4373–4378. [Google Scholar] [CrossRef]
- Hossain, A.; Canning, J.; Cook, K.; Jamalipour, A. Optical fiber smartphone spectrometer. Opt. Lett. 2016, 41, 2237–2240. [Google Scholar] [CrossRef]
- Grasse, E.K.; Torcasio, M.H.; Smith, A.W. Teaching UV–Vis Spectroscopy with a 3D-Printable Smartphone Spectrophotometer. J. Chem. Educ. 2016, 93, 146–151. [Google Scholar] [CrossRef]
- Zangheri, M.; Cevenini, L.; Anfossi, L.; Baggiani, C.; Simoni, P.; Di Nardo, F.; Roda, A. A simple and compact smartphone accessory for quantitative chemiluminescence-based lateral flow immunoassay for salivary cortisol detection. Biosens. Bioelectron. 2015, 64, 63–68. [Google Scholar] [CrossRef]
- Bueno, D.; Muñoz, R.; Marty, J.L. Fluorescence analyzer based on smartphone camera and wireless for detection of Ochratoxin A. Sens. Actuators B Chem. 2016, 232, 462–468. [Google Scholar] [CrossRef]
- Choodum, A.; Kanatharana, P.; Wongniramaikul, W.; NicDaeid, N. Rapid quantitative colourimetric tests for trinitrotoluene (TNT) in soil. Forensic Sci. Int. 2012, 222, 340–345. [Google Scholar] [CrossRef]
- Apyari, V.V.; Dmitrienko, S. Using a digital camera and computer data processing for the determination of organic substances with diazotized polyurethane foams. J. Anal. Chem. 2008, 63, 530–537. [Google Scholar] [CrossRef]
- Dantas, H.V.; Barbosa, M.F.; Pereira, A.; Pontes, M.J.; Moreira, P.N.; Araújo, M.C. An inexpensive NIR LED Webcam photometer for detection of adulterations in hydrated ethyl alcohol fuel. Microchem. J. 2017, 135, 148–152. [Google Scholar] [CrossRef]
- Lima, M.B.; Andrade, S.I.E.; Neta, M.S.S.; Barreto, I.S.; Almeida, L.F.; Araújo, M.C.U. A Micro-Flow-Batch Analyzer using Webcam for Spectrophotometric Determination of Ortho -phosphate and Aluminium(III) in Tap Water. J. Braz. Chem. Soc. 2014, 25, 898–906. [Google Scholar] [CrossRef]
- Rasooly, R.; Bruck, H.A.; Balsam, J.; Prickril, B.; Ossandon, M.; Rasooly, A. Improving the Sensitivity and Functionality of Mobile Webcam-Based Fluorescence Detectors for Point-of-Care Diagnostics in Global Health. Diagnostics 2016, 6, 19. [Google Scholar] [CrossRef] [Green Version]
- Morbioli, G.G.; Mazzu-Nascimento, T.; Stockton, A.M.; Carrilho, E. Technical aspects and challenges of colorimetric detection with microfluidic paper-based analytical devices (μPADs)–A review. Anal. Chim. Acta 2017, 970, 1–22. [Google Scholar] [CrossRef] [PubMed]
- Komatsu, T.; Mohammadi, S.; Busa, L.S.A.; Maeki, M.; Ishida, A.; Tani, H.; Tokeshi, M. Image analysis for a microfluidic paper-based analytical device using the CIE L*a*b* color system. Anal. 2016, 141, 6507–6509. [Google Scholar] [CrossRef] [Green Version]
- Luchiari, N.D.C.; da Silva, G.A.; Júnior, C.A.M.; de Lima Gomes, P.C.F. Development of miniaturized fluorimetric device for caffeine determination using a smartphone. RSC Adv. 2019, 9, 35033–35038. [Google Scholar] [CrossRef] [Green Version]
- Danchana, K.; Cerdà, V. Design of a portable spectrophotometric system part II: Using a digital microscope as detector. Talanta 2020, 216, 120977. [Google Scholar] [CrossRef]
- Roda, A.; Guardigli, M.; Calabria, D.; Calabretta, M.M.; Cevenini, L.; Michelini, E. A 3D-printed device for a smartphone-based chemiluminescence biosensor for lactate in oral fluid and sweat. Analyst 2014, 139, 6494–6501. [Google Scholar] [CrossRef]
- Seifrtová, M.; Nováková, L.; Lino, C.; Pena, A.; Solich, P. An overview of analytical methodologies for the determination of antibiotics in environmental waters. Anal. Chim. Acta 2009, 649, 158–179. [Google Scholar] [CrossRef]
- Jia, A.; Wan, Y.; Xiao, Y.; Hu, J. Occurrence and fate of quinolone and fluoroquinolone antibiotics in a municipal sewage treatment plant. Water Res. 2012, 46, 387–394. [Google Scholar] [CrossRef] [PubMed]
- Chen, G.; Liu, X.; Tartakevosky, D.; Li, M. Risk assessment of three fluoroquinolone antibiotics in the groundwater recharge system. Ecotoxicol. Environ. Saf. 2016, 133, 18–24. [Google Scholar] [CrossRef] [PubMed]
- Sukul, P.; Spiteller, M. Fluoroquinolone Antibiotics in the Environment. In Reviews of Environmental Contamination and Toxicology; Springer: New York, NY, USA, 2007; Volume 191, pp. 131–162. [Google Scholar] [CrossRef]
- Yiruhan; Wang, Q.-J.; Mo, C.-H.; Li, Y.-W.; Gao, P.; Tai, Y.-P.; Zhang, Y.; Ruan, Z.-L.; Xu, J.-W. Determination of four fluoroquinolone antibiotics in tap water in Guangzhou and Macao. Environ. Pollut. 2010, 158, 2350–2358. [Google Scholar] [CrossRef] [PubMed]
- Meng, X.; Ma, Q.; Zhang, Q.; Lv, Q.; Bai, H.; Wang, C.; Li, W. Simultaneous determination of 16 fluoroquinolone antibiotics in cosmetics by ultra-performance liquid chromatography/triple quadrupole mass spectrometry with ultrasound-assisted extraction and solid-phase extraction. Anal. Methods 2015, 7, 675–683. [Google Scholar] [CrossRef]
- Bişgin, A.T.; Uçan, M.; Narin, I. Comparison of Column Solid-Phase Extraction Procedures for Spectrophotometric Determination of E129 (Allura Red) in Foodstuff, Pharmaceutical, and Energy Drink Samples. J. AOAC Int. 2015, 98, 946–952. [Google Scholar] [CrossRef]
- Rovina, K.; Siddiquee, S.; Shaarani, S.M. Extraction, Analytical and Advanced Methods for Detection of Allura Red AC (E129) in Food and Beverages Products. Front. Microbiol. 2016, 7, 798. [Google Scholar] [CrossRef] [Green Version]
- EFSA Panel on Food Additives and Nutrient Sources Added to Food. Scientific Opinion on the re-evaluation of Allura Red AC (E 129) as a food additive. EFSA J. 2009, 7, 1327. [Google Scholar] [CrossRef]
- EUR-Lex-32012R0872-EN-EUR-Lex, (n.d.). Available online: https://eur-lex.europa.eu/legal-content/es/TXT/?uri=CELEX%3A32012R0872 (accessed on 8 May 2020).
- Michalec, M.; Koncki, R.; Tymecki, Ł. Optoelectronic detectors for flow analysis systems manufactured by means of rapid prototyping technology. Talanta 2019, 198, 169–178. [Google Scholar] [CrossRef]
- Danchana, K.; Phansi, P.; de Souza, C.T.; Ferreira, S.L.; Cerdà, V. Spectrophotometric system based on a device created by 3D printing for the accommodation of a webcam chamber as a detection system. Talanta 2019, 206, 120250. [Google Scholar] [CrossRef] [PubMed]
- Pokrzywnicka, M.; Fiedoruk, M.; Koncki, R. Compact optoelectronic flow-through device for fluorometric determination of calcium ions. Talanta 2012, 93, 106–110. [Google Scholar] [CrossRef] [PubMed]
- Kaur, K.; Kumar, A.; Malik, A.K.; Singh, B.; Rao, A.L.J. Spectrophotometric Methods for the Determination of Fluoroquinolones: A Review. Crit. Rev. Anal. Chem. 2008, 38, 2–18. [Google Scholar] [CrossRef]
- Ngumba, E.; Kosunen, P.; Gachanja, A.; Tuhkanen, T. A multiresidue analytical method for trace level determination of antibiotics and antiretroviral drugs in wastewater and surface water using SPE-LC-MS/MS and matrix-matched standards. Anal. Methods 2016, 8, 6720–6729. [Google Scholar] [CrossRef] [Green Version]
- FAO/WHO. Combined Compendium of Food Additive Specifications. All Specifications Monographs from the 1st to the 65th Meeting (1956–2005), FAO JECFA Monogr. 1. 2006. Available online: https://www.fao.org/3/a0691e/A0691E00.htm#Contents (accessed on 6 October 2022).
- Infante, C.M.C.; Masini, J.C. Development of a fluorimetric sequential injection analysis (SIA) methodology for determination of quinine. J. Braz. Chem. Soc. 2011, 22, 1888–1893. [Google Scholar] [CrossRef] [Green Version]
- Granica, M.; Tymecki, Ł. Analytical aspects of smart (phone) fluorometric measurements. Talanta 2019, 197, 319–325. [Google Scholar] [CrossRef] [PubMed]
- ICH Q2(R1) Validation of Analytical Procedures: Text and Methodology–ECA Academy, (n.d.). Available online: https://www.gmp-compliance.org/guidelines/gmp-guideline/ich-q2r1-validation-of-analytical-procedures-text-and-methodology (accessed on 7 May 2020).
- Madalina Jurcovan, M.; Diacu, E. Development of a Reversed-Phase High Performance Liquid Chromatographic Method for Simultaneous Determination of Allura Red AC and Ponceau 4R in Soft Drinks. 2014. Available online: http://www.revistadechimie.ro (accessed on 14 June 2020).
- López-De-Alba, P.L.; Wróbel-Kaczmarczyk, K.; Wróbel, K.; López-Martínez, L.; Hernández, J.A. Spectrophotometric determination of Allura Red (R40) in soft drink powders using the universal calibration matrix for partial least squares multivariate method. Anal. Chim. Acta 1996, 330, 19–29. [Google Scholar] [CrossRef]
- Chanlon, S.; Joly-Pottuz, L.; Chatelut, M.; Vittori, O.; Cretier, J. Determination of Carmoisine, Allura red and Ponceau 4R in sweets and soft drinks by Differential Pulse Polarography. J. Food Compos. Anal. 2005, 18, 503–515. [Google Scholar] [CrossRef]
- Al-Degs, Y.S. Determination of three dyes in commercial soft drinks using HLA/GO and liquid chromatography. Food Chem. 2009, 117, 485–490. [Google Scholar] [CrossRef]
- Buleandra, M.; Rabinca, A.A.; Cheregi, M.C.; Ciucu, A.A. Rapid voltammetric method for quinine determination in soft drinks. Food Chem. 2018, 253, 1–4. [Google Scholar] [CrossRef]
- Tzanavaras, P.D.; Zacharis, C.; Karakosta, T.; Zotou, A.; Themelis, D.G. High-Throughput Determination of Quinine in Beverages and Soft Drinks Based on Zone-Fluidics Coupled to Monolithic Liquid Chromatography. Anal. Lett. 2013, 46, 1718–1731. [Google Scholar] [CrossRef]
- Feás, X.; Fente, C.A.; Cepeda, A. Fast and Sensitive New High-Performance Liquid Chromatography Laser Induced Fluorescence (HPLC-LIF) Method for Quinine. Comparative Study in Soft Drinks. J. Liq. Chromatogr. Relat. Technol. 2009, 32, 2600–2614. [Google Scholar] [CrossRef]
- O’Reilly, J.E. Fluorescence experiments with quinine. J. Chem. Educ. 1975, 52, 610. [Google Scholar] [CrossRef]
- Cheon, T.-M.; Cheong, B.-S.; Cho, H.-G.; Kim, J.-H.; Kim, K.-S. Quinine Assay with Home-Built UV-LED Fluorometer: Quantitative Analysis, Photo-Bleaching, Fluorescence Quenching, and Urine Analysis. J. Korean Chem. Soc. 2012, 56, 577–582. [Google Scholar] [CrossRef] [Green Version]
- de Oliveira Krambeck Franco, M.; Castro, G.A.D.; Vilanculo, C.; Fernandes, S.A.; Suarez, W.T. A color reaction for the determination of Cu2+ in distilled beverages employing digital imaging. Anal. Chim. Acta 2021, 1177, 338844. [Google Scholar] [CrossRef]
- Vidal, M.; Garcia-Arrona, R.; Bordagaray, A.; Ostra, M.; Albizu, G. Simultaneous determination of color additives tartrazine and allura red in food products by digital image analysis. Talanta 2018, 184, 58–64. [Google Scholar] [CrossRef]
- Yao, T.; Wang, H.; Si, X.; Yin, S.; Wu, T.; Wang, P. Determination of trace fluoroquinolones in water solutions and in medicinal preparations by conventional and synchronous fluorescence spectrometry. Open Chem. 2018, 16, 1122–1128. [Google Scholar] [CrossRef]
- Soylak, M.; Unsal, Y.E.; Tuzen, M. Spectrophotometric determination of trace levels of allura red in water samples after separation and preconcentration. Food Chem. Toxicol. 2011, 49, 1183–1187. [Google Scholar] [CrossRef]
- Vargas-Muñoz, M.; Danchana, K.; Cerdà, V.; Palacio, E. Field-deployable method for iron analysis using a simple preconcentration procedure and a 3D portable spectrophotometric system. Microchem. J. 2021, 170, 106774. [Google Scholar] [CrossRef]


| Analytical Parameters | NOR Determination | AR Determination | Quinine Determination | |||
|---|---|---|---|---|---|---|
| Webcam * 500 nm | Spectrophotometer | Webcam * 500 nm | Spectrophotometer | Webcam ** 351 nm | Spectrofluorometer | |
| Calibration curve (n = 3) | A = 0.0537 [NOR] + 0.0013 | A = 0.997 [NOR] + 0.0431 | A = 0.040 + [AR] + 0.0108 | A = 0.0451 [AR] + 0.0028 | I = 305.73 [quinine] + 14.108 | I = 412.86 [quinine] + 4.565 |
| Correlation coefficient (r2) | 0.995 | 0.995 | 0.993 | 0.998 | 0.996 | 0.997 |
| Linearity range (mg L−1) | 0.2–1.0 | 0.2–1.0 | 1–5 | 1–5 | 0.1–0.5 | 0.1–0.5 |
| LOD (mg L−1) | 0.06 | 0.04 | 0.25 | 0.23 | 0.02 | 0.001 |
| LOQ (mg L−1) | 0.20 | 0.15 | 0.85 | 0.75 | 0.06 | 0.005 |
| Repeatability (%RSD) (n = 5) | 1.4–3.7 | 1.9–3.3 | 0.7–1.3 | 0.7–1.0 | 1.3–2.6 | 0.6–1.7 |
| Reproducibility (%RSD) (n = 5) | 2.7–9.6 | 2.4–5.7 | 2.6–3.4 | 1.5–2.5 | 2.8–4.1 | 1.5–2.6 |
| Samples | Webcam System | Spectrophotometer | t-Test | |||
|---|---|---|---|---|---|---|
| Dilution Factor c | Added mg L−1 | Found ± S.D. mg L−1 | Spike Recovery (%) | Found ± S.D. mg L−1 | ||
| a Treated wastewater | - | 0 | <LOD | <LOD | 0.9 | |
| 0.25 | 0.22 ± 0.01 | 89 | 0.21 ± 0.014 | |||
| a Mineral water | - | 0 | <LOD | <LOD | 0.6 | |
| 0.25 | 0.24 ± 0.01 | 96 | 0.24 ± 0.015 | |||
| b Cherry soft drink | 10 | 0 | 2.95 ± 0.02 | 104 | 2.93 ± 0.02 | 0.3 |
| 1 | 3.99 ± 0.07 | |||||
| b Strawberry drink | 20 | 0 | 3.46 ± 0.02 | 101 | 3.44 ± 0.03 | 2.2 |
| 1 | 4.47 ± 0.01 | |||||
| b Grape drink | 10 | 0 | 1.72 ± 0.01 | 102 | 1.75 ± 0.04 | 0.1 |
| Samples | Webcam System Found ± S.D. mg L−1 | Spectrofluorometer Found ± S.D. mg L−1 | t-Test |
|---|---|---|---|
| Tonic Schweppes | 81.4 ± 1.4 | 80.4 ± 1.2 | 1.2 |
| Tonic water 2 | 65.3 ± 0.5 | 67.9 ± 1.8 | 2.0 |
| Nordic Mix | 62.1 ± 0.8 | 63.3 ± 1.2 | 1.9 |
| Analytical Technique | Compounds | Type of Sample | LOD (mg L−1) | Intra-Day Precision (RSD%) | Portability | Method Cost | Type Image Processing | Reference |
|---|---|---|---|---|---|---|---|---|
| Fluorescence spectrometry | Norfloxacin | Wastewater, Surface water, and drinking water | 0.022 | NR | No | High | - | [62] |
| SPE-Spectrophotometric | Allura red | Tap water and wastewater | 0.002 | <7 | No | High | - | [63] |
| Image digital colorimetry | ||||||||
| Smartphone detector | Norfloxacin | Pharmaceutical formulations | 1.0 | <5.9 | Si | Low | Manual | [14] |
| SPE-Webcam detector | Norfloxacin | Tap, mineral, and treated wastewater | 0.06 | <3.7 | Si | Low | Automatic | This work |
| Flatbed scanner | Allura Red | Beverages | 0.60 | <12% | No | Medium | Manual | [61] |
| Webcam detector | Allura red | Beverages | 0.25 | <1.3 | Si | Low | Automatic | This work |
| Fluorescence digital image | ||||||||
| Smartphone | Quinine, rhodamine B, and riboflavin | Beverages | 0.14 | <7.3 | Si | Low | Manual | [49] |
| Webcam detector | Quinine | Beverages | 0.002 | <2.6 | Si | Low | Automatic | This work |
Disclaimer/Publisher’s Note: The statements, opinions and data contained in all publications are solely those of the individual author(s) and contributor(s) and not of MDPI and/or the editor(s). MDPI and/or the editor(s) disclaim responsibility for any injury to people or property resulting from any ideas, methods, instructions or products referred to in the content. |
© 2023 by the authors. Licensee MDPI, Basel, Switzerland. This article is an open access article distributed under the terms and conditions of the Creative Commons Attribution (CC BY) license (https://creativecommons.org/licenses/by/4.0/).
Share and Cite
Barzallo, D.; Benavides, J.; Cerdà, V.; Palacio, E. Multifunctional Portable System Based on Digital Images for In-Situ Detecting of Environmental and Food Samples. Molecules 2023, 28, 2465. https://doi.org/10.3390/molecules28062465
Barzallo D, Benavides J, Cerdà V, Palacio E. Multifunctional Portable System Based on Digital Images for In-Situ Detecting of Environmental and Food Samples. Molecules. 2023; 28(6):2465. https://doi.org/10.3390/molecules28062465
Chicago/Turabian StyleBarzallo, Diego, Jorge Benavides, Víctor Cerdà, and Edwin Palacio. 2023. "Multifunctional Portable System Based on Digital Images for In-Situ Detecting of Environmental and Food Samples" Molecules 28, no. 6: 2465. https://doi.org/10.3390/molecules28062465