
Preparation and Surface Characterization of Chitosan-Based Coatings for PET Materials


Abstract
:
1. Introduction
2. Results and Discussion
2.1. Langmuir and Langmuir—Blodgett Monolayer Analysis
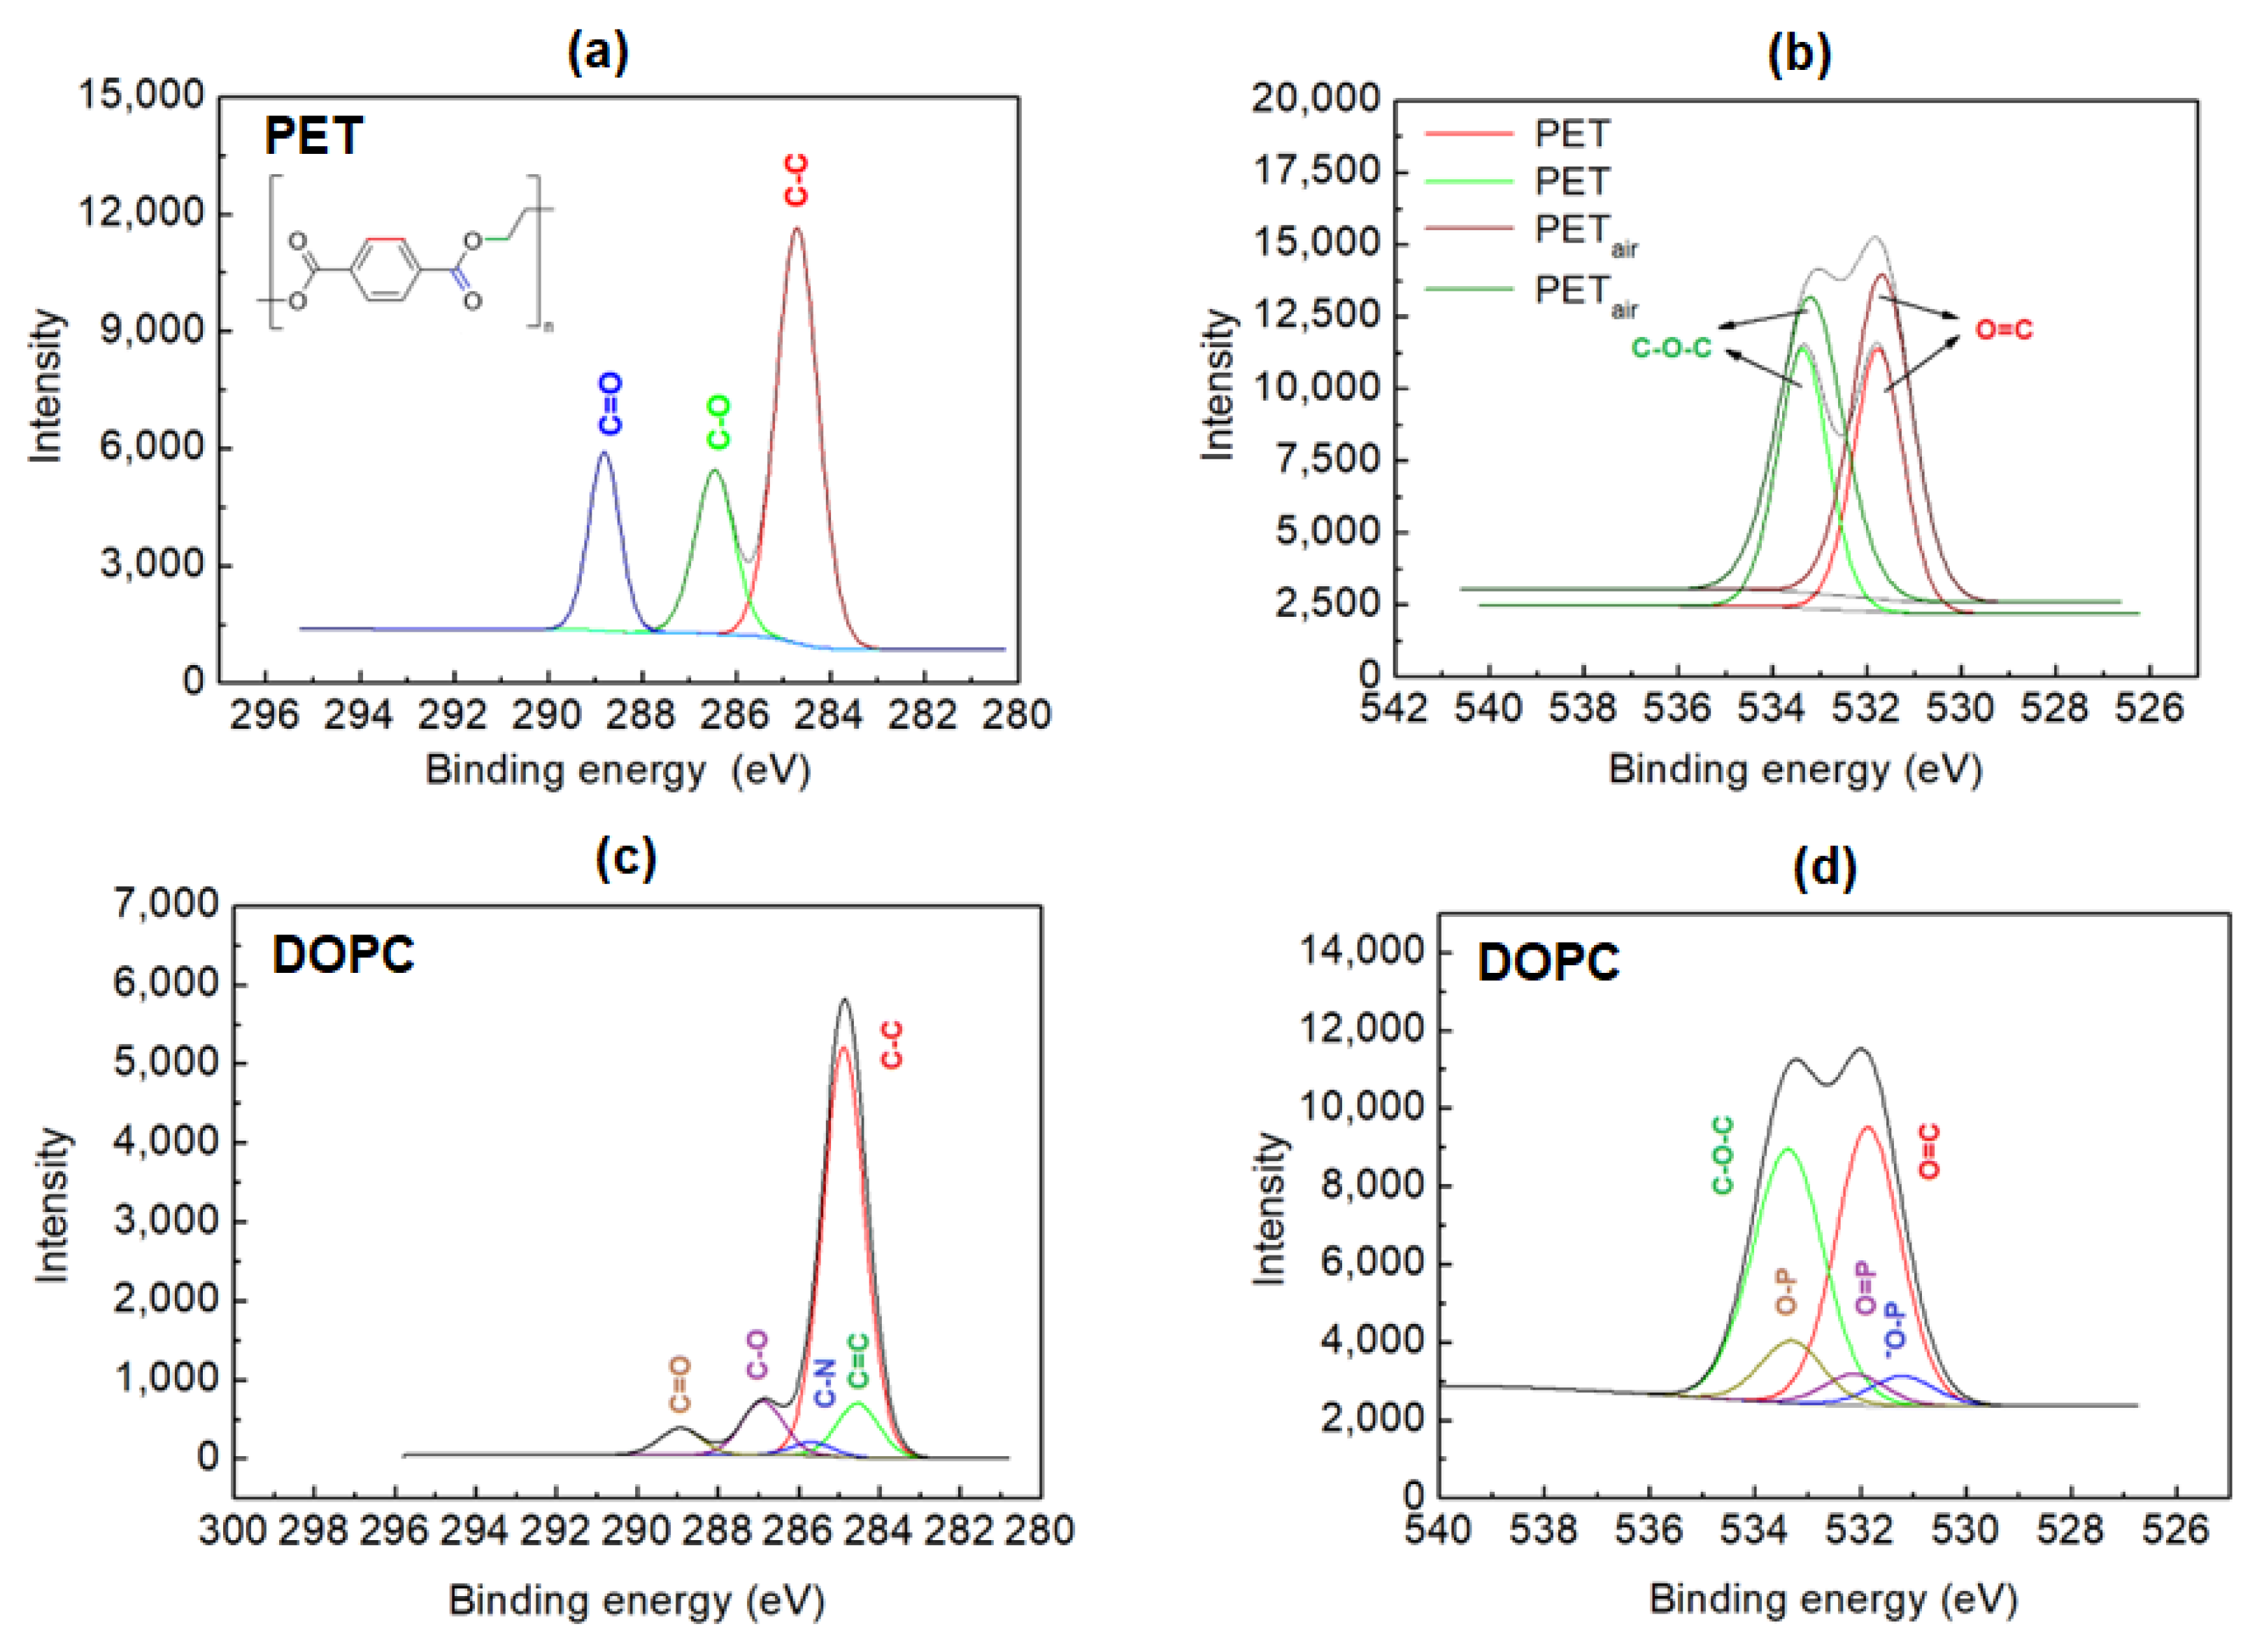
2.2. XPS Analysis
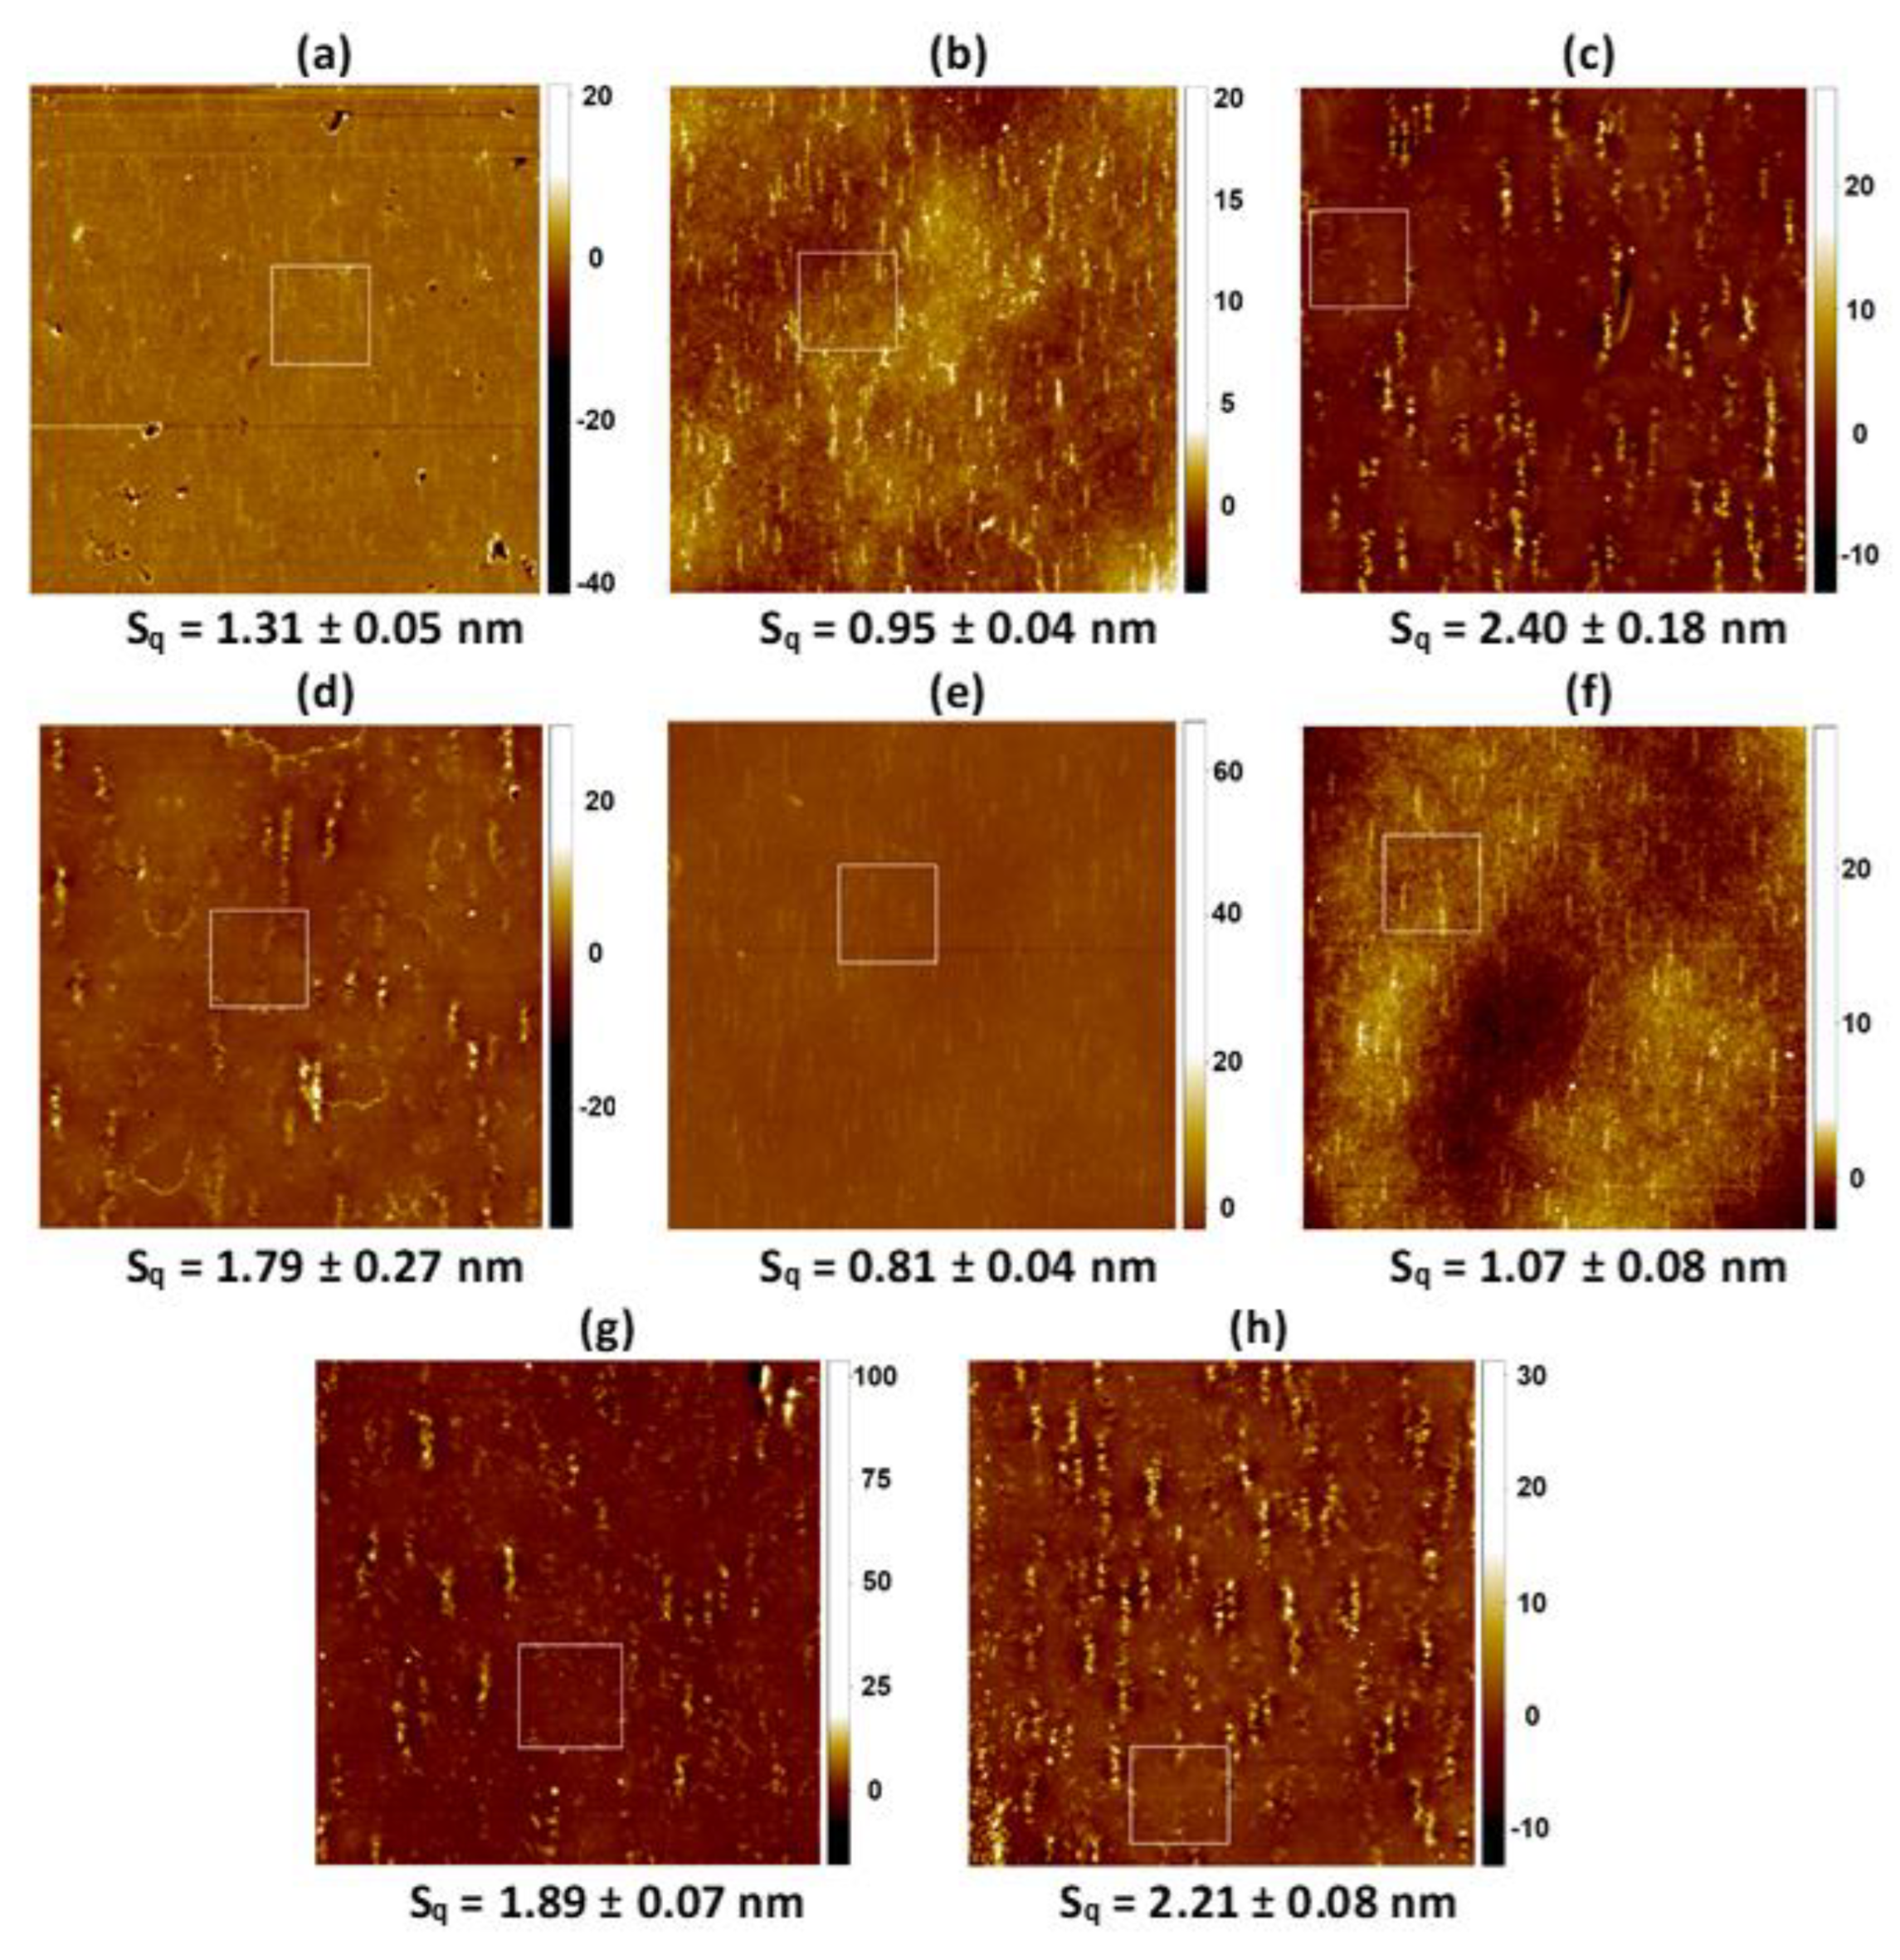
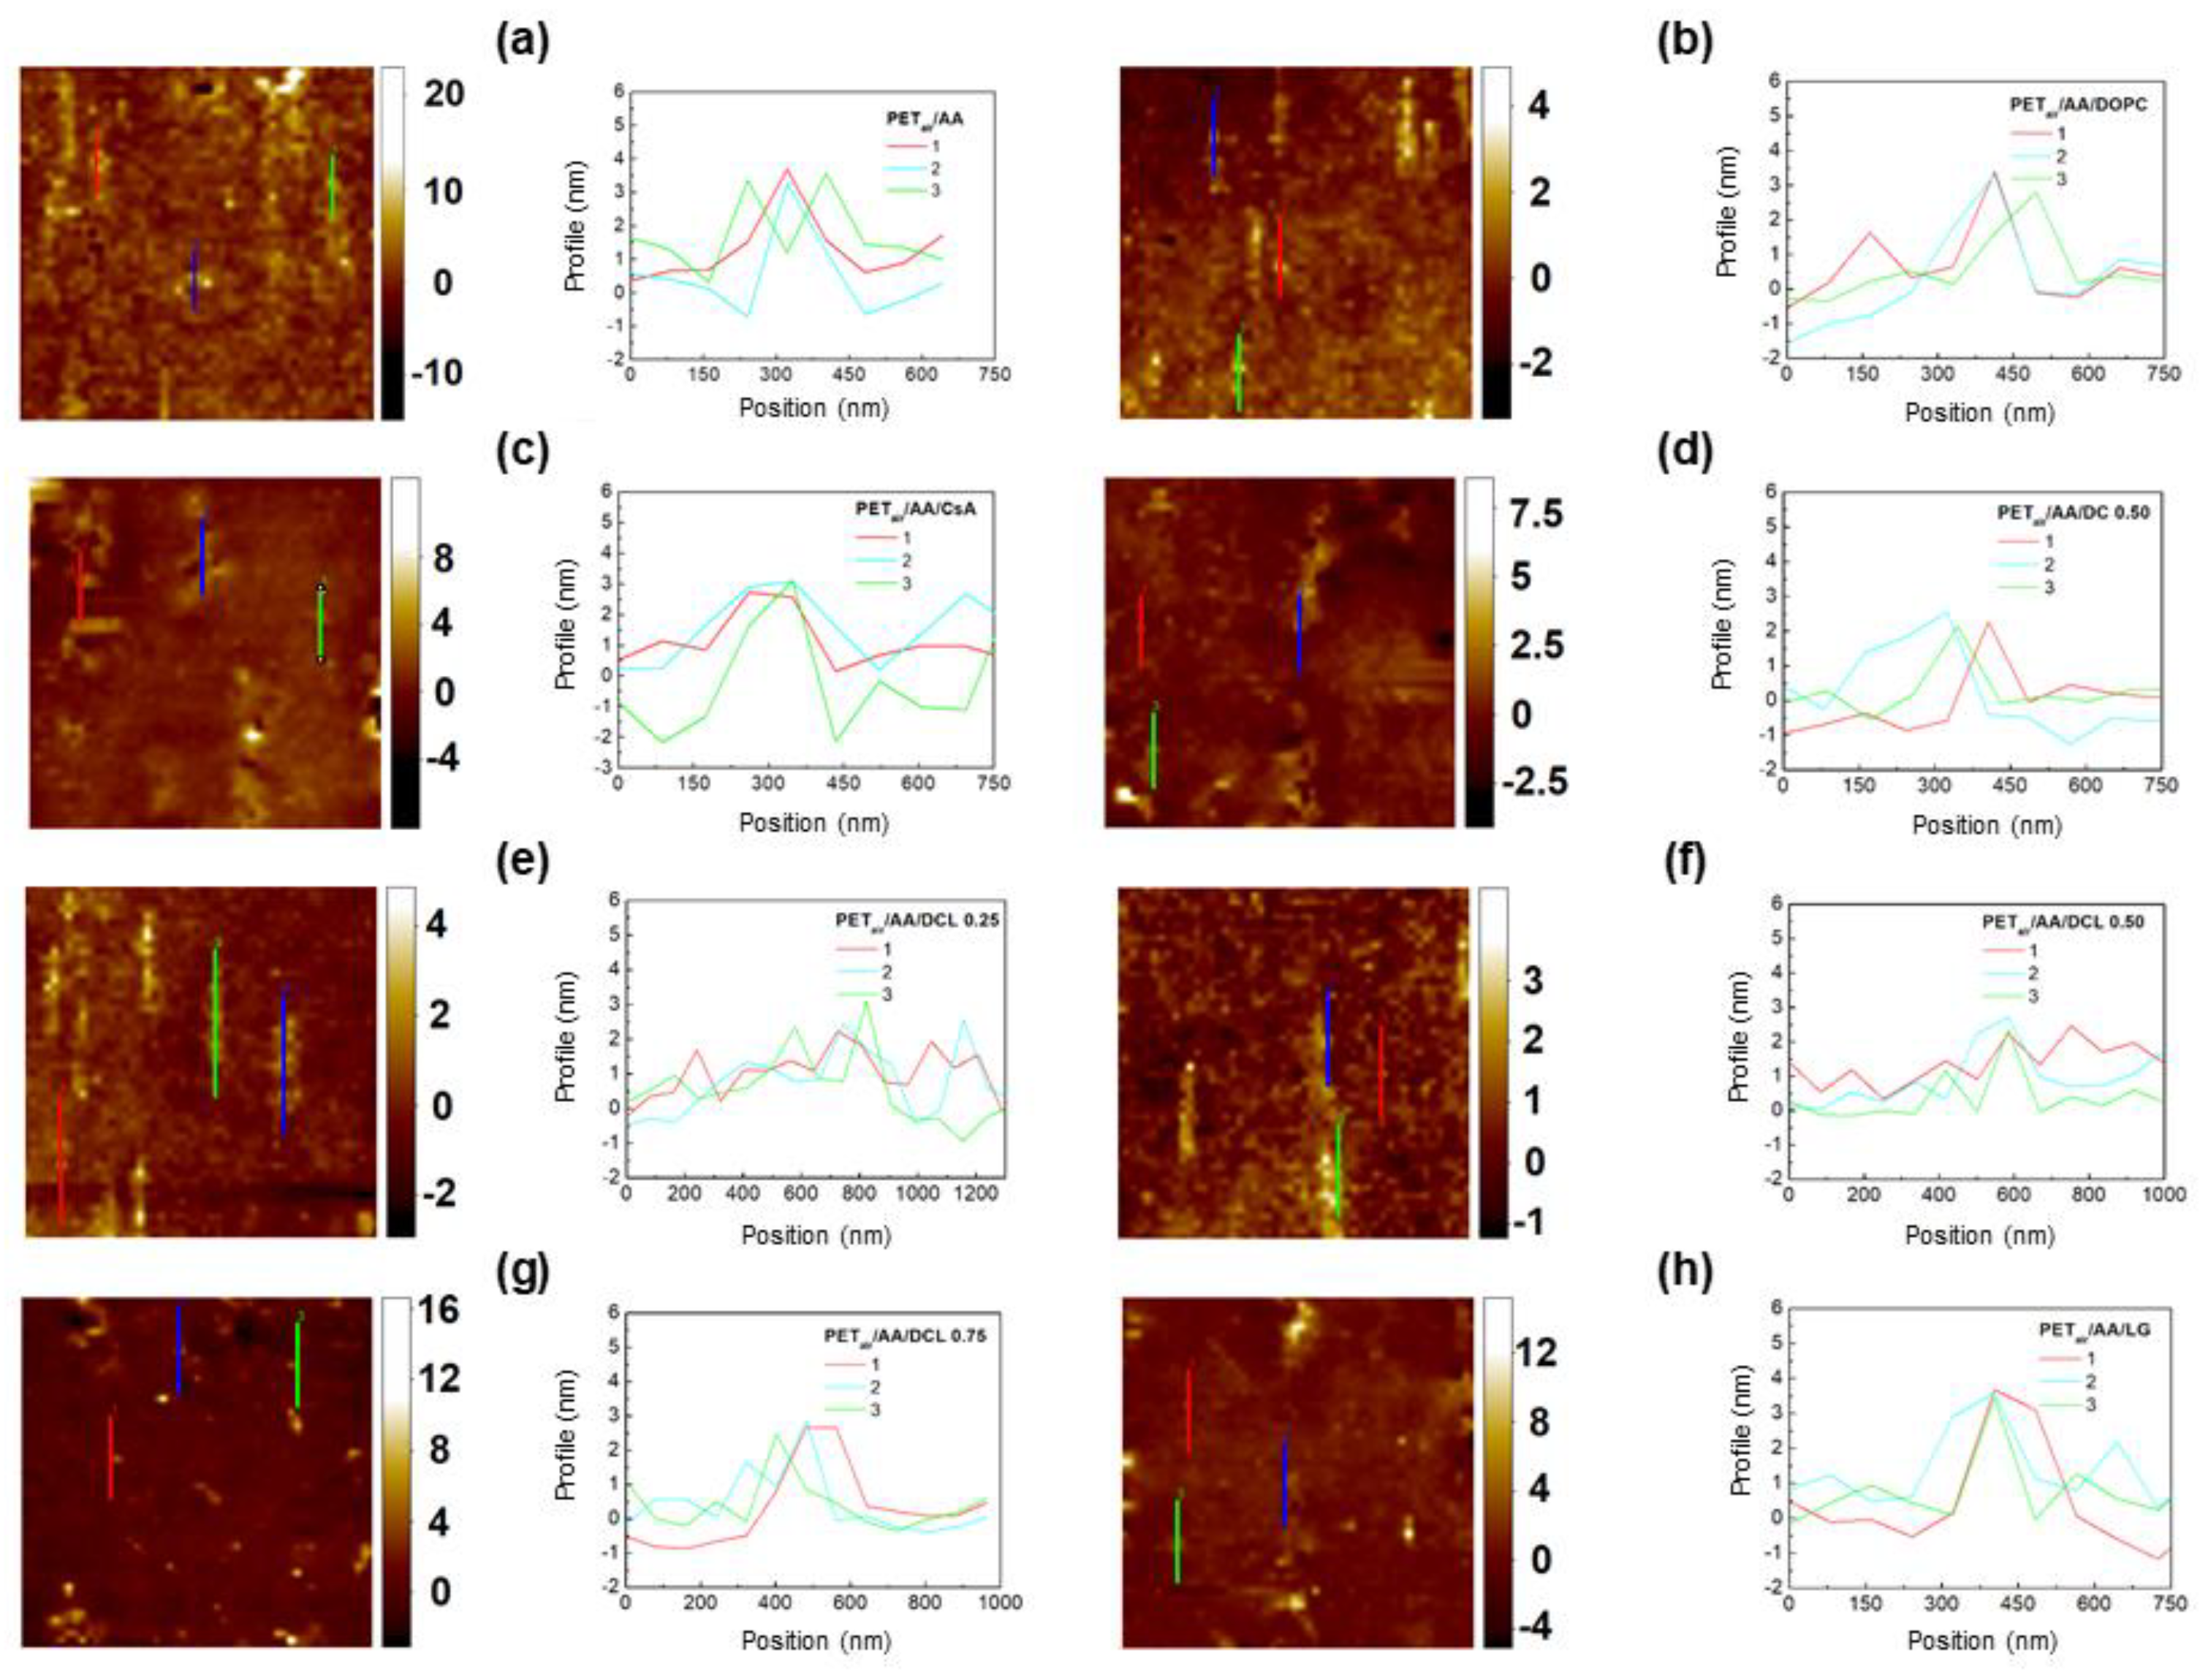
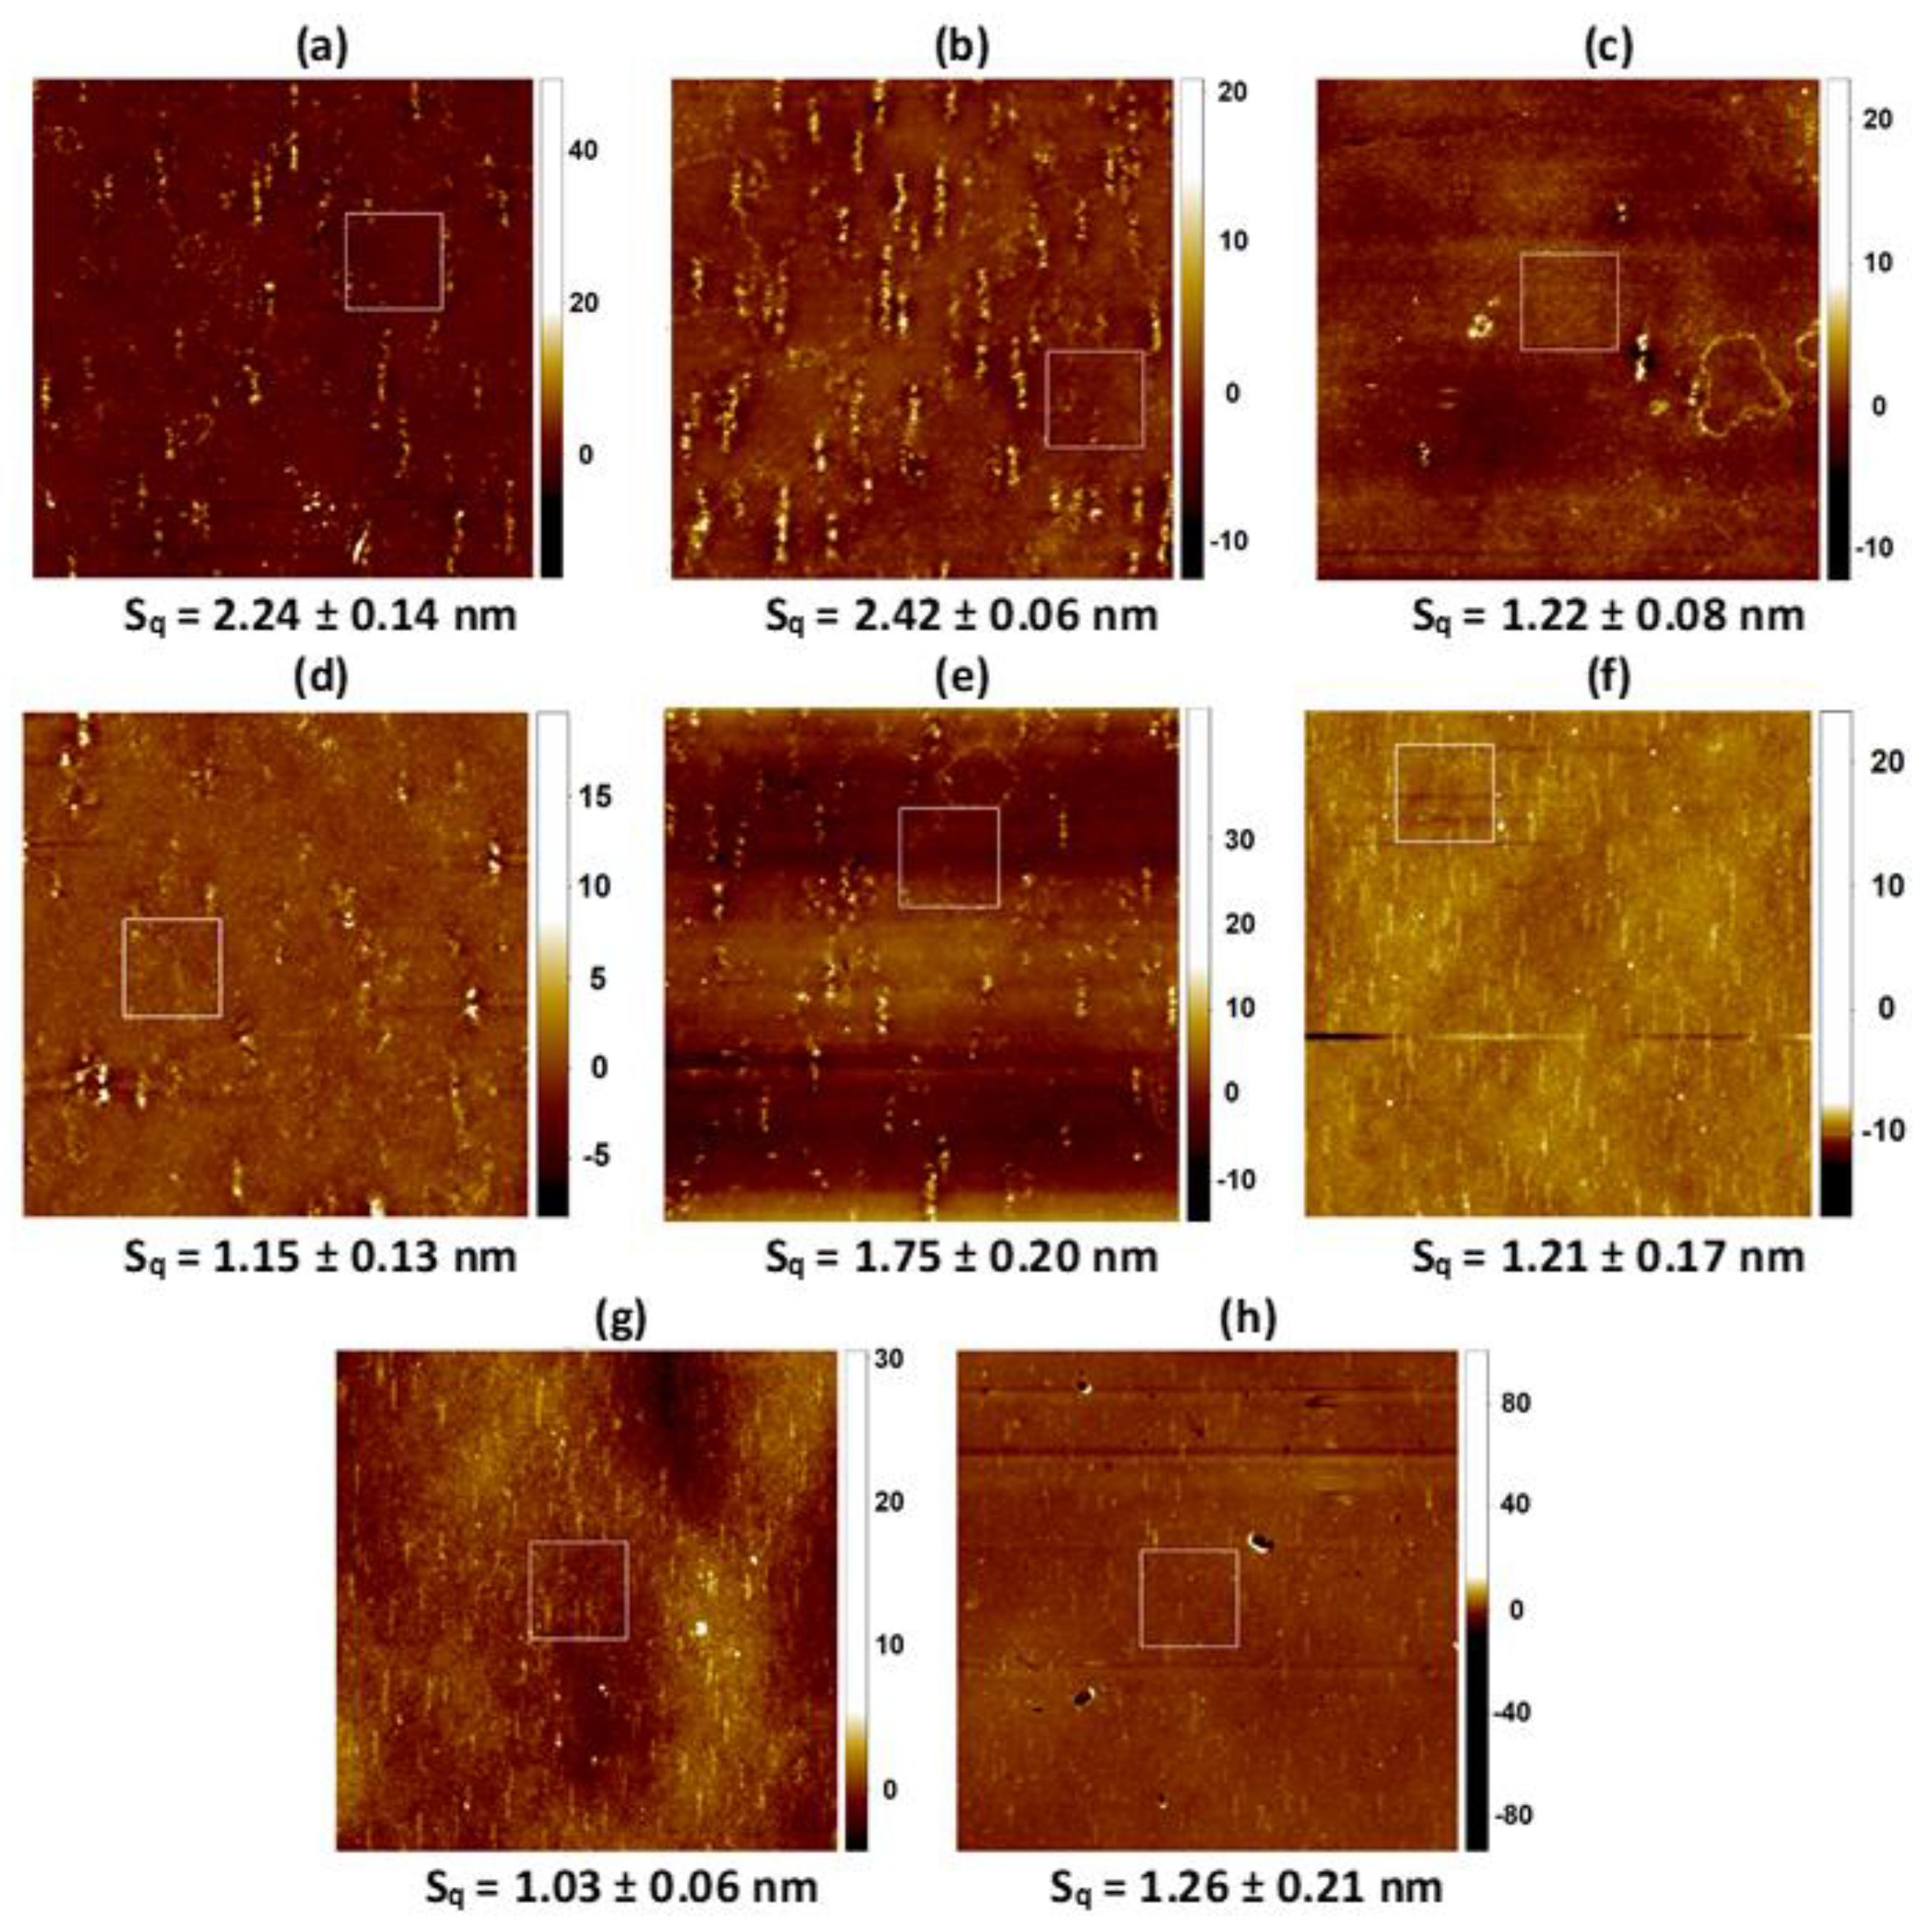
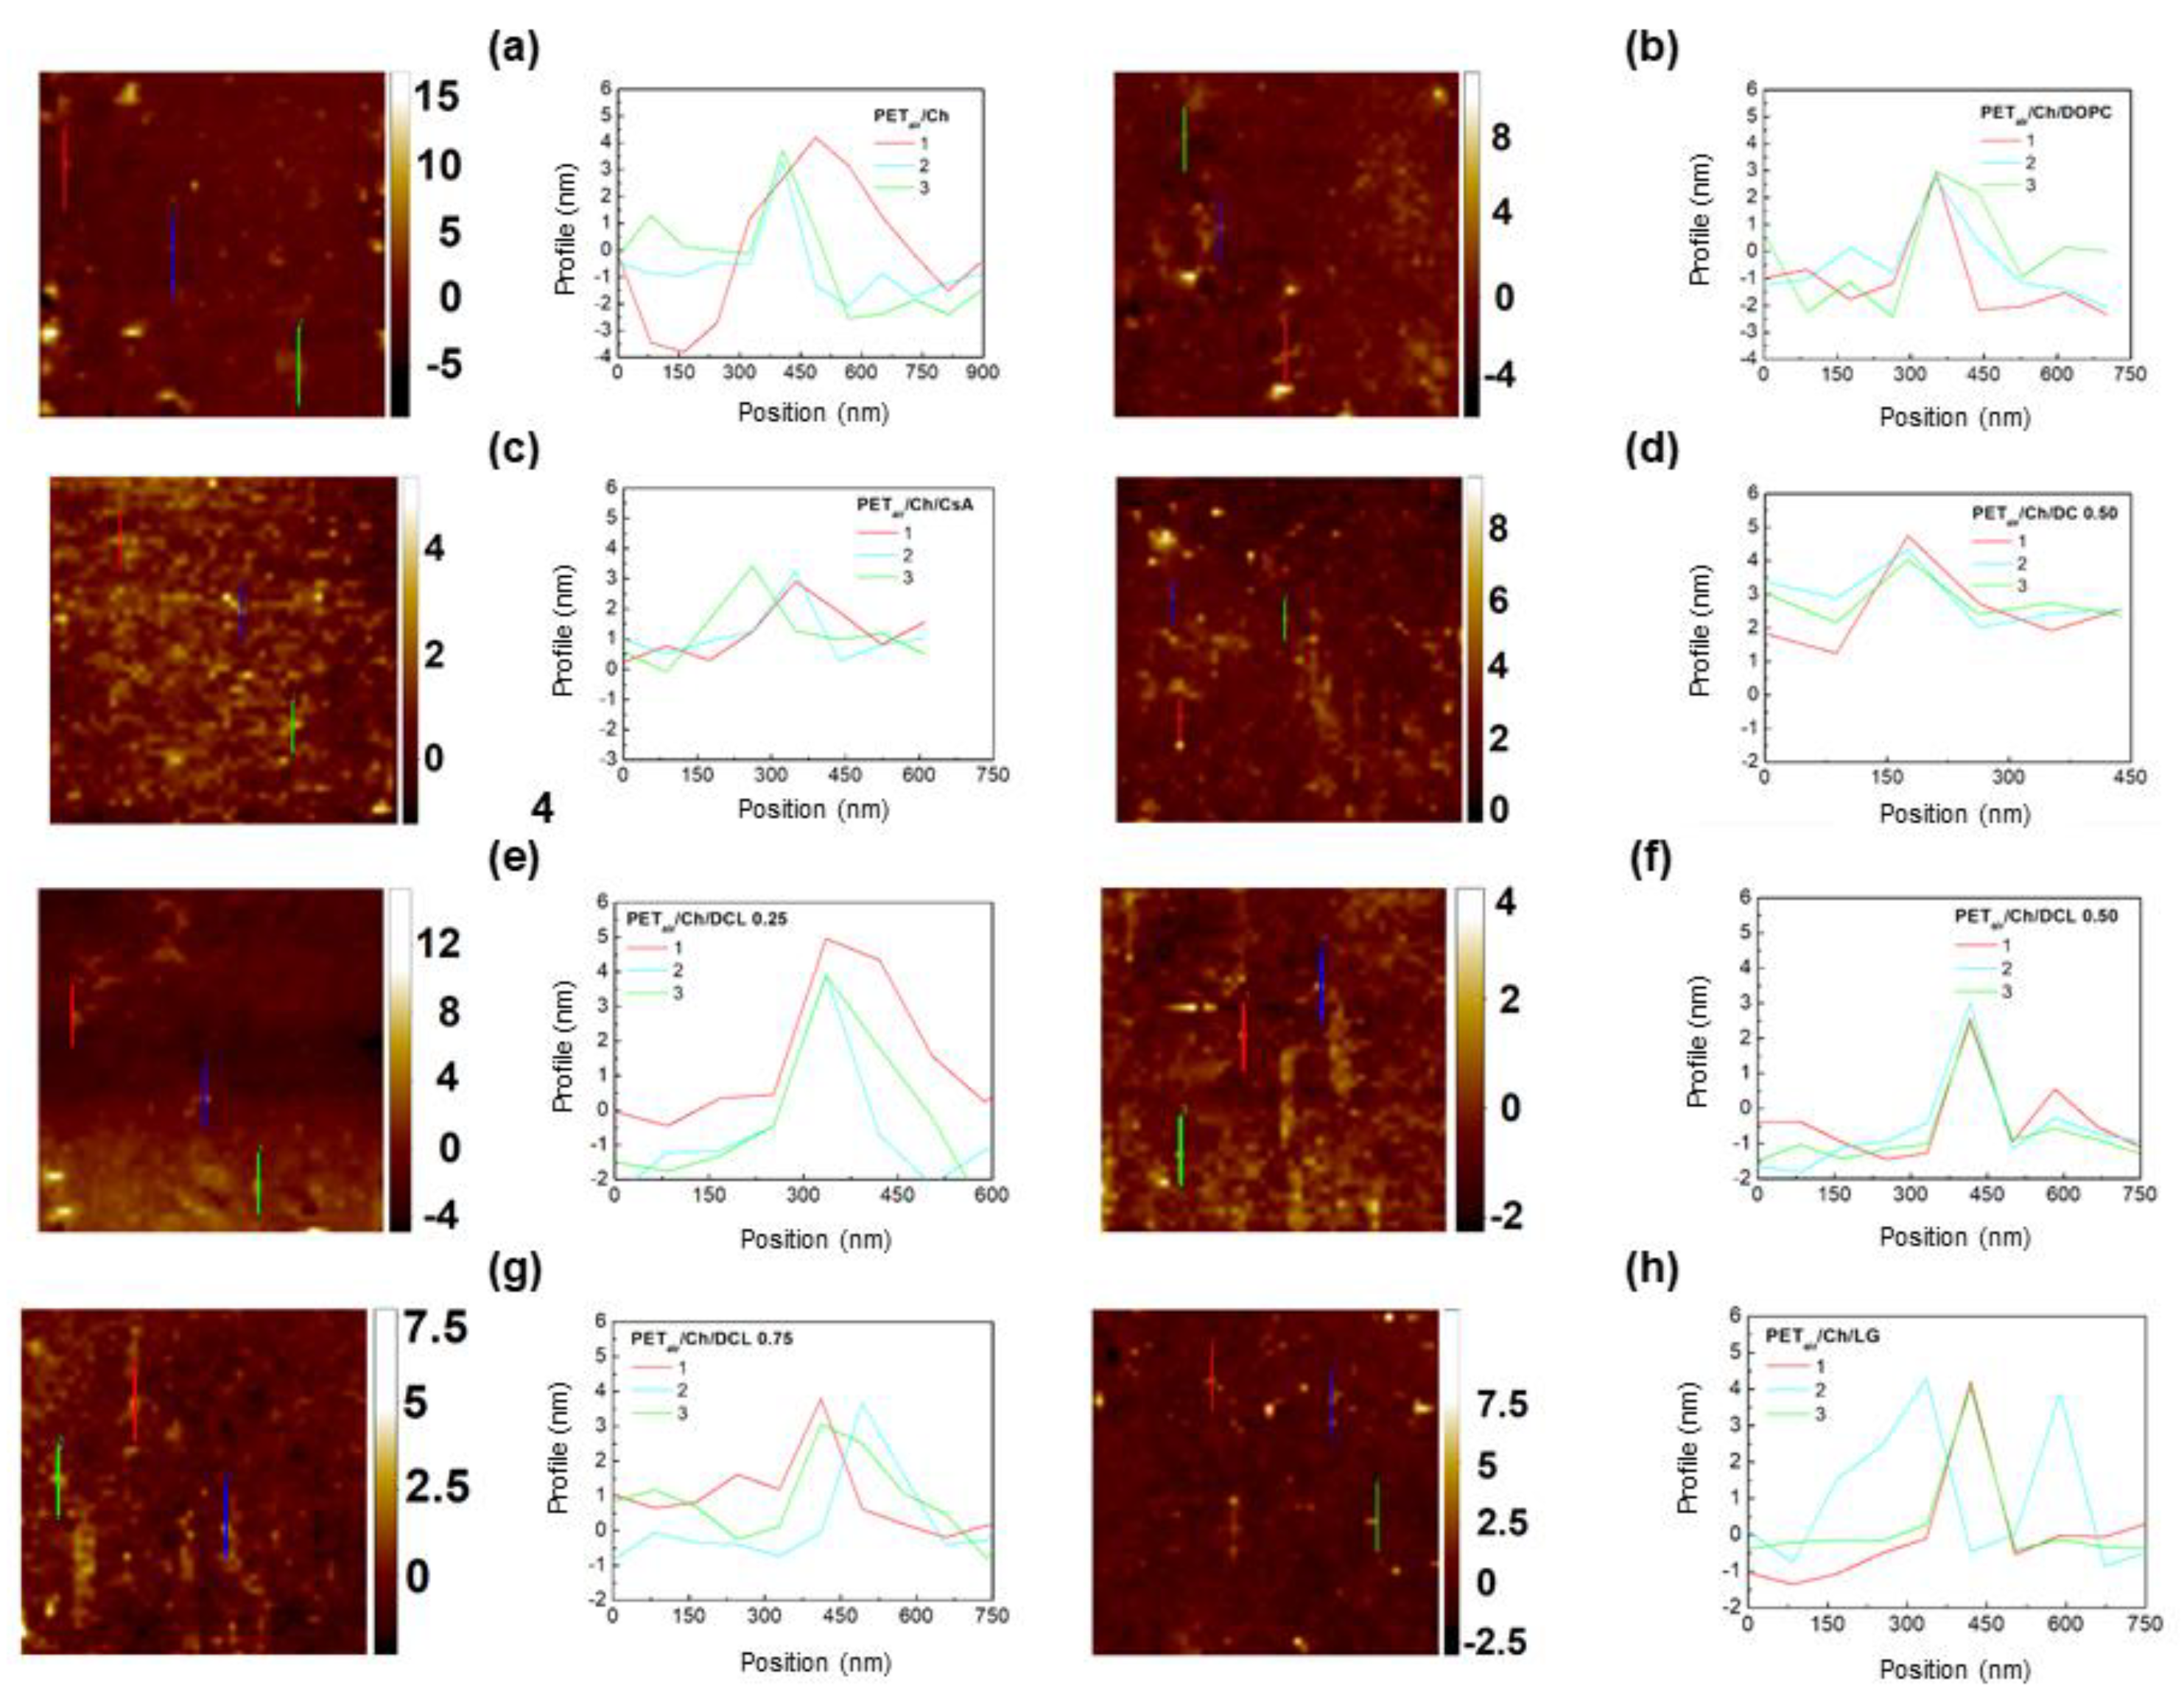
2.3. AFM Analysis
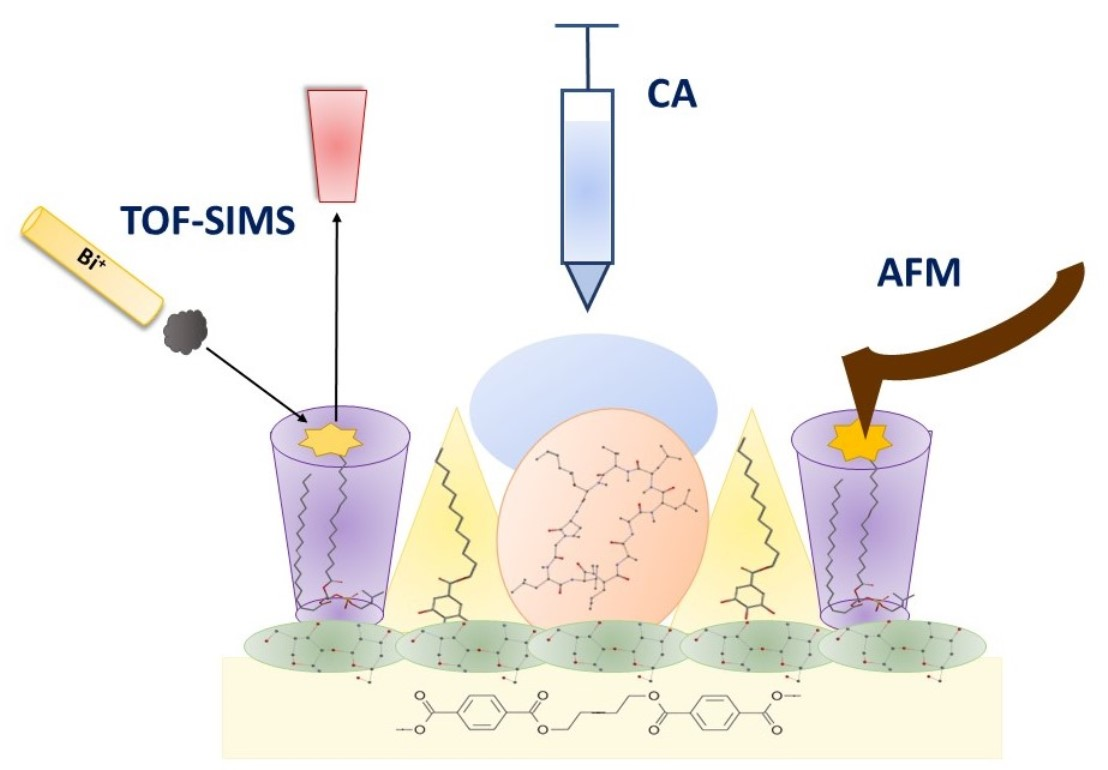
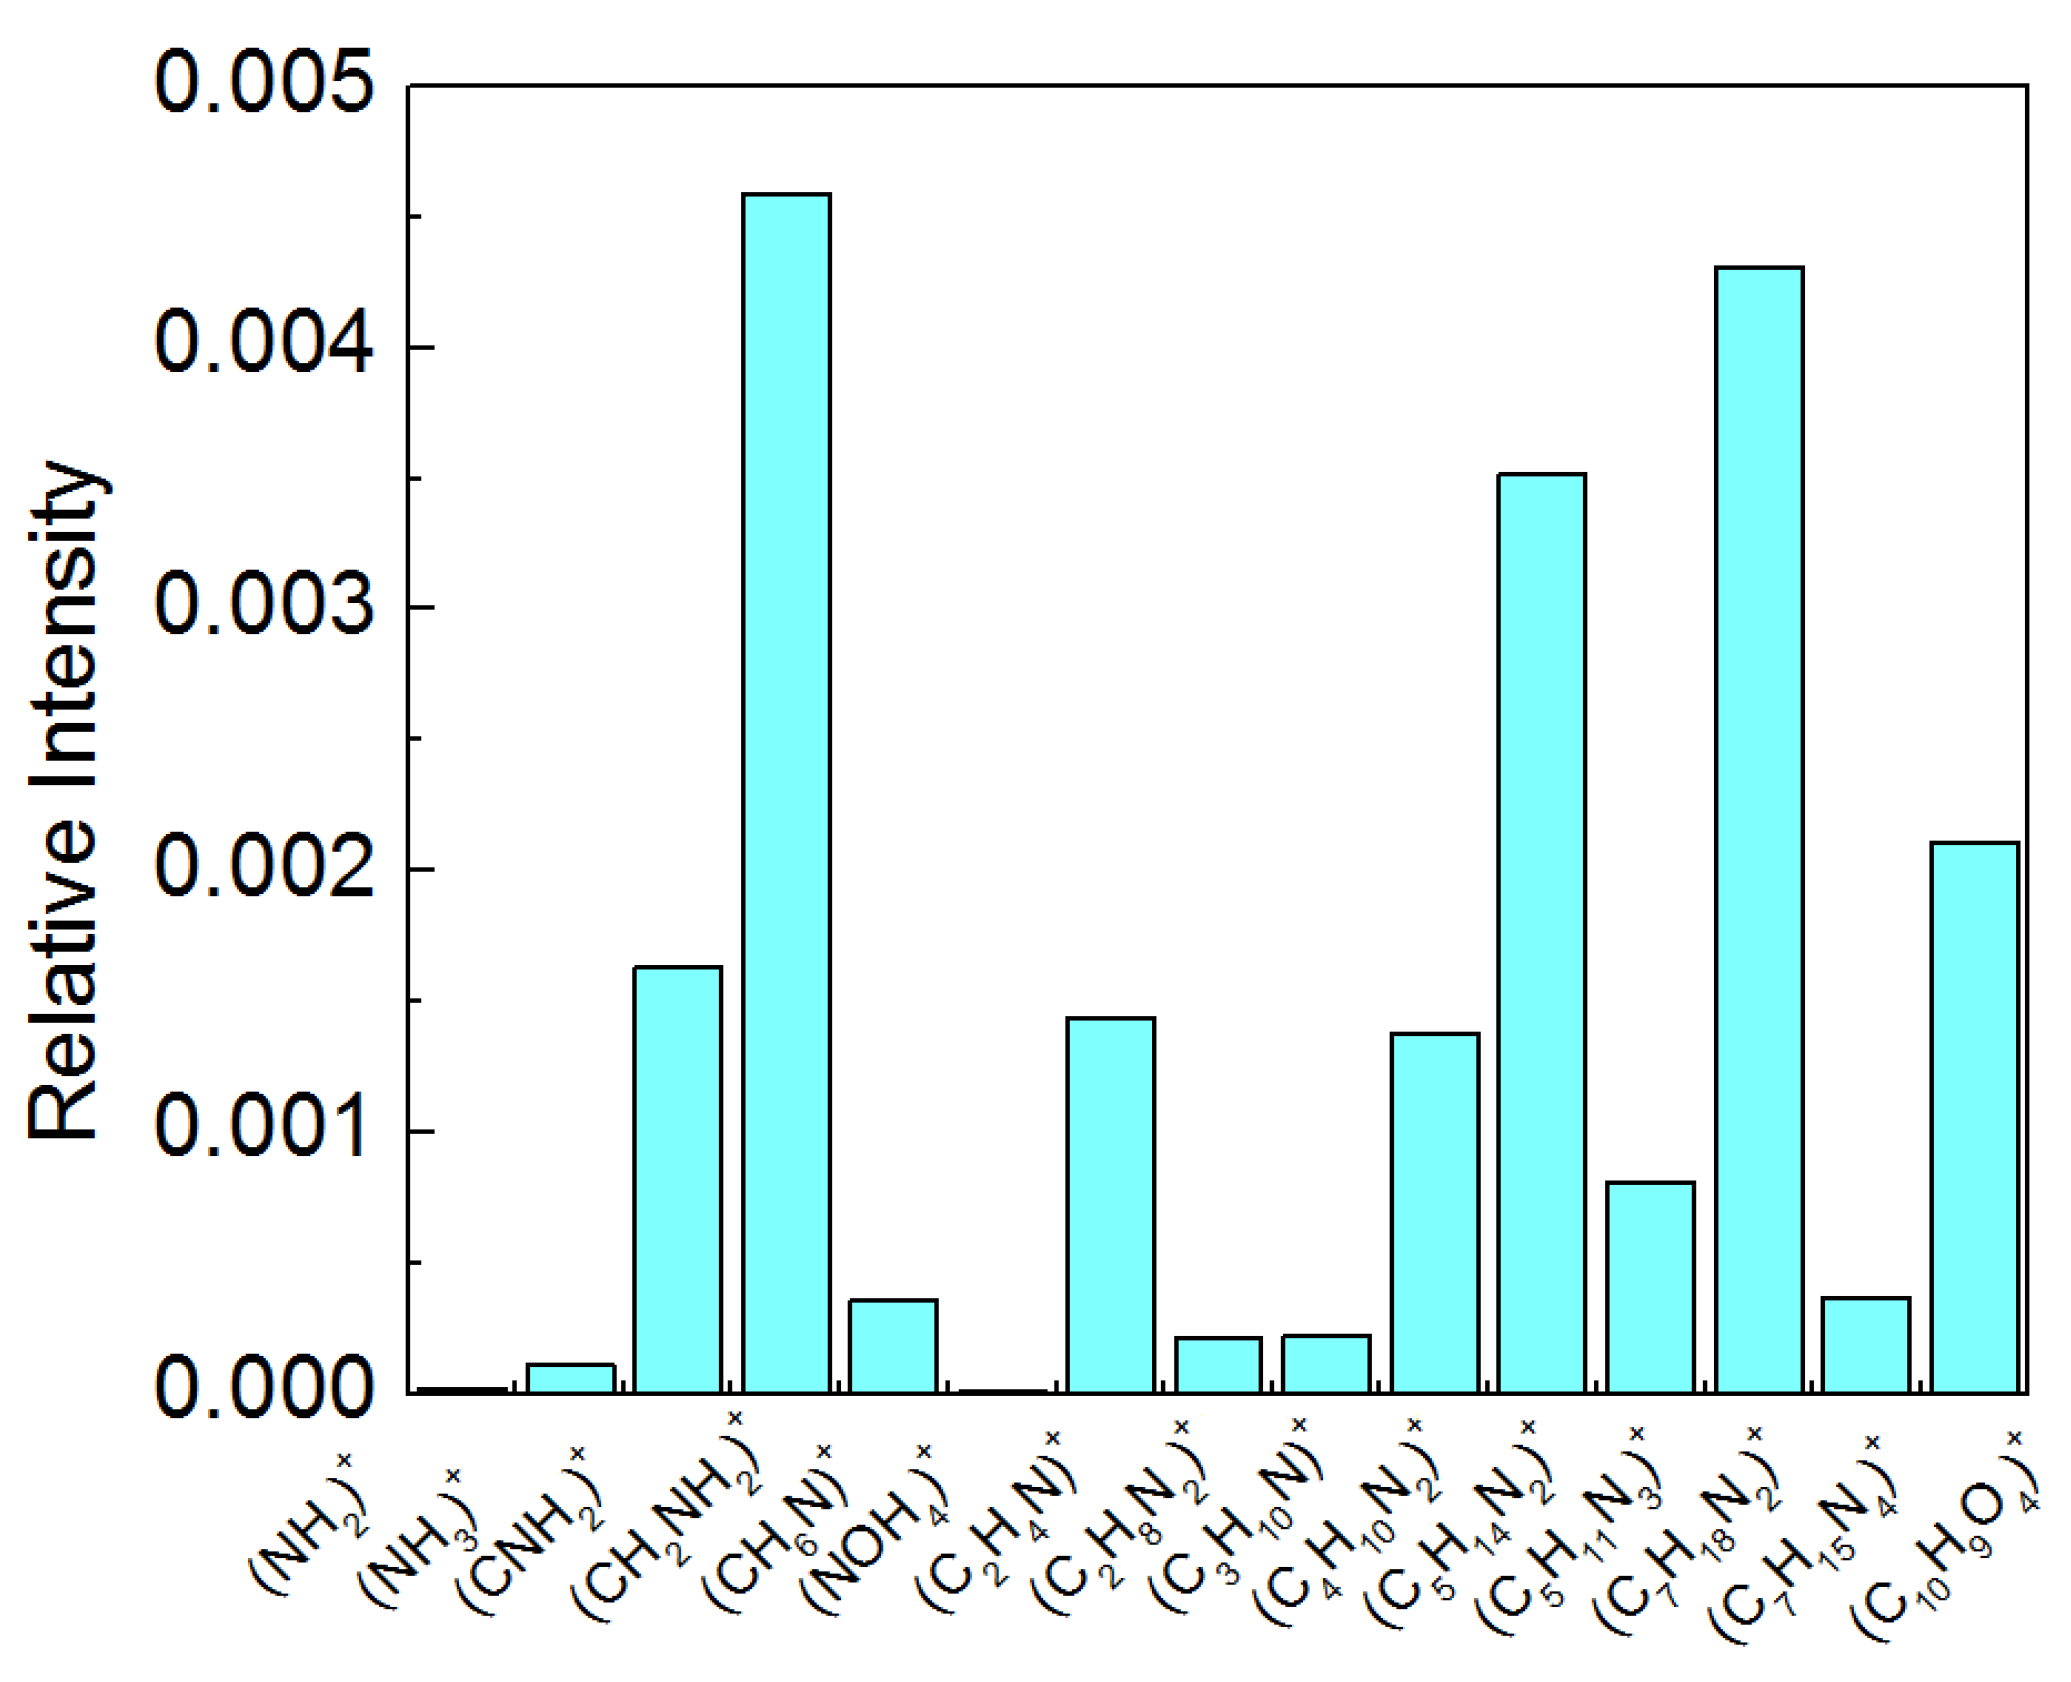
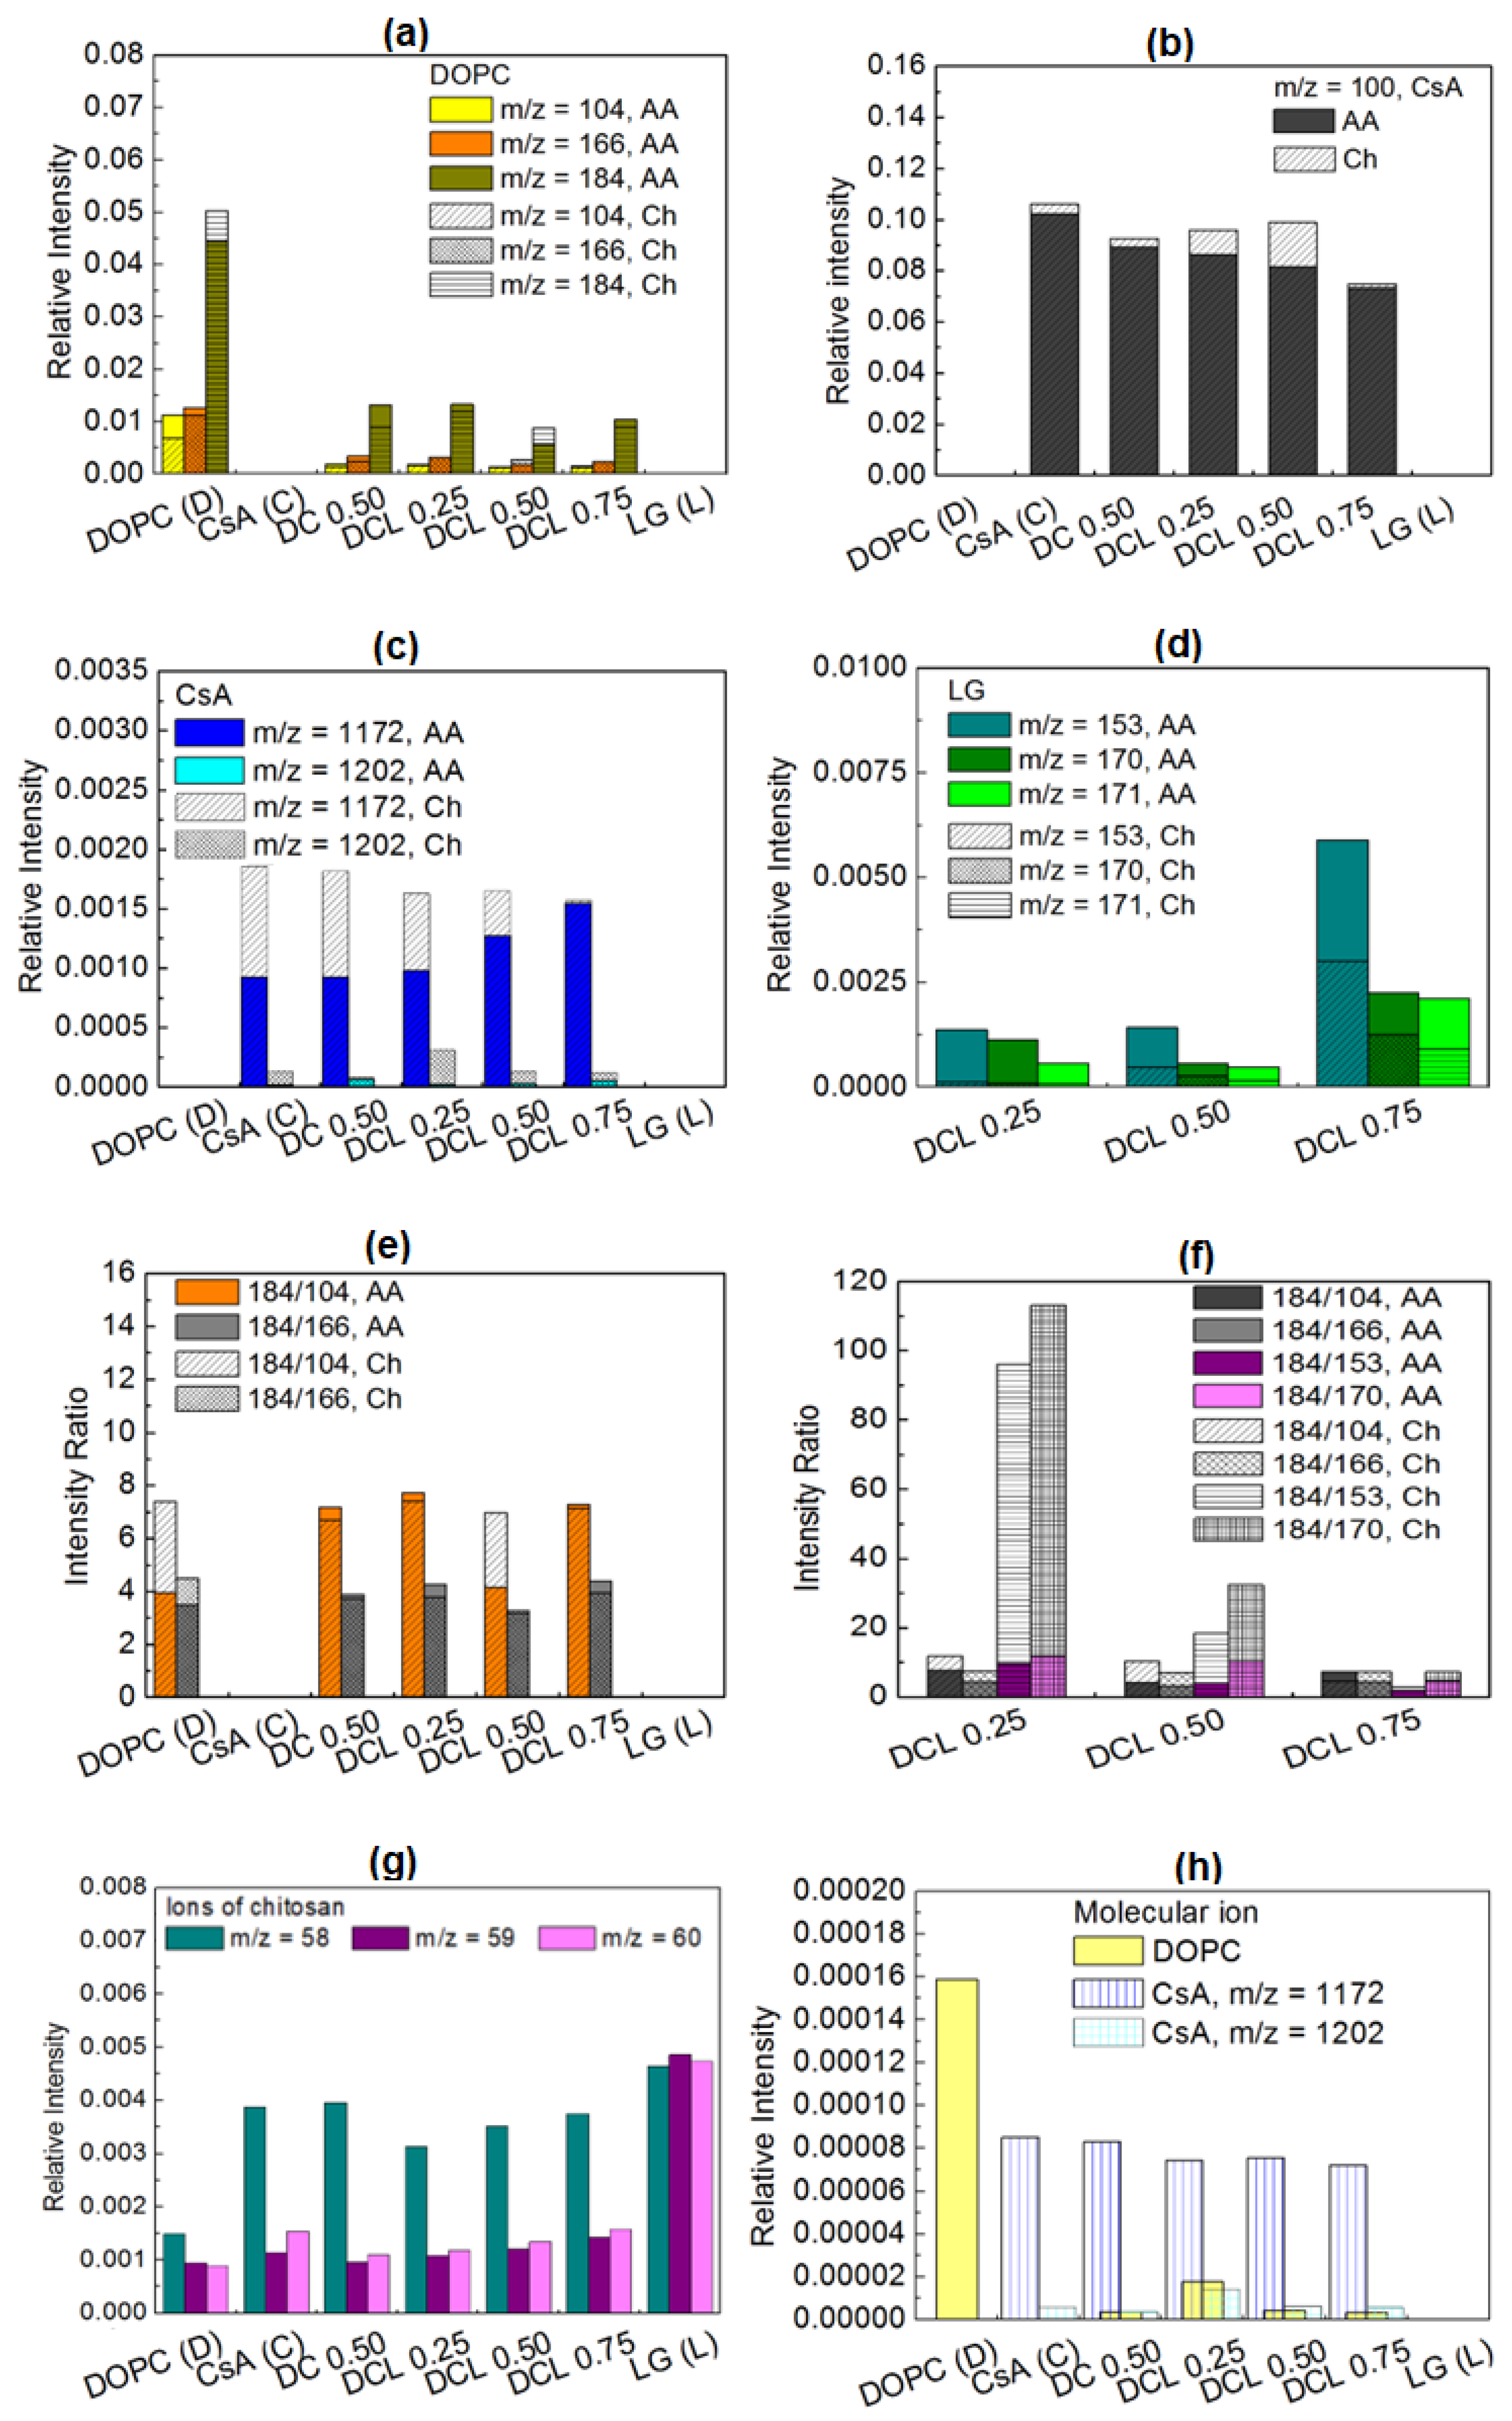
2.4. TOF-SIMS Analysis
2.4.1. PET and PETair
2.4.2. Films Deposited onto PETair
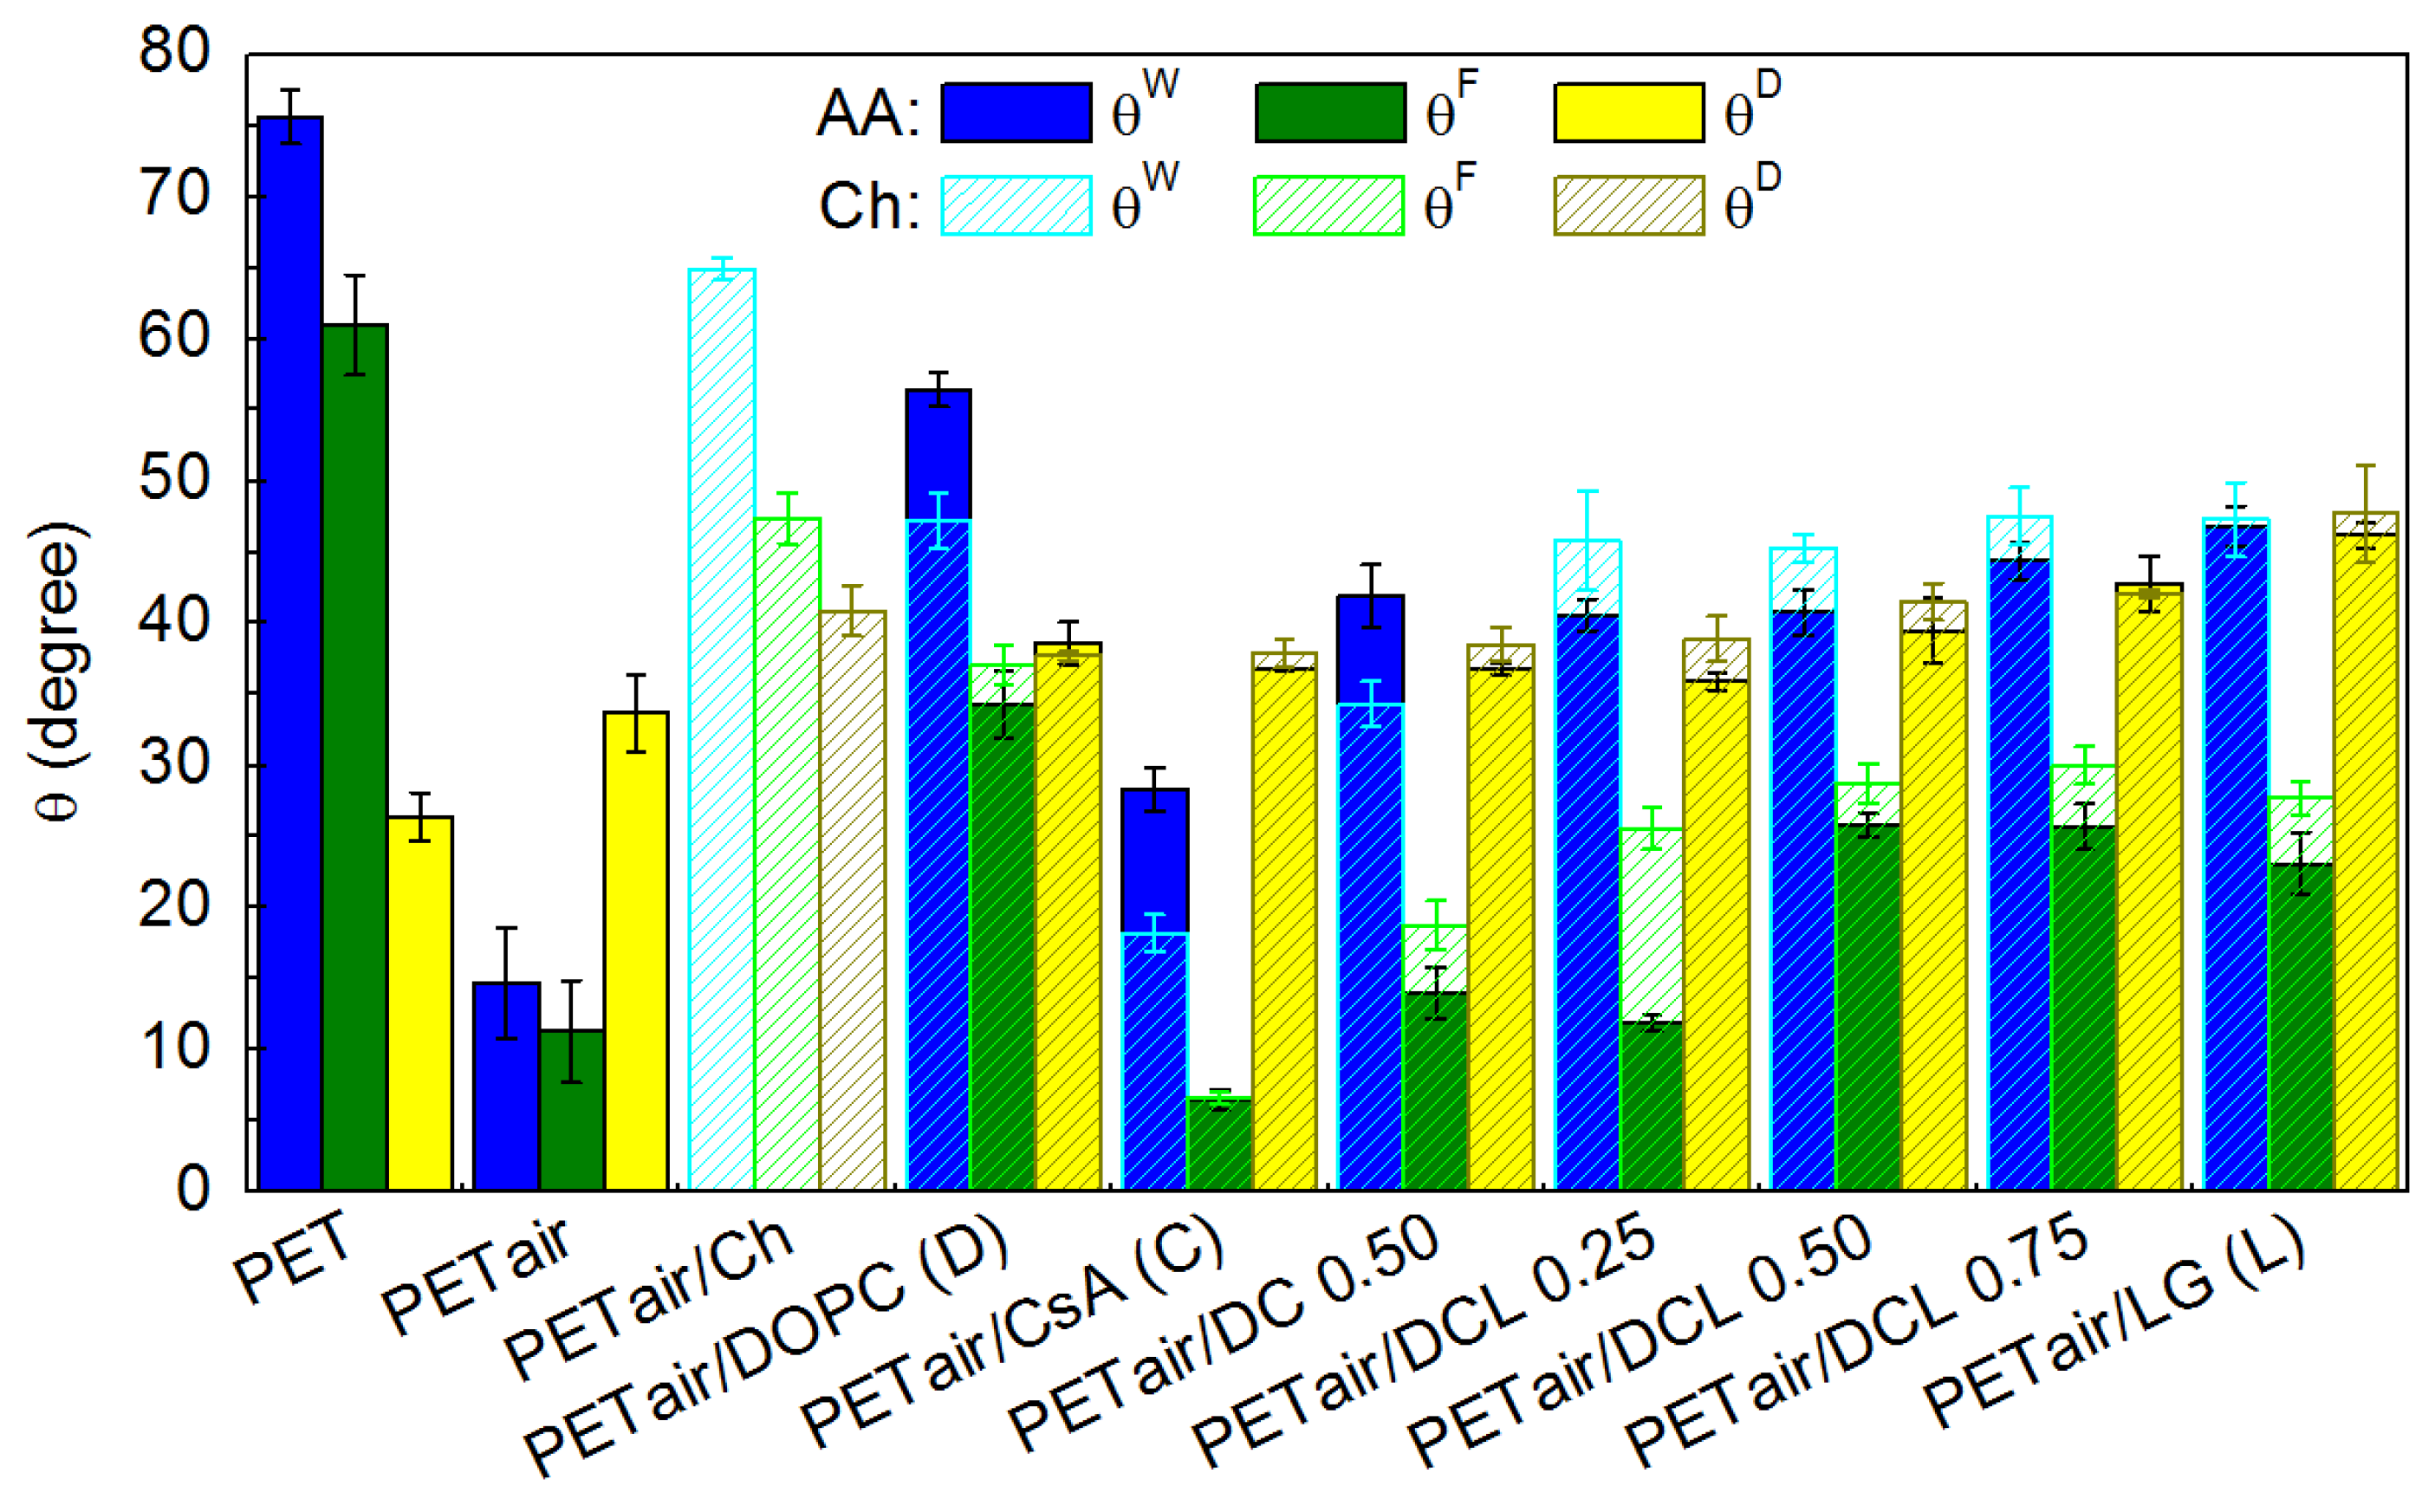
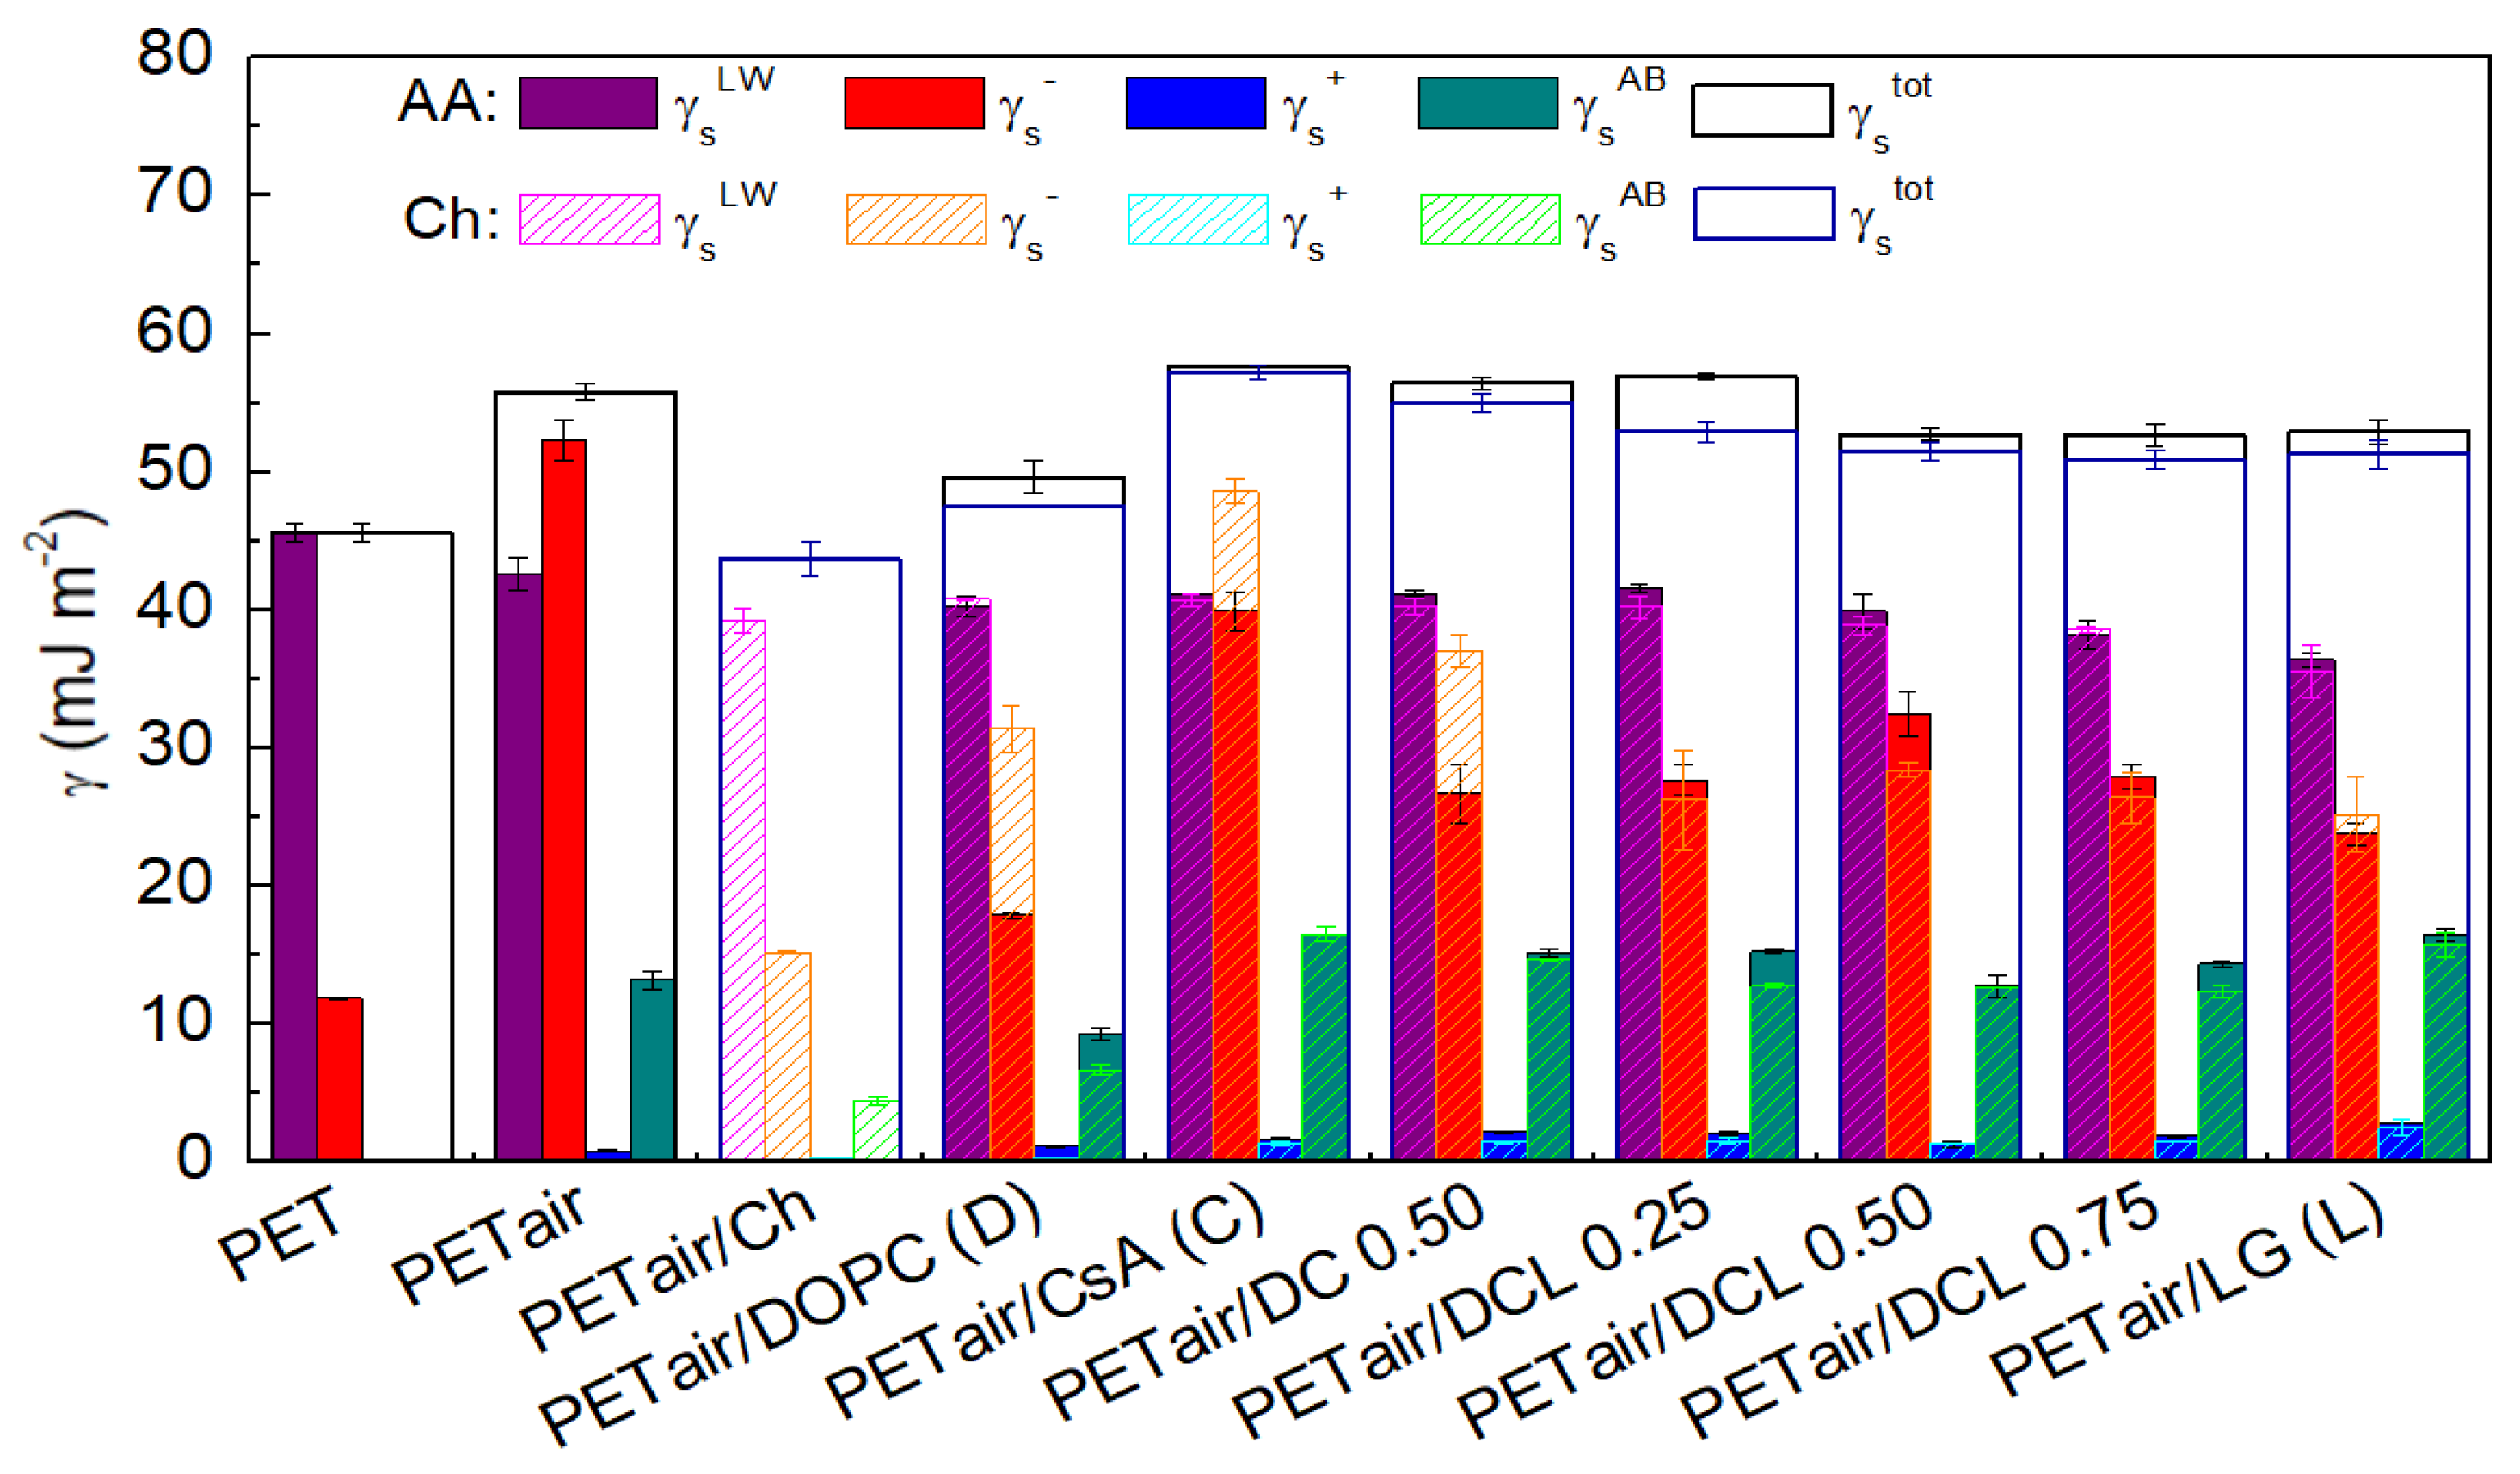
2.5. Contact Angles (CA) and Surface Free Energy
3. Materials and Methods
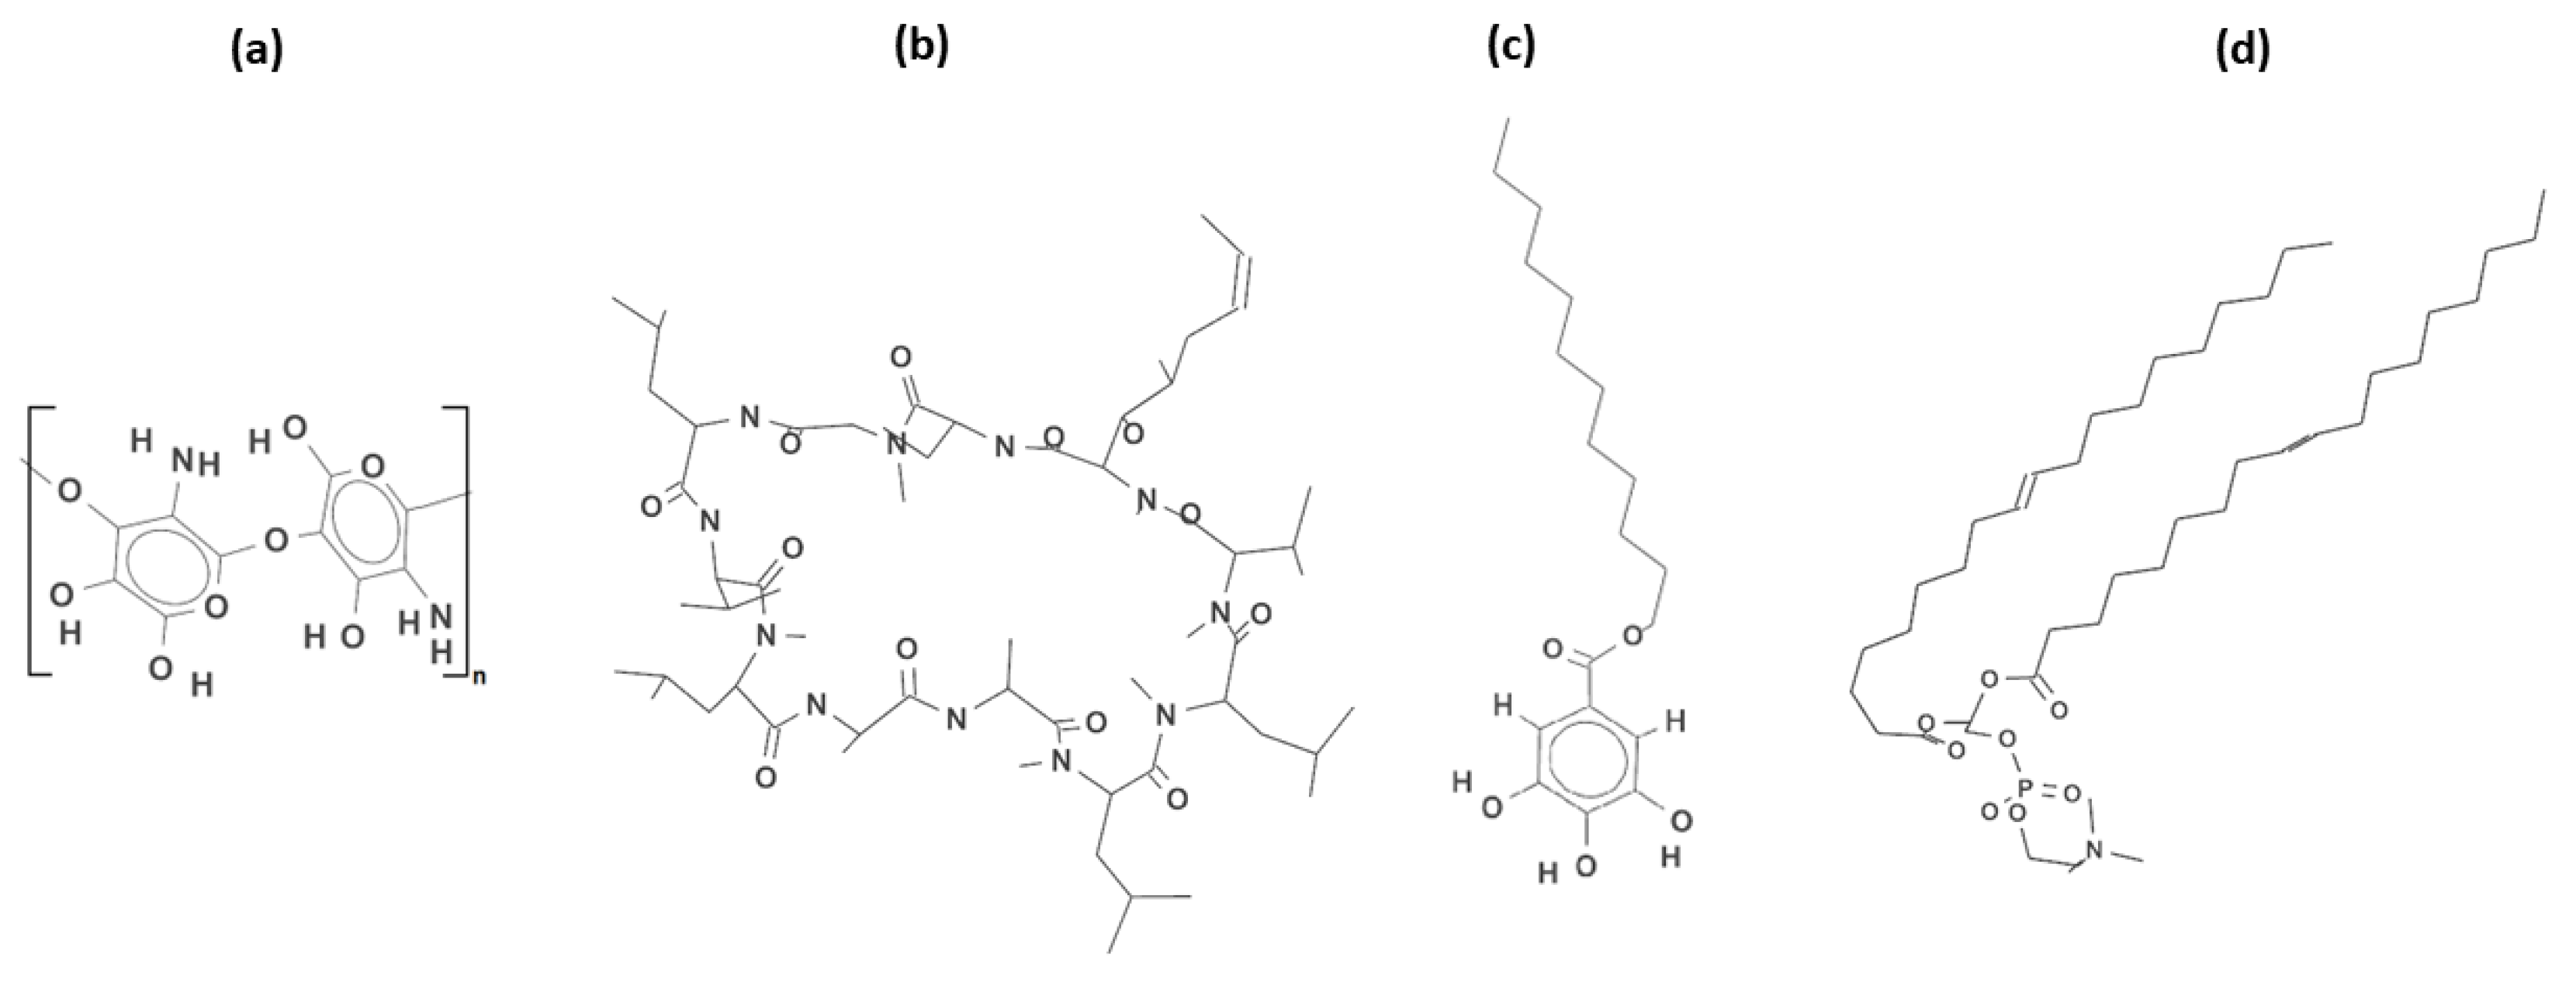
3.1. Solution Preparation
3.2. Subphase Solution Preparations
3.3. PET Substrates Modification
3.4. Langmuir Monolayer Formation
3.5. Brewster Angle Microscopy (BAM) Analysis
3.6. Langmuir—Blodgett (LB) Monolayer Formation
3.7. X-ray Photoelectron Spectroscopy (XPS) Analysis
3.8. Atomic Force Microscopy (AFM) Analysis
3.9. Time of Flight Secondary Ion Mass Spectrometry (TOF-SIMS) Analysis
3.10. Contact Angle Measurements (CA)
4. Conclusions
Supplementary Materials
Author Contributions
Funding
Institutional Review Board Statement
Informed Consent Statement
Data Availability Statement
Conflicts of Interest
References
- Longo, U.G.; Lamberti, A.; Maffulli, N.; Denaro, V. Tendon augmentation grafts: A systematic review. Br. Med. Bull. 2010, 94, 165–188. [Google Scholar] [CrossRef] [PubMed] [Green Version]
- Maitz, M.F. Applications of synthetic polymers in clinical medicine. Biosurf. Biotribol. 2015, 1, 161–176. [Google Scholar] [CrossRef] [Green Version]
- Vesel, A.; Recek, N.; Motlan, H.; Mozetic, M. Endothelialization of polyethylene terephthalate treated in SO2 plasma determined by the degree of material cytotoxicity. Plasma 2018, 1, 12–22. [Google Scholar] [CrossRef] [Green Version]
- Rodrigues, A.; Figueiredo, L.; Diogo, H.; Bordado, J. Mechanical behavior of PET fibers and textiles for stent-grafts using video extensometry and image analysis. Ciência Tecnol. Mater. 2018, 30, 23–33. [Google Scholar] [CrossRef]
- Swar, S.; Zajícová, V.; Rysová, M.; Lovĕtinská-Šlaborová, I.; Voleský, L.; Stibor, I. Biocompatible surface modification of poly(ethylene terephthalate) focused on pathogenic bacteria: Promising prospects in biomedical applications. J. Appl. Polym. Sci. 2017, 134, 1–11. [Google Scholar] [CrossRef]
- Drobota, M.; Ursache, S.; Aflori, M. Surface functionalities of polymers for biomaterial applications. Polymers 2022, 14, 2307. [Google Scholar] [CrossRef]
- Yang, L.; Chen, J.; Guo, Y.; Zhang, Z. Surface modification of a biomedical polyethylene terephthalate (PET) by air plasma. Appl. Surf. Sci. 2009, 255, 4446–4451. [Google Scholar] [CrossRef]
- Mao, Y.; Li, Q.; Wu, C. Surface modification of PET fiber with hybrid coating and its effect on the properties of PP composites. Polymers 2019, 11, 1726. [Google Scholar] [CrossRef] [Green Version]
- Safdar, R.; Omar, A.A.; Arunagiri, A.; Regupathi, I.; Thanabalan, M. Potential of chitosan and its derivatives for controlled drug release applications—A review. J. Drug Deliv. Sci. Technol. 2019, 49, 642–659. [Google Scholar] [CrossRef]
- Jennings, J.A.; Wells, C.M.; McGraw, G.S.; Velasquez Pulgarin, D.A.; Whitaker, M.D.; Pruitt, R.L.; Bumgardner, J.D. Chitosan coatings to control release and target tissues for therapeutic delivery. Ther. Deliv. 2015, 6, 855–871. [Google Scholar] [CrossRef]
- Merzendorfer, H.; Cohen, E. Chitin/chitosan: Versatile ecological, industrial, and biomedical applications. In Extracellular Sugar-Based Biopolymers Matrices; Biologically-inspired systems; Cohen, E., Merzendorfer, H., Eds.; Springer International Publishing: Cham, Switzerland, 2019; pp. 541–624. [Google Scholar]
- Jang, T.-S.; Cheon, K.-H.; Ahn, J.-H.; Song, E.-H.; Kim, H.-E.; Jung, H.-D. In-vitro blood and vascular compatibility of sirolimus-eluting organic/inorganic hybrid stent coatings. Colloids Surf. B Biointerfaces 2019, 179, 405–413. [Google Scholar] [CrossRef]
- Sevostyanov, M.A.; Baikin, A.S.; Sergienko, K.V.; Shatova, L.A.; Kirsankin, A.A.; Baymler, I.V.; Shkirin, A.V.; Gudkov, S.V. Biodegradable stent coatings on the basis of PLGA polymers of different molecular mass, sustaining a steady release of the thrombolityc enzyme streptokinase. React. Funct. Polym. 2020, 150, 104550. [Google Scholar] [CrossRef]
- Hu, Z.; Lu, S.; Cheng, Y.; Kong, S.K.; Li, S.; Li, C.; Yang, L. Investigation of the effects of molecular parameters on the hemostatic properties of chitosan. Molecules 2018, 23, 3147. [Google Scholar] [CrossRef] [Green Version]
- Fan, P.; Zeng, Y.; Zaldivar-Silva, D.; Agüero, L.; Wang, S. Chitosan-based hemostatic hydrogels: The concept mechanism, application, and prospects. Molecules 2023, 28, 1743. [Google Scholar] [CrossRef]
- Haeri, A.; Sadeghian, S.; Rabbani, S.; Anvari, M.S.; Ghassemi, S.; Radfar, F.; Dadashzadeh, S. Effective attenuation of vascular restenosis following local delivery of chitosan decorated sirolimus liposomes. Carbohydr. Polym. 2017, 157, 1461–1469. [Google Scholar] [CrossRef]
- Kersani, D.; Mougin, J.; Lopez, M.; Degoutin, S.; Tabary, N.; Cazaux, F.; Janus, L.; Maton, M.; Chai, F.; Sobocinski, J.; et al. Stent coating by electrospinning with chitosan/poly-cyclodextrin based nanofibers loaded with simvastatin for restenosis prevention. Eur. J. Pharm. Biopharm. 2020, 150, 156–167. [Google Scholar] [CrossRef]
- Tang, J.; Liu, Y.; Zhu, B.; Su, Y.; Zhu, X. Preparation of paclitaxel/chitosan co-assembled core-shell nanofibers for drug-eluting stent. Appl. Surf. Sci. 2017, 393, 299–308. [Google Scholar] [CrossRef]
- Zhang, S.; Zhang, F.; Feng, B.; Fan, Q.; Yang, F.; Shang, D.; Sui, J.; Zhao, H. Hematopoietic stem cell capture and directional differentiation into vascular endothelial cells for metal stent-coated chitosan/hyaluronic acid loading CD133 antibody. Tissue Eng. Part. 2015, 21, 1173–1183. [Google Scholar] [CrossRef] [Green Version]
- Tedesco, D.; Haragsim, L. Cyclosporine: A review. J. Transplant. 2012, 2012, 230386. [Google Scholar] [CrossRef] [Green Version]
- Wiącek, A.E.; Jurak, M.; Ładniak, A.; Przykaza, K.; Szafran, K. Cyclosporine CsA—The physicochemical characterization of liposomal and colloidal systems. Colloids Interfaces 2020, 4, 46. [Google Scholar] [CrossRef]
- Hao, X.; Zhang, H.; Liu, R.; Che, J.; Zhang, D.; Liang, J.; Sun, L. Red blood cell membrane functionalized biomimetic nanoparticles for systemic lupus erythematosus treatment. Mater. Today Adv. 2022, 16, 100294. [Google Scholar] [CrossRef]
- Akbulut, S.; Elbe, H.; Eris, C.; Dogan, Z.; Toprak, G.; Yalcin, E.; Otan, E.; Turkoz, Y. Effects of antioxidant agents against cyclosporine-induced hepatotoxicity. J. Surg. Res. 2015, 193, 658–666. [Google Scholar] [CrossRef] [PubMed]
- Chin, Y.-T.; Tu, H.-P.; Lin, C.-Y.; Kuo, P.-J.; Chiu, H.-C.; Liu, S.-H.; Lee, S.-Y.; Fu, E. Antioxidants protect against gingival overgrowth induced by cyclosporine, A. J. Periodontal. Res. 2021, 56, 397–407. [Google Scholar] [CrossRef] [PubMed]
- Badavi, M.; Sadeghi, N.; Dianat, M.; Samarbafzadeh, A. Gallic acid and cyclosporine mixture and their effects on cardiac dysfunction induced by ischemia/reperfusion and ENOS/INOS expression. Int. J. Cardiovasc. Sci. 2017, 30, 207–218. [Google Scholar]
- Kikuzaki, H.; Hisamoto, M.; Hirose, K.; Akiyama, K.; Taniguchi, H. Antioxidant properties of ferulic acid and its related compounds. J. Agric. Food Chem. 2002, 50, 2161–2168. [Google Scholar] [CrossRef]
- Walters, K.A.; Bialik, W.; Brain, K.R. The effects of surfactants on penetration across the skin*. Int. J. Cosmet. Sci. 1993, 15, 260–271. [Google Scholar] [CrossRef]
- Oliveira, O.N.; Caseli, L.; Ariga, K. The past and future of Langmuir and Langmuir-Blodgett films. Chem. Rev. 2022, 122, 6459–6513. [Google Scholar]
- Menzies, K.L.; Jones, L. The impact of contact angle on the biocompatibility of biomaterials. Optom. Vis. Sci. 2010, 87, 387–399. [Google Scholar] [CrossRef]
- Jurak, M.; Wiącek, A.E.; Ładniak, A.; Przykaza, K.; Szafran, K. What affects the biocompatibility of polymers? Adv. Colloid Interface Sci. 2021, 294, 102451. [Google Scholar]
- Deppisch, R.; Storr, M.; Buck, R.; Göhl, H. Blood material interactions at the surfaces of membranes in medical applications. Sep. Purif. Technol. 1998, 14, 241–254. [Google Scholar] [CrossRef]
- Elsabee, M.Z.; Morsi, R.E.; Al-Sabagh, A.M. Surface active properties of chitosan and its derivatives. Colloids Surf. B Biointerfaces 2009, 74, 1–16. [Google Scholar] [CrossRef]
- Szafran, K.; Jurak, M.; Wiącek, A.E. Effect of Chitosan on the interactions between phospholipid DOPC, cyclosporine A and lauryl gallate in the Langmuir monolayers. Colloids Surf. A Physicochem. Eng. Asp. 2022, 652, 129843. [Google Scholar] [CrossRef]
- Winsel, K.; Hönig, D.; Lunkeneimer, K.; Geggel, K.; Witt, C. Quantitative Brewster angle microscopy of the surface film of human broncho-alveolar lavage fluid. Eur. Biophys. J. 2003, 32, 544–552. [Google Scholar]
- Witek, J.; Keller, B.G.; Blatter, M.; Meissner, A.; Wagner, T.; Riniker, S. Kinetic models of cyclosporine A in polar and apolar environments reveal multiple congruent conformational states. J. Chem. Inf. Model. 2016, 56, 1547–1562. [Google Scholar] [CrossRef]
- Dougherty, P.G.; Sahni, A.; Pei, D. Understanding cell penetration of cyclic peptides. Chem. Rev. 2019, 119, 10241–10287. [Google Scholar] [CrossRef]
- Lomize, A.L.; Pogozheva, I.D. Physics–based method for modeling passive membrane permeability and translocation pathways of bioactive molecules. J. Chem. Inf. Model. 2019, 59, 3198–3213. [Google Scholar] [CrossRef]
- Cámara, C.I.; Quiroga, M.V.C.; Wilke, N.; Jimenez-Kairuz, A.; Yudi, L.M. Effect of chitosan on distearoylphosphatidylglycerol films at air/water and liquid/liquid interfaces. Electrochim. Acta 2013, 94, 124–133. [Google Scholar]
- Wydro, P.; Krajewska, B.; Hąc-Wydro, K. Chitosan as a lipid binder: A Langmuir monolayer study of chitosan-lipid interactions. Biomacromolecules 2007, 8, 2611–2617. [Google Scholar]
- Ahmed, I.; Dildar, L.; Haque, A.; Patra, P.; Mukhopadhyay, M.; Hazra, S.; Kulkarni, M.; Thomas, S.; Plaisier, J.R.; Dutta, S.B.; et al. Chitosan-fatty acid interaction mediated growth of Langmuir monolayer and Langmuir-Blodgett films. J. Colloid Interface Sci. 2018, 514, 433–442. [Google Scholar] [CrossRef]
- Philipova, O.E.; Volkov, E.V.; Sitnikova, N.L.; Khokhlov, A.R. Two types of hydrophobic aggregates in aqueous solutions of chitosan and its derivative. Biomacromolecules 2001, 2, 483–490. [Google Scholar]
- Szafran, K.; Jurak, M.; Mroczka, R.; Wiącek, A.E. Surface properties of the polyethylene terephthalate (PET) substrate modified with the phospholipid-polypeptide-antioxidant films. Design of functional biocoatings. Pharmaceutics 2022, 14, 2815. [Google Scholar] [CrossRef] [PubMed]
- Jurak, M.; Szafran, K.; Cea, P.; Martín, S. Characteristics of phospholipid-immunosuppressant-antioxidant mixed Langmuir-Blodgett films. J. Phys. Chem. B 2022, 126, 6936–6947. [Google Scholar] [CrossRef]
- Jurak, M.; Szafran, K.; Cea, P.; Martín, S. Analysis of molecular interactions between components in phospholipid-immunosuppressant-antioxidant mixed Langmuir films. Langmuir 2021, 37, 5601–5616. [Google Scholar] [CrossRef] [PubMed]
- Bui, V.T.; Liu, X.; Ko, S.H.; Choi, H.S. Super-amphiphilic surface of nano silica/polyurethane hybrid coated PET film via a plasma treatment. J. Colloid Interface Sci. 2015, 453, 209–215. [Google Scholar] [CrossRef] [PubMed]
- Beamson, G. The XPS of Polymer Database, Surface Spectra 2000 from High Resolution XPS of Organic Polymers-the Scienta ESCA300 Database; Wiley: Hoboken, NJ, USA, 1992. [Google Scholar]
- Koimura, M.; Tateshi, H.; Hatakeyama, K.; Miyamoto, S.; Ogata, C.; Funatsu, A.; Taniguchi, T.; Matsumoto, Y. Analysis of reduced graphene oxides by X-ray photoelectron spectroscopy and electrochemical capacitance. Chem. Lett. 2013, 42, 924–926. [Google Scholar]
- Rabchinskii, M.K.; Ryzhkov, S.A.; Kirilenko, D.A.; Ulin, N.V.; Baidakova, M.V.; Shnitov, V.V.; Pavlov, S.I.; Chumakov, R.G.; Stolyarova, D.Y.; Besedina, N.A.; et al. From graphene oxide towards aminated graphene: Facile synthesis, its structure and electronic properties. Sci. Rep. 2020, 10, 6902. [Google Scholar] [CrossRef] [Green Version]
- Panajotović, R.; Ptasinska, S.; Lyamayev, V.; Pronce, K. Low-energy electron damage of DPPC molecules—A NEXAFS study. Rad. Appl. 2016, 1, 46–50. [Google Scholar]
- Wagstaffe, M.; Thomas, A.G.; Jackman, M.J.; Torres-Molina, M.; Syres, K.L.; Handrup, K. An experimental investigation of the adsorption of a phosphonic acid on the anatase TiO2(101) surface. J. Phys. Chem. C 2016, 120, 1693–1700. [Google Scholar] [CrossRef]
- Pandiyaraj, K.N.; Selvarajan, V.; Rhee, Y.H.; Kim, H.W.; Shah, S.I. Glow discharge plasma-induced immobilization of heparin and insulin on polyethylene terephthalate film surfaces enhances anti-thrombogenic properties. Mater. Sci. Eng. C 2009, 29, 796–805. [Google Scholar] [CrossRef]
- Abdel-Fattah, E. Surface modifications of PET in argon atmospheric pressure plasma: Gas flow rate effect. Surf. Interface Anal. 2022, 54, 794–802. [Google Scholar] [CrossRef]
- Jurak, M.; Wiącek, A.E.; Mroczka, R.; Łopucki, R. Chitosan/phospholipid coated polyethylene terephthalate (PET) polymer surfaces activated by air plasma. Colloids Surf. A Physicochem. Eng. Asp. 2017, 532, 155–164. [Google Scholar] [CrossRef]
- Theapsak, S.; Watthanaphanit, A.; Rujiravanit, R. Preparation of Chitosan-coated polyethylene packaging films by DBD plasma treatment. ACS Appl. Mater. Interfaces 2012, 4, 2474–2482. [Google Scholar] [CrossRef]
- Chou, S.-F.; Lee, C.-H.; Cho, C.-H.; Lai, J.-Y. Relationships between surface roughness/stiffness of chitosan coatings and fabrication of corneal keratocyte spheroids: Effect of degree of deacetylation. Colloids Surf. B Biointerfaces 2016, 142, 105–113. [Google Scholar] [CrossRef]
- Silva, C.A.; Nobre, T.M.; Pavinatto, F.J.; Oliveira, O.N. Interaction of chitosan and mucin in a biomembrane model environment. J. Colloid Interface Sci. 2012, 376, 289–295. [Google Scholar] [CrossRef]
- Arrigo, R.; Hävecker, M.; Wrabetz, S.; Blume, R.; Lerch, M.; McGregor, J.; Parrott, E.P.J.; Zeitler, J.A.; Gladden, L.F.; Knop-Gericke, A.; et al. Tuning the acid/base properties of nanocarbons by functionalization via amination. J. Am. Chem. Soc. 2010, 132, 9616–9630. [Google Scholar] [CrossRef]
- Raicopol, N.; Andronescu, C.; Atasiei, R.; Hanganu, a.; Pilan, L. Post-polymerization electrochemical functionalization of a conducting polymer: Diazonium salt electroreduction at polypyrrole electrodes. J. Electrochem. Soc. 2014, 12, G103–G113. [Google Scholar] [CrossRef]
- Jurak, M.; Mroczka, R.; Łopucki, R. Properties of artificial phospholipid membranes containing lauryl gallate or cholesterol. J. Membr. Biol. 2018, 251, 277–294. [Google Scholar] [CrossRef] [Green Version]
- Przykaza, K.; Jurak, M.; Wiącek, A.E.; Mroczka, R. Characteristics of hybrid chitosan/phospholipid-sterol, peptide coatings on plasma activated PEEK polymer. Mater. Sci. Eng. C Mater. Biol. Appl. 2021, 120, 111658. [Google Scholar] [CrossRef]
- Finšgar, M.; Ristić, T.; Fardim, P.; Zemljič, L.F. Time-of-flight secondary ion mass spectrometry analysis of chitosan-treated viscose fibres. Anal. Biochem. 2018, 557, 131–141. [Google Scholar] [CrossRef]
- Vaezian, B.; Anderton, C.R.; Kraft, M.L. Discriminating and imaging different phosphatidylcholine species within phase-separated model membranes by principal component analysis of TOF-secondary ion mass spectrometry images. Anal. Chem. 2011, 83, 5337–5343. [Google Scholar] [CrossRef]
- Lankeoff, I.; Sjövall, P.; Ewing, A.G. Relative quantification of phospholipid accumulation in the PC12 cell plasma membrane following phospholipid incubation using TOF-SIMS imaging. Anal. Chem. 2010, 82, 10006–10014. [Google Scholar] [CrossRef] [PubMed] [Green Version]
- Gulin, A.; Mochalova, M.; Denisov, N.; Nadtochenko, V. Secondary ion mass spectrometric signal enhancement of phosphatidylcholine dioleoyl on enlarged nanoparticles surface. Appl. Surf. Sci. 2014, 316, 36–41. [Google Scholar] [CrossRef]
- Bąchor, R.; Kluczyk, A.; Stefanowicz, P.; Szewczuk, Z. Preparation of novel deuterated cyclosporin A standards for quantitative LC-MS analysis. J. Mass Spectrom. 2017, 52, 817–822. [Google Scholar] [CrossRef] [PubMed]
- D’Almeida, M.; Attik, N.; Amalric, J.; Brunon, C.; Renaud, F.; Abouelleil, H.; Toury, B.; Grosgogeat, B. Chitosan coating as an antibacterial surface for biomedical applications. PLoS ONE 2017, 12, e0189537. [Google Scholar] [CrossRef] [PubMed] [Green Version]
- Muramoto, S.; Brison, J.; Castner, D.G. Exploring the surface sensitivity of TOF-secondary ion spectrometry by measuring the implantation and sampling depths of Bin and C60 ions in organic films. Anal Chem. 2012, 84, 365–372. [Google Scholar] [CrossRef] [Green Version]
- Jańczuk, B.; Chibowski, E.; Bruque, J.M.; Kerkeb, M.L.; González Caballero, F. On the consistency of surface free energy components as calculated from contact angles of different liquids: An application to the cholesterol surface. J. Colloid Interface Sci. 1993, 159, 421–428. [Google Scholar] [CrossRef]
- Van Oss, C.J.; Chaudhury, M.K.; Good, R.J. Interfacial Lifshitz-van der Waals and polar interactions in macroscopic systems. Chem. Rev. 1988, 88, 927–941. [Google Scholar] [CrossRef]
- Van Oss, C.J. Interfacial Forces in Aqueous Media; Marcel Dekker: New York, NY, USA, 1994. [Google Scholar]
- Szafran, K.; Jurak, M.; Wiącek, A.E. Effect of chitosan and lipid layers deposited onto polyethylene terephthalate (PET) on its wetting properties. Prog. Chem. Appl. Chitin Deriv. 2021, 26, 210–221. [Google Scholar]
- Woźniak, K.; Jurak, M.; Wiącek, A.E. Wetting properties of phospholipid-polypeptide monolayers deposited onto polyethylene terephthalate. Ann. Sect. AA 2019, 74, 69–88. [Google Scholar]
- Wiącek, A.E.; Jurak, M.; Gozdecka, A.; Worzakowska, M. Interfacial properties of PET and PET/starch polymers developed by air plasma processing. Colloids Surf. A Physicochem. Eng. Asp. 2017, 532, 323–331. [Google Scholar] [CrossRef]
- Vesel, A.; Mozetic, M.; Zalar, A. XPS study of oxygen plasma activated PET. Vacuum 2007, 2, 248–251. [Google Scholar] [CrossRef]
- Vesel, A.; Junkar, I.; Cvelbar, U.; Kovac, J.; Mozetic, M. Surface modification of polyester by oxygen- and nitrogen-plasma treatment. Surf. Interface Anal. 2008, 40, 1444–1453. [Google Scholar] [CrossRef]
- Mohsen-Nia, M.; Amiri, H. Measurement and modelling of static dielectric constants of aqueous solutions of methanol, ethanol and acetic acid at T = 293.15 K and 91.3 kPa. J. Chem. Termodyn. 2013, 57, 67–70. [Google Scholar] [CrossRef]
- Lamarche, R.M.; DeWolf, C. Strong headgroup interactions drive highly directional growth and unusual phase co-existence in self-assembled phenolic films. ACS Appl. Mater. Interfaces 2019, 11, 45354–45363. [Google Scholar] [CrossRef]
- Okano, T.; Aoyagi, T.; Kataoka, K.; Abe, K.; Sakurai, Y. Hydrophilic-hydrophobic microdomain surfaces having an ability to suppress platelet aggregation and their in vitro antithrombogenicity. J. Biomed. Mater. Res. 1986, 20, 919–927. [Google Scholar] [CrossRef]
- Fauchex, N.; Schweiss, R.; Lützow, K.; Werner, C.; Growth, T. Self-assembled monolayers with different terminating groups as model substrates for cell adhesion studies. Biomaterials 2004, 25, 2721–2730. [Google Scholar] [CrossRef]
- Wiącek, A.E.; Terpiłowski, K.; Jurak, M.; Worzakowska, M. Low-temperature air plasma modification of chitosan-coated PEEK biomaterials. Polym. Test. 2016, 50, 325–334. [Google Scholar] [CrossRef]
- Przykaza, K.; Jurak, M.; Kalisz, G.; Mroczka, R.; Wiącek, A.E. Characteristics of hybrid bioglass-chitosan coatings on the plasma activated PEEK polymer. Molecules 2023, 28, 1729. [Google Scholar] [CrossRef]


| Subphase | 0.1% AA | 0.1% mg mL−1 Ch | ||||
|---|---|---|---|---|---|---|
| Monolayer | (nm) | (nm) | (nm) | (nm) | ||
| DOPC | 2.0 ± 0.1 | 1.2 ± 0.1 | 1.31 ± 0.05 | 2.0 ± 0.1 | 1.3 ± 0.1 | 2.42 ± 0.06 |
| CsA | 1.9 ± 0.1 | 1.0 ± 0.1 | 2.70 ± 0.04 | 1.7 ± 0.1 | 0.9 ± 0.1 | 1.22 ± 0.08 |
| DC 0.50 | 1.7 ± 0.1 | 1.1 ± 0.3 | 1.79 ± 0.28 | 1.6 ± 0.1 | 1.0 ± 0.2 | 1.15 ± 0.13 |
| DCL 0.25 | 2.0 ± 0.1 | 1.0 ± 0.1 | 0.81 ± 0.27 | 1.8 ± 0.1 | 0.9 ± 0.1 | 1.75 ± 0.20 |
| DCL 0.50 | 2.0 ± 0.1 | 1.2 ± 0.1 | 1.07 ± 0.08 | 1.9 ± 0.1 | 0.9 ± 0.2 | 1.21 ± 0.17 |
| DCL 0.75 | 2.1 ± 0.1 | 1.2 ± 0.2 | 1.89 ± 0.07 | 2.3 ± 0.1 | 0.8 ± 0.1 | 1.03 ± 0.06 |
| LG | 2.1 ± 0.1 | 1.0 ± 0.1 | 2.21 ± 0.08 | 2.5 ± 0.1 | 0.9 ± 0.2 | 1.26 ± 0.21 |
| Element | PET | PETair | PETair/AA/DOPC | PETair/Ch | PETair/Ch/DOPC |
|---|---|---|---|---|---|
| C 1s | 77.7 | 72.2 | 75.8 | 74.2 | 72.4 |
| N 1s | 1.0 | 2.7 | - | 0.9 | 3.0 |
| O 1s | 21.3 | 25.1 | 23.3 | 24.9 | 23.8 |
| P 2p | - | - | 0.8 | - | 0.7 |
| Assignment | Identification | |
|---|---|---|
| 16 | PETair | |
| 17 | PETair | |
| 28 | PETair | |
| 30 | PETair | |
| 32 | PETair | |
| 34 | PETair | |
| 42 | PETair | |
| 86 | PETair | |
| 102 | PETair | |
| 113 | PETair | |
| 130 | PETair | |
| 155 | PETair | |
| 193 | PET, PETair |
| Assignment | m/z | Identification | References |
|---|---|---|---|
| 104 | DOPC | [59] | |
| 166 | DOPC | [59] | |
| 184 | DOPC | [59] | |
| 153 | LG | [59] | |
| 170 | LG | [59] | |
| 171 | LG | [59] | |
| 100 | CsA | [60] | |
| 1172 | CsA pseudo-molecular ion | [60] | |
| 1202 | CsA molecular ion | [60] | |
| 58 | Chitosan | [61] | |
| 59 | Chitosan | ||
| 60 | Chitosan | [53] |
Disclaimer/Publisher’s Note: The statements, opinions and data contained in all publications are solely those of the individual author(s) and contributor(s) and not of MDPI and/or the editor(s). MDPI and/or the editor(s) disclaim responsibility for any injury to people or property resulting from any ideas, methods, instructions or products referred to in the content. |
© 2023 by the authors. Licensee MDPI, Basel, Switzerland. This article is an open access article distributed under the terms and conditions of the Creative Commons Attribution (CC BY) license (https://creativecommons.org/licenses/by/4.0/).
Share and Cite
Szafran, K.; Jurak, M.; Mroczka, R.; Wiącek, A.E. Preparation and Surface Characterization of Chitosan-Based Coatings for PET Materials. Molecules 2023, 28, 2375. https://doi.org/10.3390/molecules28052375
Szafran K, Jurak M, Mroczka R, Wiącek AE. Preparation and Surface Characterization of Chitosan-Based Coatings for PET Materials. Molecules. 2023; 28(5):2375. https://doi.org/10.3390/molecules28052375
Chicago/Turabian StyleSzafran, Klaudia, Małgorzata Jurak, Robert Mroczka, and Agnieszka Ewa Wiącek. 2023. "Preparation and Surface Characterization of Chitosan-Based Coatings for PET Materials" Molecules 28, no. 5: 2375. https://doi.org/10.3390/molecules28052375