
Rational Computational Approaches in Drug Discovery: Potential Inhibitors for Allosteric Regulation of Mutant Isocitrate Dehydrogenase-1 Enzyme in Cancers


Abstract
: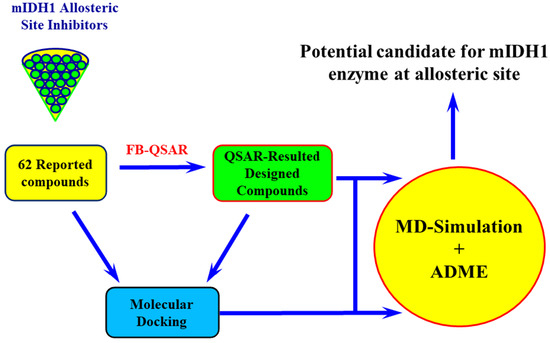
1. Introduction
2. Result and Discussion
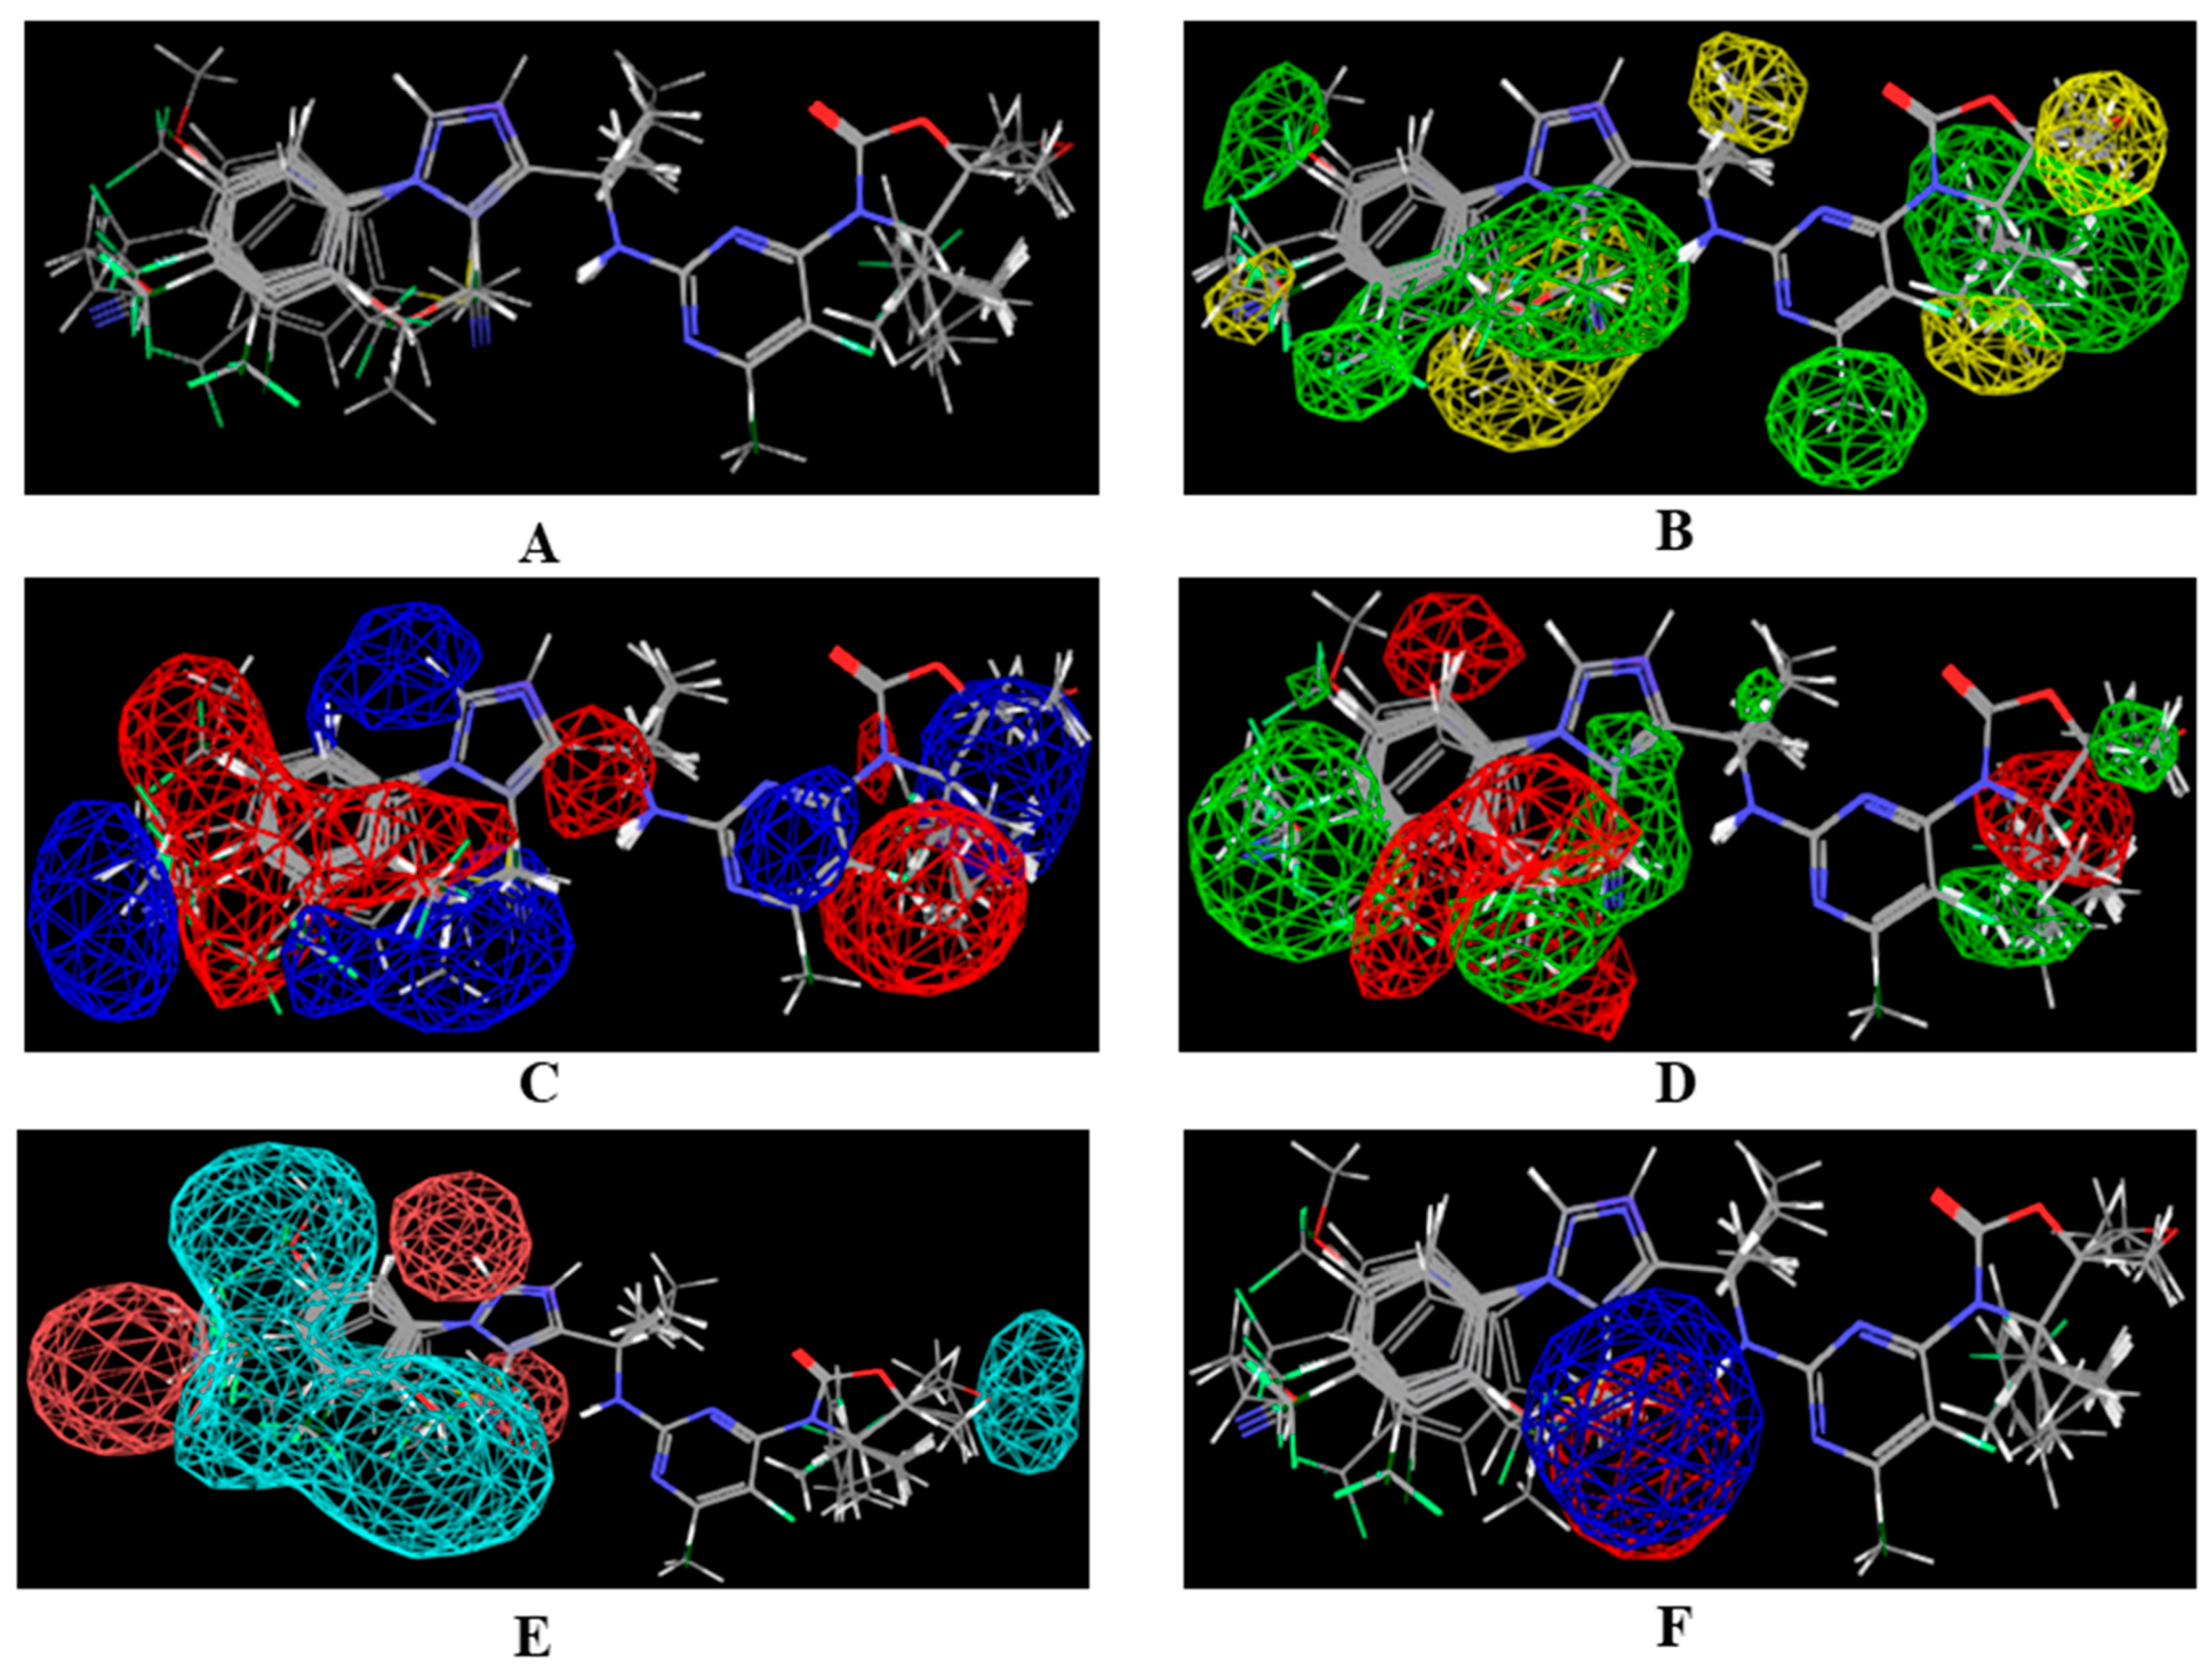
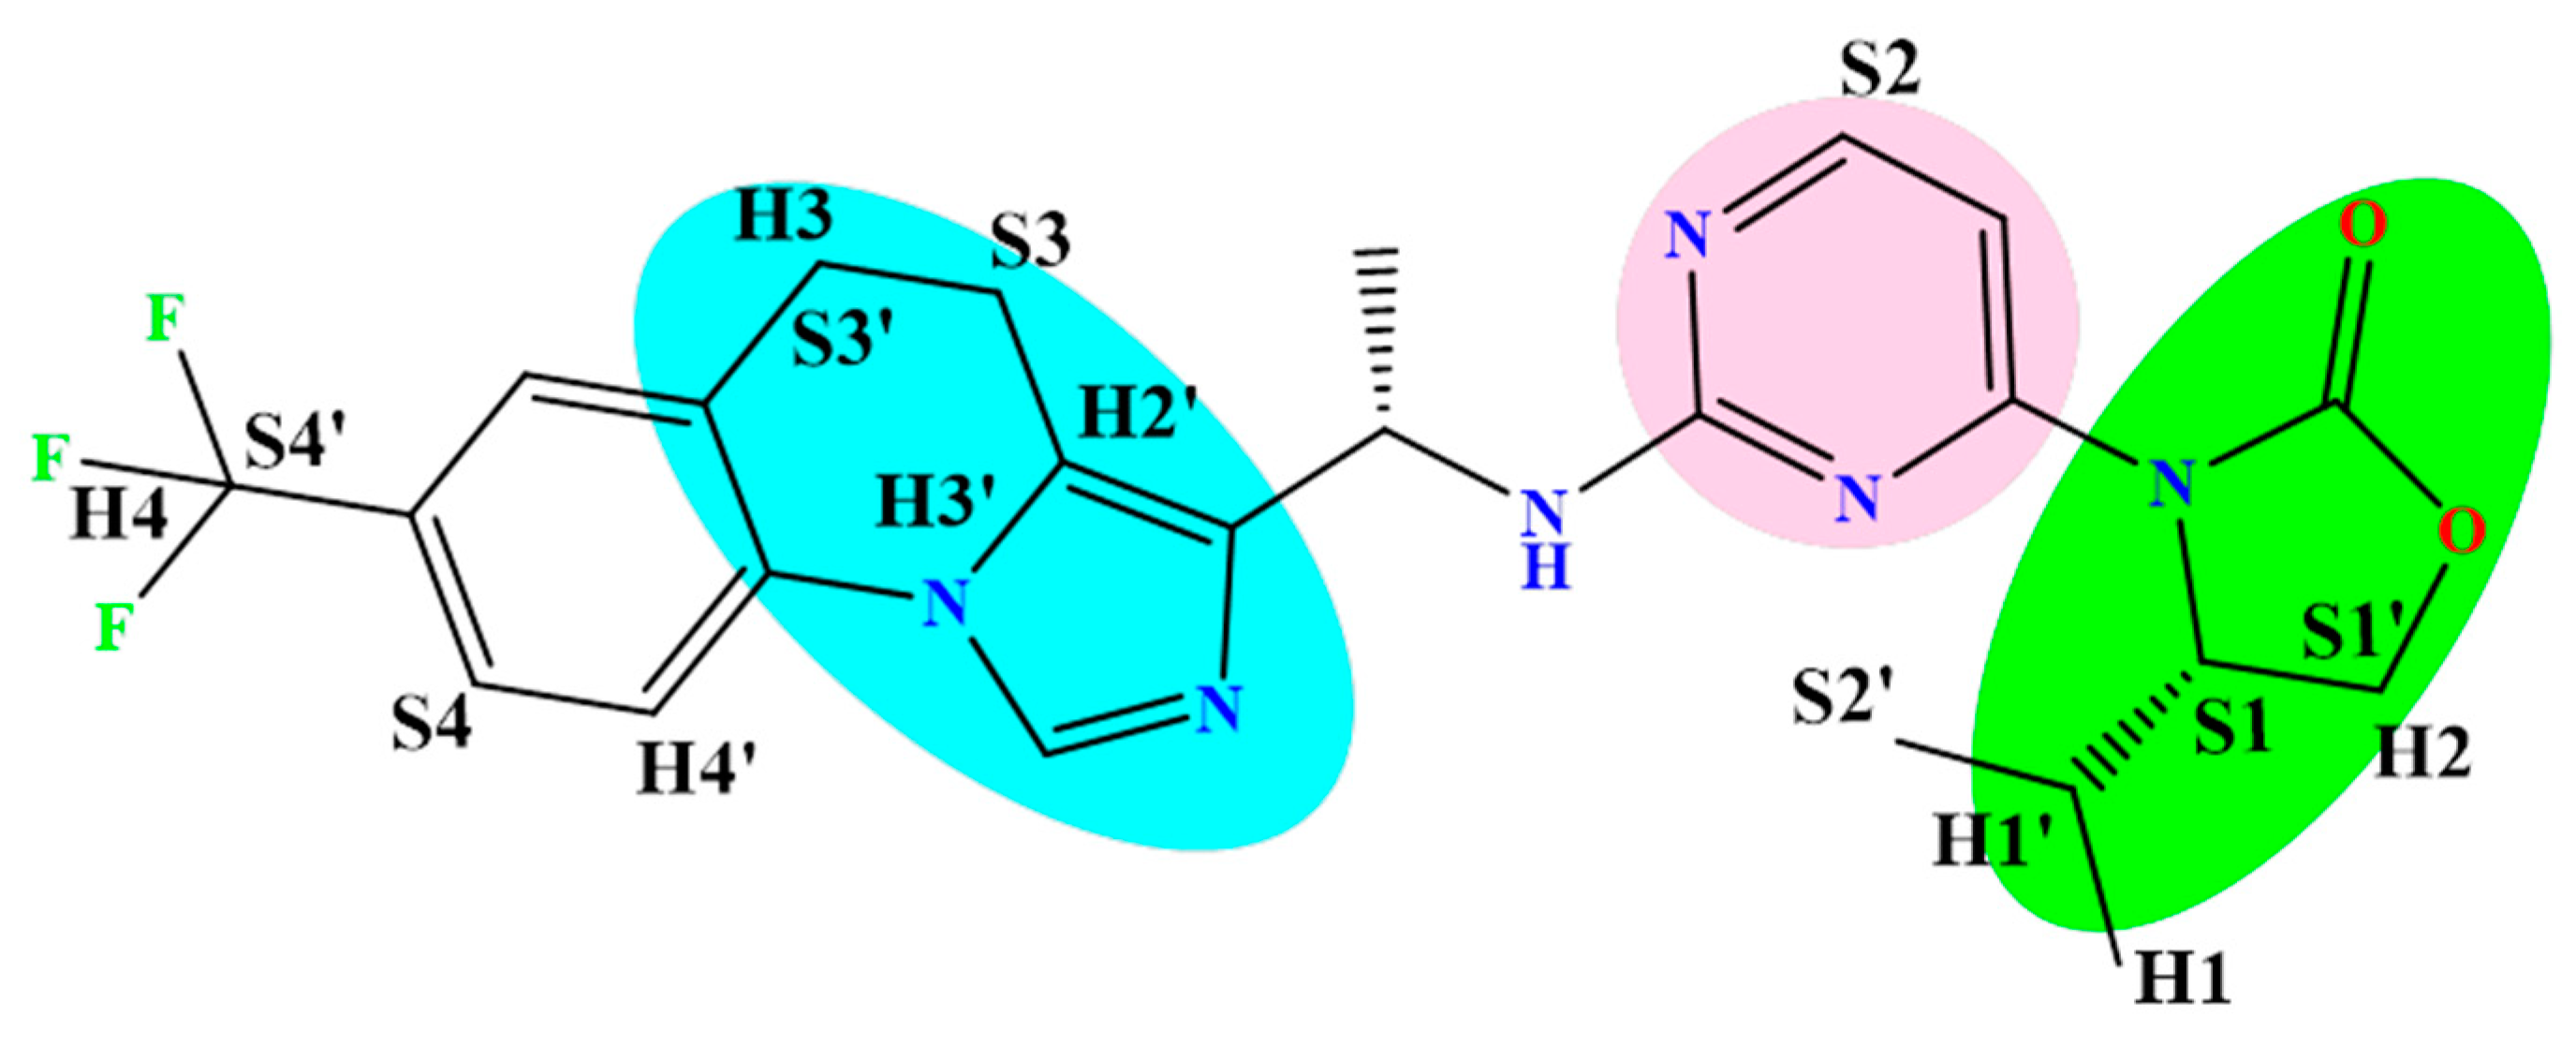
2.1. 3D-QSAR
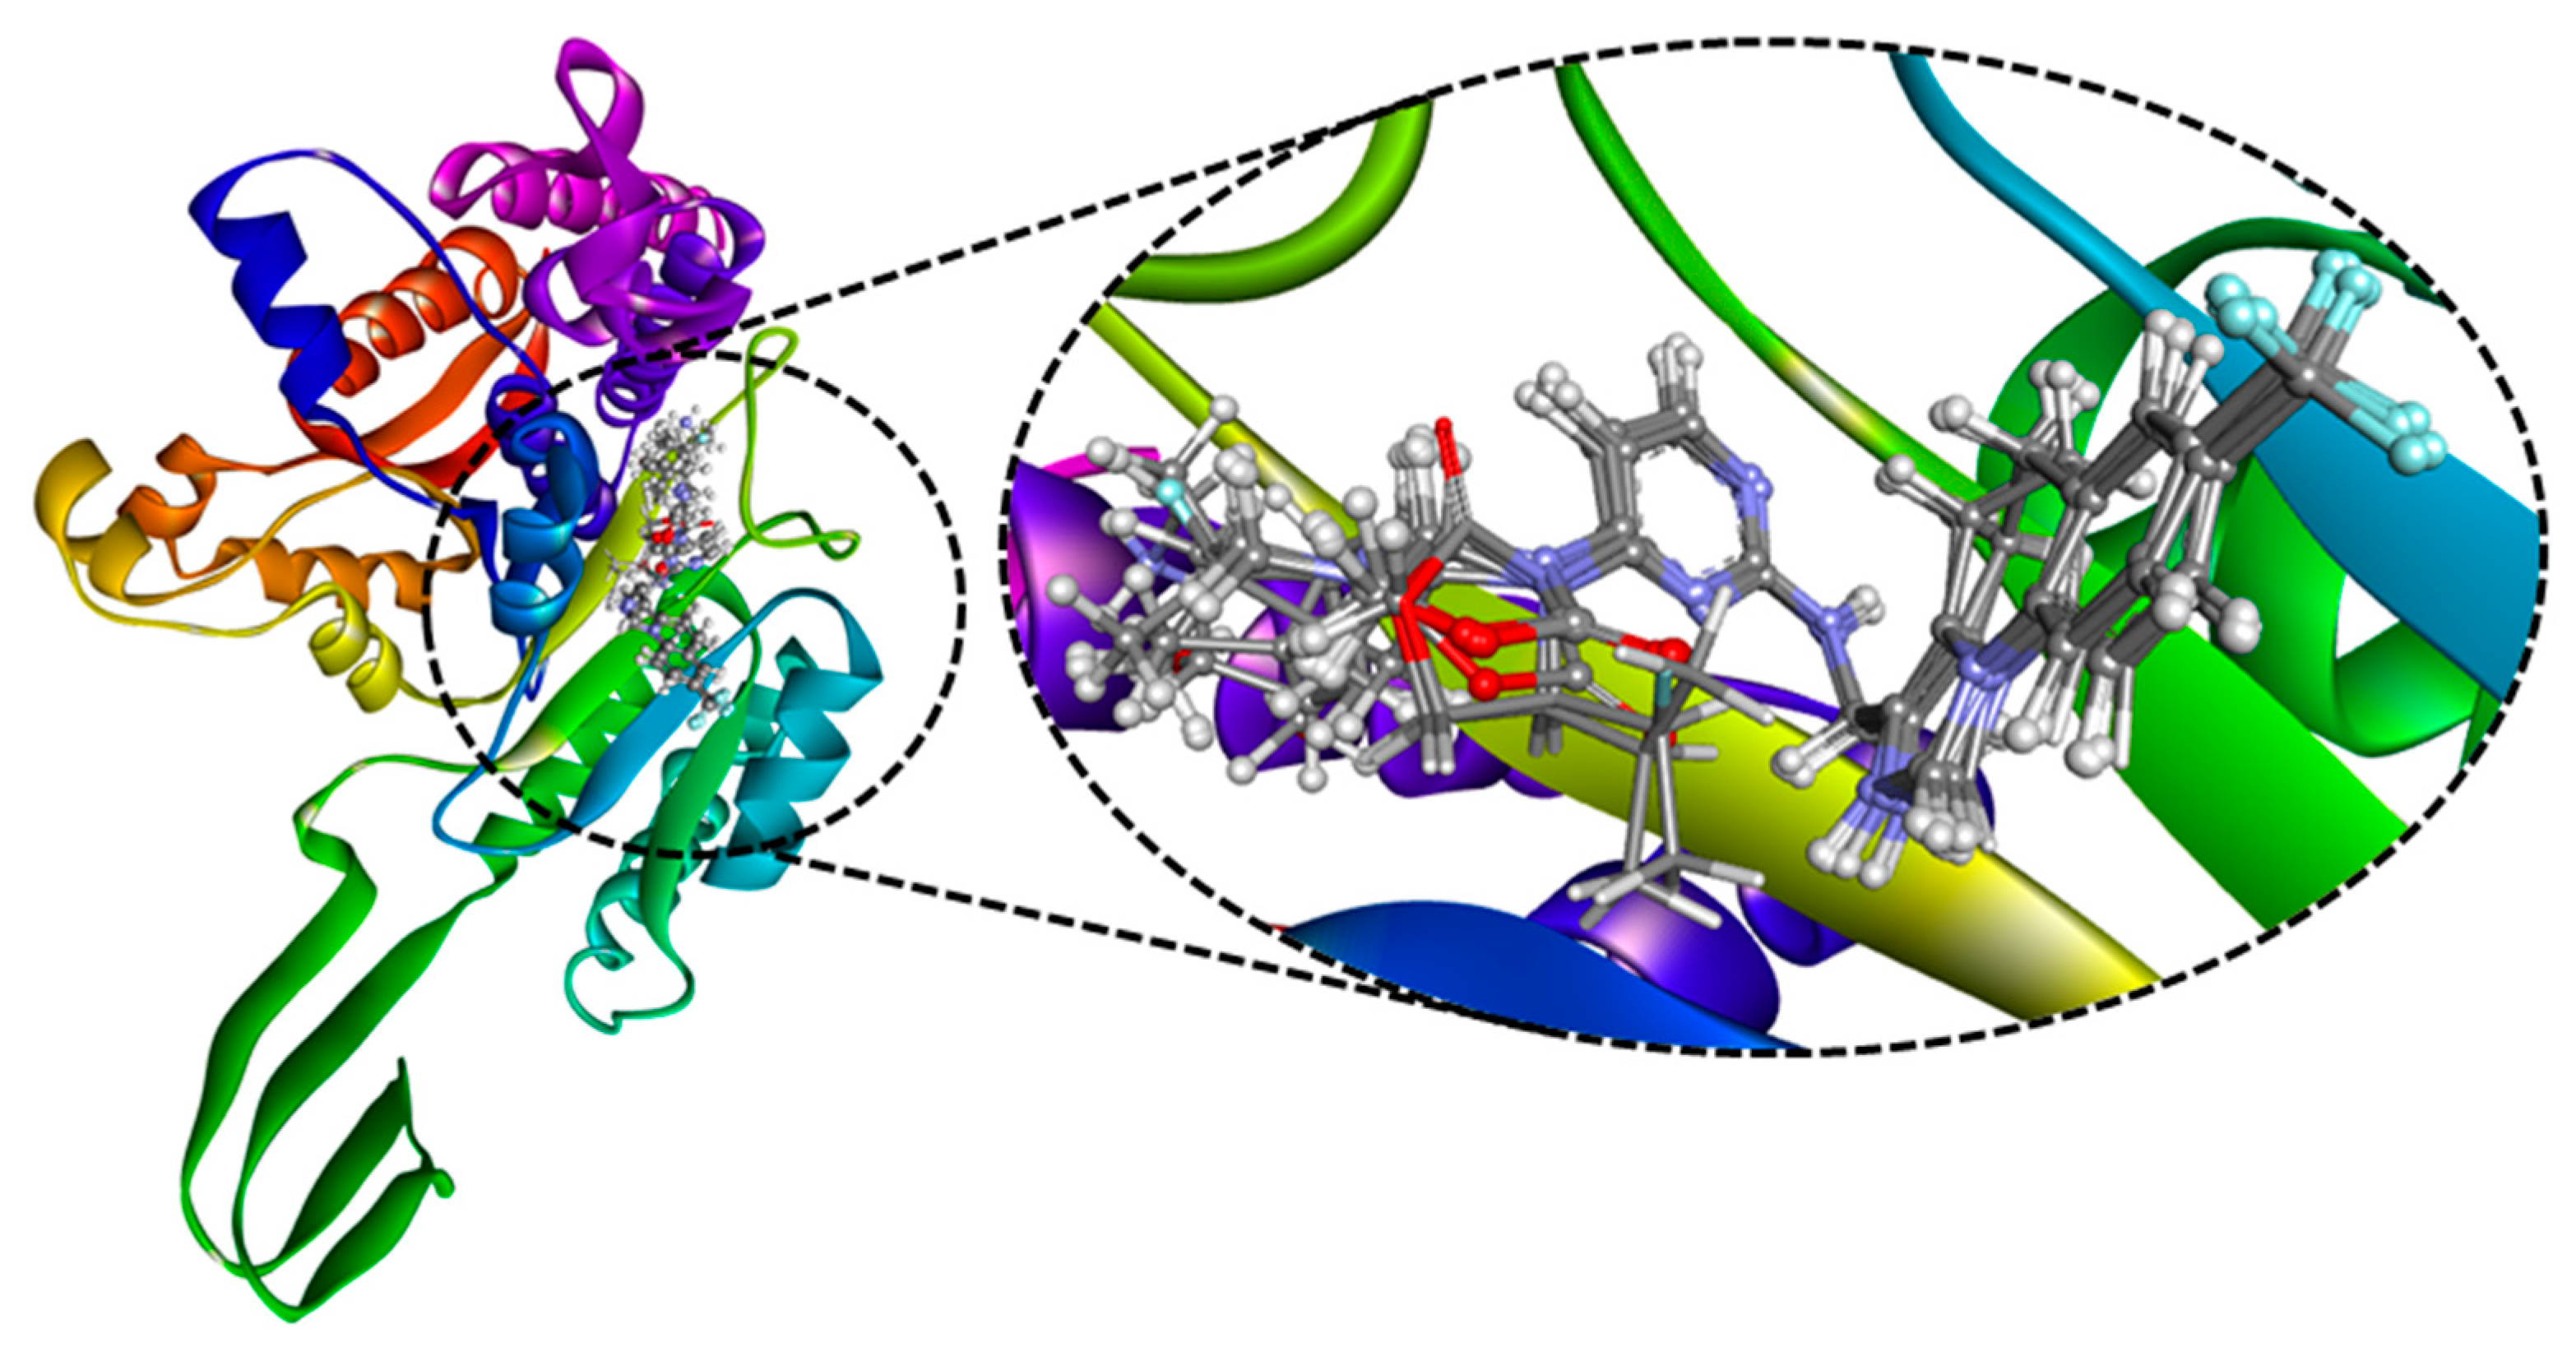
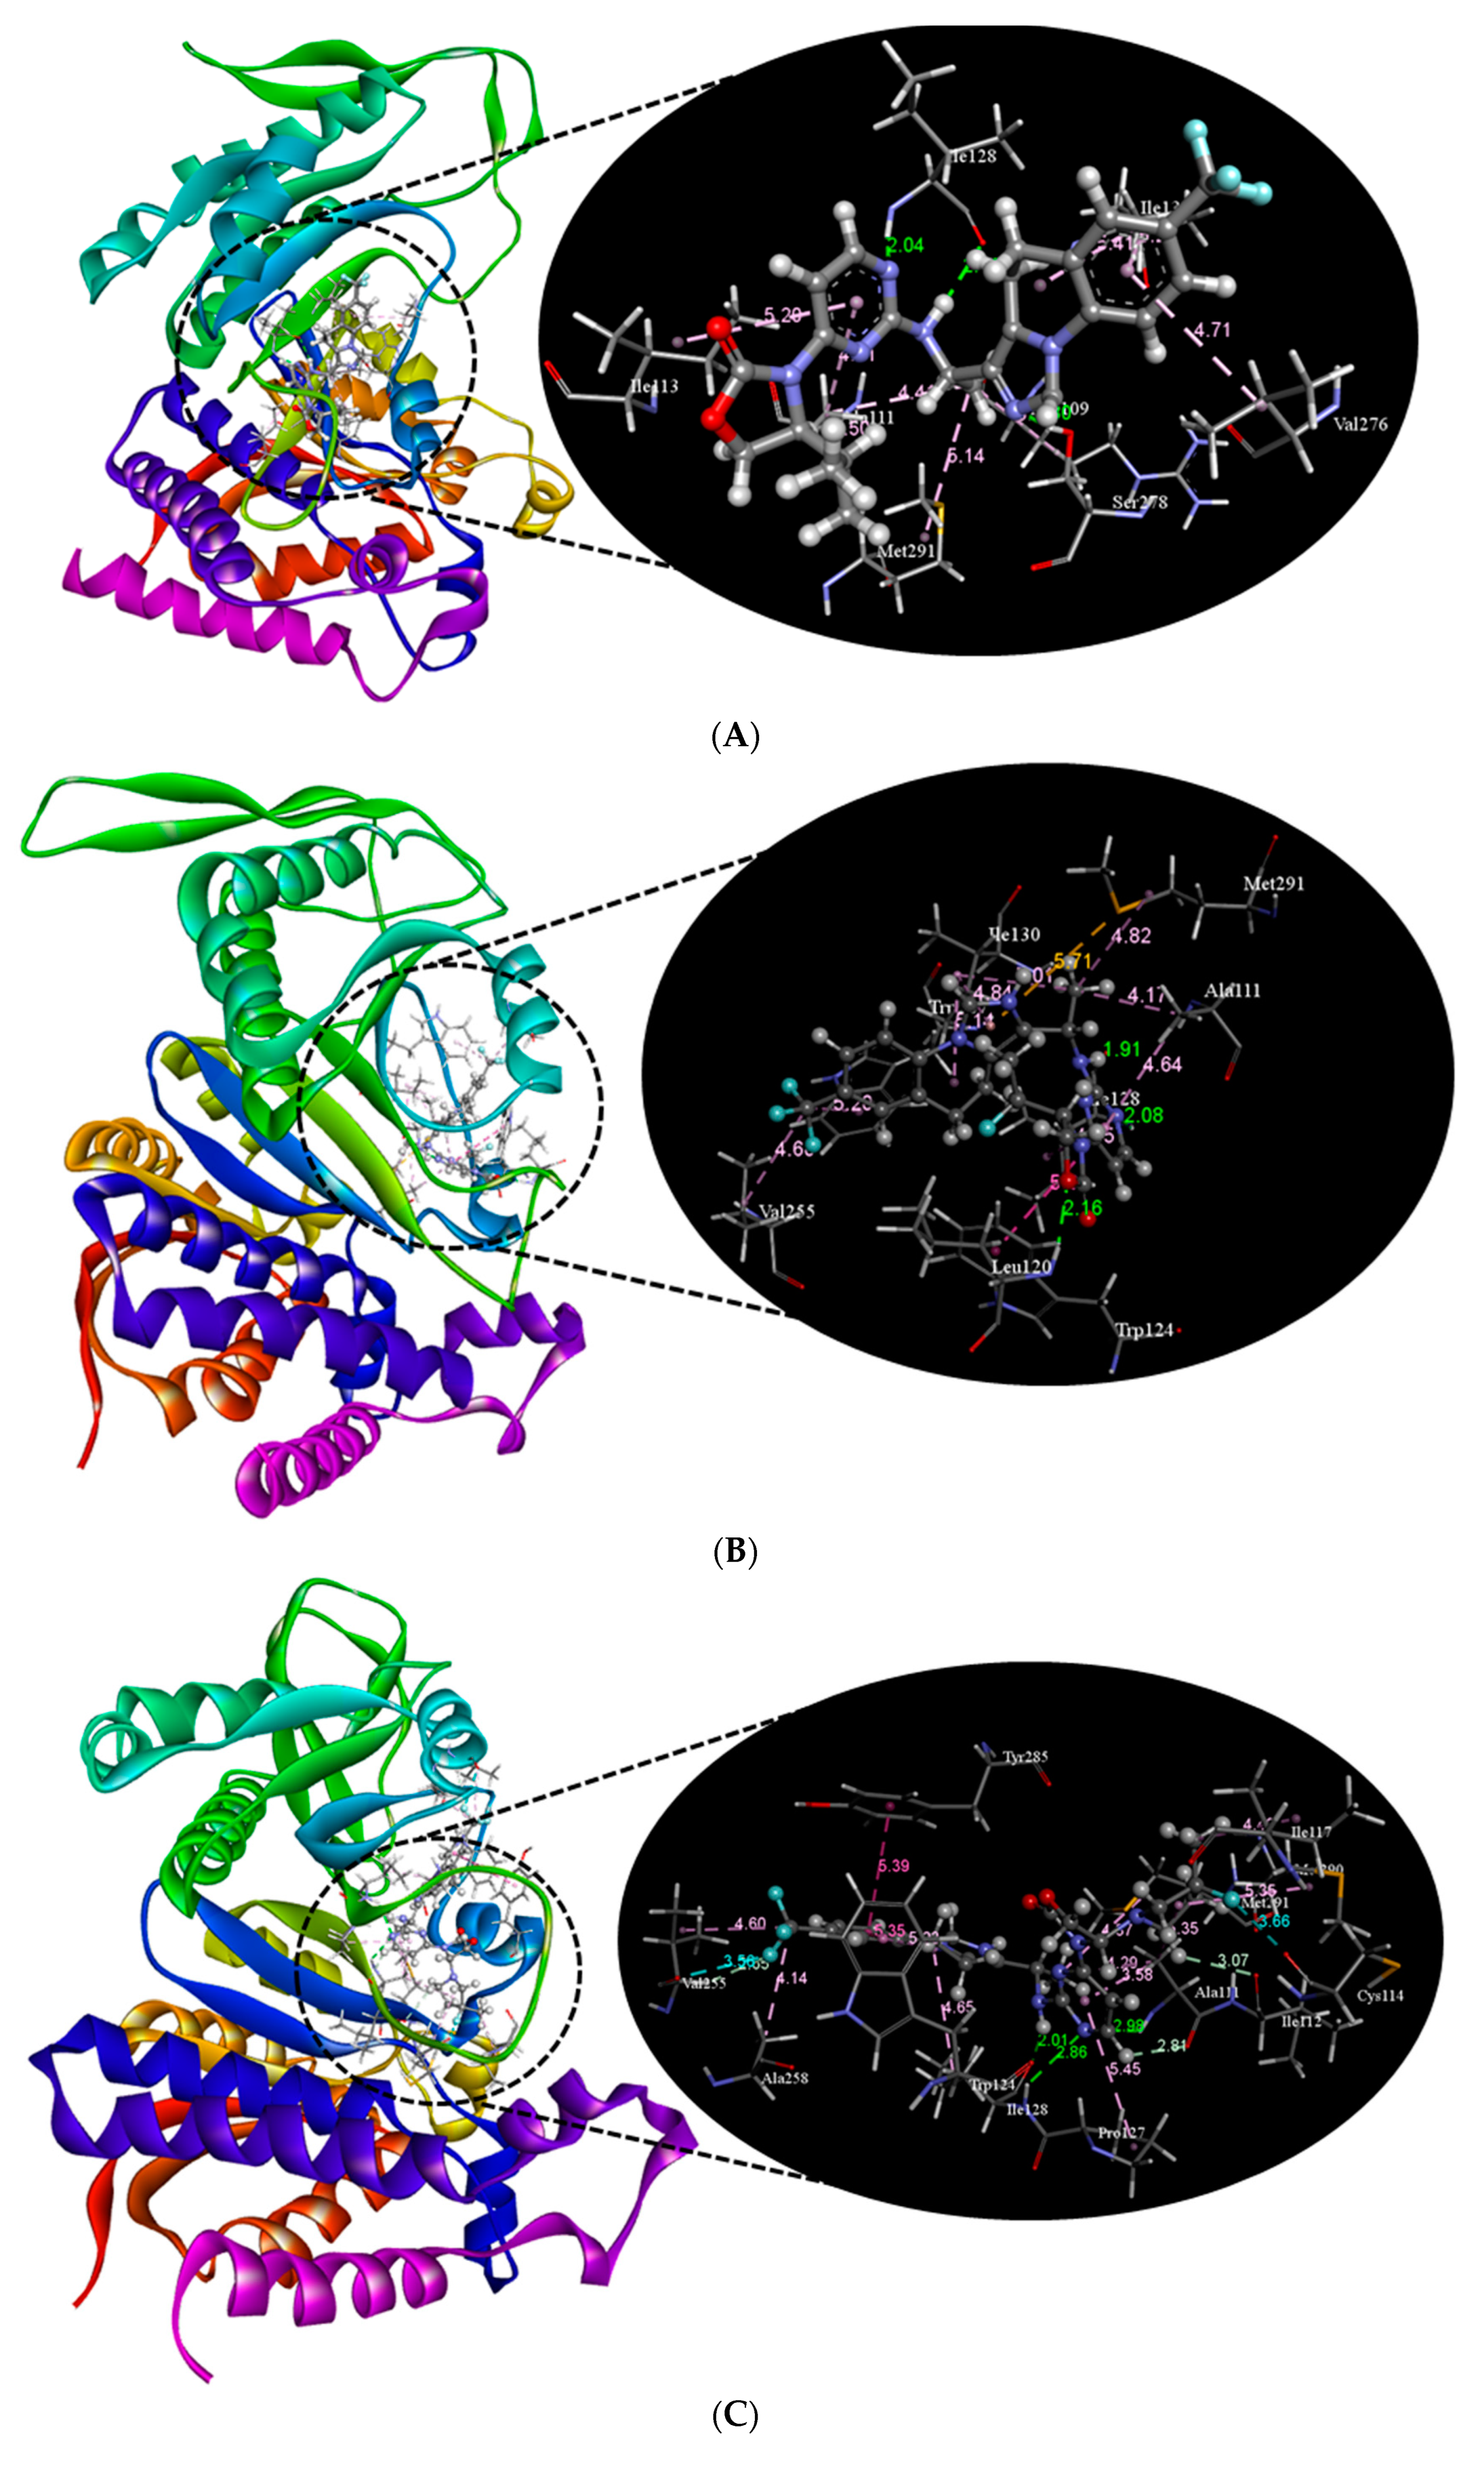
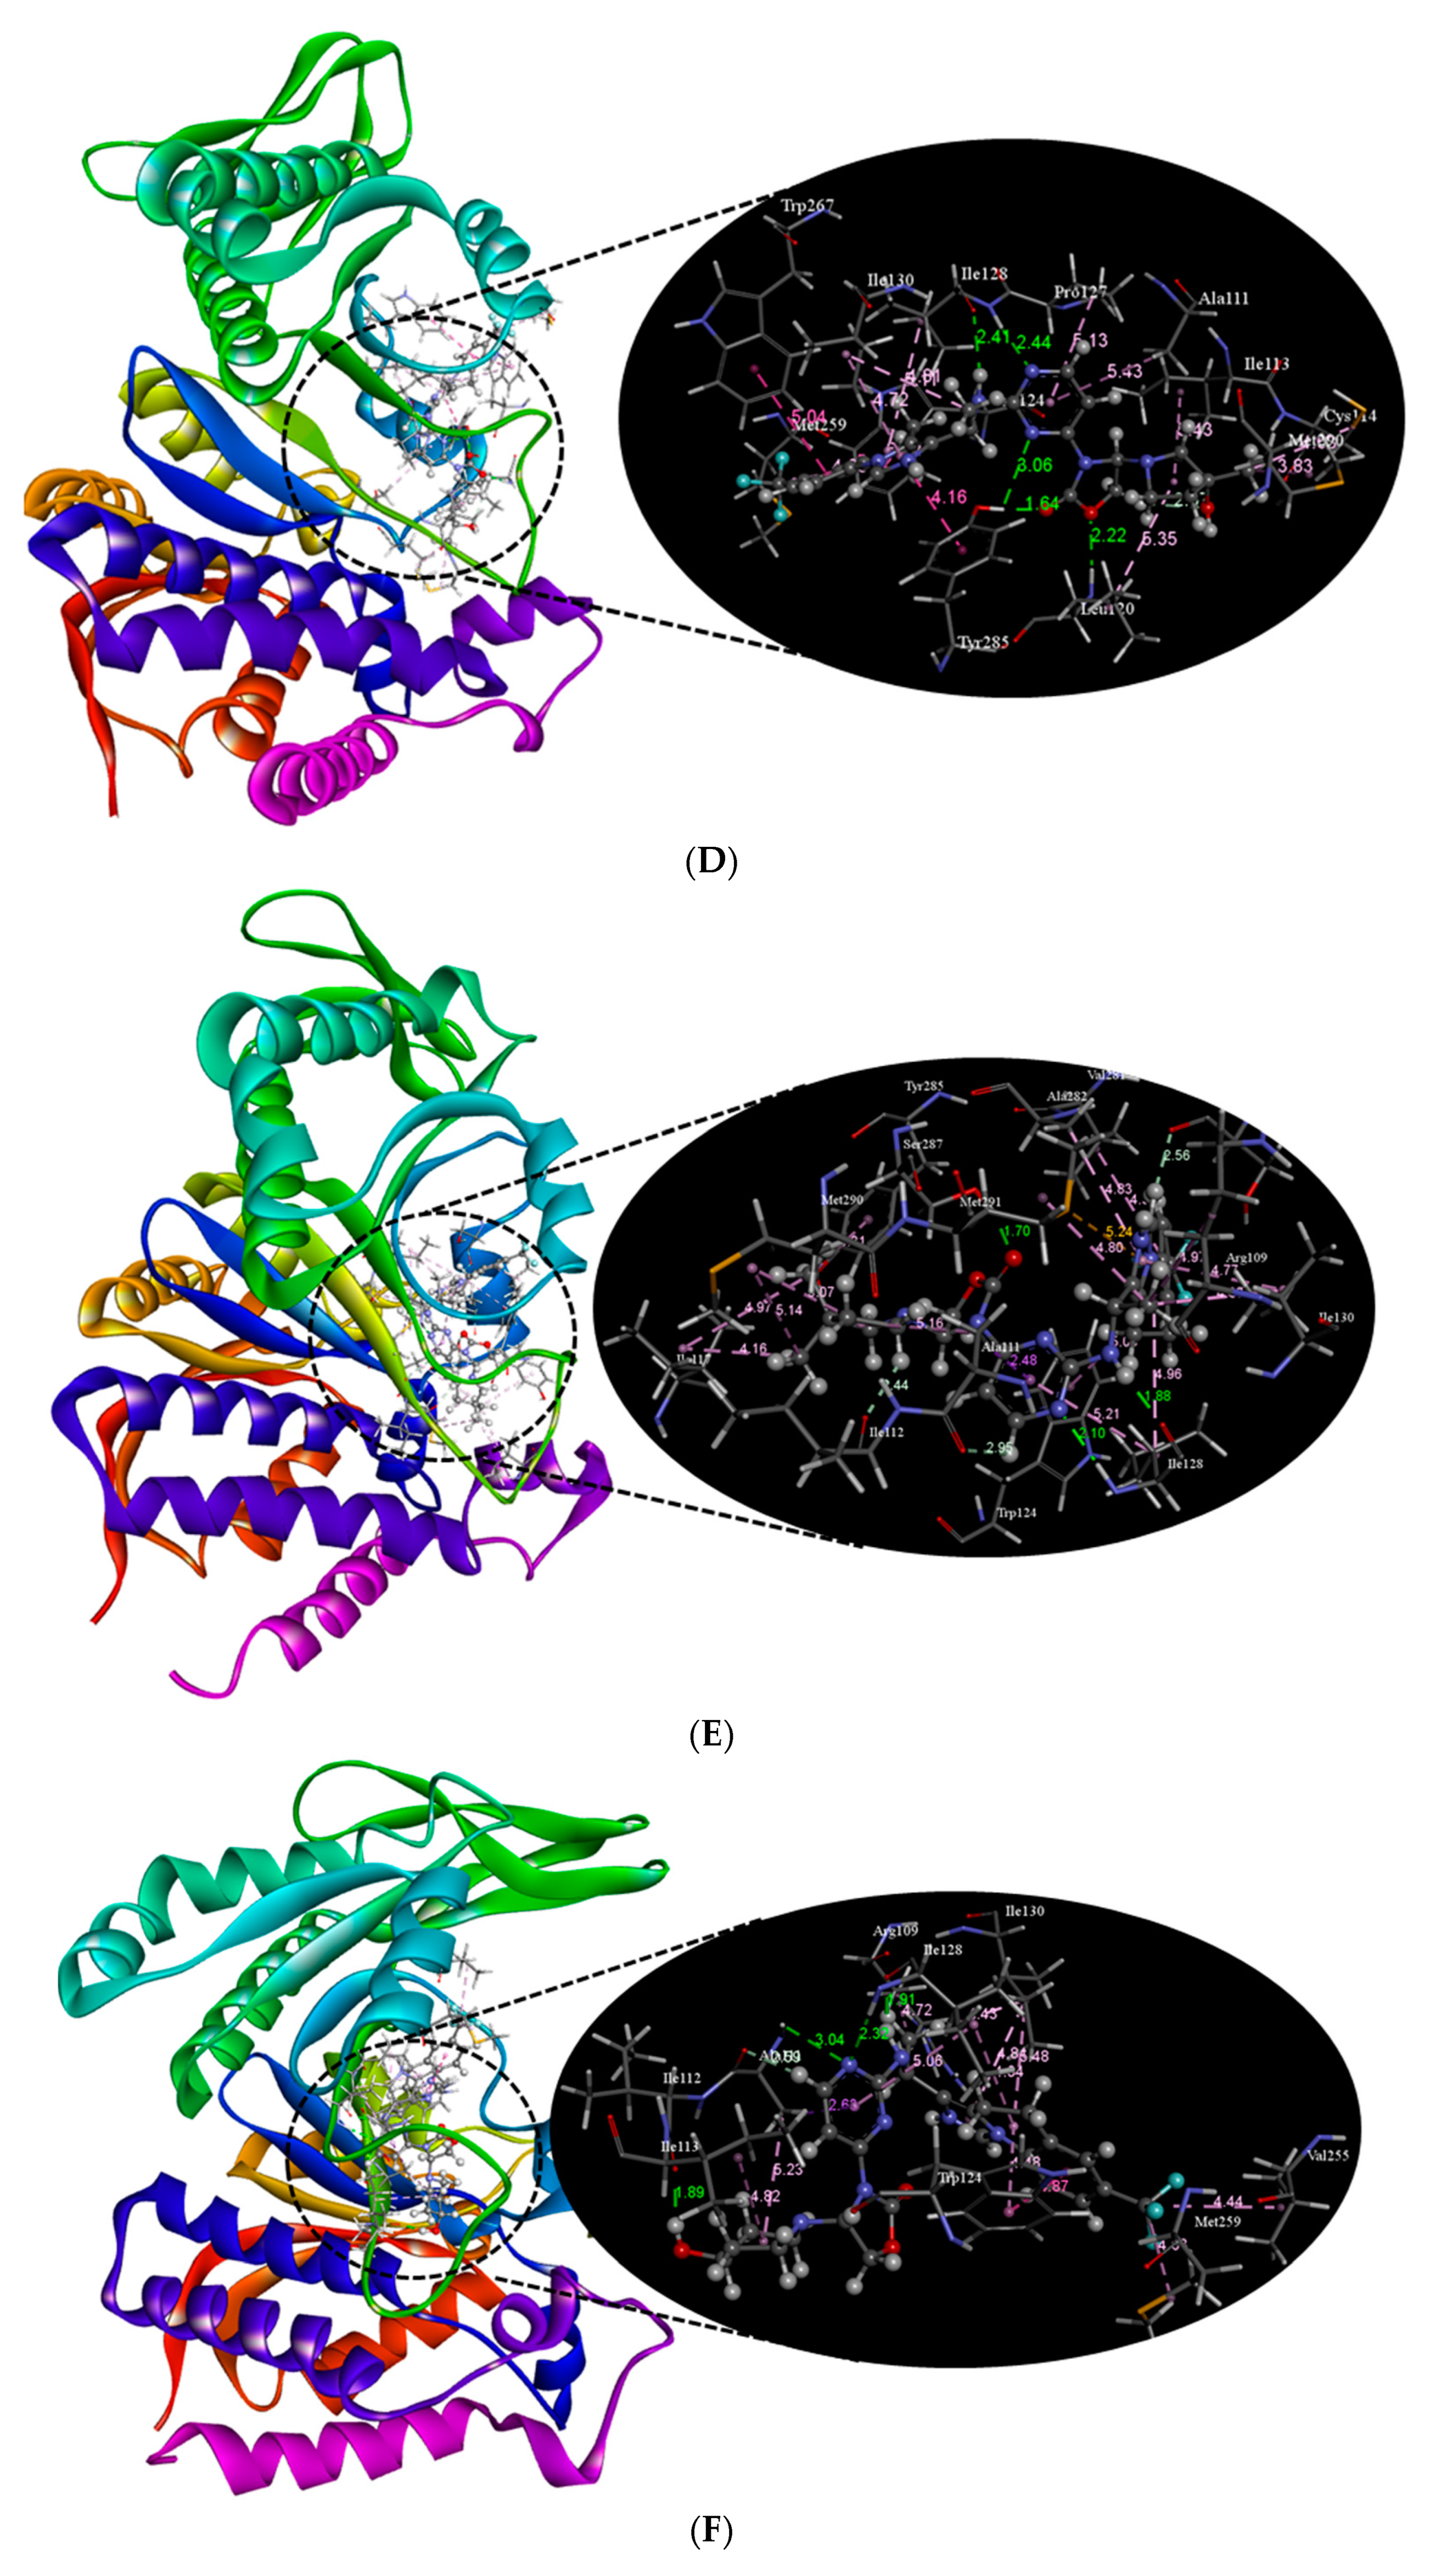
2.2. Molecular Docking
2.3. MD Simulation
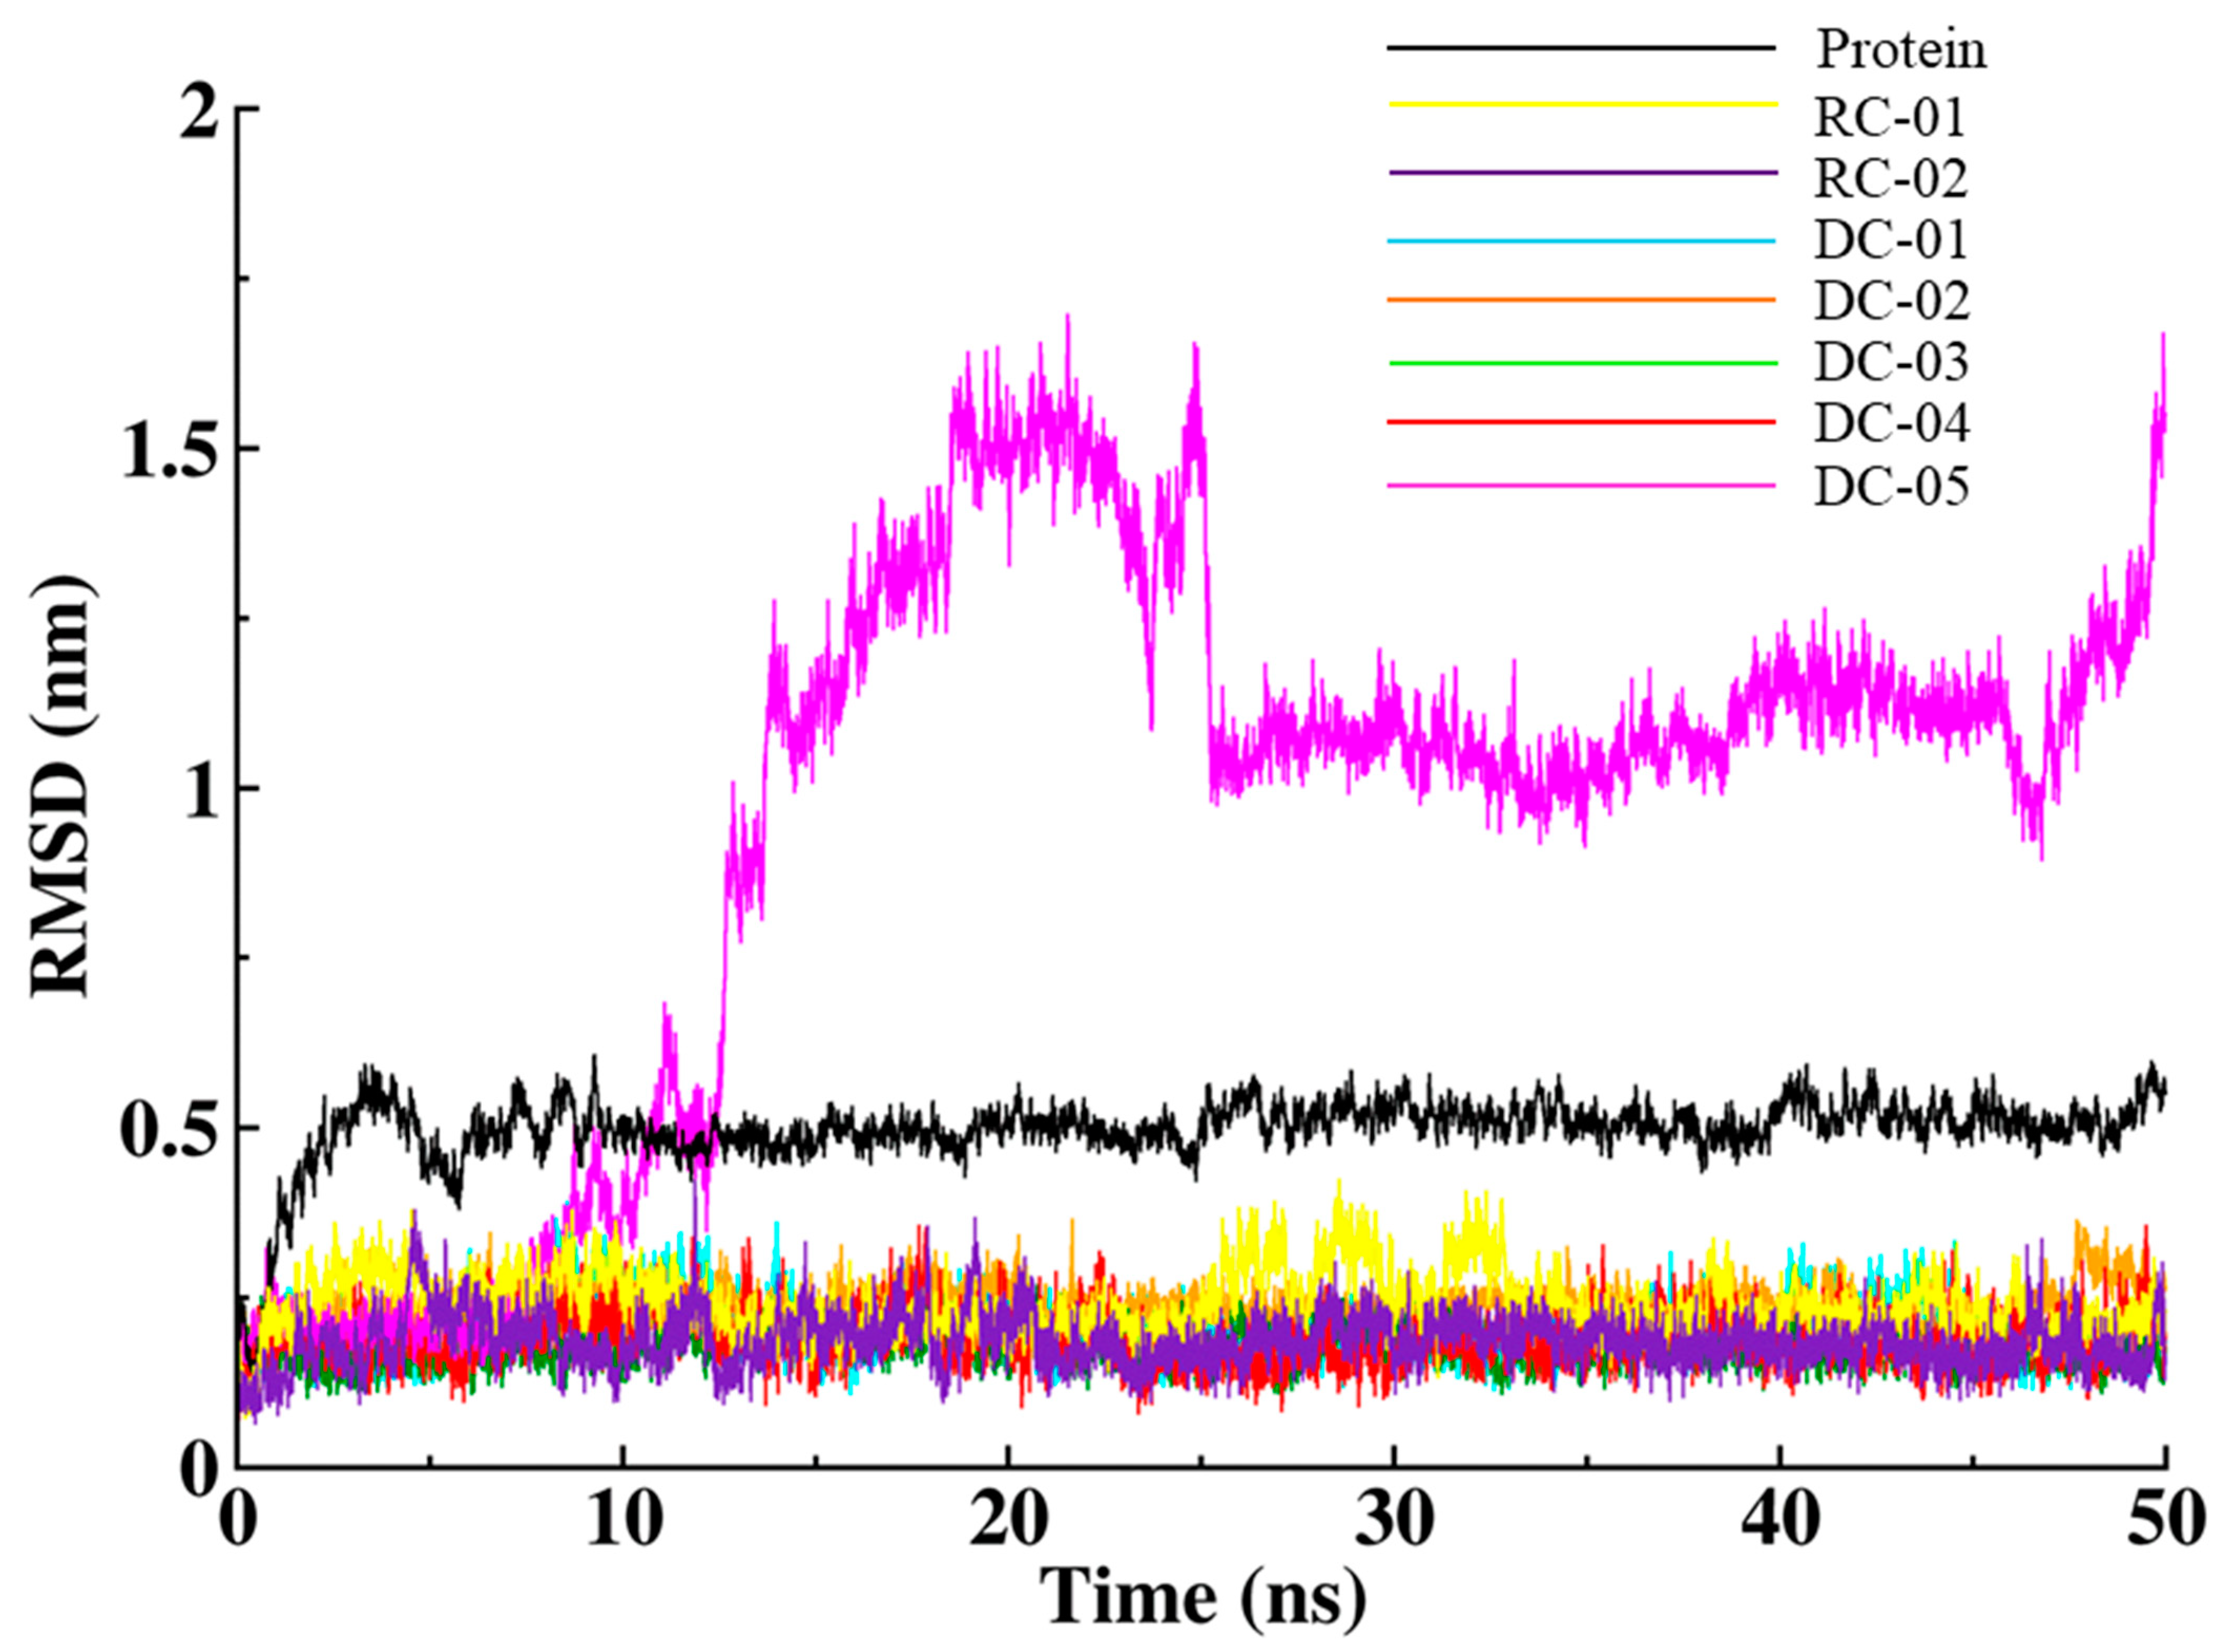
2.3.1. Root-Mean-Square Deviation (RMSD)
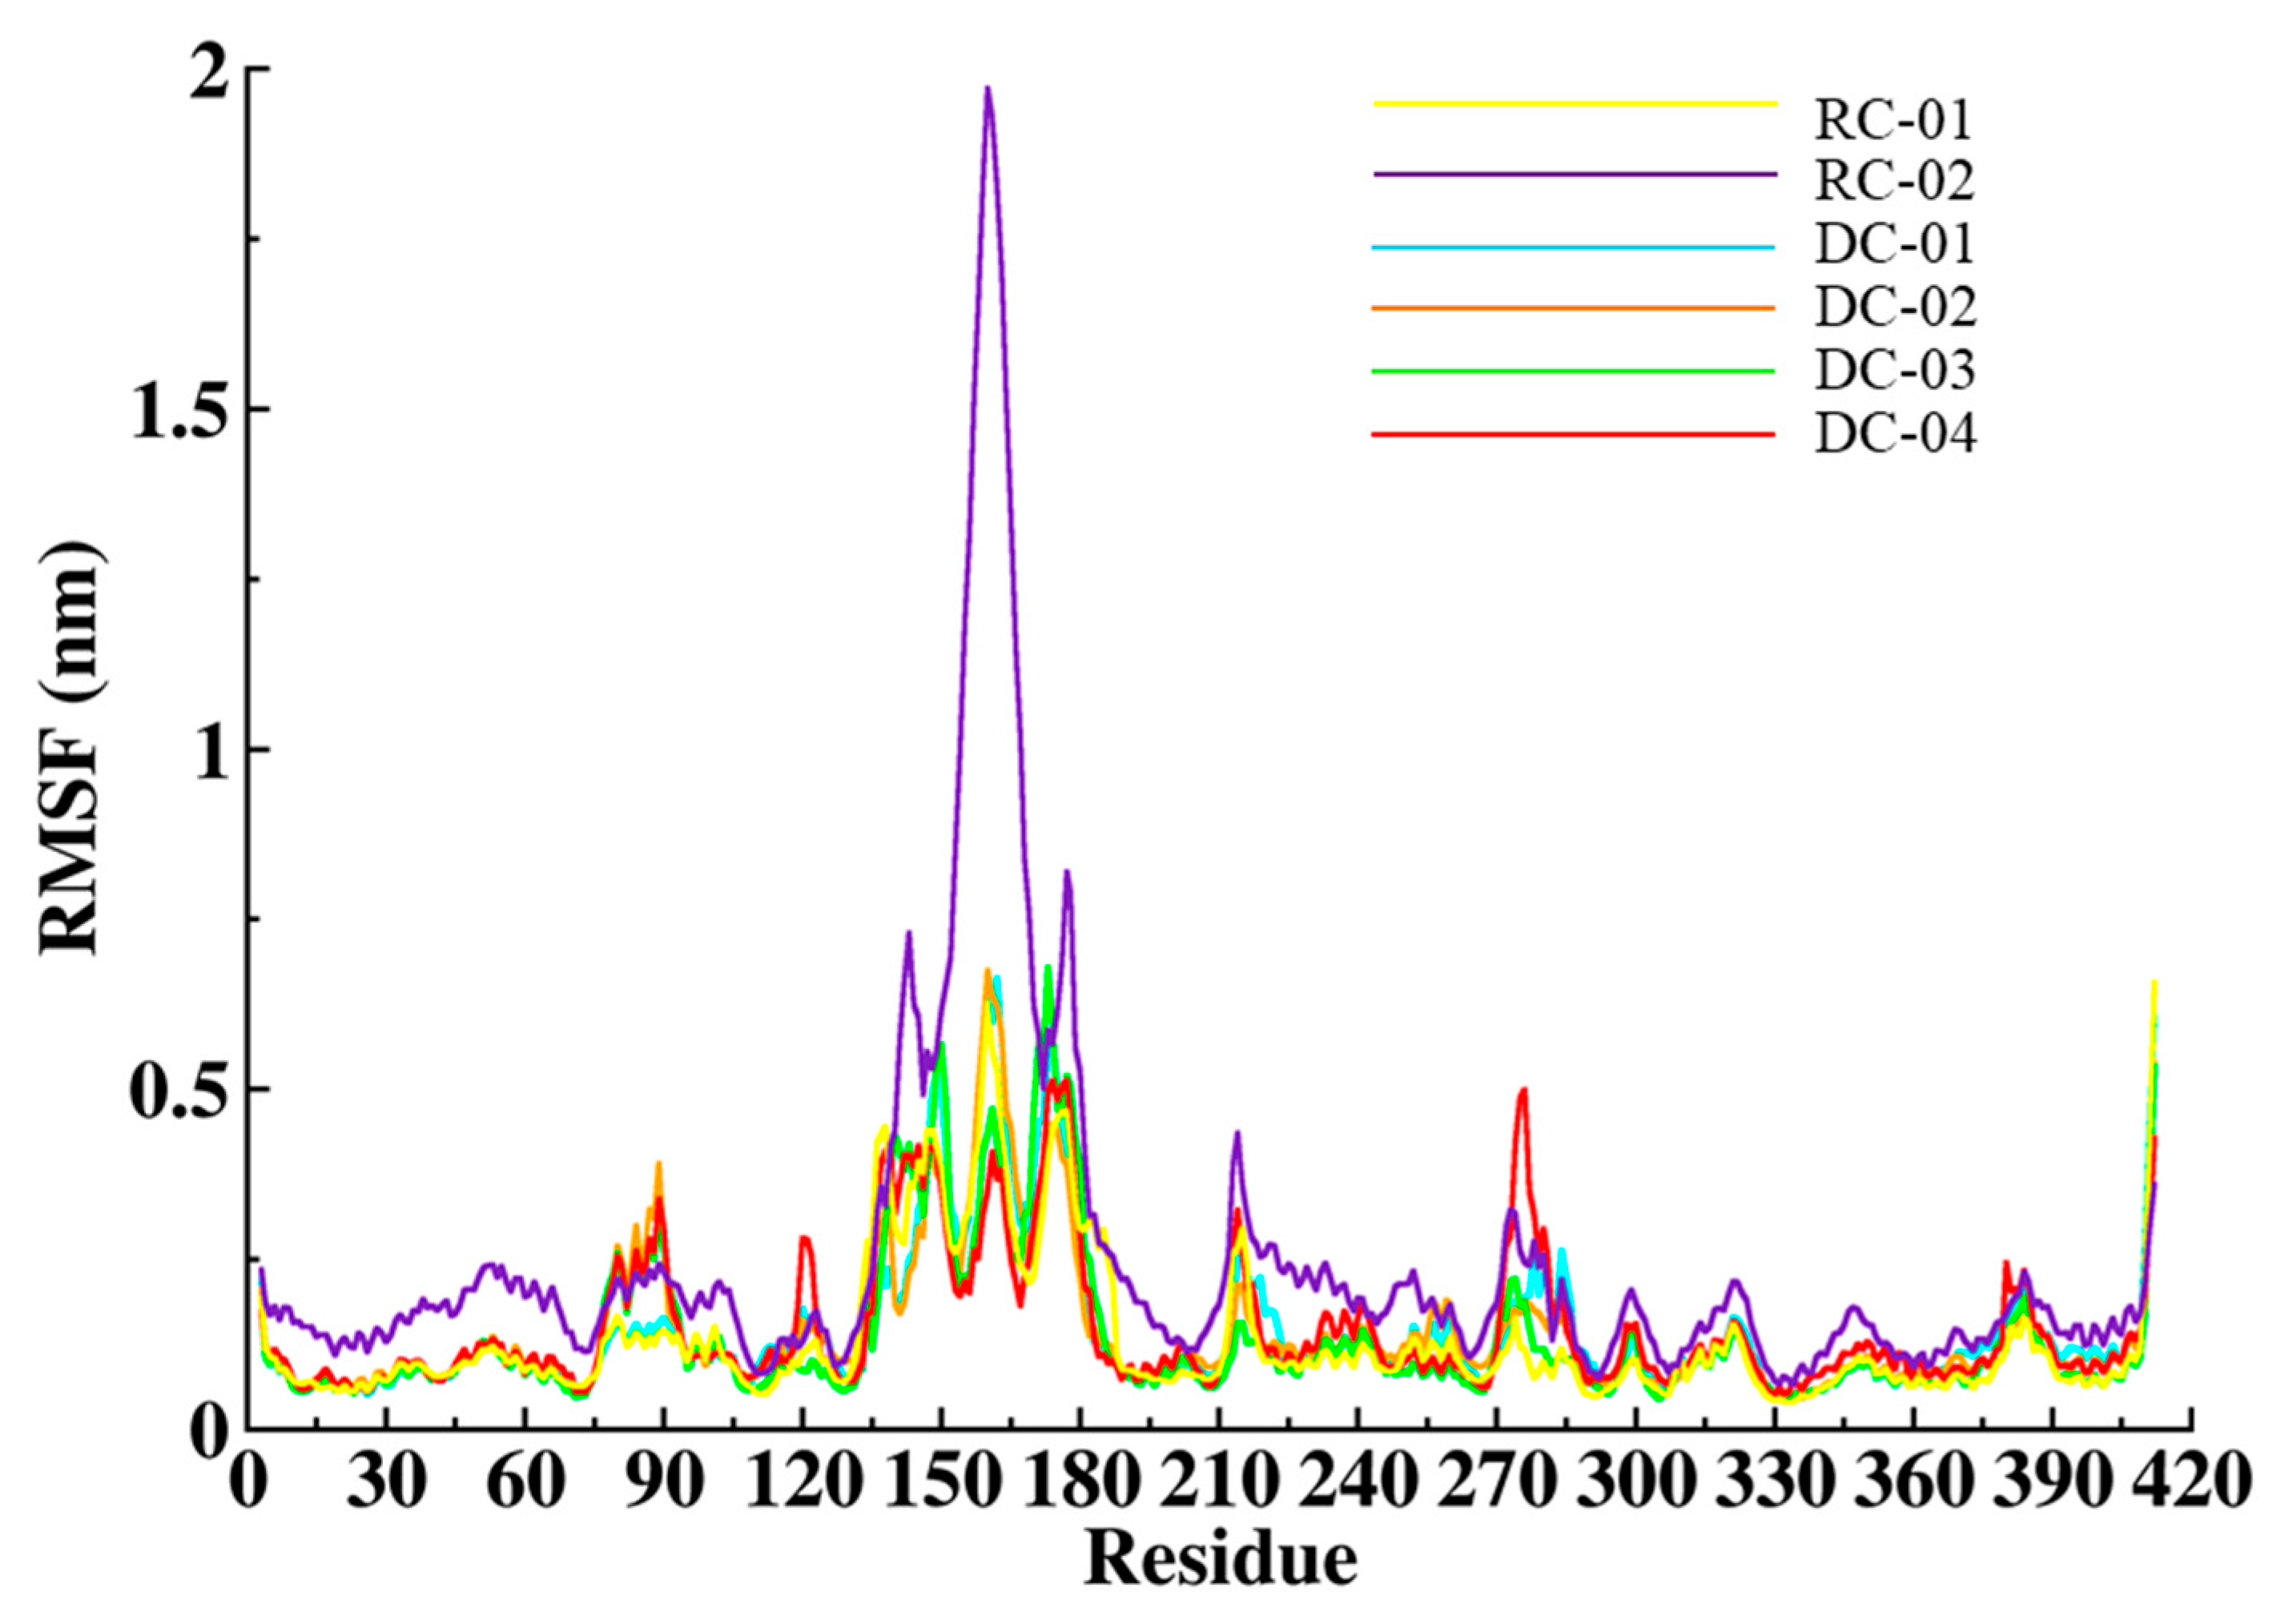
2.3.2. Root-Mean-Square Fluctuation (RMSF)
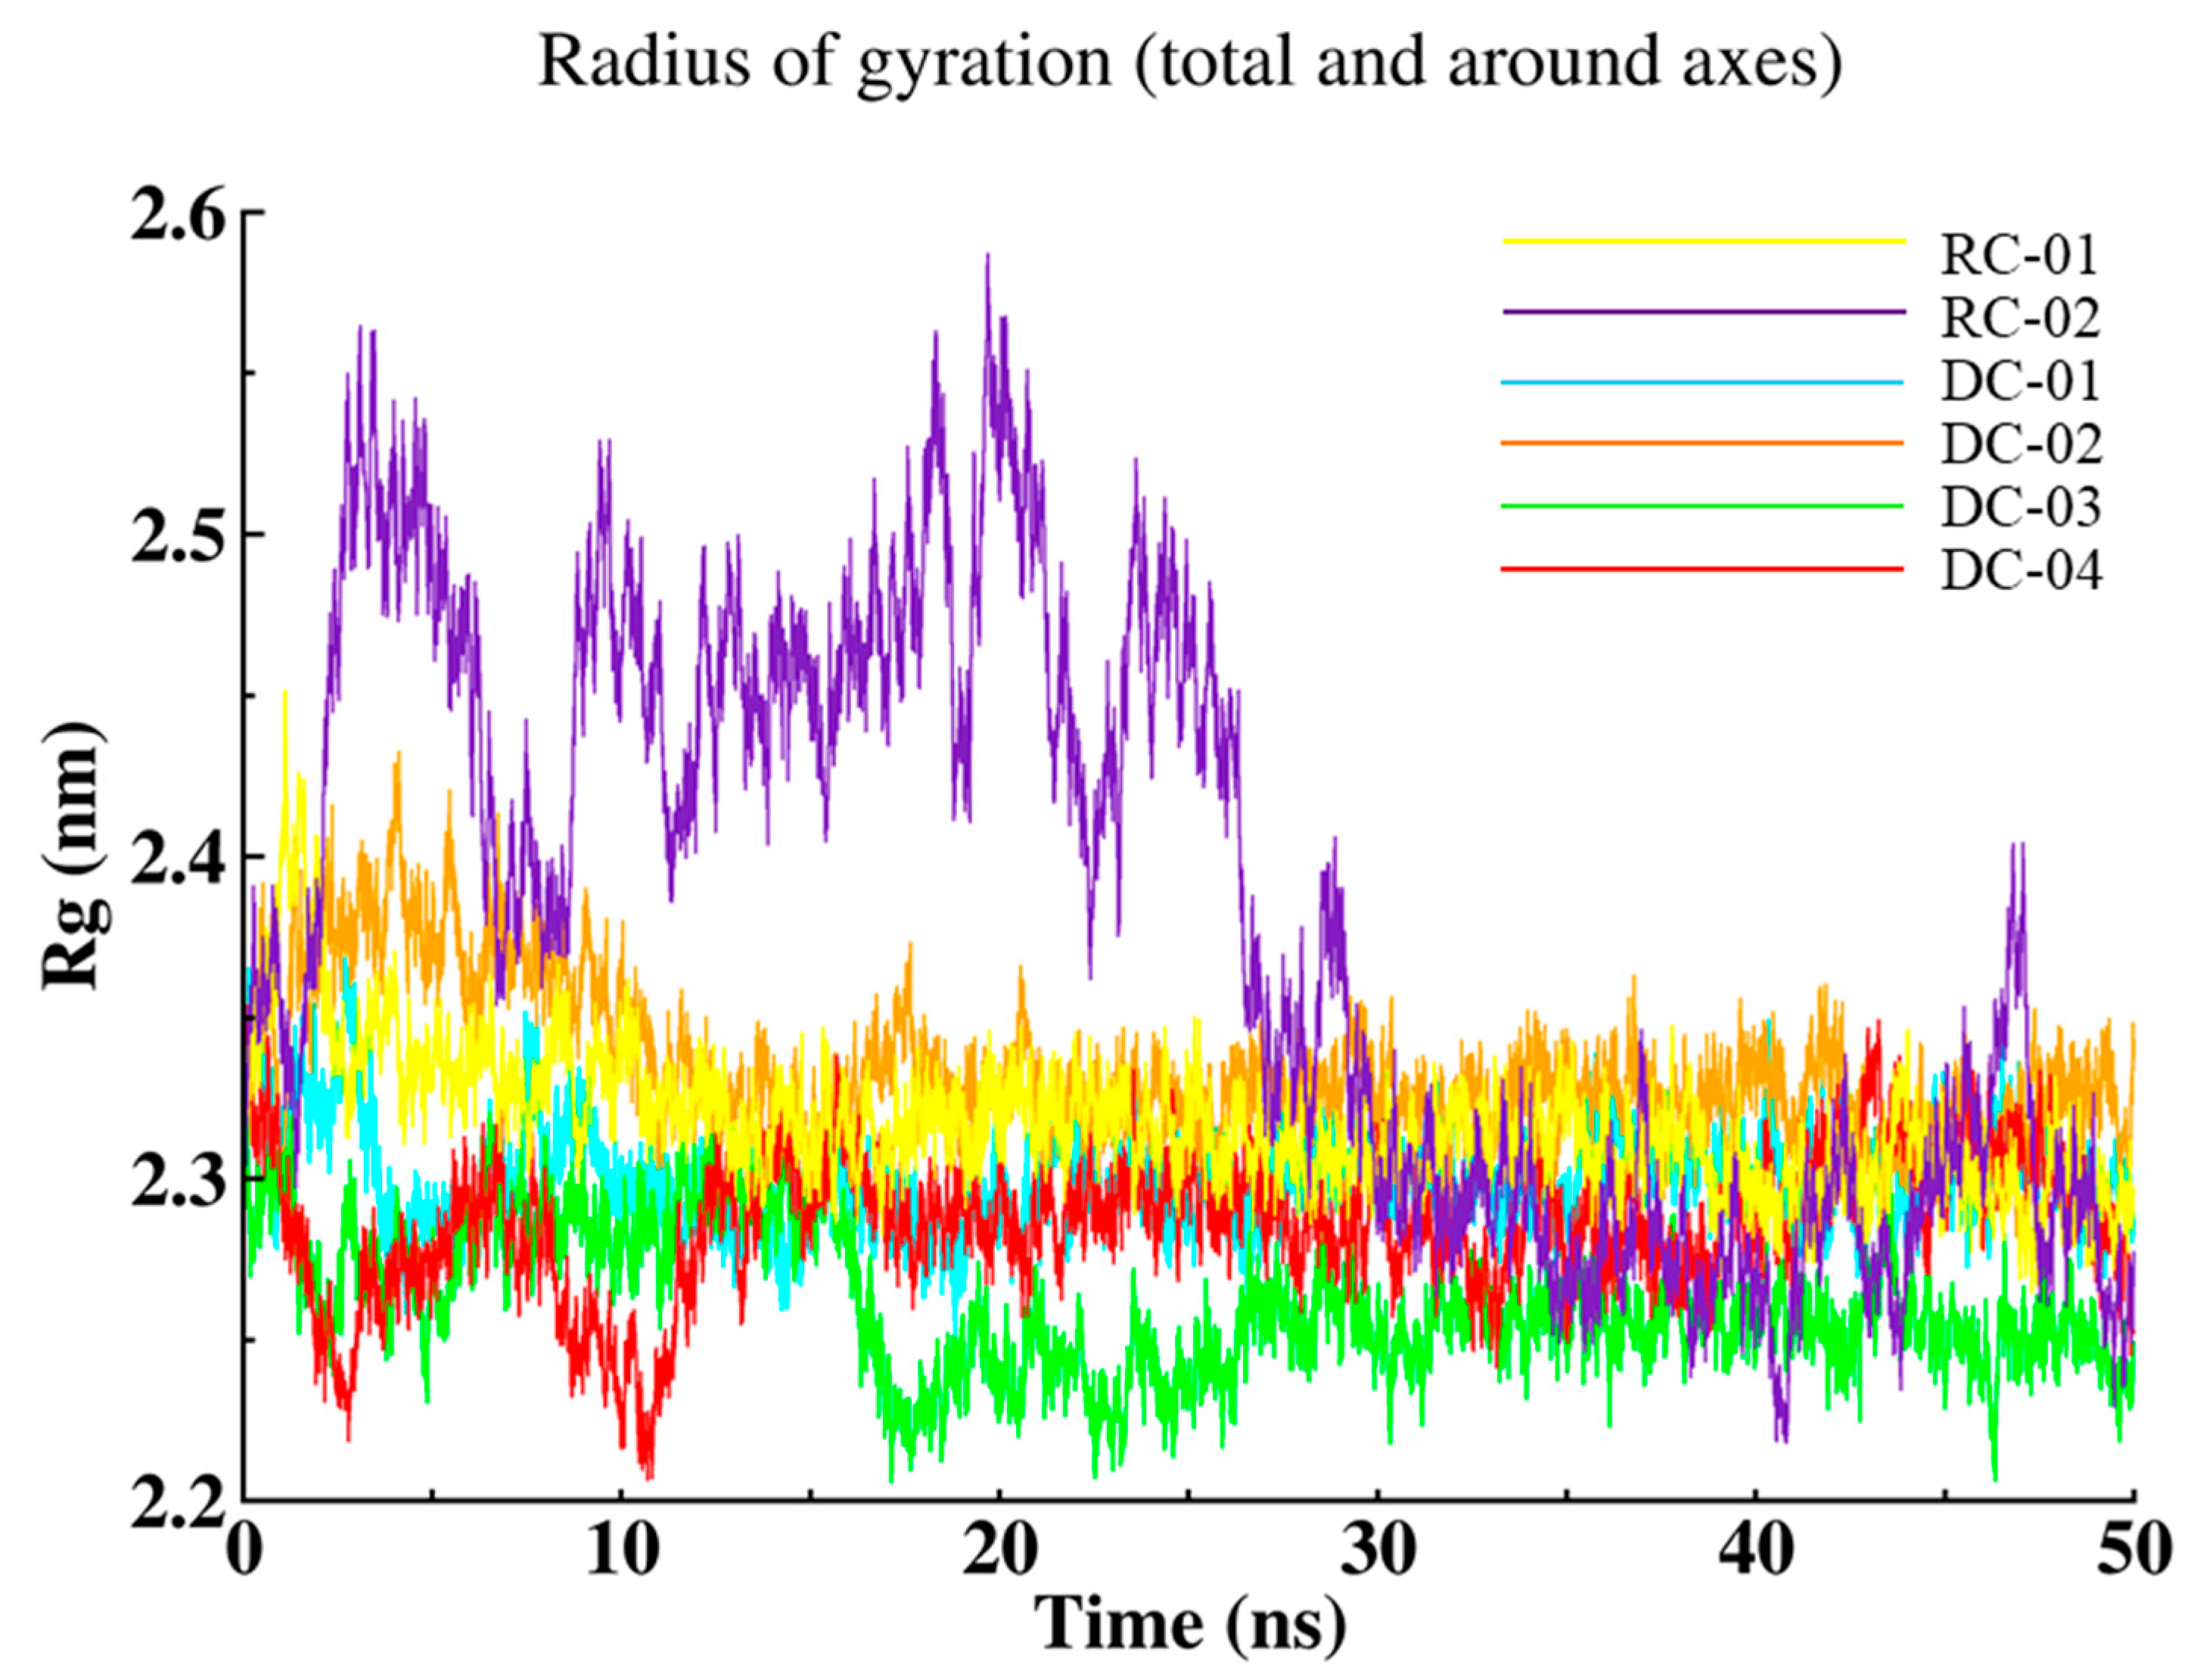
2.3.3. Radius of Gyration (Rg)
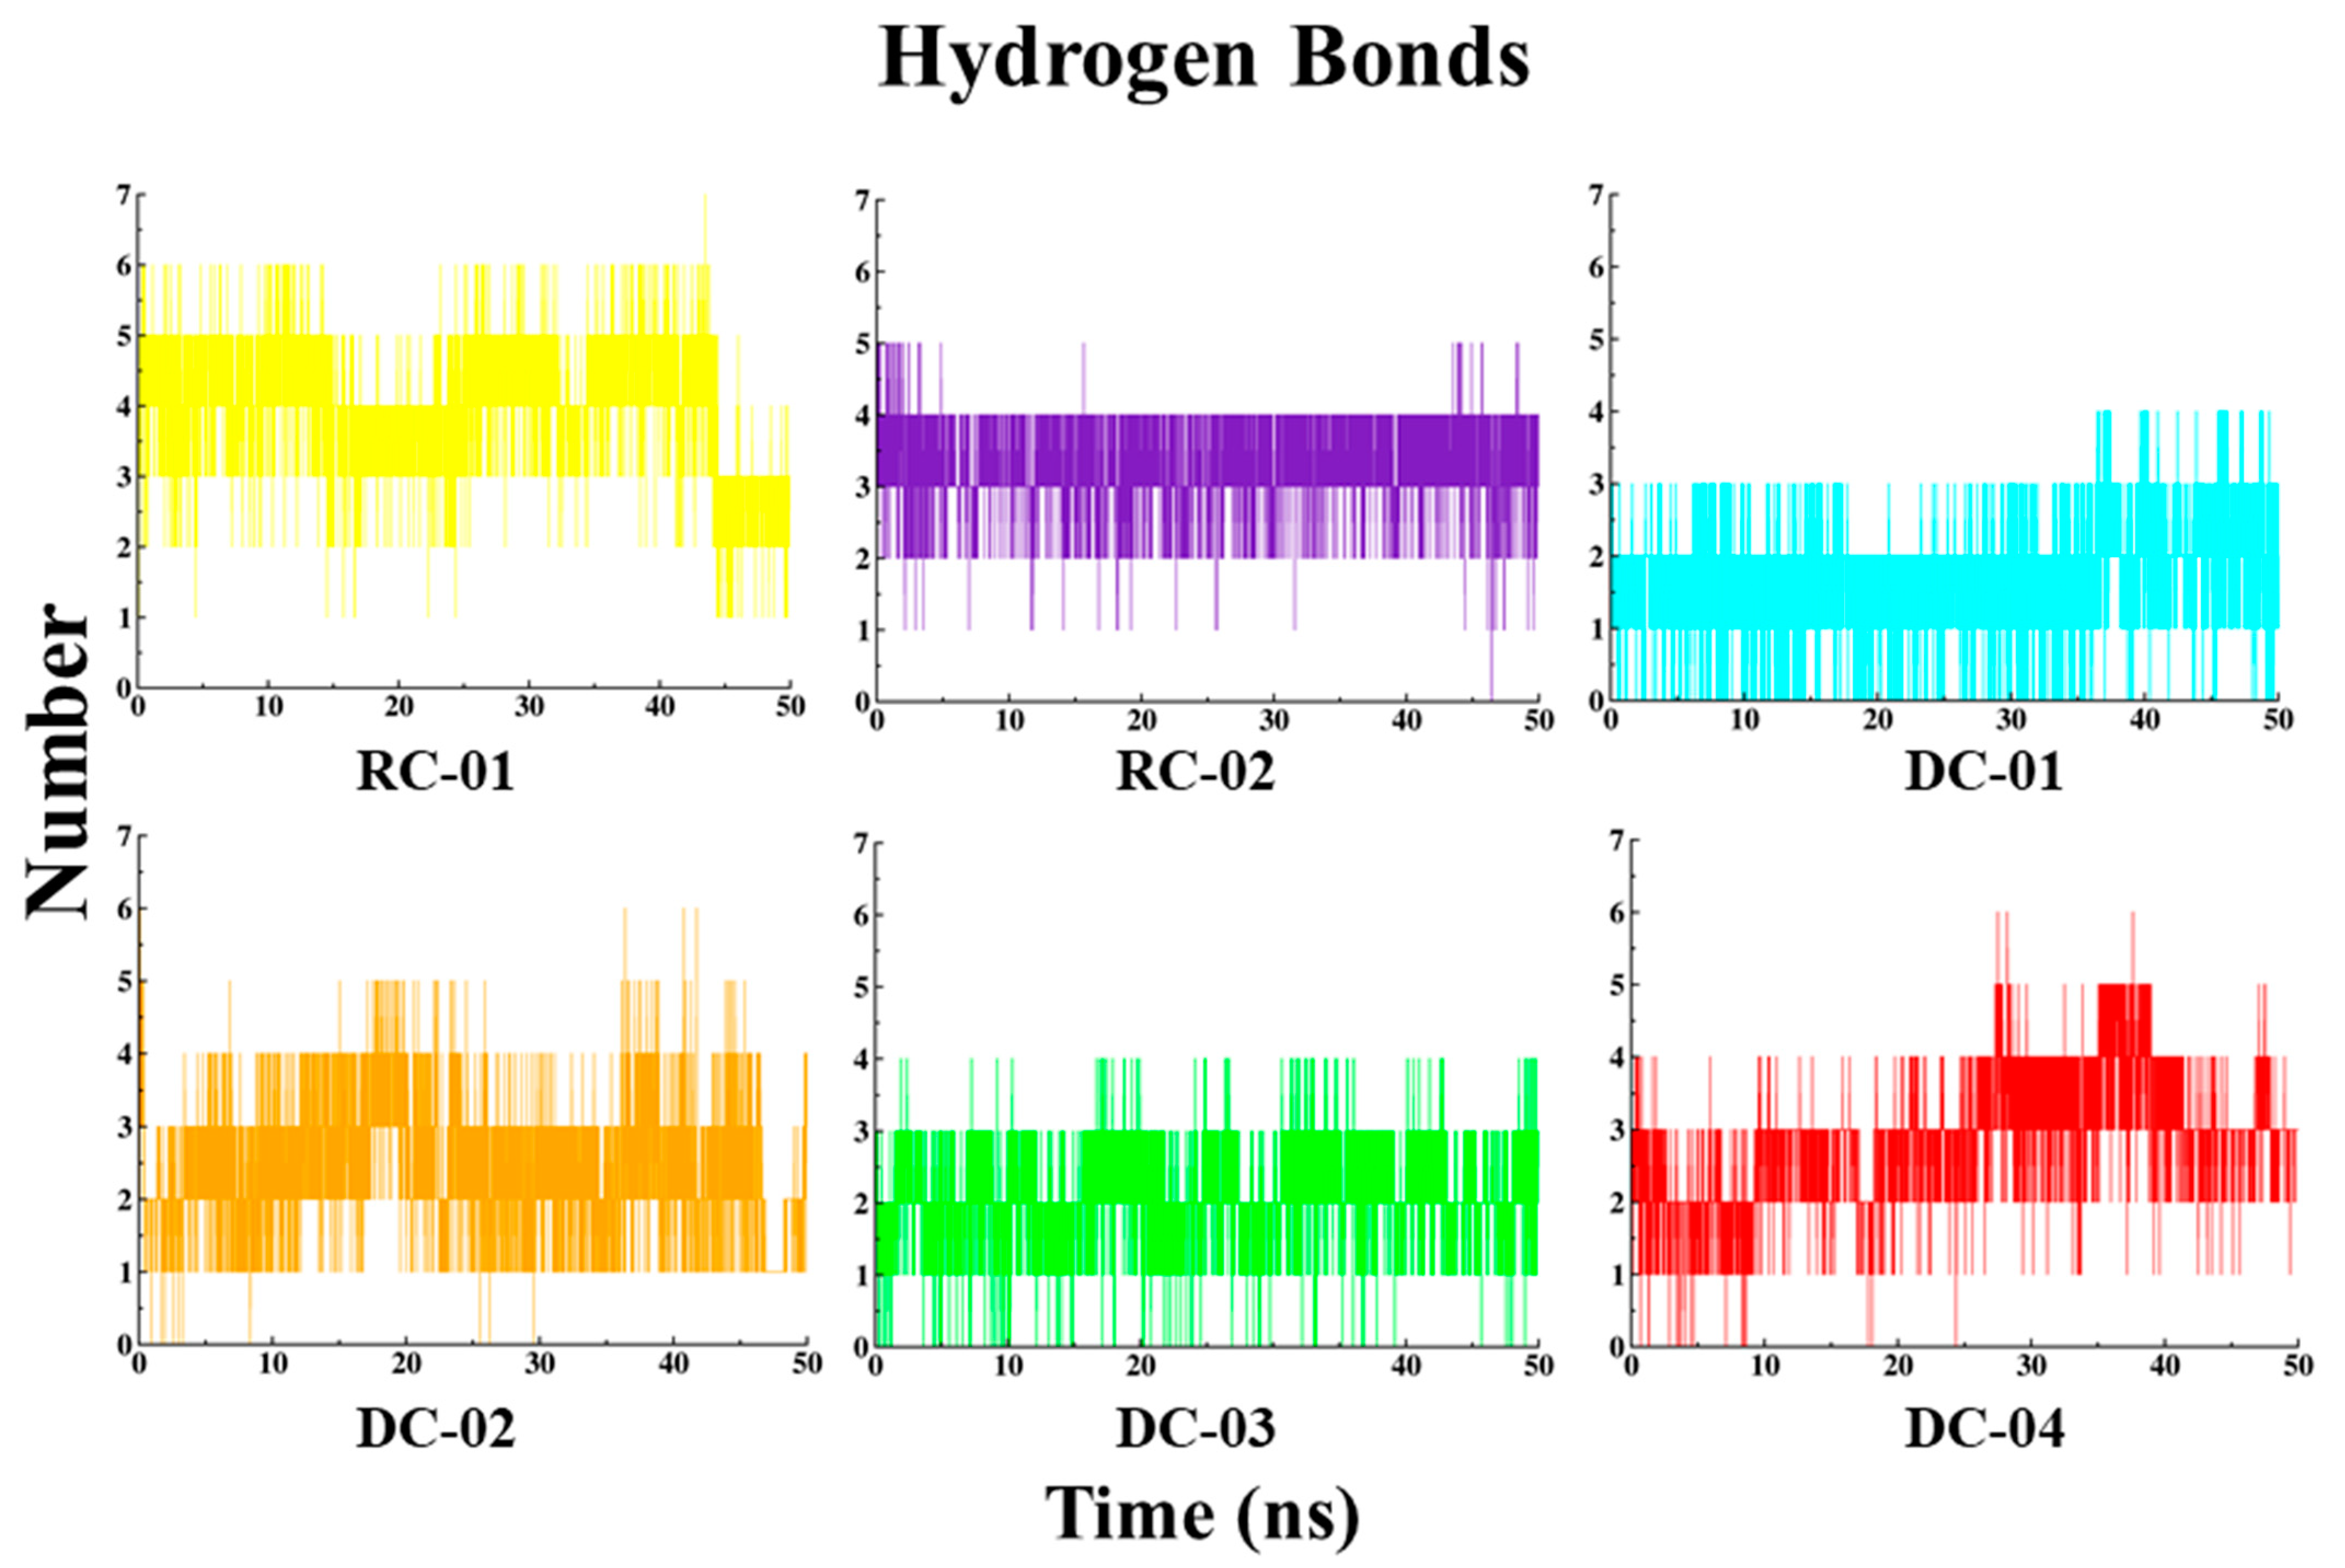
2.3.4. Hydrogen Bond (HB) Interaction
2.4. ADME
3. Conclusions
4. Methodology
4.1. Data Set
4.2. 3D-QSAR
4.3. Molecular Docking
4.4. MD Simulation
4.5. ADME
Supplementary Materials
Author Contributions
Funding
Institutional Review Board Statement
Informed Consent Statement
Data Availability Statement
Acknowledgments
Conflicts of Interest
Sample Availability
References
- Cairns, R.A.; Mak, T.W. Oncogenic isocitrate dehydrogenase mutations: Mechanisms, models, and clinical opportunities. Cancer Discov. 2013, 3, 730–741. [Google Scholar] [CrossRef] [Green Version]
- Judge, A.; Dodd, M.S. Metabolism. Essays Biochem. 2020, 64, 607–647. [Google Scholar] [CrossRef]
- Badur, M.G.; Muthusamy, T.; Parker, S.J.; Ma, S.; McBrayer, S.K.; Cordes, T.; Magana, J.H.; Guan, K.L.; Metallo, C.M. Oncogenic R132 IDH1 Mutations Limit NADPH for De Novo Lipogenesis through (D)2-Hydroxyglutarate Production in Fibrosarcoma Sells. Cell Rep. 2018, 25, 1018–1026.e4. [Google Scholar] [CrossRef] [Green Version]
- Xiong, Y.; Xu, W.; Yang, H.; Wang, P.; Ma, S.; Zhao, S.; Ye, D.; Guan, K. The mechanisms of oncometabolites in epigenetic control, DNA repair, neural development and gliomagenesis. Neurol. Oncol. 2017, 19 (Suppl. S3), iii68. [Google Scholar] [CrossRef] [Green Version]
- Thamim, M.; Thirumoorthy, K. Computational studies of selective N-methylation in nicotinamide: Epigenetic reprogramming in cancer. Comput. Theor. Chem. 2021, 1194, 113058. [Google Scholar] [CrossRef]
- Oermann, E.K.; Wu, J.; Guan, K.L.; Xiong, Y. Alterations of metabolic genes and metabolites in cancer. Semin. Cell Dev. Biol. 2012, 23, 370–380. [Google Scholar] [CrossRef] [Green Version]
- Wang, F.; Travins, J.; De La Barre, B.; Penard-Lacronique, V.; Schalm, S.; Hansen, E.; Straley, K.; Kernytsky, A.; Liu, W.; Gliser, C.; et al. IDH mutations and tumorigenicity. Mol. Cancer Ther. 2013, 12 (Suppl. S11), PL02-04. [Google Scholar] [CrossRef]
- Prensner, J.R.; Chinnaiyan, A.M. Metabolism unhinged: IDH mutations in cancer. Nat. Med. 2011, 17, 291–293. [Google Scholar] [CrossRef]
- Al-Khallaf, H. Isocitrate dehydrogenases in physiology and cancer: Biochemical and molecular insight. Cell Biosci. 2017, 7, 37. [Google Scholar] [CrossRef]
- Mirchia, K.; Richardson, T.E. Beyond IDH-mutation: Emerging molecular diagnostic and prognostic features in adult diffuse gliomas. Cancers 2020, 12, 1817. [Google Scholar] [CrossRef]
- Faiyaz-Ul-Haque, M.; Al-Sayed, M.D.; Faqeih, E.; Jamil, M.; Saeed, A.; Amoudi, M.S.; Kaya, N.; Abalkhail, H.; Al-Abdullatif, A.; Rashed, M.; et al. Clinical, neuroimaging, and genetic features of L-2-hydroxyglutaric aciduria in Arab kindreds. Ann. Saudi Med. 2014, 34, 107–114. [Google Scholar] [CrossRef] [PubMed]
- Chen, J.Y.; Lai, Y.S.; Tsai, H.J.; Kuo, C.C.; Yen, B.L.; Yeh, S.P.; Sun, H.S.; Hung, W.C. The oncometabolite R-2-hydroxyglutarate activates NF-κB-dependent tumor-promoting stromal niche for acute myeloid leukemia cells. Sci. Rep. 2016, 6, 32428. [Google Scholar] [CrossRef] [PubMed] [Green Version]
- Mullarky, E.; Mattaini, K.R.; Vander Heiden, M.G.; Cantley, L.C.; Locasale, J.W. PHGDH amplification and altered glucose metabolism in human melanoma. Pigment Cell Melanoma Res. 2011, 24, 1112–1115. [Google Scholar] [CrossRef] [PubMed]
- Molenaar, R.J.; Radivoyevitch, T.; Maciejewski, J.P.; van Noorden, C.J.F.; Bleeker, F.E. The driver and passenger effects of isocitrate dehydrogenase 1 and 2 mutations in oncogenesis and survival prolongation. Biochim. Biophys. Acta Rev. Cancer 2014, 1846, 326–341. [Google Scholar] [CrossRef]
- Qiu, Z.J.; Lin, A.P.; Jiang, S.; Elkashef, S.M.; Myers, J.; Srikantan, S.; Sasi, B.; Cao, J.Z.; Godley, L.A.; Rakheja, D.; et al. MYC Regulation of D2HGDH and L2HGDH Influences the Epigenome and Epitranscriptome. Cell Chem. Biol. 2020, 27, 538–550.e7. [Google Scholar] [CrossRef]
- Mohammad, N.; Wong, D.; Lum, A.; Lin, J.; Ho, J.; Lee, C.-H.; Yip, S. Characterisation of isocitrate dehydrogenase 1/isocitrate dehydrogenase 2 gene mutation and the d-2-hydroxyglutarate oncometabolite level in dedifferentiated chondrosarcoma. Histopathology 2020, 76, 722–730. [Google Scholar] [CrossRef]
- Ghiam, A.F.; Cairns, R.A.; Thoms, J.; Dal Pra, A.; Ahmed, O.; Meng, A.; Mak, T.W.; Bristow, R.G. IDH mutation status in prostate cancer. Oncogene 2012, 31, 3826. [Google Scholar] [CrossRef] [Green Version]
- Cohen, A.L.; Holmen, S.L.; Colman, H. IDH1 and IDH2 mutations in gliomas. Curr. Neurol. Neurosci. Rep. 2013, 13, 345. [Google Scholar] [CrossRef] [Green Version]
- Matteo, D.A.; Grunseth, A.J.; Gonzalez, E.R.; Anselmo, S.L.; Kennedy, M.A.; Moman, P.; Scott, D.A.; Hoang, A.; Sohl, C.D. Molecular mechanisms of isocitrate dehydrogenase 1 (IDH1) mutations identified in tumors: The role of size and hydrophobicity at residue 132 on catalytic efficiency. J. Biol. Chem. 2017, 292, 7971–7983. [Google Scholar] [CrossRef] [Green Version]
- Horbinski, C. What do we know about IDH1/2 mutations so far, and how do we use it? Acta Neuropathol. 2013, 125, 621–636. [Google Scholar] [CrossRef] [Green Version]
- Guo, C.; Pirozzi, C.J.; Lopez, G.Y.; Yan, H. Isocitrate dehydrogenase mutations in gliomas: Mechanisms, biomarkers and therapeutic target. Curr. Opin. Neurol. 2011, 24, 648–652. [Google Scholar] [CrossRef]
- Sasaki, M.; Knobbe, C.B.; Itsumi, M.; Elia, A.J.; Harris, I.S.; Chio, I.I.C.; Cairns, R.A.; Mccracken, S.; Wakeham, A.; Haight, J.; et al. D-2-hydroxyglutarate produced by mutant Idh1 perturbs collagen maturation and basement membrane function. Genes Dev. 2012, 26, 2038–2049. [Google Scholar] [CrossRef] [Green Version]
- Waitkus, M.S.; Diplas, B.H.; Yan, H. Isocitrate dehydrogenase mutations in gliomas. Neurol. Oncol. 2016, 18, 16–26. [Google Scholar] [CrossRef] [Green Version]
- Thamim, M.; Thirumoorthy, K. Chiral discrimination in a mutated IDH enzymatic reaction in cancer: A computational perspective. Eur. Biophys. J. 2020, 49, 549–559. [Google Scholar] [CrossRef]
- Krell, D.; Mulholland, P.; Frampton, A.E.; Krell, J.; Stebbing, J.; Bardella, C. IDH mutations in tumorigenesis and their potential role as novel therapeutic targets. Future Oncol. 2013, 9, 1923–1935. [Google Scholar] [CrossRef] [Green Version]
- Virani, S.; Virani, S.; Colacino, J.A.; Kim, J.H.; Rozek, L.S. Cancer epigenetics: A brief review. ILAR J. 2012, 53, 359–369. [Google Scholar] [CrossRef] [Green Version]
- Popovici-Muller, J.; Lemieux, R.M.; Artin, E.; Saunders, J.O.; Salituro, F.G.; Travins, J.; Cianchetta, G.; Cai, Z.; Zhou, D.; Cui, D.; et al. Discovery of AG-120 (Ivosidenib): A first-in-class mutant IDH1 inhibitor for the treatment of IDH1 mutant cancers. ACS Med. Chem. Lett. 2018, 9, 300–305. [Google Scholar] [CrossRef] [Green Version]
- DiNardo, C.D.; Hochhaus, A.; Frattini, M.G.; Yee, K.; Zander, T.; Krämer, A.; Chen, X.; Ji, Y.; Parikh, N.S.; Choi, J.; et al. A phase 1 study of IDH305 in patients with IDH1(R132)-mutant acute myeloid leukemia or myelodysplastic syndrome. J. Cancer Res. Clin. Oncol. 2022. [Google Scholar] [CrossRef]
- Yao, K.; Liu, P.; Liu, H.; Wei, Q.; Yang, J.; Cao, P.; Lai, Y. 3D-QSAR, molecular docking and molecular dynamics simulations study of 3-pyrimidin-4-yl-oxazolidin-2-one derivatives to explore the structure requirements of mutant IDH1 inhibitors. J. Mol. Struct. 2019, 1189, 187–202. [Google Scholar] [CrossRef]
- Ma, Y.-S.; Xin, R.; Yang, X.-L.; Shi, Y.; Zhang, D.-D.; Wang, H.-M.; Wang, P.-Y.; Liu, J.-B.; Chu, K.-J.; Fu, D. Paving the way for small-molecule drug discovery. Am. J. Transl. Res. 2021, 13, 853–870. [Google Scholar]
- Guha, R. On exploring structure-activity relationships. Methods Mol. Biol. 2013, 993, 81–94. [Google Scholar] [CrossRef] [Green Version]
- Zheng, Q.; Chen, Z.; Wan, H.; Tang, S.; Ye, Y.; Xu, Y.; Jiang, L.; Ding, J.; Geng, M.; Huang, M.; et al. Discovery and structure-activity-relationship study of novel imidazole cyclopropyl amine analogues for mutant isocitric dehydrogenase 1 (IDH1) inhibitors. Bioorganic Med. Chem. Lett. 2018, 28, 3808–3812. [Google Scholar] [CrossRef]
- Cao, H.; Zhu, G.; Sun, L.; Chen, G.; Ma, X.; Luo, X.; Zhu, J. Discovery of new small molecule inhibitors targeting isocitrate dehydrogenase 1 (IDH1) with blood-brain barrier penetration. Eur. J. Med. Chem. 2019, 183, 111694. [Google Scholar] [CrossRef]
- Zhao, Q.; Manning, J.R.; Sutton, J.; Costales, A.; Sendzik, M.; Shafer, C.M.; Levell, J.R.; Liu, G.; Caferro, T.; Cho, Y.S.; et al. Optimization of 3-Pyrimidin-4-yl-oxazolidin-2-ones as Orally Bioavailable and Brain Penetrant Mutant IDH1 Inhibitors. ACS Med. Chem. Lett. 2018, 9, 746–751. [Google Scholar] [CrossRef]
- Ou-Yang, S.; Lu, J.; Kong, X.; Liang, Z.; Luo, C.; Jiang, H. Computational drug discovery. Acta Pharmacol. Sin. 2012, 33, 1131–1140. [Google Scholar] [CrossRef] [Green Version]
- Verma, J.; Khedkar, V.M.; Coutinho, E.C. 3D-QSAR in drug design-a review. Curr. Top. Med. Chem. 2010, 10, 95–115. [Google Scholar] [CrossRef]
- Perkins, R.; Fang, H.; Tong, W.; Welsh, W.J. Quantitative structure-activity relationship methods: Perspectives on drug discovery and toxicology. Environ. Toxicol. Chem. An Int. J. 2003, 22, 1666–1679. [Google Scholar] [CrossRef]
- Ferreira, L.G.; Dos Santos, R.N.; Oliva, G.; Andricopulo, A.D. Molecular docking and structure-based drug design strategies. Molecules 2015, 20, 13384–13421. [Google Scholar] [CrossRef] [Green Version]
- De Vivo, M.; Masetti, M.; Bottegoni, G.; Cavalli, A. Role of molecular dynamics and related methods in drug discovery. J. Med. Chem. 2016, 59, 4035–4061. [Google Scholar] [CrossRef]
- Krämer, S.D.; Wunderli-Allenspach, H. Physicochemical properties in pharmacokinetic lead optimization. Farmaco 2001, 56, 145–148. [Google Scholar] [CrossRef]
- Gupta, P.; Sharma, A.; Garg, P.; Roy, N. QSAR study of curcumine derivatives as HIV-1 integrase inhibitors. Curr. Comput. Aided. Drug Des. 2013, 9, 141–150. [Google Scholar] [CrossRef]
- Schrödinger LCC. Schrödinger Release 2022-3: Field-based QSAR; Schrödinger LLC: New York, NY, USA, 2021; Available online: https://www.schrodinger.com/products/field-based-qsar (accessed on 27 September 2022).
- Alexander, D.L.J.; Tropsha, A.; Winkler, D.A. Beware of R 2: Simple, unambiguous assessment of the prediction accuracy of QSAR and QSPR models. J. Chem. Inf. Model. 2015, 55, 1316–1322. [Google Scholar] [CrossRef] [Green Version]
- Bajusz, D.; Rácz, A.; Héberger, K. Why is Tanimoto index an appropriate choice for fingerprint-based similarity calculations? J. Cheminform. 2015, 7, 20. [Google Scholar] [CrossRef] [Green Version]
- Duan, J.; Dixon, S.L.; Lowrie, J.F.; Sherman, W. Analysis and comparison of 2D fingerprints: Insights into database screening performance using eight fingerprint methods. J. Mol. Graph. Model. 2010, 29, 157–170. [Google Scholar] [CrossRef]
- Salam, N.K.; Nuti, R.; Sherman, W. Novel method for generating structure-based pharmacophores using energetic analysis. J. Chem. Inf. Model. 2009, 49, 2356–2368. [Google Scholar] [CrossRef]
- Pinzi, L.; Rastelli, G. Molecular docking: Shifting paradigms in drug discovery. Int. J. Mol. Sci. 2019, 20, 4331. [Google Scholar] [CrossRef] [Green Version]
- Schrödinger LLC. Schrödinger Release 2022-3: LigPrep; Schrödinger LLC: New York, NY, USA, 2021; Available online: https://www.schrodinger.com/products/ligprep (accessed on 27 September 2022).
- Friesner, R.A.; Banks, J.L.; Murphy, R.B.; Halgren, T.A.; Klicic, J.J.; Mainz, D.T.; Repasky, M.P.; Knoll, E.H.; Shelley, M.; Perry, J.K.; et al. Glide: A new approach for rapid, accurate docking and scoring. 1. Method and assessment of docking accuracy. J. Med. Chem. 2004, 47, 1739–1749. [Google Scholar] [CrossRef]
- Hollingsworth, S.A.; Dror, R.O. Molecular Dynamics Simulation for All. Neuron 2018, 99, 1129–1143. [Google Scholar] [CrossRef] [Green Version]
- Abraham, M.J.; Murtola, T.; Schulz, R.; Páll, S.; Smith, J.C.; Hess, B.; Lindahl, E. GROMACS: High performance molecular simulations through multi-level parallelism from laptops to supercomputers. SoftwareX 2015, 1, 19–25. [Google Scholar] [CrossRef] [Green Version]
- Hadni, H.; Elhallaoui, M. 3D-QSAR, docking and ADMET properties of aurone analogues as antimalarial agents. Heliyon 2020, 6, e03580. [Google Scholar] [CrossRef]
- Daina, A.; Michielin, O.; Zoete, V. SwissADME: A free web tool to evaluate pharmacokinetics, drug-likeness and medicinal chemistry friendliness of small molecules. Sci. Rep. 2017, 7, 42717. [Google Scholar] [CrossRef] [PubMed] [Green Version]
- Lipinski, C.A.; Lombardo, F.; Dominy, B.W.; Feeney, P.J. Experimental and computational approaches to estimate solubility and permeability in drug discovery and development settings. Adv. Drug Deliv. Rev. 2012, 64, 4–17. [Google Scholar] [CrossRef]
- Cassidy, J.; Newell, D.R.; Wedge, S.R.; Cummings, J. Pharmacokinetics of high molecular weight agents. Cancer Surv. 1993, 17, 315–341. [Google Scholar] [PubMed]
- Schrödinger LLC. Schrödinger Release 2022-3: Maestro; Schrödinger LLC: New York, NY, USA, 2021; Available online: https://www.schrodinger.com/products/maestro (accessed on 27 September 2022).
- Banks, J.L.; Beard, H.S.; Cao, Y.; Cho, A.E.; Damm, W.; Farid, R.; Felts, A.K.; Halgren, T.A.; Mainz, D.T.; Maple, J.R.; et al. Integrated modeling program, applied chemical theory (IMPACT). J. Comput. Chem. 2005, 26, 1752–1780. [Google Scholar] [CrossRef] [PubMed] [Green Version]
- Madhavi Sastry, G.; Adzhigirey, M.; Day, T.; Annabhimoju, R.; Sherman, W. Protein and ligand preparation: Parameters, protocols, and influence on virtual screening enrichments. J. Comput. Aided. Mol. Des. 2013, 27, 221–234. [Google Scholar] [CrossRef]
- Shelley, J.C.; Cholleti, A.; Frye, L.L.; Greenwood, J.R.; Timlin, M.R.; Uchimaya, M. Epik: A software program for pK a prediction and protonation state generation for drug-like molecules. J. Comput. Aided. Mol. Des. 2007, 21, 681–691. [Google Scholar] [CrossRef]
- Jacobson, M.P.; Pincus, D.L.; Rapp, C.S.; Day, T.J.F.; Honig, B.; Shaw, D.E.; Friesner, R.A. A hierarchical approach to all-atom protein loop prediction. Proteins Struct. Funct. Bioinform. 2004, 55, 351–367. [Google Scholar] [CrossRef] [Green Version]
- Lu, C.; Wu, C.; Ghoreishi, D.; Chen, W.; Wang, L.; Damm, W.; Ross, G.A.; Dahlgren, M.K.; Russell, E.; Von Bargen, C.D.; et al. OPLS4: Improving force field accuracy on challenging regimes of chemical space. J. Chem. Theory Comput. 2021, 17, 4291–4300. [Google Scholar] [CrossRef]
- BIOVIA Discovery Studio. Biovia Discovery Studio 2021 Client; Dassault Systèmes: San Diego, CA, USA, 2021. [Google Scholar]
- Gutiérrez, I.S.; Lin, F.-Y.; Vanommeslaeghe, K.; Lemkul, J.A.; Armacost, K.A.; Brooks III, C.L.; MacKerell, A.D., Jr. Parametrization of halogen bonds in the CHARMM general force field: Improved treatment of ligand--protein interactions. Bioorganic Med. Chem. 2016, 24, 4812–4825. [Google Scholar] [CrossRef] [Green Version]
- Zoete, V.; Cuendet, M.A.; Grosdidier, A.; Michielin, O. SwissParam: A fast force field generation tool for small 150 organic molecules. J. Comput. Chem 2011, 32, 2359–2368. [Google Scholar] [CrossRef]
- Jorgensen, W.L.; Chandrasekhar, J.; Madura, J.D.; Impey, R.W.; Klein, M.L. Comparison of simple potential functions for simulating liquid water. J. Chem. Phys. 1983, 79, 926–935. [Google Scholar] [CrossRef]
- Zhurkin, V.B.; Ulyanov, N.B.; Gorin, A.A.; Jernigan, R.L. Static and statistical bending of DNA evaluated by Monte Carlo simulations. Proc. Natl. Acad. Sci. USA 1991, 88, 7046–7050. [Google Scholar] [CrossRef] [Green Version]
- Berendsen, H.J.C.; van Postma, J.P.M.; Van Gunsteren, W.F.; DiNola, A.; Haak, J.R. Molecular dynamics with coupling to an external bath. J. Chem. Phys. 1984, 81, 3684–3690. [Google Scholar] [CrossRef] [Green Version]
- Parrinello, M.; Rahman, A. Polymorphic transitions in single crystals: A new molecular dynamics method. J. Appl. Phys. 1981, 52, 7182–7190. [Google Scholar] [CrossRef]
- Nosé, S.; Klein, M.L. Constant pressure molecular dynamics for molecular systems. Mol. Phys. 1983, 50, 1055–1076. [Google Scholar] [CrossRef]


| S.NO | Reported Compounds | QSAR Set | Reported Biological Activity | Predicted Biological Activity |
|---|---|---|---|---|
| RC-01 |  | Test | 9.000 | 7.960 |
| RC-02 |  | Training | 8.398 | 8.068 |
| RC-03 |  | Training | 8.678 | 8.208 |
| RC-04 |  | Test | 8.674 | 8.379 |
| RC-05 |  | Training | 8.658 | 8.634 |
| RC-06 |  | Training | 8.638 | 8.113 |
| RC-07 |  | Training | 8.569 | 8.573 |
| RC-08 |  | Test | 8.398 | 7.945 |
| RC-09 |  | Test | 8.301 | 7.414 |
| RC-10 |  | Training | 8.097 | 8.054 |
| RC-11 |  | Training | 7.886 | 8.105 |
| RC-12 |  | Training | 7.824 | 7.850 |
| RC-13 |  | Test | 7.824 | 7.511 |
| RC-14 |  | Test | 7.810 | 8.263 |
| RC-15 |  | Training | 7.735 | 7.873 |
| RC-16 |  | Training | 7.717 | 7.687 |
| RC-17 |  | Training | 7.658 | 8.097 |
| RC-18 |  | Training | 7.623 | 7.902 |
| RC-19 |  | Training | 7.620 | 7.487 |
| RC-20 |  | Test | 7.618 | 7.527 |
| RC-21 |  | Test | 7.602 | 7.205 |
| RC-22 |  | Training | 7.585 | 7.636 |
| RC-23 |  | Training | 7.569 | 7.410 |
| RC-24 |  | Training | 7.523 | 7.335 |
| RC-25 |  | Test | 7.495 | 6.904 |
| RC-26 |  | Training | 7.495 | 7.505 |
| RC-27 |  | Training | 7.476 | 7.554 |
| RC-28 |  | Training | 7.471 | 7.599 |
| RC-29 |  | Training | 7.456 | 7.358 |
| RC-30 |  | Training | 7.444 | 7.325 |
| RC-31 |  | Training | 7.444 | 7.481 |
| RC-32 |  | Training | 7.409 | 7.420 |
| RC-33 |  | Training | 7.398 | 7.231 |
| RC-34 |  | Training | 7.387 | 7.371 |
| RC-35 |  | Training | 7.377 | 7.439 |
| RC-36 |  | Training | 7.377 | 7.248 |
| RC-37 |  | Training | 7.370 | 7.590 |
| RC-38 |  | Training | 7.354 | 7.414 |
| RC-39 |  | Training | 7.328 | 7.366 |
| RC-40 |  | Training | 7.321 | 7.482 |
| RC-41 |  | Training | 7.310 | 7.202 |
| RC-42 |  | Training | 7.294 | 7.447 |
| RC-43 |  | Training | 7.268 | 7.351 |
| RC-44 |  | Test | 7.252 | 7.044 |
| RC-45 |  | Training | 7.208 | 7.281 |
| RC-46 |  | Training | 7.187 | 7.457 |
| RC-47 |  | Training | 7.071 | 6.963 |
| RC-48 |  | Training | 6.951 | 9.967 |
| RC-49 |  | Training | 6.922 | 6.937 |
| RC-50 |  | Training | 6.891 | 6.956 |
| RC-51 |  | Training | 6.818 | 6.872 |
| RC-52 |  | Test | 6.658 | 6.398 |
| RC-53 |  | Test | 6.620 | 8.192 |
| RC-54 |  | Test | 6.602 | 6.843 |
| RC-55 |  | Test | 6.575 | 7.394 |
| RC-56 |  | Training | 6.320 | 6.070 |
| RC-57 |  | Training | 6.252 | 6.442 |
| RC-58 |  | Test | 6.215 | 6.964 |
| RC-59 |  | Training | 6.142 | 6.224 |
| RC-60 |  | Training | 6.086 | 5.996 |
| RC-61 |  | Test | 6.080 | 7.028 |
| RC-62 |  | Test | 5.000 | 5.909 |
| S.NO | Active Ligands | Biological Activity | Docking Score kcal/mol | Glide Score kcal/mol |
|---|---|---|---|---|
| RC-01 |  | 9.000 a | −11.800 | −12.988 |
| RC-02 |  | 8.398 a | −12.403 | −12.497 |
| DC-01 |  | 9.272 b | −13.336 | −13.424 |
| DC-02 |  | 9.180 b | −13.175 | −13.270 |
| DC-03 |  | 9.675 b | −13.159 | −13.256 |
| DC-04 |  | 9.065 b | −13.131 | −13.218 |
| DC-05 |  | 9.154 b | −12.952 | −13.045 |
| S.NO | Active Ligands | Hydrophobic Interactions | Hydrogen Bond Interactions | Total Number of Interactions | |||||
|---|---|---|---|---|---|---|---|---|---|
| alkyl–alkyl and pi–alkyl | pi–pi | pi–sigma | pi–sulfur | Classical | Non-Classical (Carbon–Hydrogen) | Halogen | |||
| 1 | RC-01 | ARG-109, ALA-111, ILE-113, ILE-130, VAL-276, MET-291 | Nil | Nil | Nil | ILE-128, SER-278 | ILE-128 | Nil | 12 |
| 2 | RC-02 | ALA-111, ILE-128, ILE-130, VAL-255, TRP-267 | TRP-124 | Nil | MET-291 | LEU-120, ILE-128 | Nil | Nil | 13 |
| 3 | DC-01 | ALA-111, ILE-117, TRP-124, PRO-127, ILE-128, VAL-255, ALA-258, MET-290, MET-291 | TRP-124, TYR-285 | Nil | Nil | ALA-111, ILE-128 | ALA-111, ILE-112, VAL-255 | CYS-114 | 20 |
| 4 | DC-02 | ALA-111, ILE-113, CYS-114, LEU-120, TRP-124, PRO-127, ILE-128, ILE-130, MET-259, MET-290 | TRP-124, TRP-267, TYR-285 | Nil | Nil | LEU-120, ILE-128, TYR-285 | Nil | Nil | 20 |
| 5 | DC-03 | ARG-109, ALA-111, ILE-117, TRP-124, ILE-128, ILE-130, VAL-281, ALA-282, TYR-285, MET-290, MET-291 | Nil | ALA-111 | MET-291 | ILE-128, SER-287, | ALA-111, ILE-112, SER-278 | Nil | 24 |
| 6 | DC-04 | ARG-109, ALA-111, ILE-113, TRP-124, ILE-128, ILE-130, VAL-255, MET-259 | TRP-124 | ALA-111 | Nil | ALA-111, ILE-112, ILE-128 | ALA-111 | Nil | 18 |
| S.NO | Active Compounds | Lipinski’s Rule of Five | |||||
|---|---|---|---|---|---|---|---|
| PSA Å | MW g/mol | Log P o/w | NRB | HBA | HBD | ||
| 1. | RC-01 | 85.17 | 486.49 | 3.73 | 6 | 8 | 1 |
| 2. | RC-02 | 85.17 | 468.49 | 3.73 | 6 | 8 | 1 |
| 3. | DC-01 | 89.66 | 546.54 | 3.93 | 6 | 9 | 2 |
| 4. | DC-02 | 109.89 | 544.55 | 3.57 | 6 | 9 | 3 |
| 5. | DC-03 | 89.66 | 542.58 | 3.77 | 6 | 8 | 2 |
| 6. | DC-04 | 109.89 | 544.55 | 3.42 | 6 | 9 | 3 |
Disclaimer/Publisher’s Note: The statements, opinions and data contained in all publications are solely those of the individual author(s) and contributor(s) and not of MDPI and/or the editor(s). MDPI and/or the editor(s) disclaim responsibility for any injury to people or property resulting from any ideas, methods, instructions or products referred to in the content. |
© 2023 by the authors. Licensee MDPI, Basel, Switzerland. This article is an open access article distributed under the terms and conditions of the Creative Commons Attribution (CC BY) license (https://creativecommons.org/licenses/by/4.0/).
Share and Cite
Thamim, M.; Agrahari, A.K.; Gupta, P.; Thirumoorthy, K. Rational Computational Approaches in Drug Discovery: Potential Inhibitors for Allosteric Regulation of Mutant Isocitrate Dehydrogenase-1 Enzyme in Cancers. Molecules 2023, 28, 2315. https://doi.org/10.3390/molecules28052315
Thamim M, Agrahari AK, Gupta P, Thirumoorthy K. Rational Computational Approaches in Drug Discovery: Potential Inhibitors for Allosteric Regulation of Mutant Isocitrate Dehydrogenase-1 Enzyme in Cancers. Molecules. 2023; 28(5):2315. https://doi.org/10.3390/molecules28052315
Chicago/Turabian StyleThamim, Masthan, Ashish Kumar Agrahari, Pawan Gupta, and Krishnan Thirumoorthy. 2023. "Rational Computational Approaches in Drug Discovery: Potential Inhibitors for Allosteric Regulation of Mutant Isocitrate Dehydrogenase-1 Enzyme in Cancers" Molecules 28, no. 5: 2315. https://doi.org/10.3390/molecules28052315