


The Phenolic Compounds’ Role in Beer from Various Adjuncts
 , and
, and
Abstract
:1. Introduction
2. Results
2.1. The Determination and Mathematical Analysis of Different Adjuncts on Wort Sample Composition
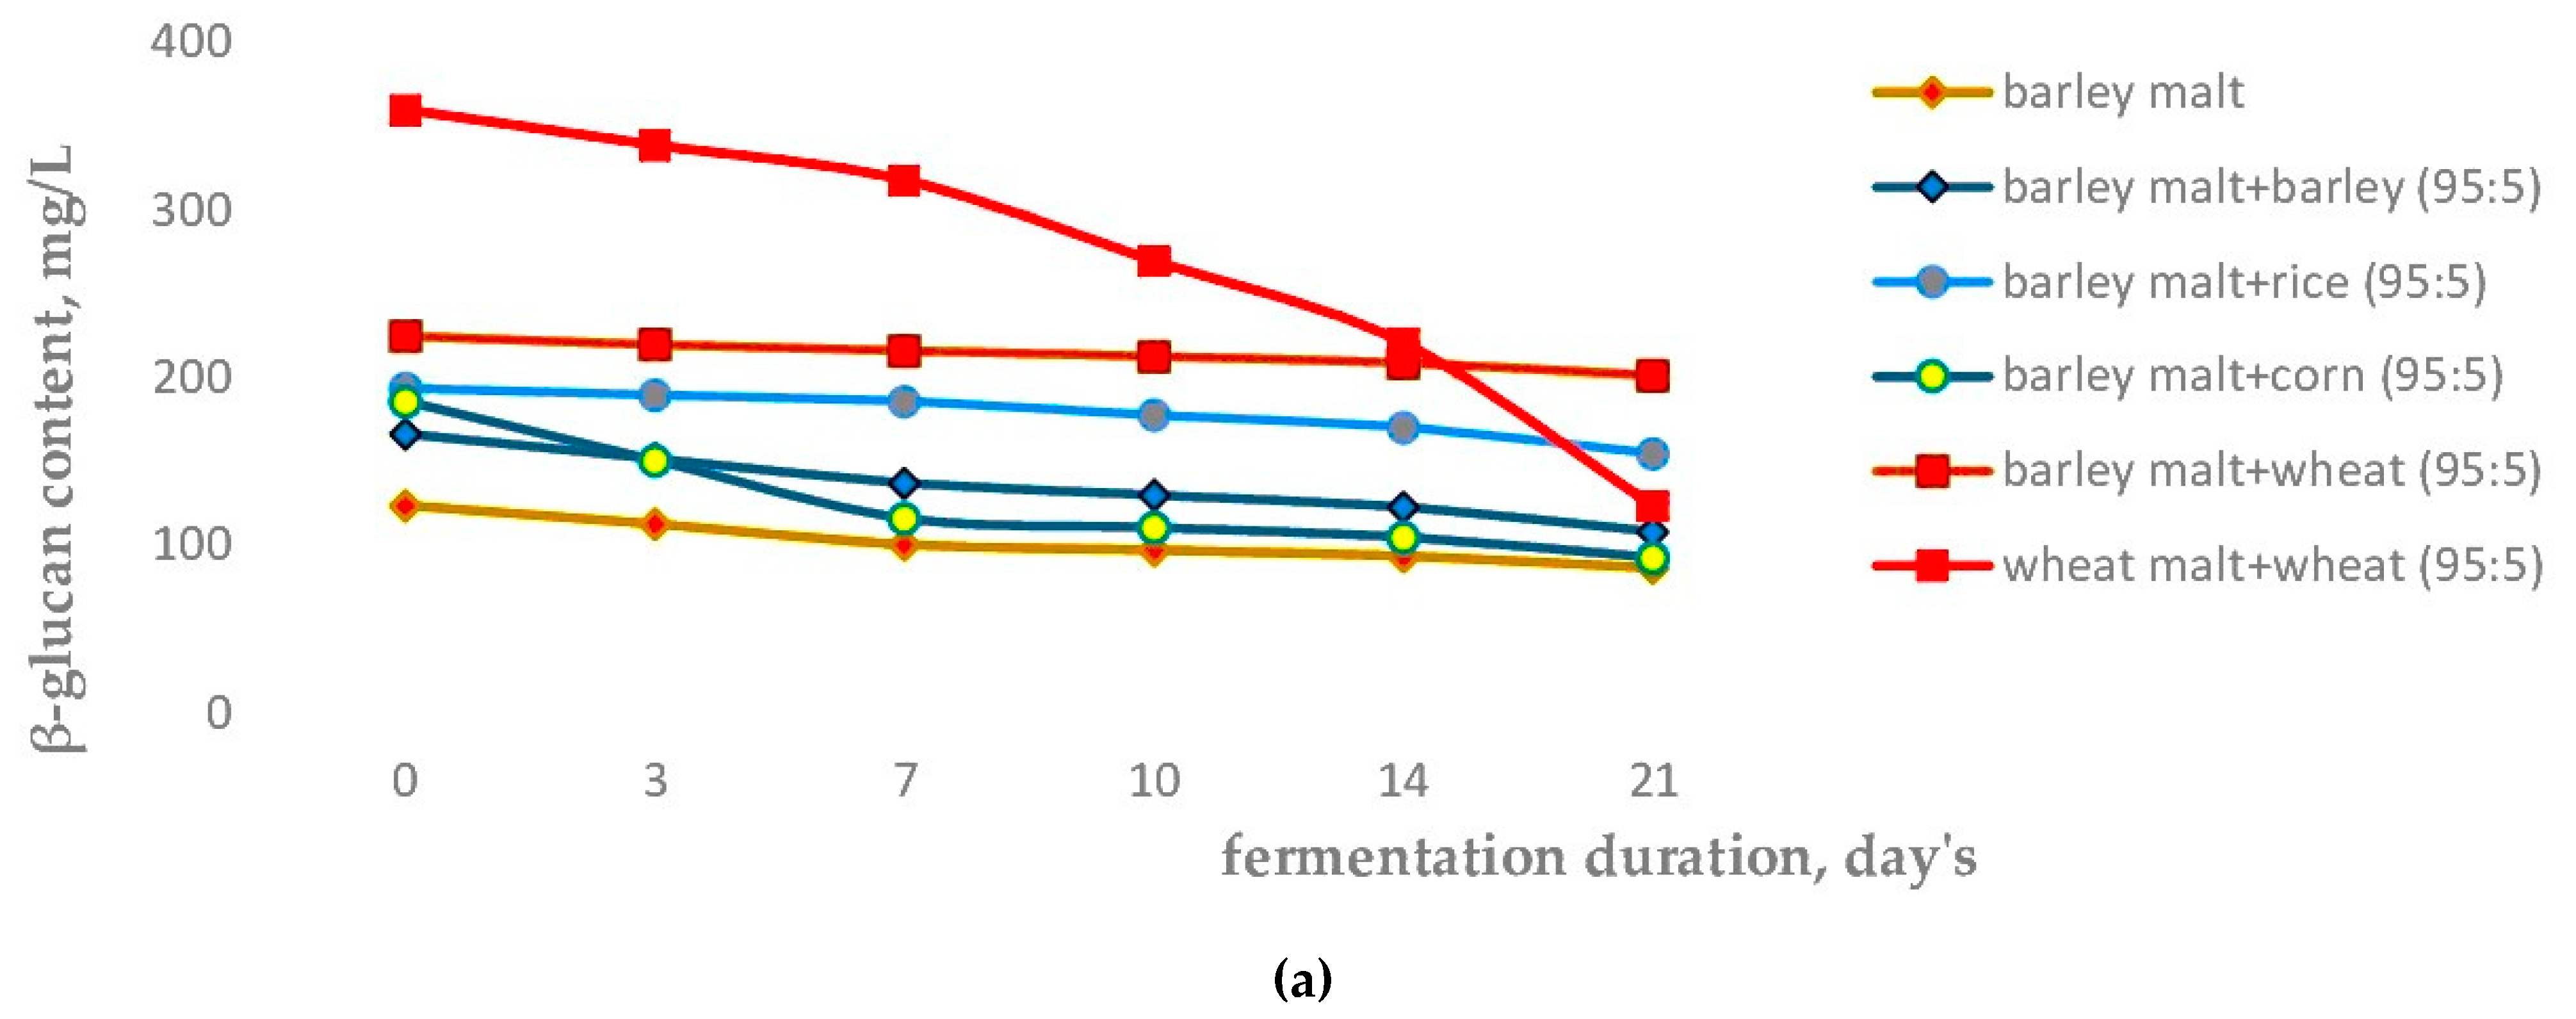
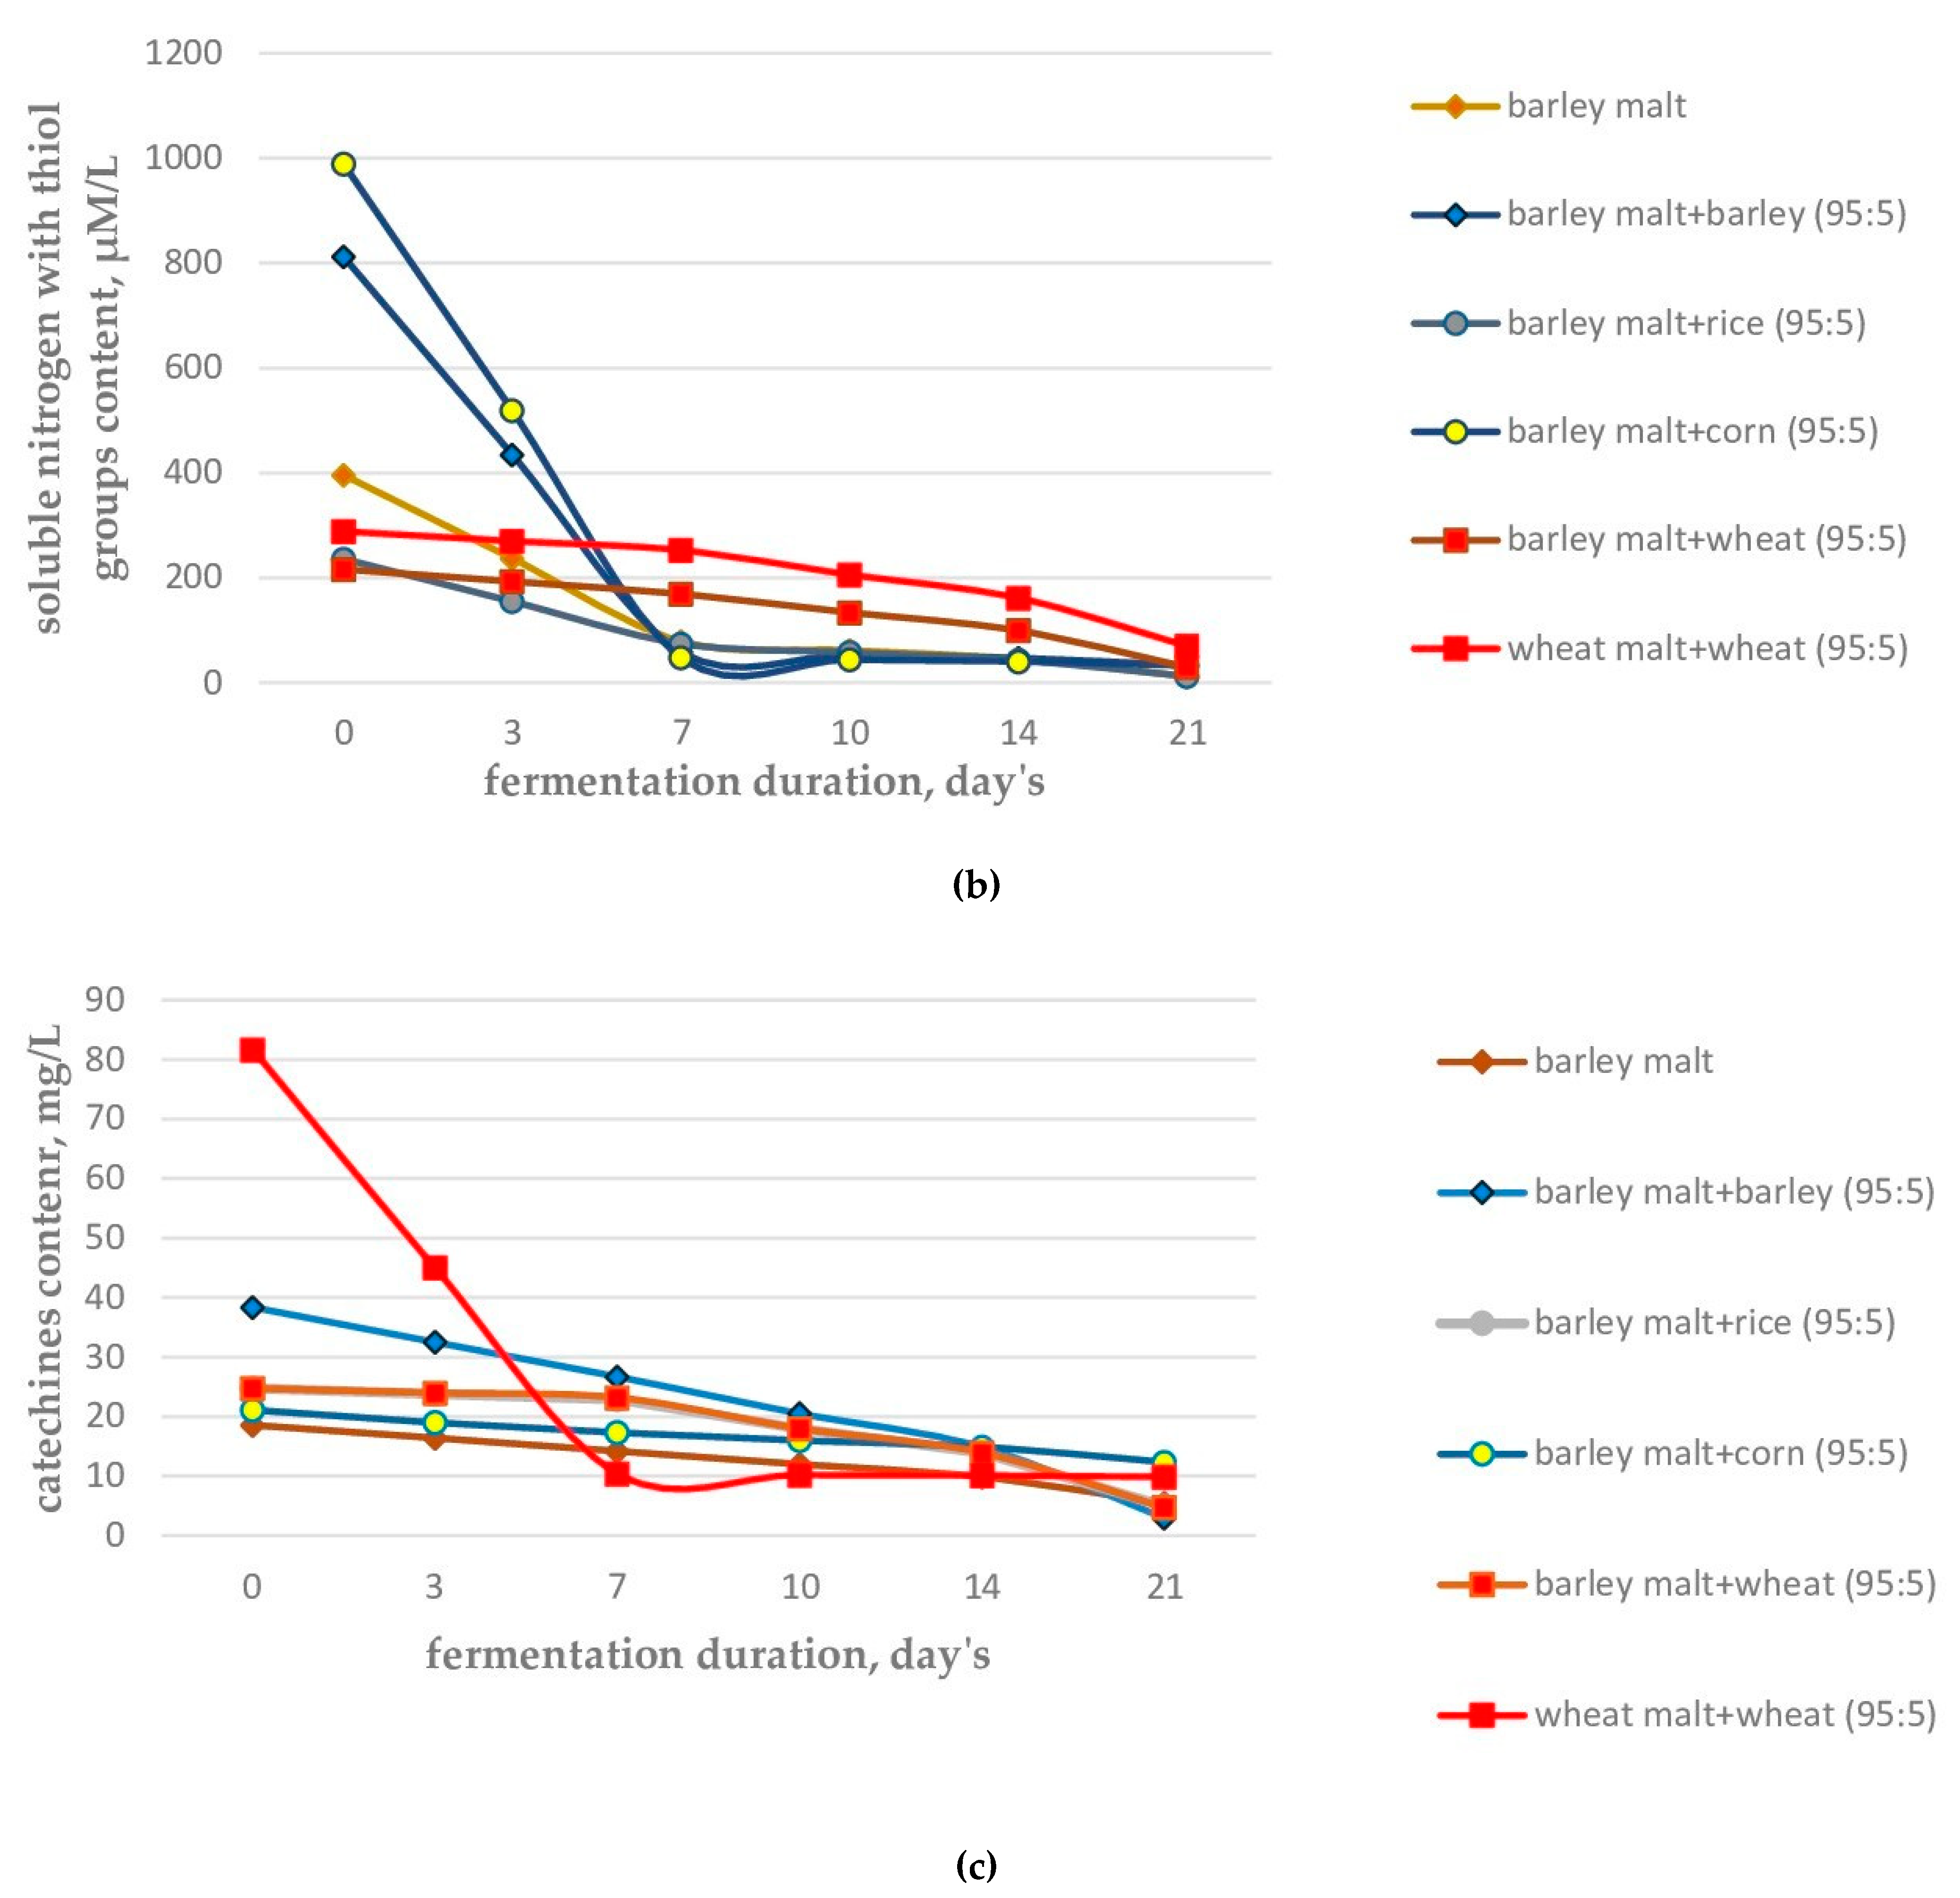
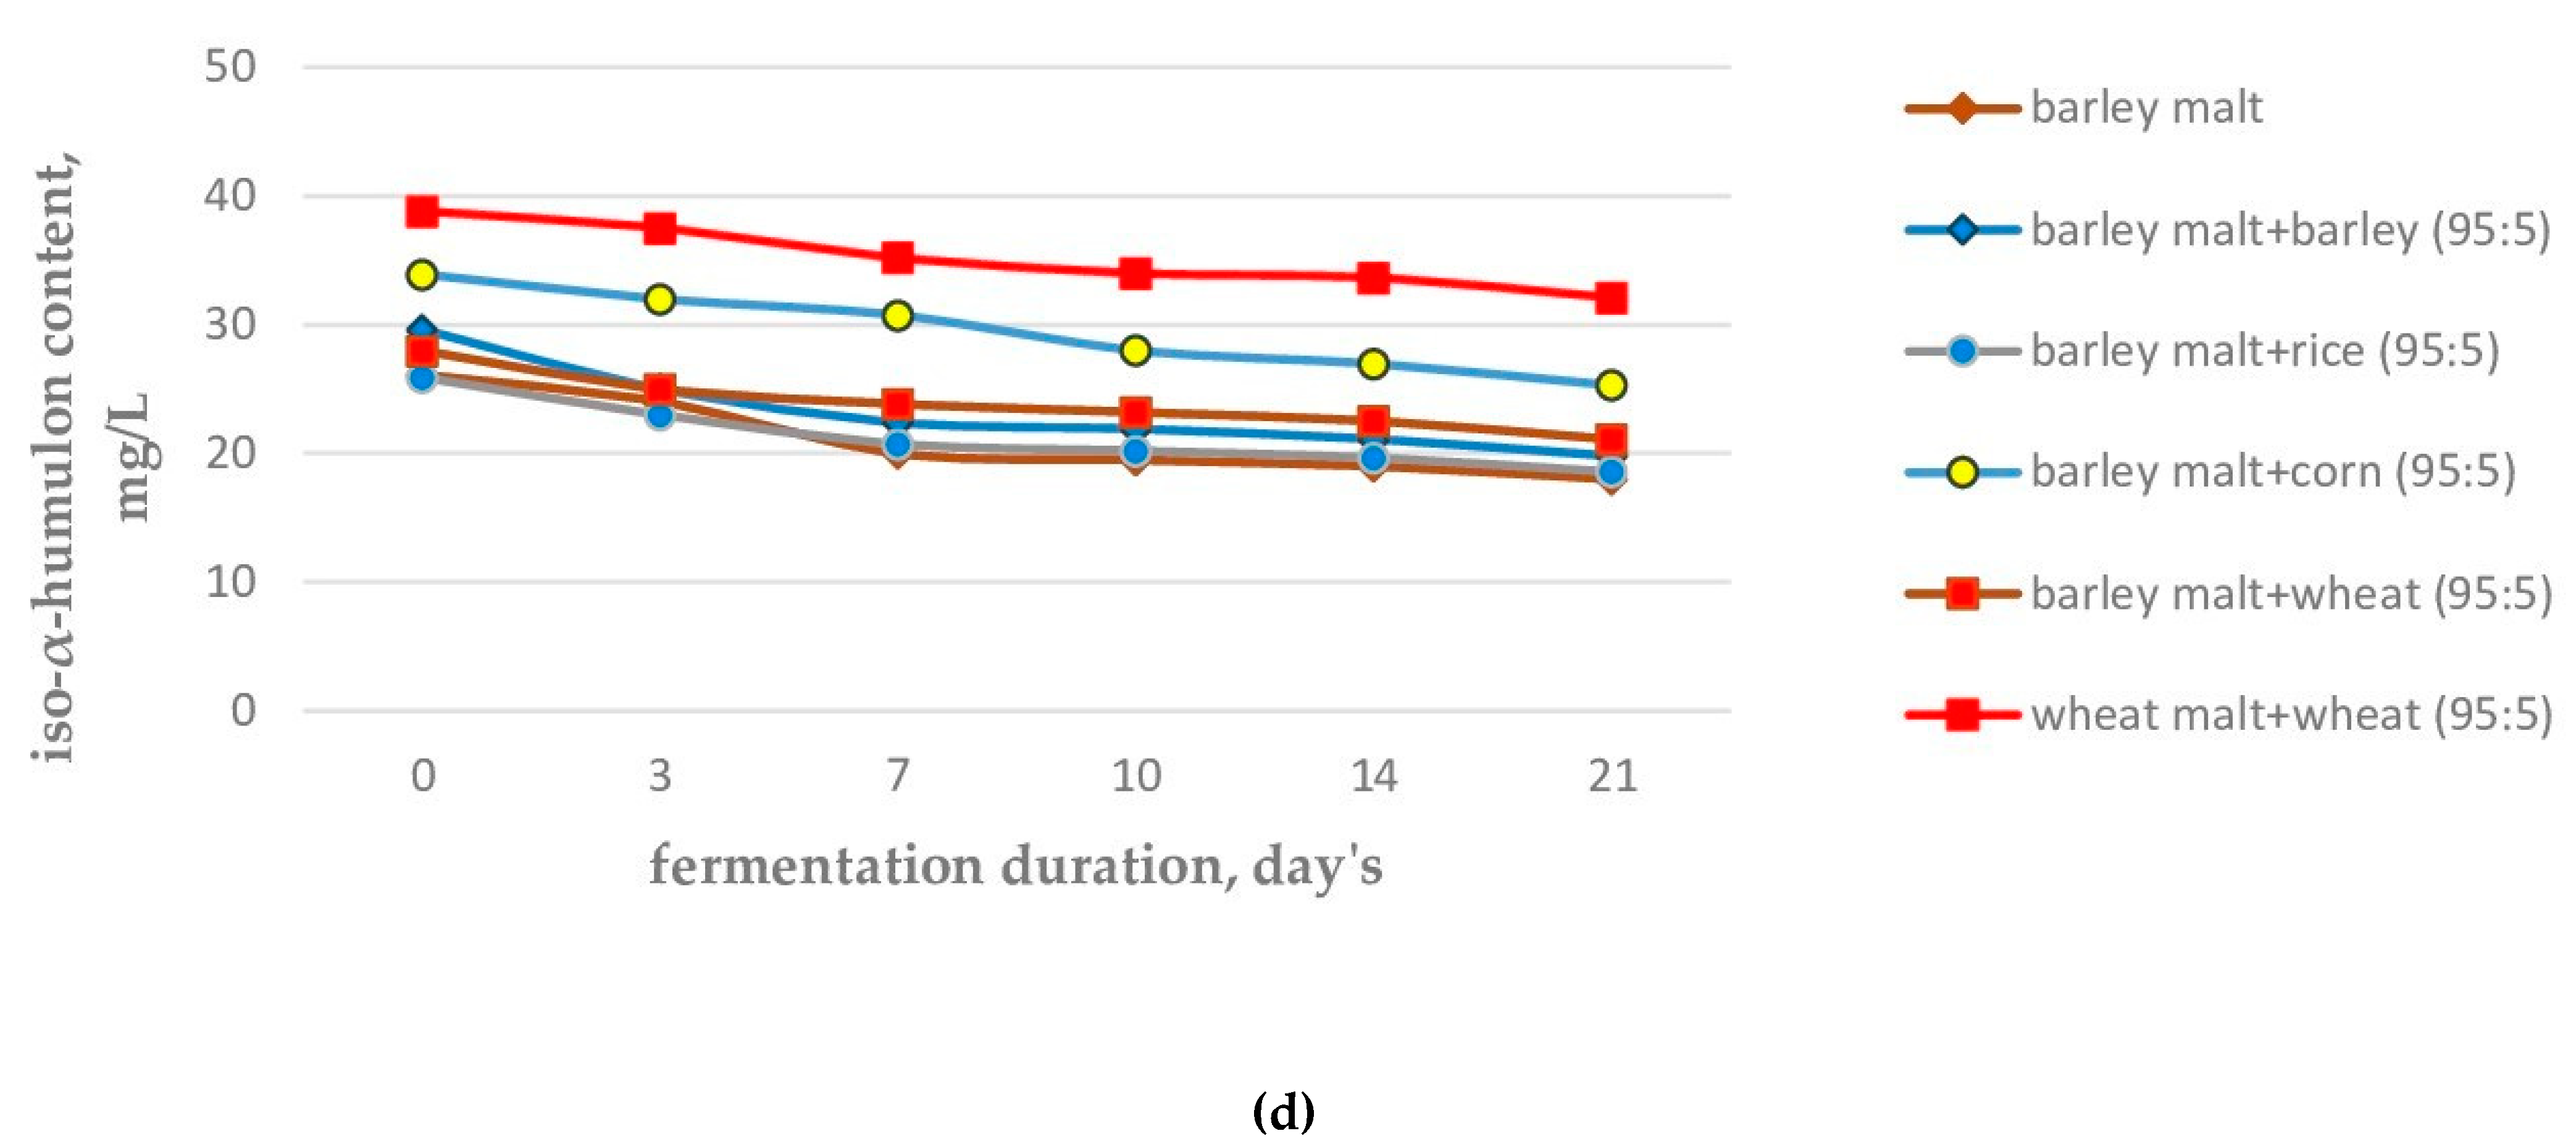
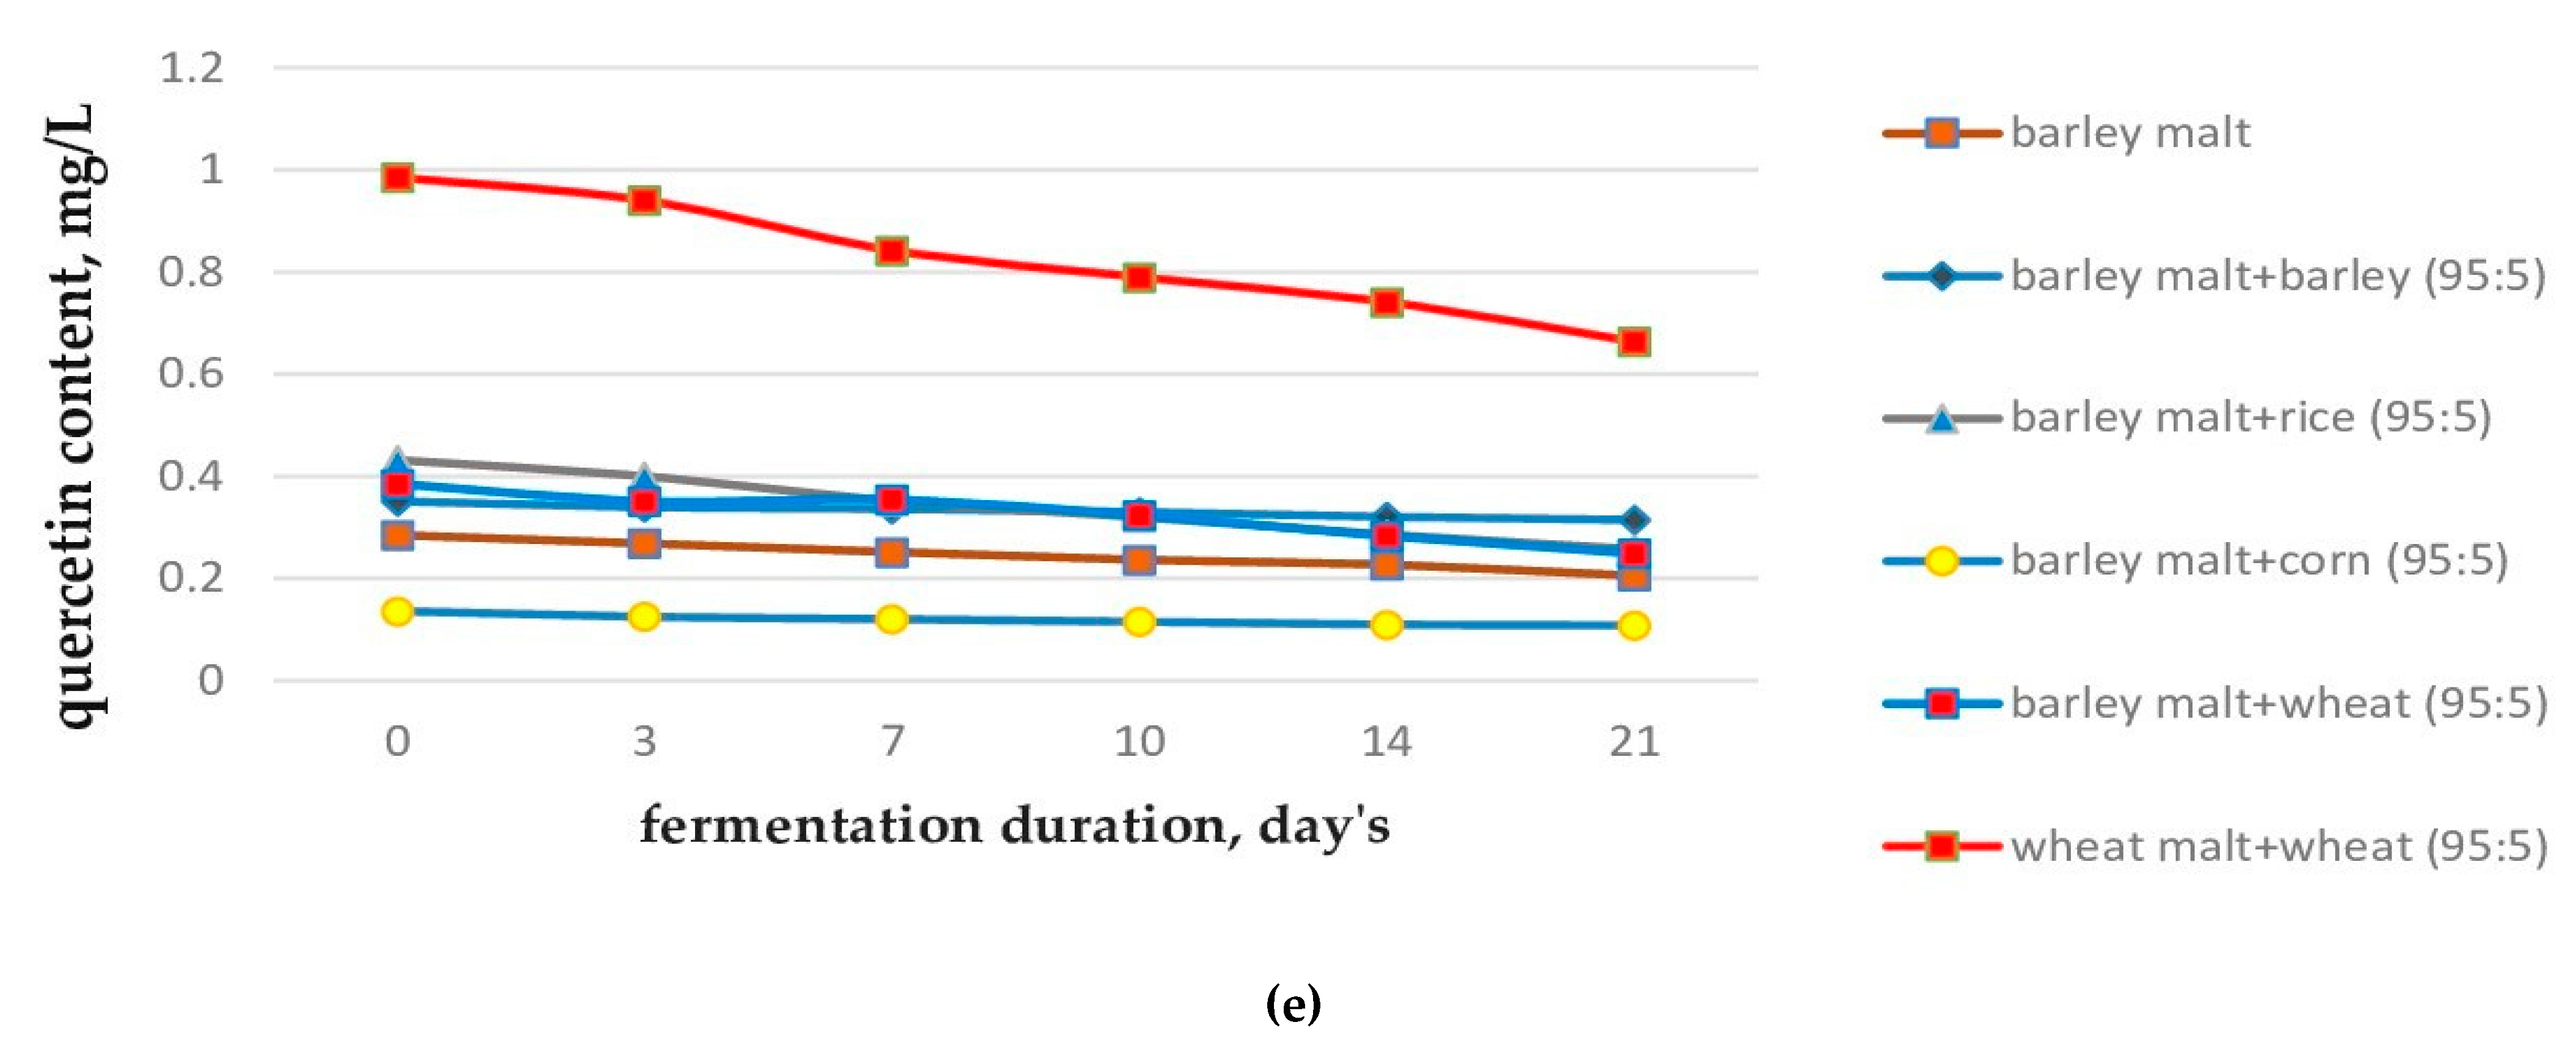
2.2. The Variation of Different Adjuncts on Wort Sample Composition during Brewing
2.3. The Matrix Organic Compounds Influence on Beer’s Descriptor Flavor Formation
3. Discussion
4. Materials and Methods
4.1. The Research Materials
4.2. The Research Methods
4.2.1. Chemicals
4.2.2. Determination of Original Extract and Alcohol Content
4.2.3. Determination of Nitrogen Compounds
4.2.4. Determination of Soluble Nitrogen with Thiol Groups Mass Concentration
4.2.5. Determination of Iso-α-Humulone Mass Concentration
4.2.6. Determination of Catechin Mass Concentration
4.2.7. Determination of Quercetin Mass Concentration
4.2.8. Determination of Isoxanthohumol Mass Concentration
4.2.9. Determination of the Mass Concentration of β-Glucan
4.2.10. Determination of the Beer’s Color
4.2.11. Determination of the Mass Concentration of Riboflavin
4.2.12. Determination of the Mass Concentration of Melanoidins
4.2.13. Organoleptic Evaluation of Beer Samples by Descriptors
4.2.14. Statistical Analysis
5. Conclusions
Author Contributions
Funding
Institutional Review Board Statement
Informed Consent Statement
Data Availability Statement
Conflicts of Interest
Sample Availability
References
- Kerr, E.; Caboche, C.; Pegg, C.; Phung, T.; Gonzalez Viejo, C.; Fuentes, S.; Howes, M.; Howell, K.; Schulz, B. The post-translational modification landscape of commercial beers. Sci. Rep. 2021, 11, 15890. [Google Scholar] [CrossRef] [PubMed]
- He, Y.; Dong, J.; Yin, H.; Zhao, Y.; Chen, R.; Wan, X.; Chen, P.; Hou, X.; Liu, J.; Chen, L. Wort Composition and Its Impact on the Flavour-Active Higher Alcohol and Ester Formation of Beer—A Review. J. Inst. Brew. 2014, 120, 157–163. [Google Scholar] [CrossRef]
- Gerhäuser, C. Beer constituents as potential cancer chemopreventive agents. Eur. J. Cancer 2015, 41, 1941–1954. [Google Scholar] [CrossRef] [PubMed]
- Mikyška, A.; Hrabák, M.; Hašková, D.; Šrogl, J. The Role of Malt and Hop Polyphenols in Beer Quality, Flavour and Haze Stability. J. Inst. Brew. 2002, 108, 78–85. [Google Scholar] [CrossRef]
- Moura-Nunes, N.; Cazaroti Brito, T.; Dias da Fonseca, N.; Fernandes de Aguiar, P.; Monteiro, M.; Perrone, D.; Guedes Torres, A. Phenolic compounds of Brazilian beers from different types and styles and application of chemometrics for modeling antioxidant capacity. Food Chem. 2016, 199, 105–113. [Google Scholar] [CrossRef] [Green Version]
- Boronat, A.; Soldevila-Domenech, N.; Rodríguez-Morató, J.; Martínez-Huélamo, M.; Lamuela-Raventós, R.M.; de la Torre, R. Beer Phenolic Composition of Simple Phenols, Prenylated Flavonoids and Alkylresorcinols. Molecules 2020, 25, 2582. [Google Scholar] [CrossRef]
- Landberg, R.; Marklund, M.; Kamal-Eldin, A.; Åman, P. An update on alkylresorcinols–Occurrence, bioavailability, bioactivity and utility as biomarkers. J. Funct. Foods 2014, 7, 77–89. [Google Scholar] [CrossRef]
- Rodríguez-Morató, J.; Jayawardene, S.; Huang, N.K.; Dolnikowski, G.G.; Galluccio, J.; Lichtenstein, A.H. Simplified method for the measurement of plasma alkylresorcinols: Biomarkers of whole-grain intake. Rapid Commun. Mass Spectrom. 2020, 34, e8805. [Google Scholar] [CrossRef] [PubMed]
- Hazelwood, L.A.; Daran, J.M.; Van Maris, A.J.A.; Pronk, J.T.; Dickinson, J.R. The Ehrlich pathway for fusel alcohol production: A century of research on Saccharomyces cerevisiae metabolism. Appl. Environ. Microbiol. 2008, 74, 2259–2266. [Google Scholar] [CrossRef] [Green Version]
- Shopska, V.; Denkova-Kostova, R.; Dzhivoderova-Zarcheva, M.; Teneva, D.; Denev, P.; Kostov, G. Comparative Study on Phenolic Content and Antioxidant Activity of Different Malt Types. Antioxidants 2021, 10, 1124. [Google Scholar] [CrossRef]
- Magalhães, P.J.; Almeida, S.M.; Carvalho, A.M.; Gonçalves, L.M.; Pacheco, J.G.; Cruz, J.M.; Guido, L.F.; Barros, A.A. Influence of malt on the xanthohumol and isoxanthohumol behavior in pale and dark beers: A micro-scale approach. Food Res. Int. 2011, 44, 351–359. [Google Scholar] [CrossRef]
- Leitao, C.; Marchioni, E.; Bergaentzle, M.; Zhao, M.; Didierjean, L.; Miesch, L.; Holder, E.; Miesch, M.; Ennahar, S. Fate of polyphenols and antioxidant activity of barley throughout malting and brewing. J. Cereal Sci. 2012, 55, 318–322. [Google Scholar] [CrossRef]
- Samaras, T.S.; Camburn, P.A.; Chandra, S.X.; Gordon, M.H.; Ames, J.M. Antioxidant Properties of Kilned and Roasted Malts. J. Agric. Food Chem. 2005, 53, 8068–8074. [Google Scholar] [CrossRef]
- Dvoráková, M.; Guido, L.F.; Dostalek, P.; Skulilová, Z.; Moreira, M.M.; Barros, A.A. Antioxidant Properties of Free, Soluble Ester and Insoluble-Bound Phenolic Compounds in Different Barley Varieties and Corresponding Malts. J. Inst. Brew. 2008, 114, 27–33. [Google Scholar] [CrossRef]
- Carvalho, D.O.; Correia, E.; Lopes, L.; Guido, L.F. Further insights into the role of melanoidins on the antioxidant potential of barley malt. Food Chem. 2014, 160, 127–133. [Google Scholar] [CrossRef]
- Inns, E.L.; Buggey, L.A.; Booer, C.; Nursten, H.E.; Ames, J.M. Effect of Modification of the Kilning Regimen on Levels of Free Ferulic Acid and Antioxidant Activity in Malt. J. Agric. Food Chem. 2011, 59, 9335–9343. [Google Scholar] [CrossRef] [PubMed]
- Mikyška, A.; Dušek, M. How wort boiling process affects flavonoid polyphenols in beer. Kvas. Prum. 2019, 65, 192–200. [Google Scholar] [CrossRef]
- Socha, R.; Pająk, P.; Fortuna, T.; Buksa, K. Antioxidant activity and the most abundant phenolics in commercial dark beers. Int. J. Food Prop. 2017, 20, S595–S609. [Google Scholar] [CrossRef]
- Dang, B.; Zhang, W.-G.; Zhang, J.; Yang, X.-J.; Xu, H.-D. Evaluation of Nutritional Components, Phenolic Composition, and Antioxidant Capacity of Highland Barley with Different Grain Colors on the Qinghai Tibet Plateau. Foods 2022, 11, 2025. [Google Scholar] [CrossRef]
- Ikram, S.; Zhang, H.; Ming, H.; Wang, J. Recovery of major phenolic acids and antioxidant activity of highland barley brewer’s spent grains extracts. J. Food Process Preserv. 2020, 44, e14308. [Google Scholar] [CrossRef]
- Carvalho, D.O.; Curto, A.F.; Guido, L.F. Determination of Phenolic Content in Different Barley Varieties and Corresponding Malts by Liquid Chromatography-diode Array Detection-Electrospray Ionization Tandem Mass Spectrometry. Antioxidants 2015, 4, 563. [Google Scholar] [CrossRef] [Green Version]
- Setyaningsih, W.; Saputro, I.E.; Palma, M.; Barroso, C.G. Profile of individual phenolic compounds in rice (Oryza sativa) grains during cooking processes. AIP Conf. Proc. 2016, 1755, 130012. [Google Scholar] [CrossRef]
- Li, S.; Xu, H.; Sui, Y.; Mei, X.; Shi, J.; Cai, S.; Xiong, T.; Carrillo, C.; Castagnini, J.M.; Zhu, Z.; et al. Comparing the LC-MS Phenolic Acids Profiles of Seven Different Varieties of Brown Rice (Oryza sativa L.). Foods 2022, 11, 1552. [Google Scholar] [CrossRef] [PubMed]
- Goufo, P.; Trindade, H. Rice antioxidants: Phenolic acids, flavonoids, anthocyanins, proanthocyanidins, tocopherols, tocotrienols, γ-oryzanol, and phytic acid. Food Sci. Nutr. 2014, 2, 75–104. [Google Scholar] [CrossRef] [PubMed]
- Yhang, F.; Yang, L.; Huang, W. Flavonoid Metabolic Profiles and Gene Mapping of Rice (Oryza sativa L.) Purple Gradient Grain Hulls. Rice 2022, 15, 43. [Google Scholar] [CrossRef]
- Yamuangmorn, S.; Prom-U-Thai, C. The Potential of High-Anthocyanin Purple Rice as a Functional Ingredient in Human Health. Antioxidants 2021, 10, 833. [Google Scholar] [CrossRef]
- Phimphilai, S.; Koonyosying, P.; Hutachok, N.; Kampoun, T.; Daw, R.; Chaiyasut, C.; Prasartthong-osoth, V.; Srichairatanakool, S. Identifying Chemical Composition, Safety and Bioactivity of Thai Rice Grass Extract Drink in Cells and Animals. Molecules 2021, 26, 6887. [Google Scholar] [CrossRef] [PubMed]
- Méndez-Lagunas, L.L.; Cruz-Gracida, M.; Barriada-Bernal, L.G. Profile of phenolic acids, antioxidant activity and total phenolic compounds during blue corn tortilla processing and its bioaccessibility. J. Food Sci. Technol. 2020, 57, 4688–4696. [Google Scholar] [CrossRef]
- Nikolić, N.; Mitrović, J.; Karabegović, I.; Savić, S.; Petrović, S.; Lazić, M.G. A comparison between wheat and different kinds of corn flour based on minerals, free phenolic acid composition and antioxidant activity. Qual. Assur. Saf. Crops Foods 2018, 11, 341–349. [Google Scholar] [CrossRef]
- Horvat, D.; Šimić, G.; Drezner, G.; Lalić, A.; Ledenčan, T.; Tucak, M.; Plavšić, H.; Andrić, L.; Zdunić, Z. Phenolic Acid Profiles and Antioxidant Activity of Major Cereal Crops. Antioxidants 2020, 9, 527. [Google Scholar] [CrossRef]
- Ndolo, V.; Beta, T. Comparative Studies on Composition and Distribution of Phenolic Acids in Cereal Grain Botanical Fractions. Cereal Chem. 2014, 91, 522–530. [Google Scholar] [CrossRef]
- Zondo, S.; Mahlambi, P. Correlation between Chemical Composition, Water Holding Capacity and Flavonoids Content of Maize Verities Harvested at Buxedeni Village of KwaNongoma in KwaZulu Natal, South Africa. J. Food Nutr. Res. 2020, 8, 675–681. [Google Scholar] [CrossRef]
- Casas, M.I.; Duarte, S.; Doseff, A.I.; Grotewold, E. Flavone-rich maize: An opportunity to improve the nutritional value of an important commodity crop. Front. Plant Sci. 2014, 5, 440. [Google Scholar] [CrossRef] [Green Version]
- Moreno, Y.S.; Sánchez, G.S.; Hernández, D.R.; Lobato, N.R. Characterization of anthocyanin extracts from maize kernels. J. Chromatogr. Sci. 2005, 43, 483–487. [Google Scholar] [CrossRef] [Green Version]
- Kim, J.-T.; Yi, G.; Chung, I.-M.; Son, B.-Y.; Bae, H.-H.; Go, Y.S.; Ha, J.Y.; Baek, S.-B.; Kim, S.-L. Timing and Pattern of Anthocyanin Accumulation during Grain Filling in Purple Waxy Corn (Zea mays L.) Suggest Optimal Harvest Dates. ACS Omega 2020, 5, 15702–15708. [Google Scholar] [CrossRef] [PubMed]
- Gammoh, S.; Alu’datt, M.H.; Alhamad, M.N.; Rababah, T.; Ereifej, K.; Almajwal, A.; Ammari, Z.A.; Al Khateeb, W.; Hussein, N.M. Characterization of phenolic compounds extracted from wheat protein fractions using highperformance liquid chromatography/liquid chromatography mass spectrometry in relation to antiallergenic, anti-oxidant, anti-hypertension, and anti-diabetic properties. Int. J. Food Prop. 2017, 20, 2383–2395. [Google Scholar] [CrossRef] [Green Version]
- Zeng, Z.; Liu, C.; Luo, S.; Chen, J.; Gong, E. The Profile and Bioaccessibility of Phenolic Compounds in Cereals Influenced by Improved Extrusion Cooking Treatment. PLoS ONE 2016, 11, e0161086. [Google Scholar] [CrossRef] [Green Version]
- Eliášová, M.; Kotíková, Z.; Lachman, J.; Orsák, M.; Martinek, P. Influence of baking on anthocyanin content in coloured-grain wheat bread. Plant Soil Environ. 2020, 66, 381–386. [Google Scholar] [CrossRef]
- Sharma, N.; Tiwari, V.; Vats, S.; Kumari, A.; Chunduri, V.; Kaur, S.; Kapoor, P.; Garg, M. Evaluation of Anthocyanin Content, Antioxidant Potential and Antimicrobial Activity of Black, Purple and Blue Colored Wheat Flour and Wheat-Grass Juice against Common Human Pathogens. Molecules 2020, 25, 5785. [Google Scholar] [CrossRef]
- Buśko, M.; Goral, T.; Ostrowska, A.; Matysiak, A.; Walentyn-Góral, D.; Perkowski, J. The Effect of Fusarium Inoculation and Fungicide Application on Concentrations of Flavonoids (Apigenin, Kaempferol, Luteolin, Naringenin, Quercetin, Rutin, Vitexin) in Winter Wheat Cultivars. Am. J. Plant Sci. 2014, 5, 3727–3736. [Google Scholar] [CrossRef] [Green Version]
- Yang, X.; Jiang, Y.; Yang, J.; He, J.; Sun, J.; Chen, F.; Zhang, M.; Yang, B. Prenylated Flavonoids, Promising Nutraceuticals with Impressive Biological Activities. Trends Food Sci. Technol. 2015, 44, 93–104. [Google Scholar] [CrossRef]
- Zugravu, C.-A.; Bohiltea, R.-E.; Salmen, T.; Pogurschi, E.; Otelea, M.R. Antioxidants in Hops: Bioavailability, Health Effects and Perspectives for New Products. Antioxidants 2022, 11, 241. [Google Scholar] [CrossRef] [PubMed]
- Magalhaes, P.J.; Carvalho, D.O.; Cruz, J.M.; Guido, L.F.; Barros, A.A. Fundamentals and Health Benefits of Xan-Thohumol, a Natural Product Derived from Hops and Beer. Nat. Prod. Commun. 2009, 4, 591–610. [Google Scholar] [CrossRef] [Green Version]
- Vazquez-Cervantes, G.I.; Ortega, D.R.; Blanco Ayala, T.; Pérez de la Cruz, V.; Esquivel, D.F.G.; Salazar, A.; Pineda, B. Redox and Anti-Inflammatory Properties from Hop Components in Beer-Related to Neuroprotection. Nutrients 2021, 13, 2000. [Google Scholar] [CrossRef] [PubMed]
- Obata, Y.; Koshika, M. Studies on the Sunlight Flavor of Beer. Bull. Agric. Chem. Soc. Jpn. 1960, 24, 644–646. [Google Scholar]
- Vanbeneden, N.; Van Roey, T.; Willems, F.; Delvaux, F.; Delvaux, F.R. Release of phenolic flavour precursors during wort production: Influence of process parameters and grist composition on ferulic acid release during brewing. Food Chem. 2008, 111, 83–91. [Google Scholar] [CrossRef]
- Sterckx, F.L.; Missiaen, J.; Saison, D.; Delvaux, F.R. Contribution of monophenols to beer flavour based on flavour thresholds, interactions and recombination experiments. Food Chem. 2011, 126, 1679–1685. [Google Scholar] [CrossRef]
- Bettenhausen, H.M.; Barr, L.; Broeckling, C.D.; Chaparro, J.M.; Holbrook, C.; Sedin, D.; Heuberger, A.L. Influence of malt source on beer chemistry, flavor, and flavor stability. Food Res. Int. 2018, 113, 487–504. [Google Scholar] [CrossRef]
- Langos, D.; Granvogl, M.; Schieberle, P. Characterization of the key aroma compounds in two Bavarian wheat beers by means of the sensomics approach. J. Agric. Food Chem. 2013, 61, 11303–11311. [Google Scholar] [CrossRef]
- Deng, Y.; Lim, J.; Lee, G.H.; Nguyen, T.T.H.; Xiao, Y.; Piao, M.; Kim, D. Brewing Rutin-Enriched Lager Beer with Buckwheat Malt as Adjuncts. J. Microbiol. Biotechnol. 2019, 29, 877–886. [Google Scholar] [CrossRef] [Green Version]
- Yorke, J.; Cook, D.; Ford, R. Brewing with Unmalted Cereal Adjuncts: Sensory and Analytical Impacts on Beer Quality. Beverages 2021, 7, 4. [Google Scholar] [CrossRef]
- Gu, L.; Kelm, M.A.; Hammerstone, J.F.; Beecher, G.; Holden, J.; Haytowitz, D.; Gebhardt, S.; Prior, R.L. Concentrations of proanthocyanidins in common foods and estimations of normal consumption. J. Nutr. 2004, 134, 613–617. [Google Scholar] [CrossRef] [PubMed] [Green Version]
- Nardini, M.; Foddai, M.S. Phenolics Profile and Antioxidant Activity of Special Beers. Molecules 2020, 25, 2466. [Google Scholar] [CrossRef] [PubMed]
- Han, H.; Kim, J.; Choi, E.; Ahn, H.; Kim, W.J. Characteristics of Beer Produced from Korean Six-Row Barley with the Addition of Adjuncts. J. Inst. Brew. 2016, 122, 500–507. [Google Scholar] [CrossRef]
- Steiner, E.; Auer, A.; Becker, T.; Gastl, M. Comparison of Beer Quality Attributes between Beers Brewed with 100% Barley Malt and 100% Barley Raw Material. J. Sci. Food Agric. 2012, 92, 803–813. [Google Scholar] [CrossRef] [PubMed]
- Kunz, T.; Müller, C.; Mato-Gonzales, D.; Methner, F.J. The Influence of Unmalted Barley on the Oxidative Stability of Wort and Beer. J. Inst. Brew. 2012, 118, 32–39. [Google Scholar] [CrossRef]
- Evans, D.E.; Redd, K.; Haraysmow, S.E.; Elvig, N.; Metz, N.; Koutoulis, A. The Influence of Malt Quality on Malt Brewing and Barley Quality on Barley Brewing with Ondea Pro, Compared by Small-Scale Analysis. J. Am. Soc. Brew. Chem. 2014, 72, 192–207. [Google Scholar] [CrossRef]
- Fumi, M.D.; Galli, R.; Lambri, M.; Donadini, G.; De Faveri, D.M. Effect of Full-Scale Brewing Process on Polyphenols in Italian All-Malt and Maize Adjunct Lager Beers. J. Food Compos. Anal. 2011, 24, 568–573. [Google Scholar] [CrossRef]
- Poreda, A.; Czarnik, A.; Zdaniewicz, M.; Jakubowski, M.; Antkiewicz, P. Corn Grist Adjunct—Application and Influence on the Brewing Process and Beer Quality. J. Inst. Brew. 2014, 120, 77–81. [Google Scholar] [CrossRef]
- Taylor, J.R.N.; Dlamini, B.C.; Kruger, J. 125th Anniversary Review: The Science of the Tropical Cereals Sorghum, Maize and Rice in Relation to Lager Beer Brewing. J. Inst. Brew. 2013, 119, 1–14. [Google Scholar] [CrossRef]
- Diakabana, P.; Mvoula-Tsieri, M.; Dhellot, J.; Kobawila, S.C.; Louembe, D. Physico-Chemical Characterization of Brew during the Brewing Corn Malt in the Production of Maize Beer in Congo. Adv. J. Food Sci. Technol. 2013, 5, 671–677. [Google Scholar] [CrossRef]
- Agu, R.C. A Comparison of Maize, Sorghum and Barley as Brewing Adjuncts. J. Inst. Brew. 2002, 108, 19–22. [Google Scholar] [CrossRef]
- Marconi, O.; Sileoni, V.; Ceccaroni, D.; Perretti, G. The Use of Rice in Brewing. Adv. Int. Rice Res. 2017, 49–66. [Google Scholar] [CrossRef] [Green Version]
- Jaeger, A.; Zannini, E.; Sahin, A.W.; Arendt, E.K. Barley Protein Properties, Extraction and Applications, with a Focus on Brewers’ Spent Grain Protein. Foods 2021, 10, 1389. [Google Scholar] [CrossRef]
- Taylor, P.; Bechtel, D.B. Properties of Whole and Undigested Fraction of Protein Bodies of Milled Rice Preparations Had Higher Fat Content than Whole PB Preparation. Endosperm Protein of Rice Exists Mainly as That the Protein Fraction Rendered Undigested. Agric. Biol. Chem. 2015, 42, 2015–2023. [Google Scholar] [CrossRef]
- Wang, Y.; Ye, L. Haze in Beer: Its Formation and Alleviating Strategies, from a Protein–Polyphenol Complex Angle. Foods 2021, 10, 3114. [Google Scholar] [CrossRef] [PubMed]
- Du, B.; Meenu, M.; Liu, H.; Xu, B. A Concise Review on the Molecular Structure and Function Relationship of β-Glucan. Int. J. Mol. Sci. 2019, 20, 4032. [Google Scholar] [CrossRef] [Green Version]
- Zielke, C.; Stradner, A.; Nilsson, L. Characterization of cereal β-glucan extracts: Conformation and structural aspects. Food Hydrocoll. 2018, 79, 218–227. [Google Scholar] [CrossRef]
- Wu, X.; Du, J.; Zhang, K.; Ju, Y.; Jin, Y. Changes in protein molecular weight during cloudy wheat beer brewing. J. Inst. Brew. 2015, 121, 137–144. [Google Scholar] [CrossRef]
- Johansson, E.; Lange, S.; Oshalim, M. Anti-Inflammatory Substances in Wheat Malt Inducing Antisecretory Factor. Plant Foods Hum. Nutr. 2019, 74, 489–494. [Google Scholar] [CrossRef] [PubMed] [Green Version]
- Udeh, H.O.; Duodu, K.G.; Jideani, A.I.O. Malting Period Effect on the Phenolic Composition and Antioxidant Activity of Finger Millet (Eleusine coracana L. Gaertn). Flour Mol. 2018, 23, 2091. [Google Scholar] [CrossRef] [Green Version]
- Koren, D.; Kun, S.; Hegyesné Vecseri, B. Study of antioxidant activity during the malting and brewing process. J. Food Sci. Technol. 2019, 56, 3801–3809. [Google Scholar] [CrossRef] [PubMed] [Green Version]
- Zakharova, V.G.; Kavardina, V.A. Kinetic equation of elementary reaction. In Proceedings of the 10th International Youth Scientific Conference “Future Generation: Young Scientists Perspective 2021”, Kursk, Russia, 11–12 November 2021. [Google Scholar]
- Li, M.; Du, J.; Zheng, Y. Non-Starch Polysaccharides in Wheat Beers and Barley Malt beers: A Comparative Study. Foods 2020, 9, 131. [Google Scholar] [CrossRef] [PubMed] [Green Version]
- Kosiv, R. Comparison of the hydrocolloids application efficiency for stabilizing the foam of beer. ScienceRise 2021, 6, 25–30. [Google Scholar] [CrossRef]
- Bamforth, C. The physics and chemistry of beer foam: A review. Eur. Food Res. Technol. 2022, 249, 3–11. [Google Scholar] [CrossRef]
- Hu, X.; Jin, Y.; Du, J. Differences in protein content and foaming properties of cloudy beers based on wheat malt content. J. Inst. Brew. 2019, 125, 235–241. [Google Scholar] [CrossRef]
- Lukinac, J.; Mastanjević, K.; Mastanjević, K.; Nakov, G.; Jukić, M. Computer Vision Method in Beer Quality Evaluation—A Review. Beverages 2019, 5, 38. [Google Scholar] [CrossRef] [Green Version]
- Ambra, R.; Pastore, G.; Lucchetti, S. The Role of Bioactive Phenolic Compounds on the Impact of Beer on Health. Molecules 2021, 26, 486. [Google Scholar] [CrossRef]
- Hill, A.E.; Stewart, G.G. Free Amino Nitrogen in Brewing. Fermentation 2019, 5, 22. [Google Scholar] [CrossRef] [Green Version]
- Guerra, P.V.; Yaylyan, V.A. Interaction of Flavanols with Amino Acids: Postoxidative Reactivity of the β-Ring of Catechin with Glycine. J. Agric. Food Chem. 2014, 62, 3831–3836. [Google Scholar] [CrossRef]
- Gernet, M.; Gribkova, I.; Zakharov, M.; Kobelev, K. Research of hop polyphenols impact on malt hopped wort aroma formation model experiments. Potravin. Slovak J. Food Sci. 2021, 15, 262–273. [Google Scholar] [CrossRef]
- Iimure, T.; Takoi, K.; Kaneko, T.; Makoto, K.; Hayashi, K.; Ito, K.; Sato, K.; Takeda, K. Novel Prediction Method of Beer Foam Stability Using Protein Z, Barley Dimeric α-Amylase Inhibitor-1 (BDAI-1) and Yeast Thioredoxin. J. Agric. Food Chem. 2008, 56, 8664–8671. [Google Scholar] [CrossRef]
- Kroll, J.; Rawel, H.M.; Rohm, S. Reactions of Plant Phenolics with Food Proteins and Enzymes under Special Consideration of Covalent Bonds. Food Sci. Technol. Res. 2003, 9, 205–218. [Google Scholar] [CrossRef] [Green Version]
- Lu, Y.; Bergenståhl, B. Interfacial properties and interaction between beer wort protein fractions and iso-humulone. Food Hydrocoll. 2020, 103, 105648. [Google Scholar] [CrossRef]
- Shabbir, U.; Rubab, M.; Daliri, E.B.; Chelliah, R.; Javed, A.; Oh, D.H. Curcumin, Quercetin, Catechins and Metabolic Diseases: The Role of Gut Microbiota. Nutrients 2021, 13, 206. [Google Scholar] [CrossRef] [PubMed]
- Phuwadolpaisarn, P. Comparison of β-Glucan Content in Milled Rice, Rice Husk and Rice Bran from Rice Cultivars Grown in Different Locations of Thailand and the Relationship between β-Glucan and Amylose Contents. Molecules 2021, 26, 6368. [Google Scholar] [CrossRef] [PubMed]
- Sampson, G.O.; Tetteh, A.Y.; Oldham, J.H. Beta-Glucan Profile in Tropical Maize Genotypes: Effect of Isolation Method. J. Glob. Biosci. 2015, 4, 1339–1349. [Google Scholar]
- Salminen, T.A.; Blomqvist, K.; Edqvist, J. Lipid transfer proteins: Classification, nomenclature, structure, and function. Planta 2016, 244, 971–997. [Google Scholar] [CrossRef] [Green Version]
- Merinas-Amo, T.; Merinas-Amo, R.; Font, R.; del Río Celestino, M.; Alonso-Moraga, Á. Toxicological and Epigenetic Studies of Two Types of Ale Beer, Tyrosol and Iso-Alpha Humulone. Processes 2021, 9, 485. [Google Scholar] [CrossRef]
- Khatib, A. Studies of iso-Alpha-Acids: Analysis, Purification, and Stability. 10 October 2006. Available online: https://hdl.handle.net/1887/4860 (accessed on 1 February 2023).
- Arct, J.; Bielenda, B.; Oborska, A.; Pytkowska, K. The tea and its cosmetic application. J. Appl. Cosmetol. 2003, 21, 117–127. [Google Scholar]
- Duyvis, M.G.; Hilhorst, R.; Laane, C.; Evans, D.J.; Schmedding, D.J. Role of riboflavin in beer flavor instability: Determination of levels of riboflavin and its origin in beer by fluorometric apoprotein titration. J. Agric. Food Chem. 2002, 50, 1548–1552. [Google Scholar] [CrossRef] [PubMed]
- Dym, O.; Eisenberg, D. Sequence-structure analysis of FAD-containing proteins. Prot. Sci. 2001, 10, 1712–1728. [Google Scholar] [CrossRef] [PubMed] [Green Version]
- Suwannasom, N.; Kao, I.; Pruß, A.; Georgieva, R.; Bäumler, H. Riboflavin: The Health Benefits of a Forgotten Natural Vitamin. Int. J. Mol. Sci. 2020, 21, 950. [Google Scholar] [CrossRef] [PubMed] [Green Version]
- Qureshi, A.A.; Reis, J.C.; Qureshi, N. δ-Tocotrienol and quercetin reduce serum levels of nitric oxide and lipid parameters in female chickens. Lipids Health Dis. 2011, 10, 39. [Google Scholar] [CrossRef] [Green Version]
- Garg, M.; Sharma, A.; Vats, S.; Tiwari, V.; Kumari, A.; Mishra, V.; Krishania, M. Vitamins in Cereals: A Critical Review of Content, Health Effects, Processing Losses, Bioaccessibility, Fortification, and Biofortification Strategies for Their Improvement. Front. Nutr. 2021, 8, 586815. [Google Scholar] [CrossRef]
- Acosta-Estrada, B.A.; Gutiérrez-Uribe, J.A.; Serna-Saldivar, S.O. Minor Constituents and Phytochemicals of the Kernel; Serna-Saldivar, O., Ed.; AACC International Press: Washington, DC, USA, 2019; pp. 369–403. [Google Scholar] [CrossRef]
- Kopjar, M.; Buljeta, I.; Ćorković, I.; Pichler, A.; Šimunović, J. Adsorption of Quercetin on Brown Rice and Almond Protein Matrices: Effect of Quercetin Concentration. Foods 2022, 11, 793. [Google Scholar] [CrossRef]
- Rawel, H.M.; Czajka, D.; Rohn, S.; Kroll, J. Interactions of different phenolic acids and flavonoids with soy proteins. Int. J. Biolog. Macromol. 2002, 30, 137–150. [Google Scholar] [CrossRef]
- Gänz, N.; Becher, T.; Drusch, S.; Titze, J. Interaction of proteins and amino acids with iso-α-acids during wort preparation in the brewhouse. Eur. Food Res. Technol. 2022, 248, 741–750. [Google Scholar] [CrossRef]
- Middle European Brewing Analysis Commission. Brautechnische Analysenmethoden, 3rd ed.; Band I Selbstverlag der MEBAK; Freising-Weihenstephan: Nüremberg, Germany, 1997. [Google Scholar]
- Institute of Brewing (IOB). Institute of Brewing (IOB) Recommended methods of analysis. EBC Method 4.9.3. J. Inst. Brew. 2007, 7, 54–76. [Google Scholar]
- Aitken, A.; Learmonth, M. Estimation of Disulfide Bonds Using Ellman’s Reagent. In The Protein Protocols Handbook. Springer Protocols Handbooks; Walker, J.M., Ed.; Humana Press: Totowa, NJ, USA, 2009. [Google Scholar] [CrossRef]
- Gutova, S.; Novoseltseva, M.; Kagan, E. Mathematical Modelling of Isohumulone Extraction Process in Beer Wort Hopping. In Proceedings of the 2019 International Russian Automation Conference, Sochi, Russia, 8–14 September 2019; pp. 1–5. [Google Scholar] [CrossRef]
- Gottumukkala, R.V.; Nadimpalli, N.; Sukala, K.; Subbaraju, G.V. Determination of Catechin and Epicatechin Content in Chocolates by High-Performance Liquid Chromatography. Int. Sch. Res. Not. 2014, 2014, 5. [Google Scholar] [CrossRef] [Green Version]
- Silva, M.C.; dos Anjos, J.P.; Guarieiro, L.L.N.; Machado, B.A.S. A Simple Method for Evaluating the Bioactive Phenolic Compounds’ Presence in Brazilian Craft Beers. Molecules 2021, 26, 4716. [Google Scholar] [CrossRef] [PubMed]
- Dvorakova, M.; Hulin, P.; Karabin, M.; Dostálek, P. Determination of polyphenols in beer by an effective method based on solid-phase extraction and high-performance liquid chromatography with diode-array detection. Czech J. Food Sci. 2007, 25, 182–188. [Google Scholar] [CrossRef] [Green Version]
- Institute of Brewing (IOB). Institute of Brewing (IOB) Recommended methods of analysis. EBC Method 8.13.1. J. Inst. Brew. 2007, 7, 156–185. [Google Scholar]
- Koren, D.; Vecseri, B.H.; Kun-Farkas, G.; Urbin, Á.; Nyitrai, Á.; Sipos, L. How to objectively determine the color of beer? J. Food Sci. Technol. 2020, 57, 1183–1189. [Google Scholar] [CrossRef] [Green Version]
- Patrignani, M.; González-Forte, L.d.S. Characterisation of melanoidins derived from Brewers’ spent grain: New insights into their structure and antioxidant activity. Int. J. Food Sci. Technol. 2021, 56, 384–391. [Google Scholar] [CrossRef]


| Phenolic Compounds | Content in Adjuncts (μg/g) | |||
|---|---|---|---|---|
| Barley [19,20,21] | Rice [22,23,24,25,26,27] | Maize [28,29,30,31,32,33,34,35] | Wheat [36,37,38,39,40] | |
| Phenolic acids | ||||
| Gallic | 10.10 ± 0.26 | 4.7 ± 1.6 | 28.6 ± 2.30 | 21.0 ± 2.50 |
| Protocatechuic | 40.88 ± 5.44 | 9.9 ± 0.5 | 41.89 ± 4.55 | nf |
| Chlorogenic acid | 50.56 ± 0.84 | 14.8 ± 0.7 | 1.56 ± 0.01 | 27.90 ± 1.0 |
| 2,4-Dihydroxybenzoic | 4.86 ± 0.92 | 0.49 ± 0.35 | 0.24 ± 0.01 | 39.97 ± 0.41 |
| Vanillic | 5.75 ± 1.71 | 5.1 ± 0.3 | 1.09 ± 0.01 | 6.18 ± 0.66 |
| Syringic | 4.56 ± 0.35 | 5.4 ± 0.3 | 32 ± 3 | 2.44 ± 0.16 |
| p-coumaric | 4.31 ± 0.75 | 40.0 ± 2.0 | 6.5 ± 0.4 | 35.0 ± 3.40 |
| Ferulic | 7.22 ± 1.18 | 34.9 ± 1.7 | 1748 ± 12 | 402.10 ± 11.0 |
| Salicylic | 7.68 ± 0.33 | nd ** | nd | nf |
| benzoic | 3.16 ± 1.46 | nd | nd | nf |
| O-coumaric | 9.29 ± 0.44 | nd | 71.0 ± 16 | nf |
| Veratric | 5.11 ± 1.36 | nd | nd | nd |
| caffeic | 64.4 ± 0.80 | 6.5 ± 0.3 | 0.27 ± 0.01 | 31.83 ± 0.30 |
| sinapic | 0.9 ± 0.03 | 5.9 ± 0.3 | 132 ± 0.23 | 3.14 ± 0.14 |
| Flavonoids | ||||
| Catechin | 46.94 ± 2.72 | 13.7 ± 5.1 | 1.68 ± 0.17 | 0.008 ± 0.0008 |
| Naringin | 3.05 ± 0.76 | nf | + *** | nf |
| Hesperidin | nf * | nf | nf | nf |
| Myricetin | 2.68 ± 1.45 | 3.50 ± 0.50 | nf | nf |
| Quercetin | 12.21 ± 0.24 | 19.6 ± 0.20 | 1.58 ± 0.05 | 24.3 ± 0.64 |
| Naringenin | 5.32 ± 0.10 | nf | 14.8 ± 0.53 | 7.11 ± 0.45 |
| Kaempferol | 9.58 ± 0.46 | 6.70 ± 0.26 | 224.0 ± 9.8 | 6.0 ± 0.32 |
| Rutin | 10.32 ± 1.12 | 13.8 ± 0.81 | 2.74 ± 0.10 | 41.7 ± 4.60 |
| apigenin | nf | 12.3 ± 1.27 | + | 59.8 ± 14 |
| tricine | nf | 7.3 ± 0.53 | nf | nf |
| luteoline | nf | 3.0 ± 0.28 | + | 2.56 ± 0.12 |
| apimysine | nf | nf | + | nf |
| Anthocyanins | ||||
| Cyanidin | 0.66 ± 0.23 | nf | nf | nf |
| Cyanidin-3-glucoside | 0.91 ± 0.05 | 8.47 ± 0.49 | 409.7 ± 40.2 | 0.741 ± 0.108 |
| Cyanidin 3-rutinoside | nf | 52.0 ± 1.44 | nf | 0.096 ± 0.003 |
| Delphinidin | 1.06 ± 0.40 | nf | nf | nf |
| Delphinidin-3-glucoside | 0.56 ± 0.76 | 0.8 ± 0.05 | nf | nf |
| Malvidin-3-glucoside | 0.16 ± 0.18 | nf | nf | nf |
| Pelargonidin-3-glucoside | 0.08 ± 0.09 | nf | 135.9 ± 15.0 | nf |
| Peonidin | 0.12 ± 0.11 | 5.6 ± 0.35 | nf | nf |
| Peonidin-3-glucoside | nf | nf | nf | 1.231 ± 0.175 |
| Petunidin | 0.40 ± 0.09 | nf | nf | nf |
| Petunidin-3-glucoside | 0.32 ± 0.24 | nf | 152.0 ± 16.0 | 0.045 ± 0.001 |
| Phenolic Compounds | Content in Beer Samples with Adjuncts (mg/L) | ||||
|---|---|---|---|---|---|
| 100% Malt | 30% Barley | 30% Rice | 30% Maize | 30% Wheat | |
| 2,4-Dihydroxybenzoic | 0.59 ± 0.06 | 0.52 ± 0.01 | 0.49 ± 0.05 | 0.45 ± 0.04 | 0.63 ± 0.06 |
| Vanillic | 1.41 ± 0.01 | 1.56 ± 0.02 | 0.97 ± 0.01 | 1.06 ± 0.01 | 1.48 ± 0.01 |
| Syringic | 0.52 ± 0.05 | 0.32 ± 0.03 | 0.28 ± 0.03 | 0.31 ± 0.03 | 0.40 ± 0.04 |
| p-coumaric | 2.79 ± 0.03 | 1.60 ± 0.02 | 1.85 ± 0.02 | 2.50 ± 0.03 | 1.37 ± 0.01 |
| Ferulic | 3.52 ± 0.04 | 2.55 ± 0.03 | 2.46 ± 0.02 | 1.76 ± 0.02 | 2.73 ± 0.03 |
| Flavonoids | |||||
| Catechin | 2.6 ± 0.03 | 2.01 ± 0.02 | 1.25 ± 0.01 | 0.87 ± 0.09 | 0.97 ± 0.03 |
| Quercetin | 1.5 ± 0.1 | nd | nd | nd | 4.93 ± 0.06 |
| Rutin | 5.8 ± 0.2 | nd | nd | nd | 0.34 ± 0.02 |
| Proanthocyanidins | |||||
| monomers (catechin + epicatechin) | 4.0 | ||||
| dimers (procianines + prodelfinidins) | 11.0 | ||||
| trimers | 3.0 | ||||
| 4–6 trimers | 4.0 | ||||
| Non Malted Adjunct‘s Type (Less 20%) | Effect on Sensory/ Nutritional Properties | References |
|---|---|---|
| Wheat | More clarity beer, higher alcohol content and less foam retention, organoleptic parameters have been changed: a more pronounced grain smell, a denser body, less astringency and bitterness, including due to a decrease in the phenolic compound’s content and a change in the nitrogenous compound’s composition | [51,54] |
| Barley | Lighter color, more noticeable bitter taste, increased astringency, which is associated, among other things, with a decrease in the phenolic compound’s number and changes caused by amino acids set that turn into alcohols during fermentation | [51,55,56,57] |
| Maize | Gives a specific aroma to beer like corn due to the presence of 6-acetyltetrahydropyridine, 2-acetyl-1-pyrroline and its analogue 2-propionyl-1-pyrroline, a decrease in color intensity due to a decrease in the phenolic compound’s content, antioxidant activity, an increase in the peptides and free amino nitrogen level | [58,59,60,61,62] |
| Rice | Not abundant foam, flat taste, few free amino acids, difficult to hydrolyze protein, which affects the volatile compound’s profile and the foam quality | [63,64,65] |
| Sample Number | The Content in Samples, mg/L, Reliability Limit p < 0.05 | ||||
|---|---|---|---|---|---|
| Original Extract, °P | β-Glucan (Gl) | Soluble Nitrogen (SN) | Soluble Nitrogen with Thiol Groups (SNTG), μM/L | Iso-α-Humulone (IBU) (IH) | |
| 1BMW | (12.6 ± 1.0) * | 124.1 ± 8.7 | 817.2 ± 33 | 396.0 ± 20 | 26.1 ± 0.11 |
| 2BMBW | 11.0 ± 1.0 | 166.8 ± 11.7 | 927.3 ± 37 | 812.3 ± 40 | 29.6 ± 0.12 |
| 3BMRW | 13.0 ± 1.0 | 194.0 ± 13.6 | 1095.3 ± 44 | 236.1 ± 12 | 25.9 ± 0.11 |
| 4BMCW | 12.7 ± 1.0 | 186.2 ± 13.0 | 1020.5 ± 40 | 989.5 ± 50 | 33.9 ± 0.15 |
| 5BMWW | 12.4 ± 1.0 | 225.0 ± 15.7 | 1025.3 ± 40 | 216.2 ± 11 | 27.9 ± 0.12 |
| 6WMWW | 10.2 ± 1.0 | 360.0 ± 25.2 | 654.1 ± 26 | 288.4 ± 14 | 28.8 ± 0.12 |
| Sample Number | The Content in Samples, mg/L, Reliability Limit p < 0.05 | ||||
|---|---|---|---|---|---|
| Catechin (Ct) | Quercetin (Qv) | Melanoidin (Mel) | Riboflavin (Rf) | Color, °EBC | |
| 1BMW | (18.6 ± 1.9) * | 0.28 ± 0.03 | 126.0 ± 12.0 | 0.46 ± 0.005 | 12.0 ± 0.36 |
| 2BMBW | 38.4 ± 3.8 | 0.35 ± 0.03 | 125.0 ± 12.0 | 2,86 ± 0.028 | 11.0 ± 0.33 |
| 3BMRW | 24.75 ± 2.5 | 0.43 ± 0.04 | 185.0 ± 18.0 | 4.33 ± 0.043 | 14.0 ± 0.42 |
| 4BMCW | 21.1 ± 2.0 | 0.14 ± 0.01 | 136.0 ± 13.6 | 1.55 ± 0.015 | 25.0 ± 0.75 |
| 5BMWW | 24.75 ± 2.5 | 0.39 ± 0.04 | 170.0 ± 17.0 | 3.87 ± 0.039 | 13.25 ± 0.40 |
| 6WMWW | 81.7 ± 8.2 | 0.98 ± 0.10 | 225.0 ± 22.0 | 3.72 ± 0.037 | 65.0 ± 1.95 |
| Pairwise Correlation Coefficient, Reliability Limit p < 0.05 | ||||
|---|---|---|---|---|
| Color (y) | Ct (x1) | Mel (x2) | Rf (x3) | |
| Color (y) | 1 | 0.90 | 0.75 | 0.23 |
| Ct (x1) | 0.90 | 1 | 0.72 | 0.40 |
| Mel (x2) | 0.75 | 0.72 | 1 | 0.72 |
| Rf (x3) | 0.23 | 0.40 | 0.72 | 1 |
| - | NTG (Y) | Ct (x1) | Qv (x2) | IG (x3) |
|---|---|---|---|---|
| barley malt beer Y = −976.9757 − 6.163X1 + 56.7859X2 + 14.4257X3 | ||||
| NTG (Y) | 1 | 0.86 | 0.99 | 0.91 |
| Ct (x1) | 0.86 | 1 | 0.90 | 0.99 |
| Qv (x2) | 0.99 | 0.90 | 1 | 0.94 |
| IG (x3) | 0.91 | 0.99 | 0.94 | 1 |
| barley malt and barley beer Y= −2211.4679 − 11.9219X1 + 125.3206X2 − 650.3287X3 | ||||
| NTG (Y) | 1 | 0.79 | 0.98 | 0.84 |
| Ct (x1) | 0.79 | 1 | 0.90 | 0.98 |
| Qv (x2) | 0.98 | 0.90 | 1 | 0.94 |
| IG (x3) | 0.84 | 0.98 | 0.94 | 1 |
| barley malt and rice beer Y = −569.4632 − 0.3169X1 + 31.4308X2 − 1.5104X3 | ||||
| NTG (Y) | 1 | 0.78 | 0.99 | 0.96 |
| Ct (x1) | 0.78 | 1 | 0.79 | 0.91 |
| Qv (x2) | 0.99 | 0.79 | 1 | 0.96 |
| IG (x3) | 0.96 | 0.91 | 0.96 | 1 |
| barley malt and corn beer Y = 171.3174 − 7.8932X1 + 23.24X2 − 5813.8946X3 | ||||
| NTG (Y) | 1 | −0.63 | −0.59 | −0.75 |
| Ct (x1) | −0.63 | 1 | 0.99 | 0.97 |
| Qv (x2) | −0.60 | 0.99 | 1 | 0.98 |
| IG (x3) | −0.75 | 0.97 | 0.98 | 1 |
| barley malt and wheat beer Y = −192.7518 + 6.1741X1 + 9.0969X2 + 4.9172X3 | ||||
| NTG (Y) | 1 | 0.98 | 0.92 | 0.99 |
| Ct (x1) | 0.98 | 1 | 0.84 | 0.97 |
| Qv (x2) | 0.92 | 0.84 | 1 | 0.92 |
| IG (x3) | 0.99 | 0.97 | 0.92 | 1 |
| wheat malt and wheat beer Y = −1838.8135−2.5459X1 + 60.6517X2 − 20.2411X3 | ||||
| NTG (Y) | 1 | 0.65 | 0.92 | 0.95 |
| Ct (x1) | 0.65 | 1 | 0.90 | 0.85 |
| Qv (x2) | 0.92 | 0.90 | 1 | 0.99 |
| IG (x3) | 0.95 | 0.85 | 0.99 | 1 |
| Beer’s Raw Material Type | Pairwise Correlation Coefficient | Elasticity (E), Correlation (R), and Determination (R2) Coefficients |
|---|---|---|
| barley malt | Ct-IGM/NTG (−1); Ct-Qv/NTG (−0.99); IGM-Qv/NTG (1) | Ect = −0.556; Eigm = 8.865; Eqv = 0.0263; R = 1; R2 = 1 |
| barley malt + barley | Ct-IGM/NTG (1); Ct-Qv/NTG (0.99); IGM-Qv/NTG (−0.62) | Ect = −1.039; Eigm = 12.243; Eqv = −0.905; R = 1; R2 = 1 |
| barley malt + rice | Ct-IGM/NTG (1); Ct-Qv/NTG (−0.79); IGM-Qv/NTG (0.92) | Ect = −0.0577; Eigm = 7.288; Eqv = −0.00548; R = 1; R2 = 1 |
| barley malt + corn | Ct-IGM/NTG (0.98); Ct-Qv/NTG (0.97); IGM-Qv/NTG (0.99) | Ect = −4.229; Eigm = 22.162; Eqv = −2.523; R = 1; R2 = 1 |
| barley malt + wheat | Ct-IGM/NTG (−1); Ct-Qv/NTG (−0.64); IGM-Qv/NTG (0.28) | Ect = 0.799; Eigm = 1.687; Eqv = 0.012; R = 1; R2 = 1 |
| wheat malt + wheat | Ct-IGM/NTG (1); Ct-Qv/NTG (1); IGM-Qv/NTG (0.99) | Ect = −0.369; Eigm = 10.974; Eqv = −0.085; R = 1; R2 = 1 |
| Beer’s Raw Material Type | Correlation Characteristics, Reliability Limit p < 0.05 | |
|---|---|---|
| Dependency Equation | Correlation (R) and Determination (R2) Coefficients | |
| barley malt | Y = 13.5162 + 0.6358X | R = 0.98; R2 = 0.96 |
| barley malt + barley | Y = 17.6601 + 0.2628X | R = 0.95; R2 = 0.90 |
| barley malt + rice | Y = 16.2796 + 0.2882X | R = 0.83; R2 = 0.69 |
| barley malt + corn | Y = 11.8962 + 1.0479X | R = 0.98; R2 = 0.97 |
| barley malt + wheat | Y = 19.3289 + 0.2542X | R = 0.83; R2 = 0.69 |
| wheat malt + wheat | Y = 33.1081 + 0.0757X | R = 0.90; R2 = 0.81 |
| Beer’s Raw Material Type | Correlation Characteristics, Reliability Limit p < 0.05 | |
|---|---|---|
| Dependency Equation | Correlation (R) and Determination (R2) Coefficients | |
| barley malt | Y = 13.1969X−1.4249 | R = 0.95; R2 = 0.90 |
| barley malt + barley | Y = 42.1003X−11.9372 | R = 0.94; R2 = 0.88 |
| barley malt + rice | Y = 7.6103X + 0.9626 | R = 0.91; R2 = 0.83 |
| barley malt + corn | Y = 43.1731X−4.4028 | R = 0.99; R2 = 0.99 |
| barley malt + wheat | Y = 9.8901X−0.4176 | R = 0.93; R2 = 0.86 |
| wheat malt + wheat | Y = 8.3123X−4.7546 | R = 0.91; R2 = 0.83 |
| Measuring Parameters List | The Content in Samples, mg/L, Reliability Limit p < 0.05 | |||||
|---|---|---|---|---|---|---|
| 1BMW | 2BMBW | 3BMRW | 4BMCW | 5BMWW | 6WMWW | |
| Brix, °P | (5.4 ± 0.2) * | 4.2 ± 0.1 | 6.4 ± 0.2 | 4.3 ± 0.1 | 7.6 ± 0.2 | 6.1 ± 0.2 |
| Alcohol content, %vol | 5.7 ± 0.1 | 4.2 ± 0.1 | 5.5 ± 0.1 | 4.4 ± 0.3 | 5.7 ± 0.2 | 3.7 ± 0.1 |
| β-Glucan content (Gl) | 86.9 ± 6.1 | 108.6 ± 7.6 | 155.2 ± 10 | 93.1 ± 6.5 | 201.7 ± 14 | 124.1 ± 9 |
| Soluble Nitrogen content (SN) | 628.9 ± 25 | 695.6 ± 97 | 649.7 ± 59 | 610.3 ± 85 | 672.6 ± 94 | 495.2 ± 69 |
| Soluble Nitrogen with Thiol Groups content (SNTG), μM/L | 12.3 ± 0.6 | 33.1 ± 1.6 | 12.3 ± 0.6 | 32.9 ± 1.6 | 29.8 ± 1.5 | 70.2 ± 3.5 |
| Iso-α-humulone content (IBU) (IH) | 17.9 ± 0.07 | 19.8 ± 0.08 | 18.6 ± 0.07 | 25.3 ± 0.1 | 21.1 ± 0.08 | 32.1 ± 0.1 |
| Isoxanthohumol content (IXG) | 1.04 ± 0.05 | 0.94 ± 0.05 | 0.97 ± 0.05 | 0.44 ± 0.02 | 0.99 ± 0.05 | 1.39 ± 0.07 |
| Catechin content (Ct) | 5.45 ± 0.3 | 3.00 ± 0.2 | 4.95 ± 0.2 | 12.36 ± 0.6 | 4.70 ± 0.2 | 9.86 ± 0.5 |
| Quercetin content (Qv) | 0.21 ± 0.01 | 0.31 ± 0.02 | 0.26 ± 0.01 | 0.11 ± 0.01 | 0.25 ± 0.01 | 0.66 ± 0.03 |
| Riboflavin content (Rf) | 1.39 ± 0.15 | 1.24 ± 0.10 | 3.02 ± 0.3 | 0.28 ± 0.03 | 2.21 ± 0.2 | 5.26 ± 0.5 |
| Melanoidin content (Mel) | 106.4 ± 15 | 136.0 ± 19 | 134.0 ± 19 | 35.0 ± 5 | 150.0 ± 21 | 166.0 ± 23 |
| Color, °EBC | 10 ± 0.3 | 9.5 ± 0.3 | 10.5 ± 0.3 | 13.7 ± 0.4 | 9.6 ± 0.3 | 28.0 ± 0.8 |
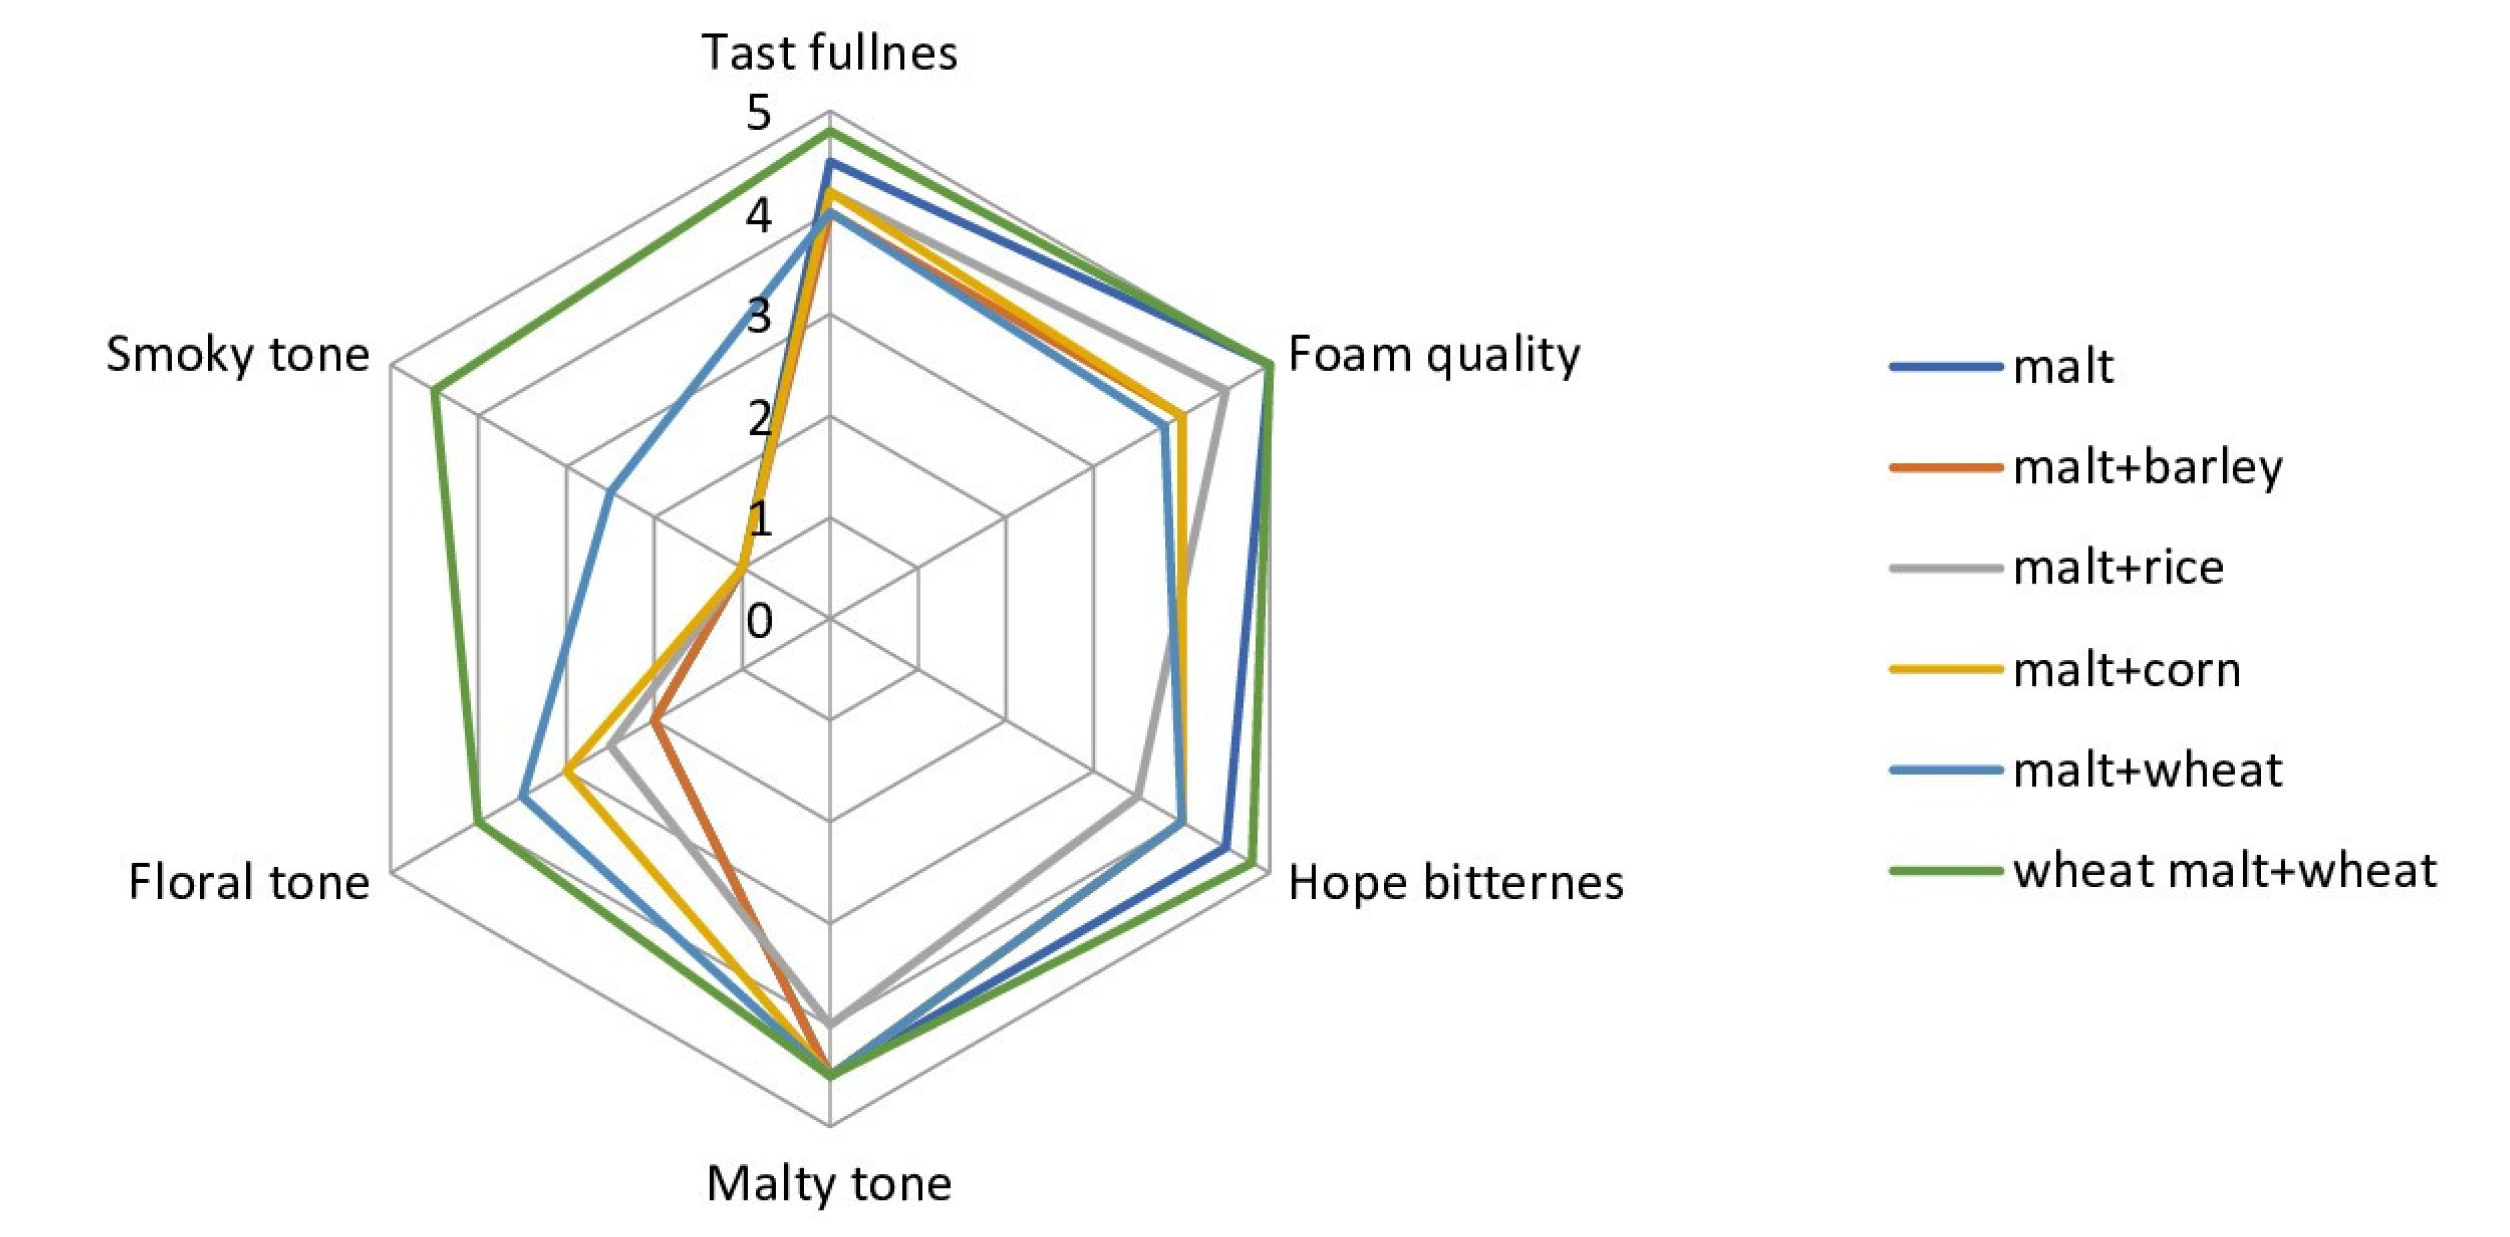
| Descriptor | Pairwise Correlation Coefficient of Different Organic Compounds and Beer Descriptors | |||||||
|---|---|---|---|---|---|---|---|---|
| Gl | SN | NTG | Ct | IG | IKG | Qv | Rf | |
| Taste fullness | −0.37 | −0.58 | 0.32 | 0.49 | 0.49 | 0.56 | 0.50 | 0.54 |
| Foam quality | −0.39 | −0.27 | −0.05 | 0.17 | 0.09 | 0.59 | 0.32 | 0.44 |
| Smoky tone | 0.30 | −0.60 | 0.83 | 0.39 | 0.84 | 0.64 | 0.84 | 0.78 |
| Beer’s Descriptor Type | Pairwise Correlation Coefficient | Correlation (R) and Determination (R2) Coefficients |
|---|---|---|
| Taste fullness | NTG-IG/TF (0.93); Gl-Rf/TF (0.84); Ct-Qv/TF (0.84); NTG-Qv/TF (0.78); Qv-Rf/TF (0.77); IXG-Qv/TF (0.72); Gl-IXG/TF (0.69); SN-Rf/TF (−0.65); SN-NTG/TF (−0.65); Gl-Qv/TF (0.60); SN-IXG/TF (−0.57) | R = 0.86; R2 = 0.75 |
| Foam stability | NTG-IG/FS (0.93); NTG-Qv/FS (0.86); Qv-Rf/FS (0.81); IXG-Qv/FS (0.80); Gl-Rf/FS (−0.74); Ct-IG/FS (0.73); SN-NTG/FS (−0.73); IG-Qv/FS (0.70); SN-IG/FS (−0.69) | R = 0.93; R2 = 0.86 |
| Smoky tone | IG-IXG/ST (0.926); Ct-IG/ST (0.882); Gl-IG/ST (0.881); Ct-Qv/ST (0.881); SN-Rf/ST (−0.871); Gl-SN/ST (0.86); Ct-IXG/ST (0.847); SN-Qv/ST (0.82) | R = 0.93; R2 = 0.86 |
| Sample Code | Raw Material List | Yeast Type | Color | Hopping Technology |
|---|---|---|---|---|
| 1BMW | light barley malt, hop pellets | lager | light | kettle hopping |
| 2BMBW | light barley malt, barley, hop pellets | lager | light | |
| 3BMRW | light barley malt, rice, hop pellets | lager | light | |
| 4BMCW | light barley malt, corn, hop pellets | lager | light | |
| 5BMWW | light barley malt, wheat, hop pellets | lager | light | |
| 6WMWW | light wheat malt, wheat, hop pellets | lager | light |
Disclaimer/Publisher’s Note: The statements, opinions and data contained in all publications are solely those of the individual author(s) and contributor(s) and not of MDPI and/or the editor(s). MDPI and/or the editor(s) disclaim responsibility for any injury to people or property resulting from any ideas, methods, instructions or products referred to in the content. |
© 2023 by the authors. Licensee MDPI, Basel, Switzerland. This article is an open access article distributed under the terms and conditions of the Creative Commons Attribution (CC BY) license (https://creativecommons.org/licenses/by/4.0/).
Share and Cite
Gribkova, I.N.; Eliseev, M.N.; Lazareva, I.V.; Zakharova, V.A.; Sviridov, D.A.; Egorova, O.S.; Kozlov, V.I. The Phenolic Compounds’ Role in Beer from Various Adjuncts. Molecules 2023, 28, 2295. https://doi.org/10.3390/molecules28052295
Gribkova IN, Eliseev MN, Lazareva IV, Zakharova VA, Sviridov DA, Egorova OS, Kozlov VI. The Phenolic Compounds’ Role in Beer from Various Adjuncts. Molecules. 2023; 28(5):2295. https://doi.org/10.3390/molecules28052295
Chicago/Turabian StyleGribkova, Irina N., Mikhail N. Eliseev, Irina V. Lazareva, Varvara A. Zakharova, Dmitrii A. Sviridov, Olesya S. Egorova, and Valery I. Kozlov. 2023. "The Phenolic Compounds’ Role in Beer from Various Adjuncts" Molecules 28, no. 5: 2295. https://doi.org/10.3390/molecules28052295