
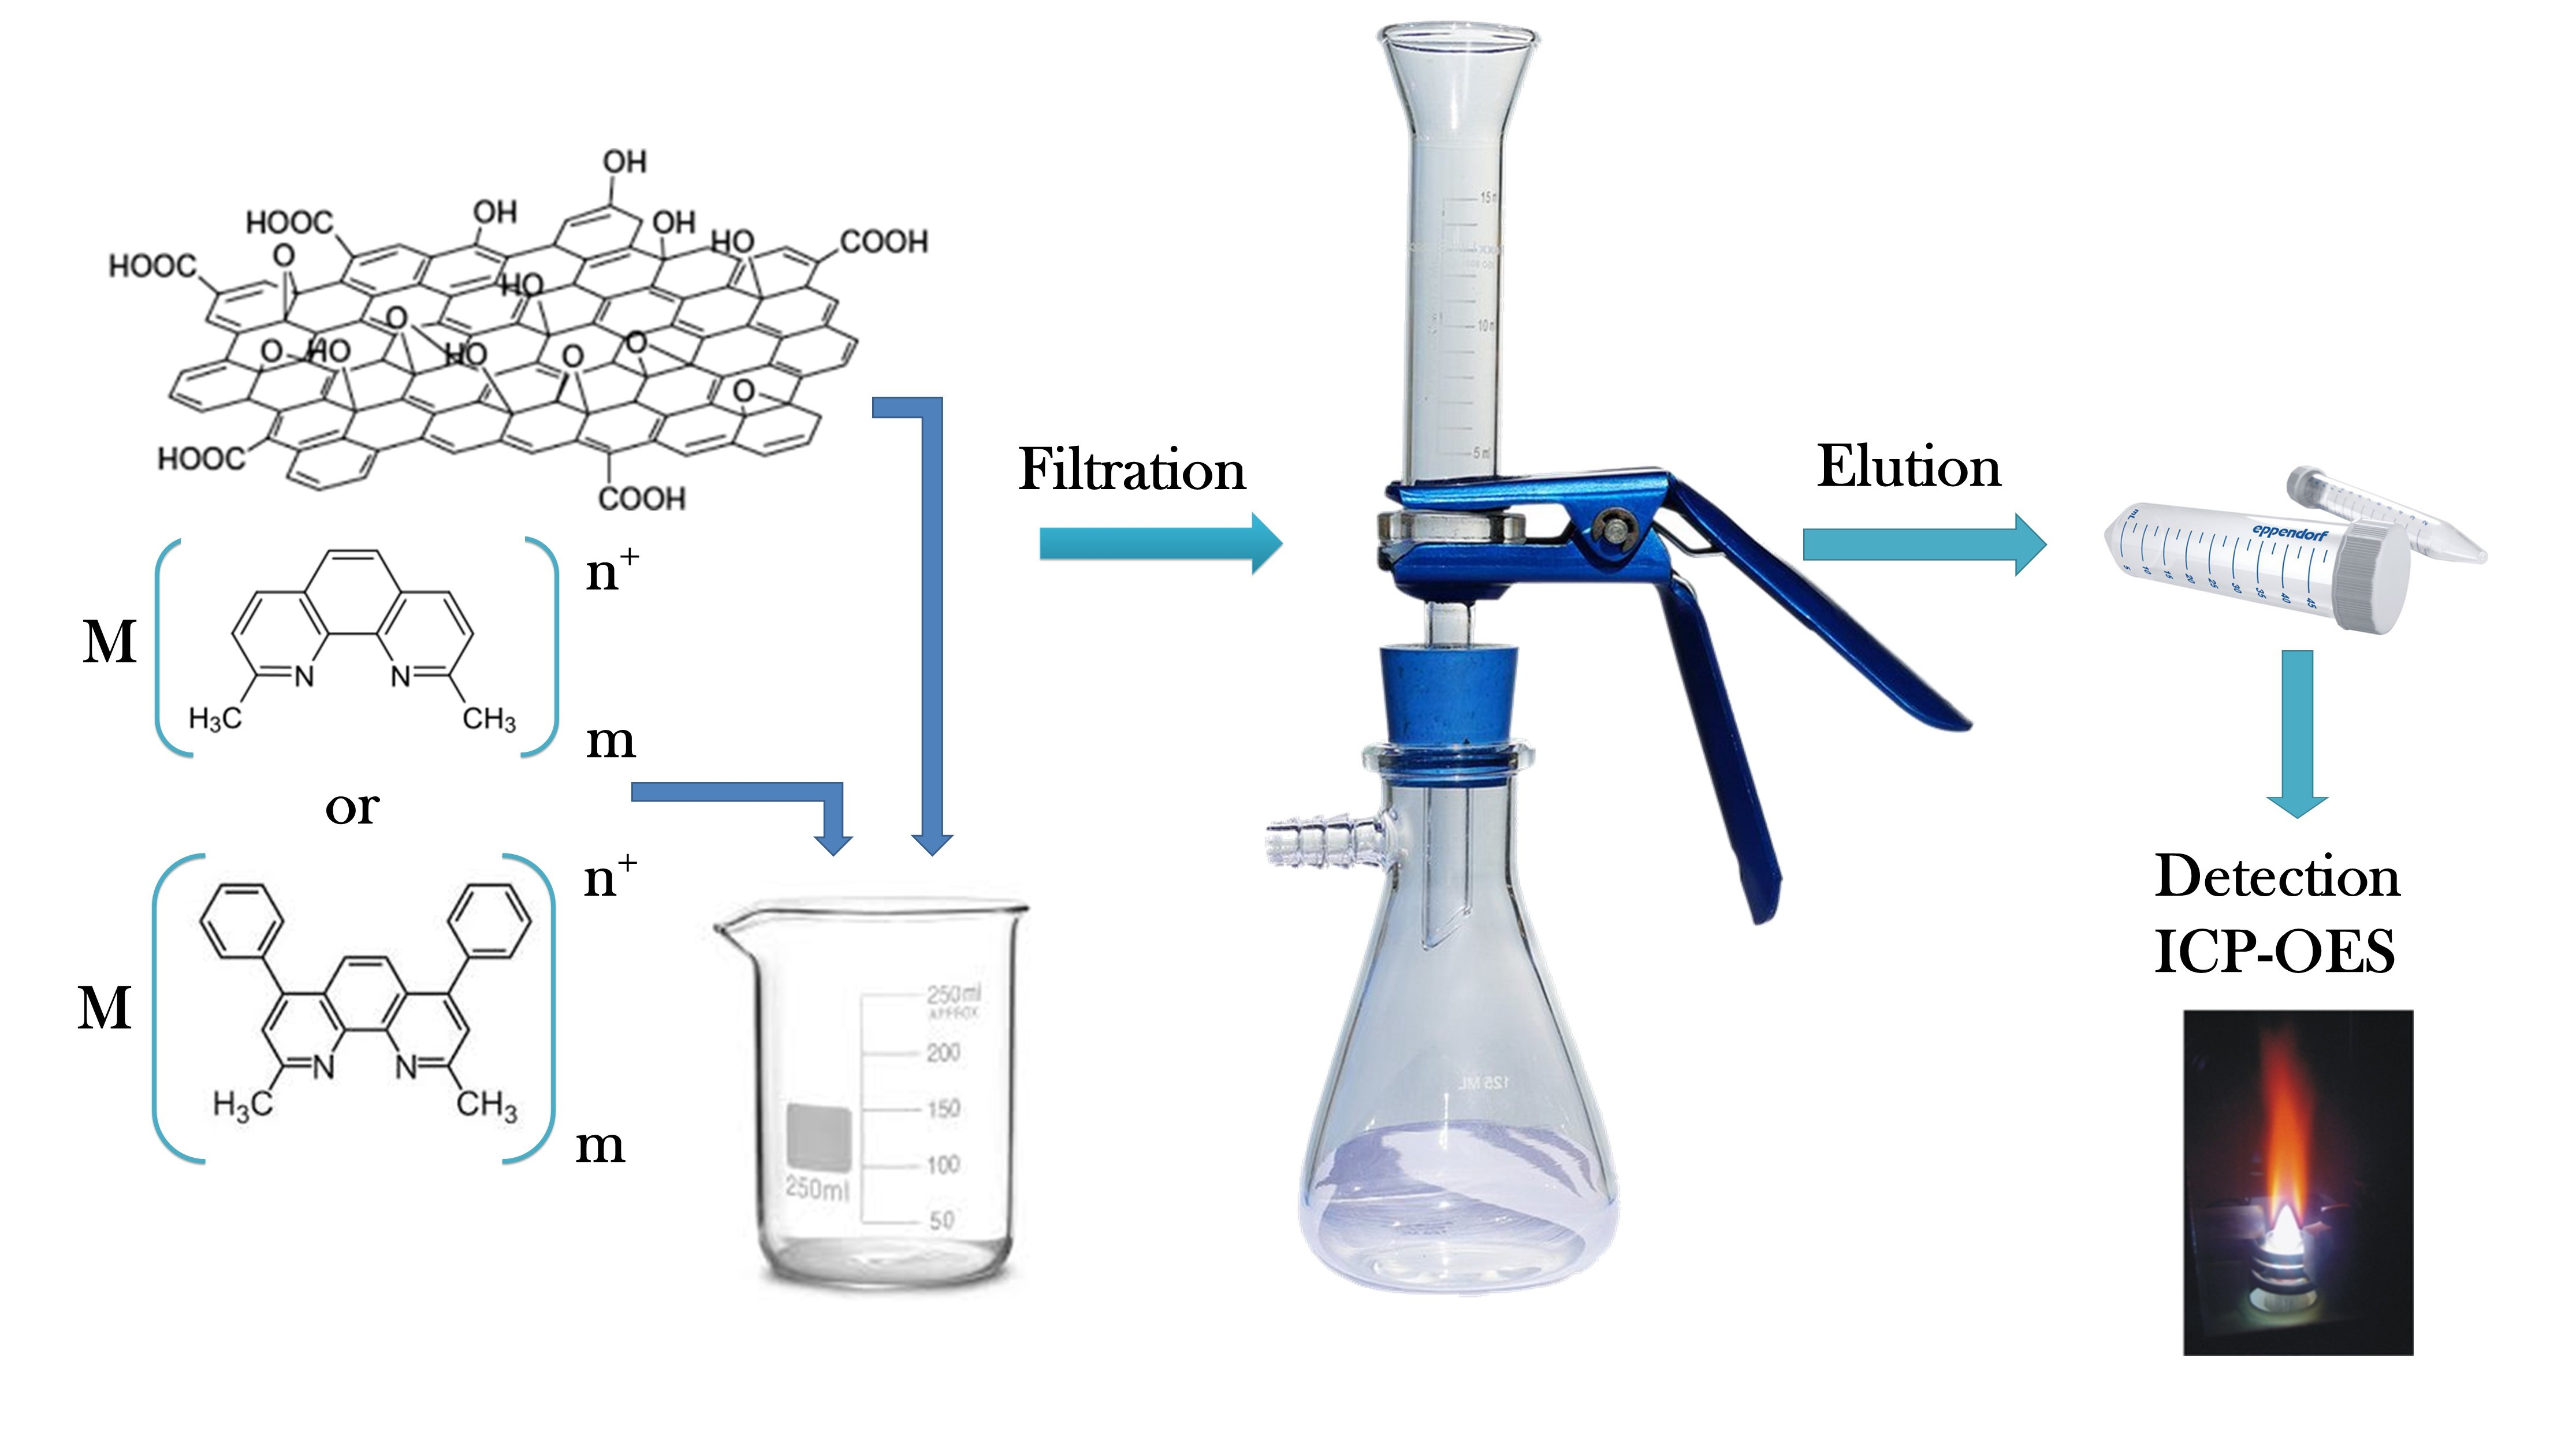
Dispersive Micro-Solid Phase Extraction Using a Graphene Oxide Nanosheet with Neocuproine and Batocuproine for the Preconcentration of Traces of Metal Ions in Food Samples

Abstract
:
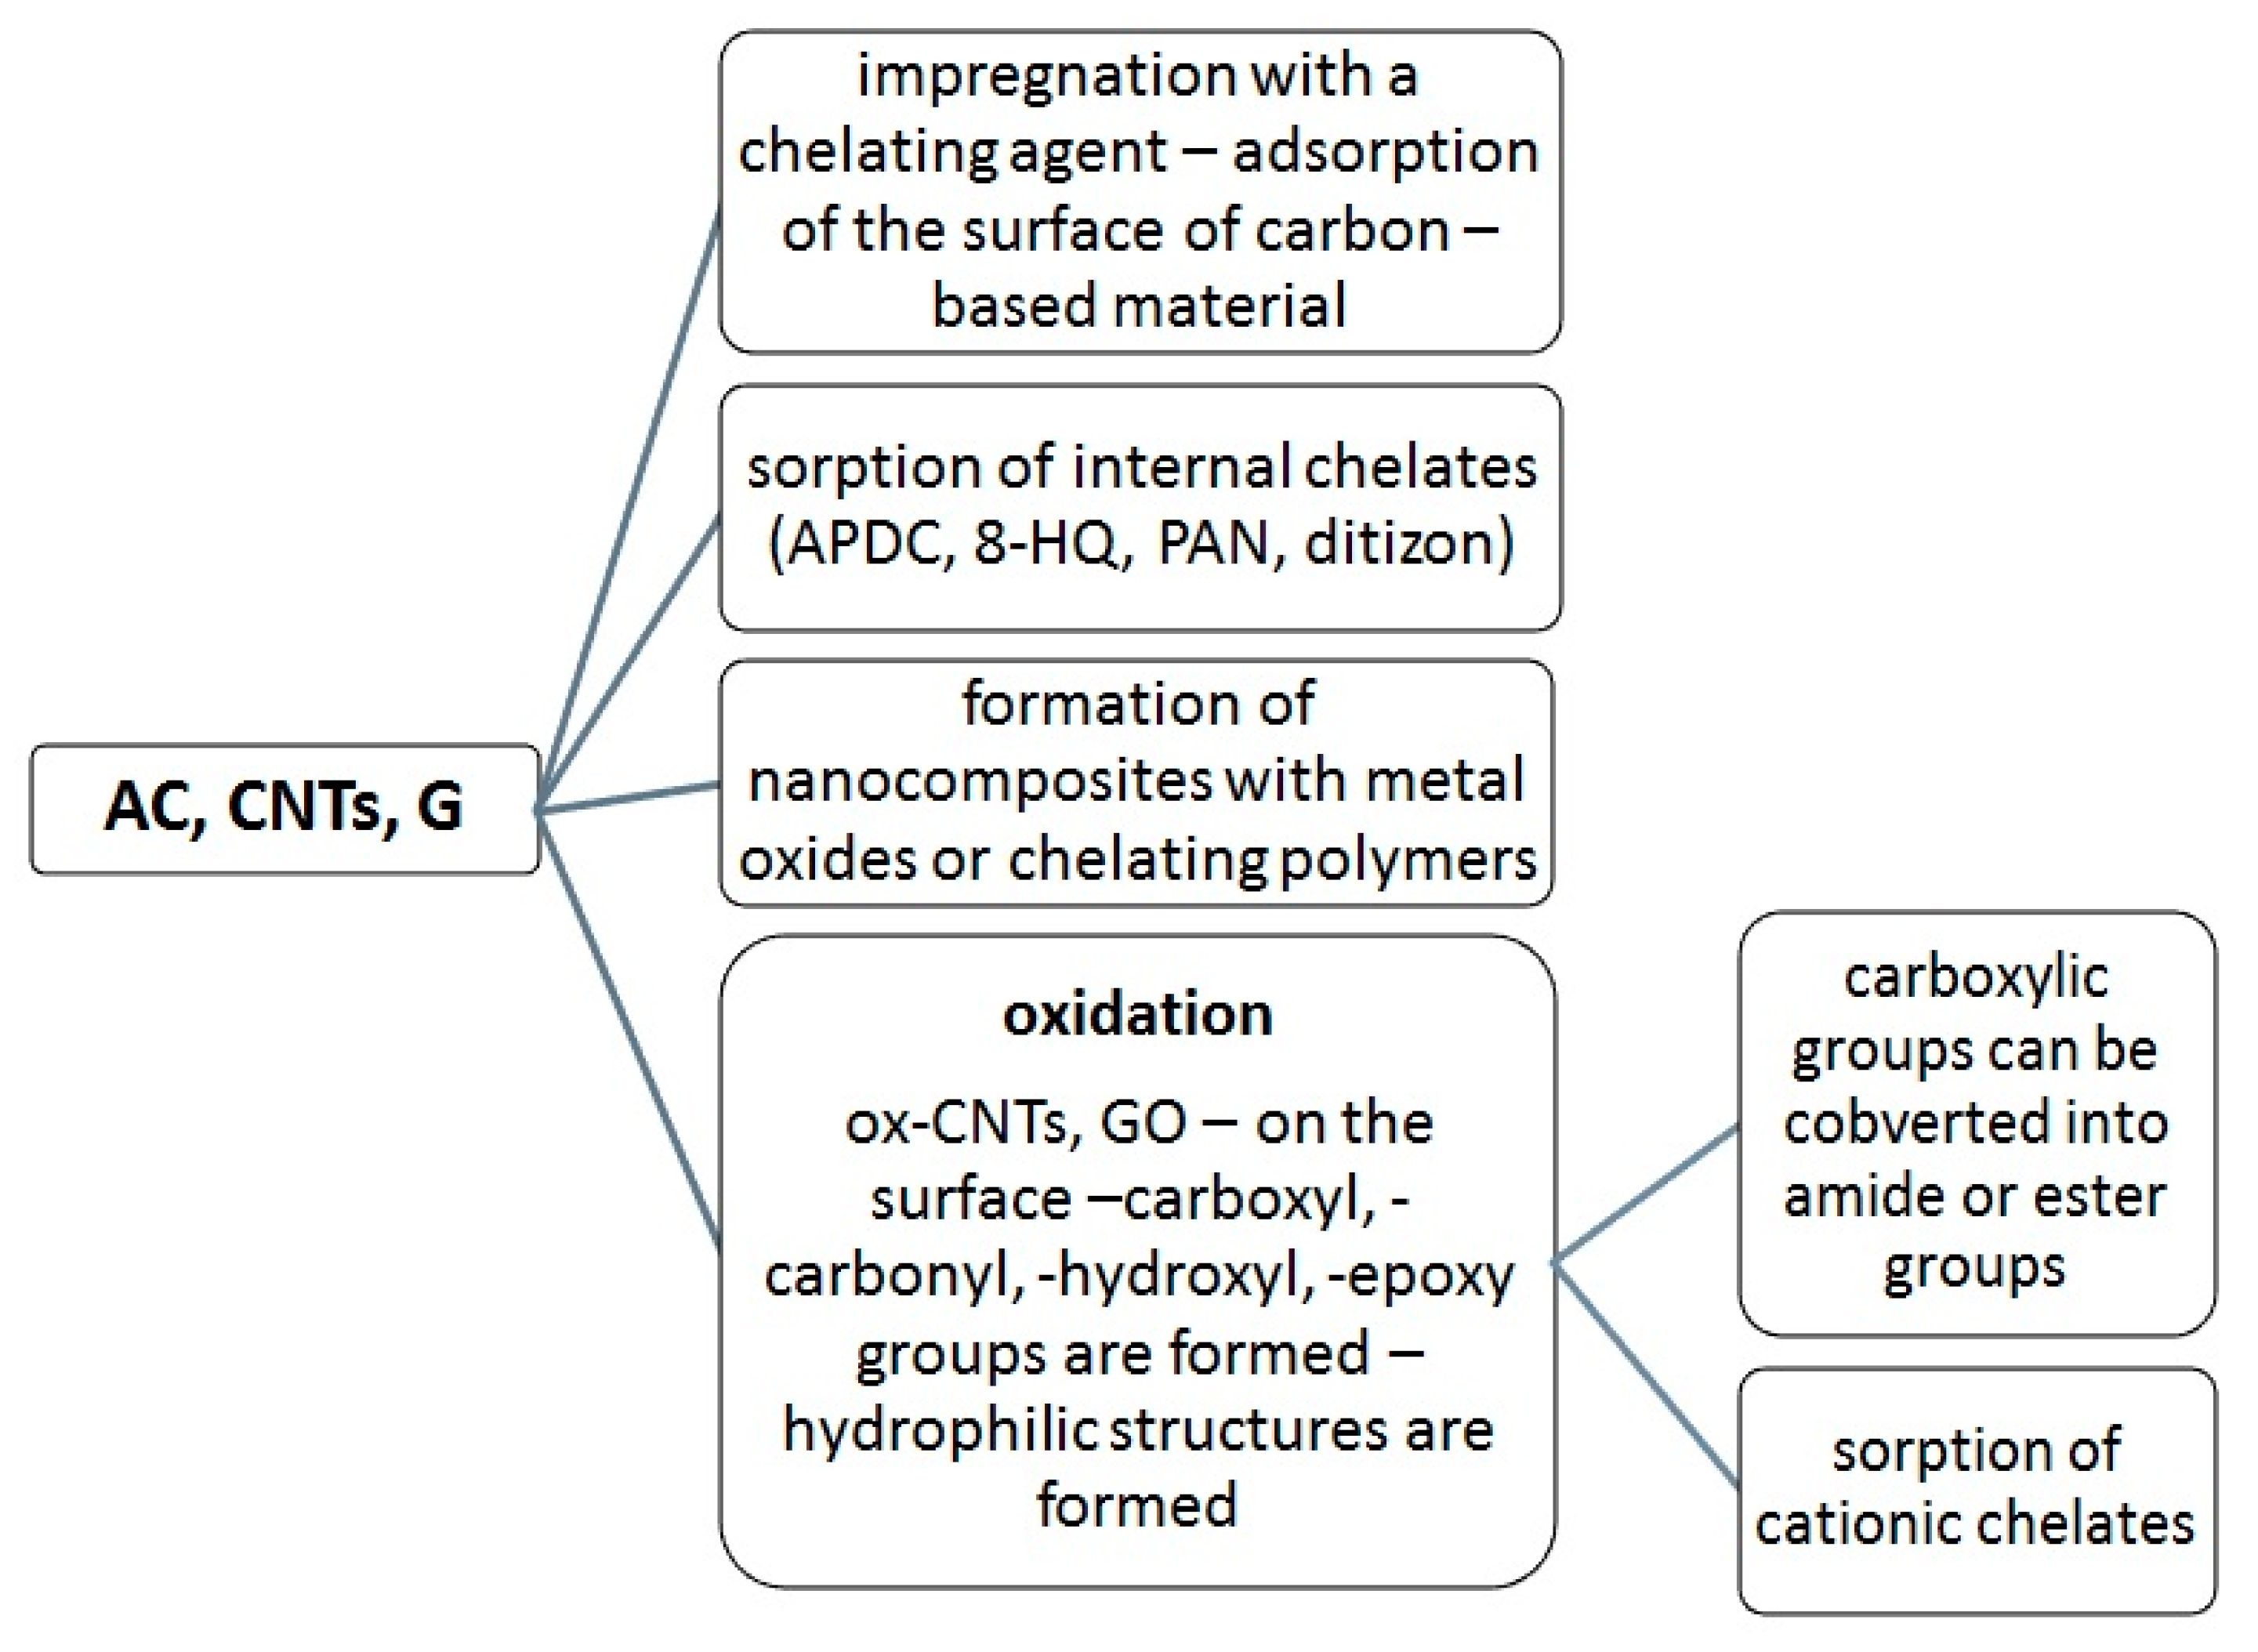
1. Introduction
2. Results and Discussion
2.1. Influence of the Analytical Conditions on the Sorption Process
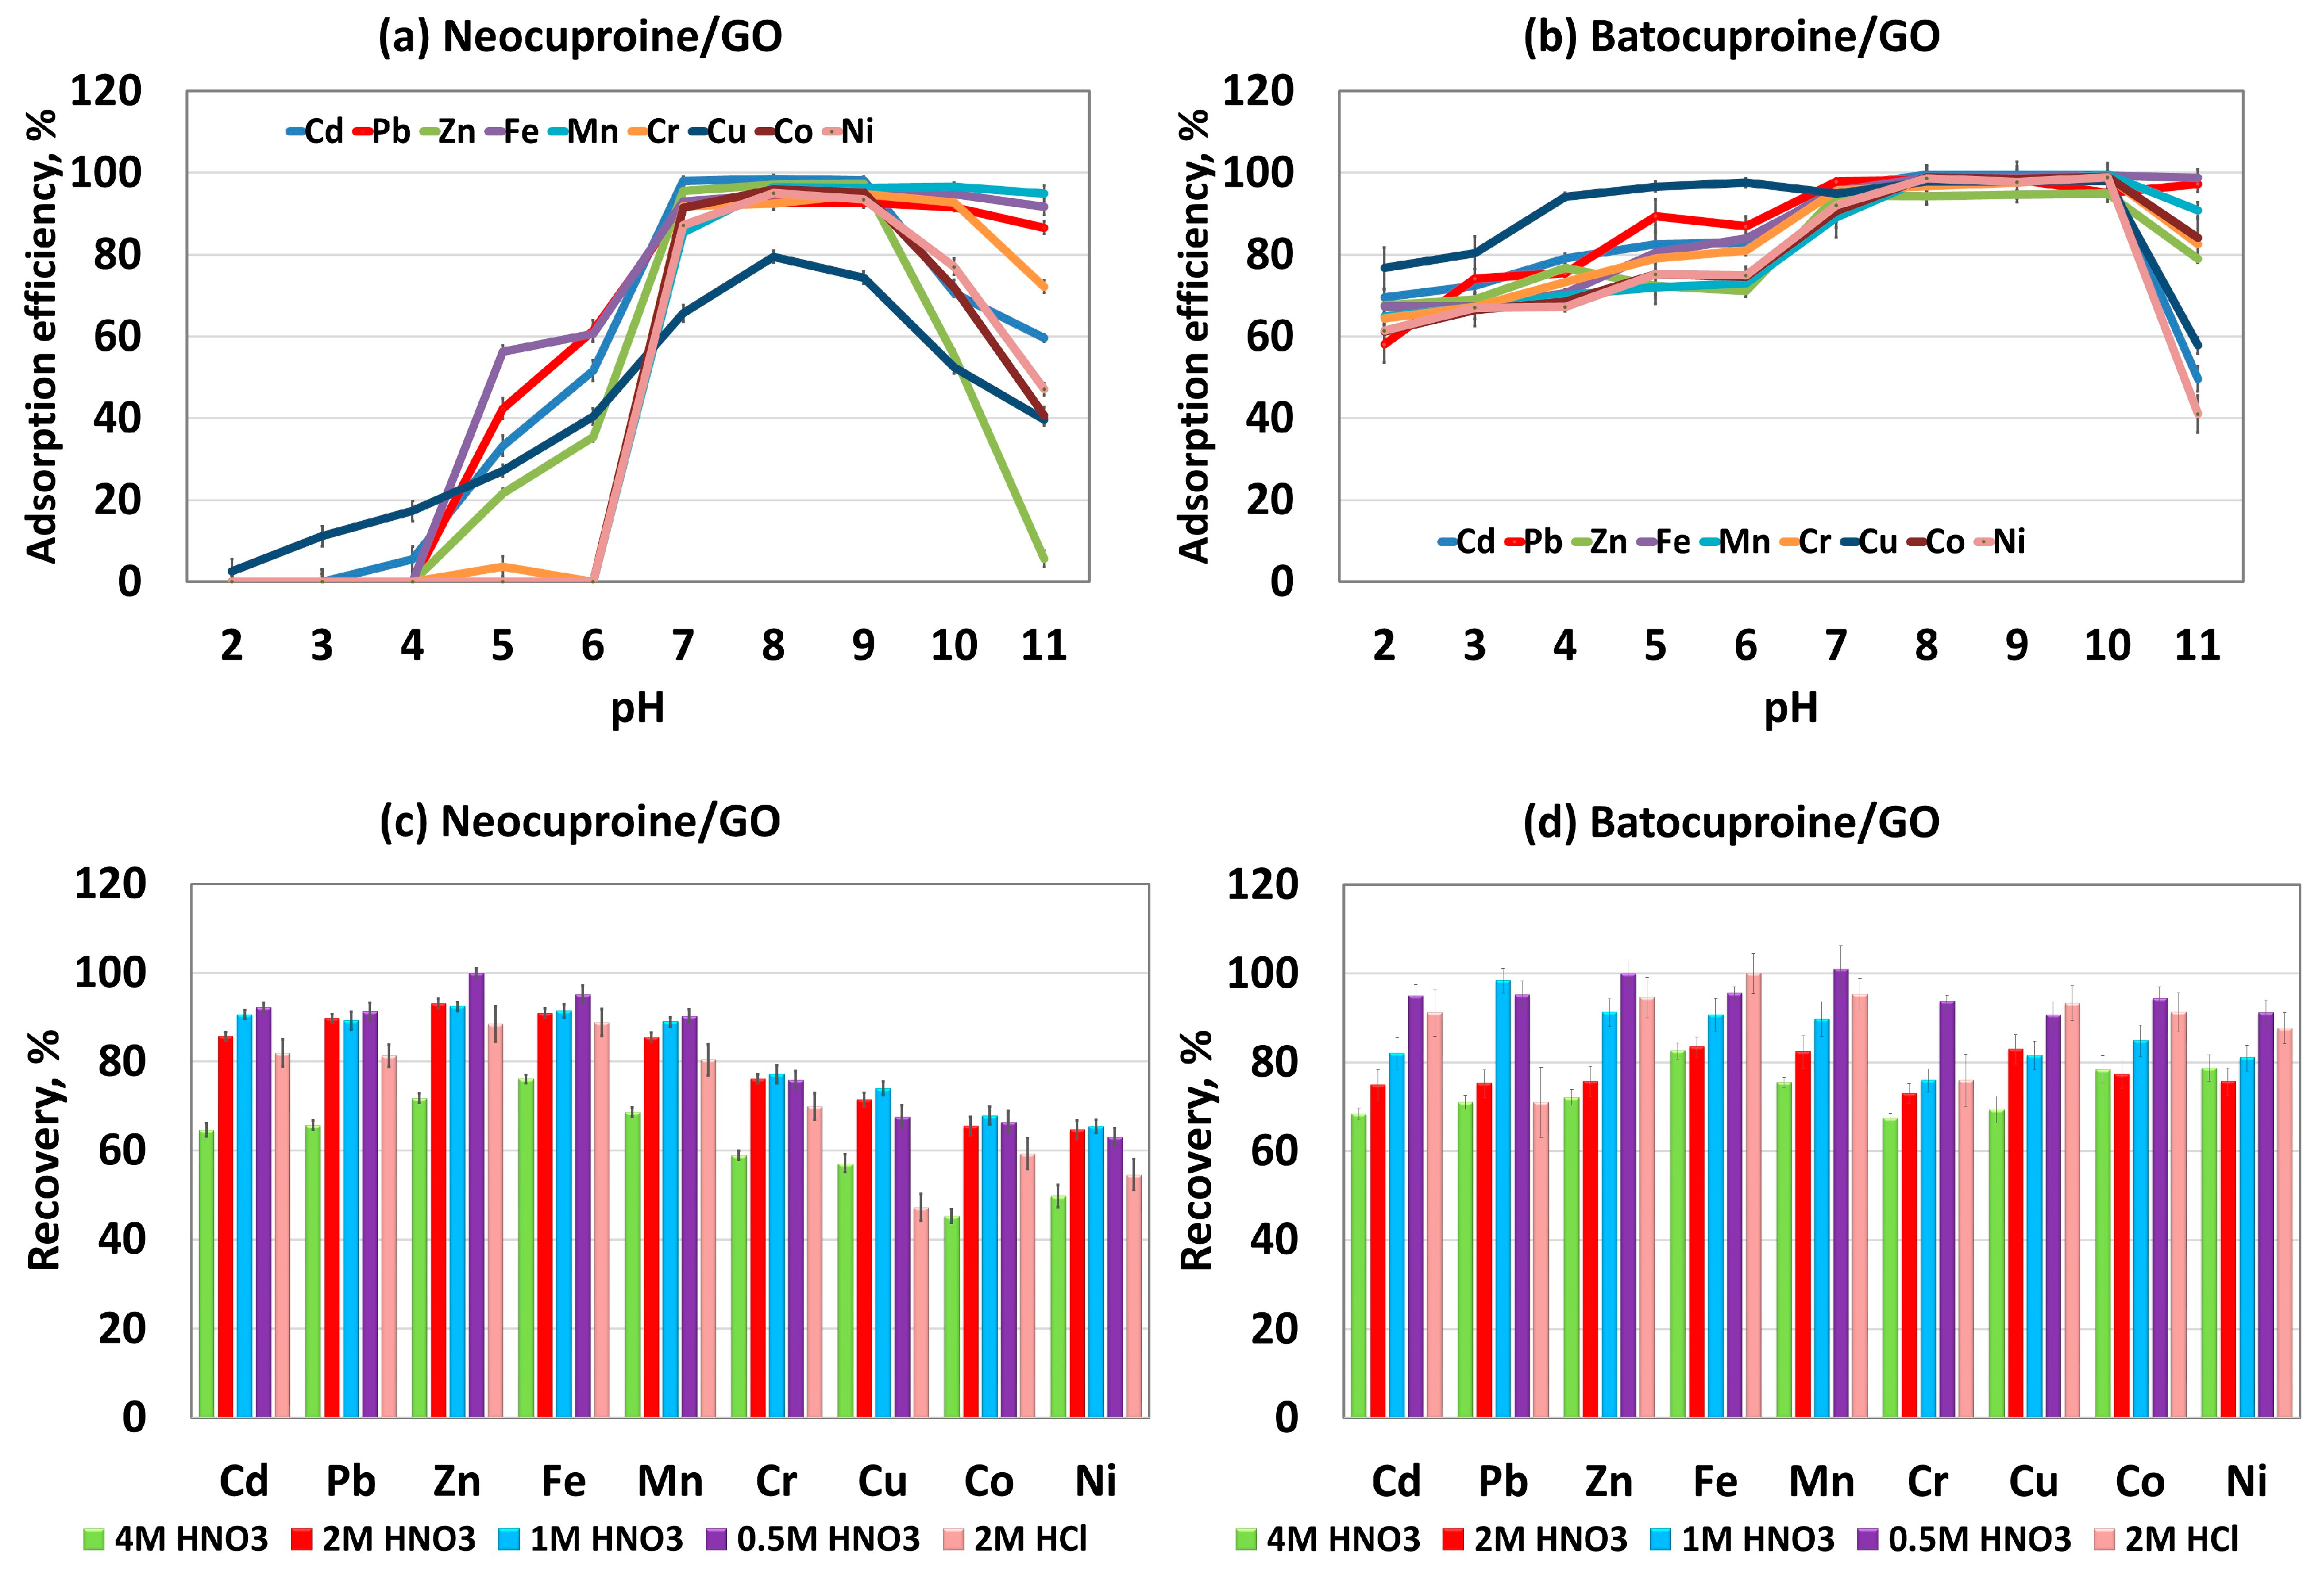
2.1.1. Effect of pH
2.1.2. Study of Desorption Conditions
2.1.3. Effect of the Amount of Adsorbent and Chelating Agent
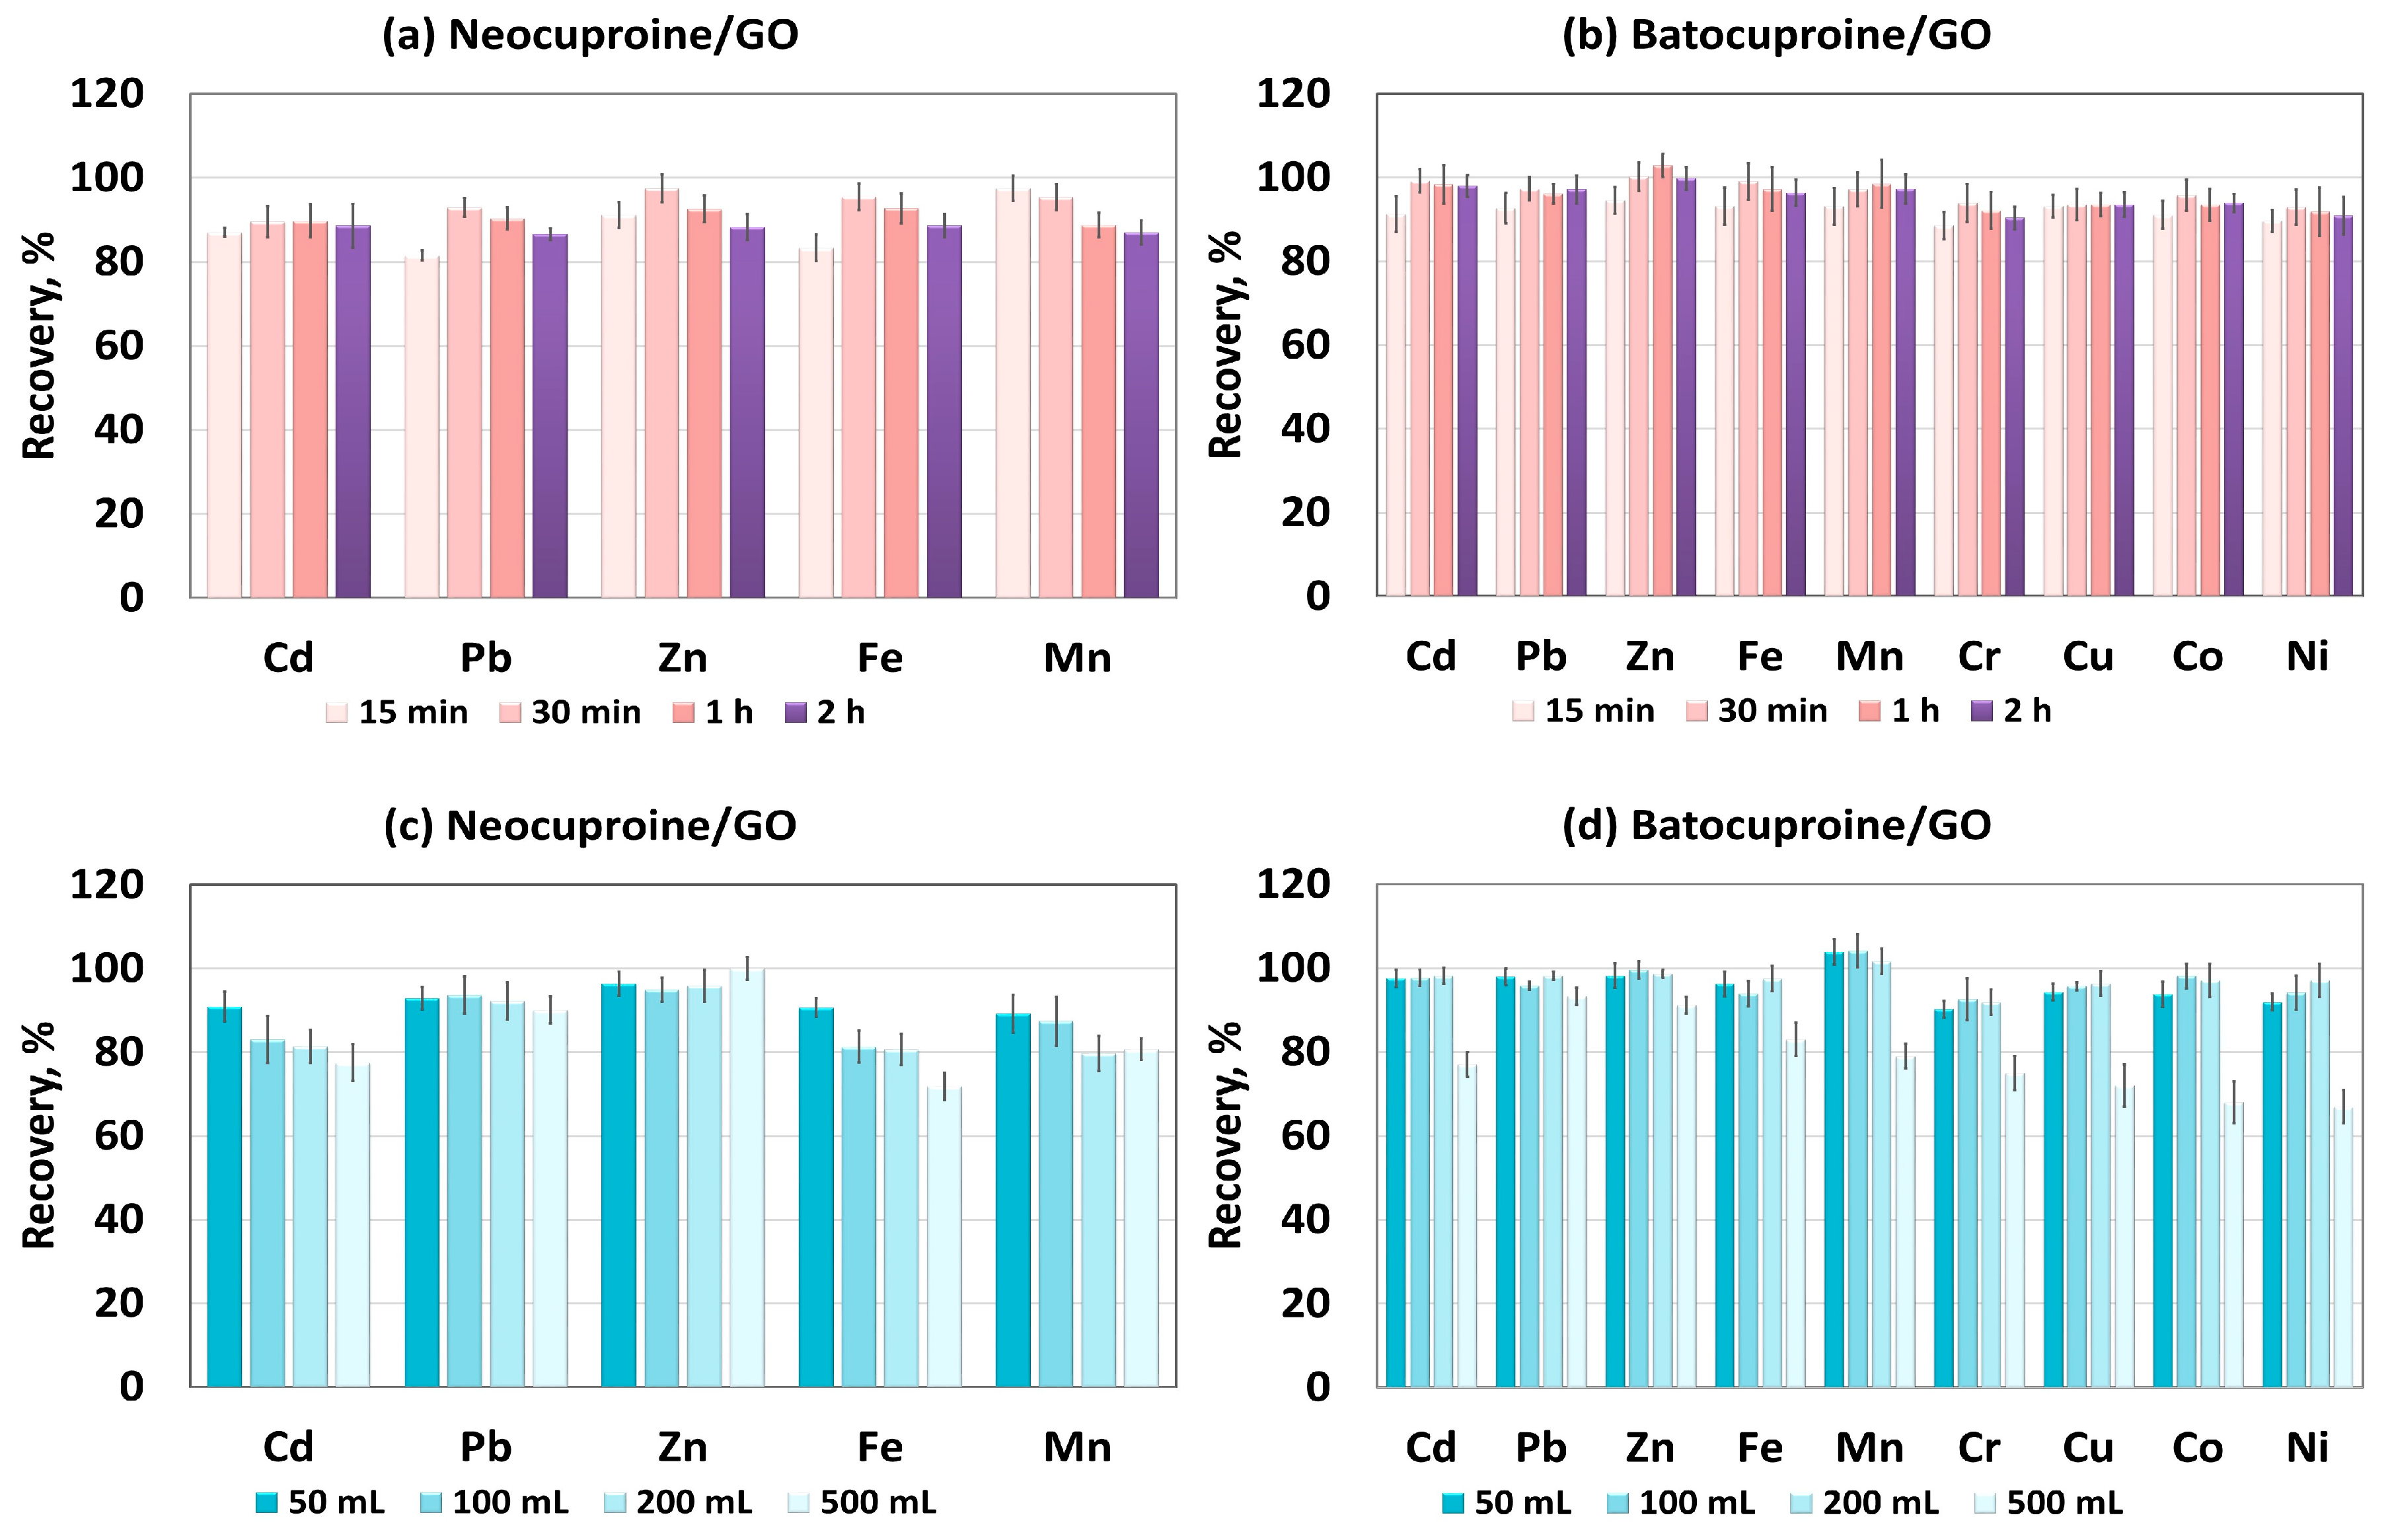
2.1.4. Effect of the Time of Contact and Sample Volume
2.1.5. Interferences Study
2.2. Analytical Performance
2.3. Application
3. Materials and Methods
3.1. Instruments
3.2. Reagents and Solutions
3.3. Synthesis and Characterization of GO
3.4. Sample Preparation
3.5. Dµ-SPE Procedure
4. Conclusions
Funding
Institutional Review Board Statement
Informed Consent Statement
Data Availability Statement
Conflicts of Interest
Sample Availability
References
- Ashtari, P.; Wang, K.; Yang, X.; Huang, S.; Yamini, Y. Novel separation and preconcentration of trace amounts of copper(II) in water samples based on neocuproine modified magnetic microparticles. Anal. Chim. Acta 2005, 550, 18–23. [Google Scholar] [CrossRef]
- Rohanifar, A.; Rodriguez, L.B.; Devasurendra, A.M.; Alipourasiabi, N.; Anderson, J.L.; Kirchhoff, J.R. Solid-phase mocroextraction of heavy metals in natural water with a polypyrrole/carbon nanotube/1,10-phenanthroline composite sorbent material. Talanta 2018, 188, 570–577. [Google Scholar] [CrossRef] [PubMed]
- Molinari, R.; Poerio, T.; Cassano, R.; Picci, N.; Argurio, P. Copper(II) removal from wastewaters by a new synthesized selective extractant and SLM viability. Ind. Eng. Chem. Res. 2004, 43, 623–628. [Google Scholar] [CrossRef]
- Pyrzynska, K. Preconcentration and Removal of Pb(II) Ions from Aqueous Solutions Using Graphene-Based Nanomaterials. Materials 2023, 16, 1078. [Google Scholar] [CrossRef] [PubMed]
- Azzouz, A.; Kailasa, S.K.; Lee, S.S.; Rascón, A.J.; Ballesteros, E.; Zhang, M.; Kim, K.H. Review of nanomaterials as sorbents in solid-phase extraction for environmental samples. TrAC Trends Anal. Chem. 2018, 108, 347–369. [Google Scholar] [CrossRef]
- Trevino, M.J.S.; Zarazua, S.; Płotka-Wasylka, J. Nanosorbents as materials for extraction processes of environmental contaminants and others. Molecules 2022, 27, 1067. [Google Scholar] [CrossRef]
- Oviedo, M.N.; Botella, M.B.; Fiorentini, E.F.; Pacheco, P.; Wuilloud, R.G. A simple and green dispersive micro-solid phase extraction method by combined application of graphene oxide and a magnetic ionic liquid for selective determination of inorganic antimony species in water, tea and honey samples. Spectrochim. Acta Part B 2023, 199, 106591. [Google Scholar] [CrossRef]
- Behbahani, M.; Tapeh, N.A.G.; Mahyari, M.; Pourali, A.R.; Amin, B.G.; Shaabani, A. Monitoring of trace amounts of heavy metals in different food and water samples by flame atomic absorption spectrophotometer after preconcentration by amine-functionalized graphene nanosheet. Environ. Monit. Assess 2014, 186, 7245–7257. [Google Scholar] [CrossRef]
- Ghazaghi, M.; Mousavi, H.Z.; Rashidi, A.M.; Shirkhanloo, H.; Rahighi, R. Graphene-silica hybrid in efficient preconcentration of heavy metal ions via novel single-step method of moderate centrifugation-assisted dispersive micro solid phase extraction. Talanta 2016, 150, 476–484. [Google Scholar] [CrossRef]
- Ghazaghi, M.; Shirkhanloo, H.; Mousavi, H.Z.; Rashidi, A.M. Ultrasound-assisted dispersive solid phase extraction of cadmium(II) and lead(II) using a hybrid nanoadsorbent composed of graphene and the zeolite clinoptilolite. Microchim. Acta 2015, 182, 1263–1272. [Google Scholar] [CrossRef]
- Zawisza, B.; Sitko, R.; Malicka, E.; Talik, E. Graphene oxide as a solid sorbent for the preconcentration of cobalt, nickel, copper, zinc and lead prior to determination by energy-dispersive X-ray fluorescence spectrometry. Anal. Methods 2013, 5, 6425–6430. [Google Scholar] [CrossRef]
- Pourjavid, M.R.; Sehat, A.A.; Hosseini, M.H.; Rezaee, M.; Arabieh, M.; Yousefi, S.R.; Jamali, M.R. Use of 2-(tert-butoxy)-N-(3-carbamothioylphenyl) acetamide and graphene oxide for separation and preconcentration of Fe(III), Ni(II), cu(II) and Zn(II) ions in different samples. Chin. Chem. Lett. 2014, 2, 791–793. [Google Scholar] [CrossRef]
- Su, S.; Chen, B.; He, M.; Hu, B. Graphene oxide–silica composite coating hollow fiber solid phase microextraction online coupled with inductively coupled plasma mass spectrometry for the determination of trace heavy metals in environmental water samples. Talanta 2014, 123, 1–9. [Google Scholar] [CrossRef] [PubMed]
- Sereshti, H.; Farahani, M.V.; Baghdadi, M. Trace determination of chromium(VI) in environmental water samples using innovative thermally reduced graphene (TRG) modified SiO2 adsorbent for solid phase extraction and UV–vis spectrophotometry. Talanta 2016, 146, 662–669. [Google Scholar] [CrossRef]
- Aghagoli, M.J.; Shemirani, F. Hybrid nanosheets composed of molybdenum disulfide and reduced graphene oxide for enhanced solid phase extraction of Pb(II) and Ni(II). Microchim. Acta 2017, 184, 237–244. [Google Scholar] [CrossRef]
- Bahar, S.; Babamiri, B. Determination of Zn(II) in rock and vegetable samples after acidic digestion followed by ultrasoundassisted solid-phase extraction with reduced graphene oxide as novel sorbent, in combination with flame atomic absorption spectrometry. J. Iran Chem. Soc. 2014, 11, 1039–1045. [Google Scholar] [CrossRef]
- Sun, J.; Liang, Q.; Han, Q.; Zhang, X.; Ding, M. One-step synthesis of magnetic graphene oxide nanocomposite and its application in magnetic solid phase extraction of heavy metal ions from biological samples. Talanta 2015, 132, 557–563. [Google Scholar] [CrossRef]
- Banazadeh, A.; Mozaffari, S.; Osoli, B. Facile synthesis of cysteine functionalized magnetic graphene oxide nanosheets: Application in solid phase extraction of cadmium from environmental sample. J. Environ. Chem. Eng. 2015, 3, 2801–2808. [Google Scholar] [CrossRef]
- Ebrahimi, B.; Bahar, S.; Moedi, S.E. Evaluation of graphene as a solid-phase extraction sorbent for the preconcentration and determination of trace amounts of nickel in food samples prior to flame atomic absorption spectrometry. J. AOAC Int. 2015, 98, 822–827. [Google Scholar] [CrossRef]
- Gouda, A.A. Solid-phase extraction using multiwalled carbon nanotubes and quinalizarin for preconcentration and determination of trace amounts of some heavy metals in food, water and environmental samples. Int. J. Environ. Anal. Chem. 2014, 94, 1210–1222. [Google Scholar] [CrossRef]
- Aydemir, N.; Tokman, N.; Akarsubasi, A.T.; Baysal, A.; Akman, S. Determination of some trace elements by flame atomic absorption spectrometry after preconcentration and separation by Escherichia coli immobilized on multiwalled carbon nanotubes. Microchim. Acta 2011, 175, 185–191. [Google Scholar] [CrossRef]
- Alothman, Z.A.; Habila, M.; Yilmaz, E.; Soylak, M. Solid phase extraction of cd(II), Pb(II), Zn(II) and Ni(II) from food samples using multiwalled carbon nanotubes impregnated with 4-(2-thiazolylazo) resorcinol. Microchim. Acta 2012, 177, 397–403. [Google Scholar] [CrossRef]
- Baena, J.R.; Gallego, M.; Valcarcel, M. Fullerenes in the analytical sciences. Trends Anal. Chem. 2002, 21, 187–198. [Google Scholar] [CrossRef]
- Pereira, M.; Pereira-Filho, E.; Berndt, H.; Arruda, M. Determination of cadmium and lead at low levels by using preconcentration at fullerene coupled to thermospray flame furnace atomic absorption spectrometry. Spectrochim. Acta Part B 2004, 59, 515–521. [Google Scholar] [CrossRef]
- Wanekaya, A.K. Applications of nanoscale carbon-based materials in heavy metal sensing and detection. Analyst 2011, 136, 4383–4391. [Google Scholar] [CrossRef] [PubMed]
- Karousis, N.; Suarez-Martinez, I.; Ewels, C.P.; Tagmatarchis, N. Structure, properties, functionalization, and applications of carbon nanohorns. Chem. Rev. 2016, 116, 4850–4883. [Google Scholar] [CrossRef]
- Wen, Y.; Chen, L.; Li, J.; Liu, D.; Chen, L. Recent advances in solid-phase sorbents for sample preparation prior to chromatographic analysis. Trends Anal. Chem. 2014, 59, 26–41. [Google Scholar] [CrossRef]
- He, M.; Huang, L.; Zhao, B.; Chen, B.; Hu, B. Advanced functional materials in solid phase extraction for ICP-MS determination of trace elements and their species—A review. Anal. Chim. Acta 2017, 973, 1–24. [Google Scholar] [CrossRef] [PubMed]
- Imyim, A.; Daorattanachai, P.; Unob, F. Determination of cadmium, nickel, lead, and zinc in fish tissue by flame and graphite furnace atomic absorption after extraction with pyrrolidine dithiocarbamate and activated carbon. Anal. Lett 2013, 46, 2101–2110. [Google Scholar] [CrossRef]
- Barfi, B.; Rajabi, M.; Zadeh, M.M.; Ghaedi, M.; Salavati-Niasari, M.; Sahraei, R. Extraction of ultra-traces of lead, chromium and copper using ruthenium nanoparticles loaded on activated carbon and modified with N,N-bis-(α-methylsalicylidene)-2,2-dimethylpropane-1,3-diamine. Microchim. Acta 2015, 182, 1187–1196. [Google Scholar] [CrossRef]
- Mahmoud, M.E.; Ahmed, S.B.; Osman, M.M.; Abdel-Fattah, T.M. A novel composite of nanomagnetite-immobilized-baker’s yeast on the surface of activated carbon for magnetic solid phase extraction of hg(II). Fuel 2015, 139, 614–621. [Google Scholar] [CrossRef]
- Zhang, L.; Li, Z.; Du, X.; Li, R.; Changa, X. Simultaneous separation and preconcentration of Cr(III), Cu(II), Cd(II) and Pb(II) from environmental samples prior to inductively coupled plasma optical emission spectrometric determination. Spectrochim. Acta B 2012, 86, 443–448. [Google Scholar] [CrossRef]
- Alothman, Z.A.; Yilmaz, E.; Habila, M.; Soylak, M. Solid phase extraction of metal ions in environmental samples on 1-(2-pyridylazo)-2-naphthol impregnated activated carbon cloth. Ecotoxicol. Environ Saf. 2015, 112, 74–79. [Google Scholar] [CrossRef]
- Tajik, S.; Taher, M.A. A new sorbent of modified MWCNTs for column preconcentration of ultra-trace amounts of zinc in biological and water samples. Desalination 2011, 278, 57–64. [Google Scholar] [CrossRef]
- Tu, Z.; He, Q.; Chang, X.; Hu, Z.; Gao, R.; Zhang, L.; Li, Z. 1-(2-Formamidoethyl)-3-phenylurea functionalized activated carbon for selective solid-phase extraction and preconcentration of metal ions. Anal. Chim. Acta 2009, 649, 252–257. [Google Scholar] [CrossRef]
- Li, Z.; Chang, X.; Zou, X.; Zhu, X.; Nie, R.; Hu, Z.; Li, R. Chemically-modified activated carbon with ethylenediamine for selective solid-phase extraction and preconcentration of metal ions. Anal. Chim. Acta 2009, 632, 272–277. [Google Scholar] [CrossRef]
- Li, R.; Chang, X.; Li, Z.; Zang, Z.; Hu, Z.; Li, D.; Tu, Z. Multiwalled carbon nanotubes modified with 2-aminobenzothiazole modified for uniquely selective solid-phase extraction and determination of Pb(II) ion in water samples. Microchim. Acta 2011, 172, 269–276. [Google Scholar] [CrossRef]
- Savio, M.; Parodi, B.; Martinez, L.D.; Smichowski, P.; Gil, R.A. On-line solid phase extraction of Ni and Pb using carbon nanotubes and modified carbon nanotubes coupled to ETAAS. Talanta 2011, 85, 245–251. [Google Scholar] [CrossRef]
- Tan, M.; Liu, X.; Li, W.; Li, H. Enhancing sorption capacities for copper(II) and lead(II) under weakly acidic conditions by L-tryptophan-functionalized graphene oxide. J. Chem. Eng. Data 2015, 60, 1469–1475. [Google Scholar] [CrossRef]
- Zhu, X.; Cui, Y.; Chang, X.; Wang, H. Selective solid-phase extraction and analysis of trace-level Cr(III), Fe (III), Pb(II), and Mn(II) ions in wastewater using diethylenetriamine-functionalized carbon nanotubes dispersed in graphene oxide colloids. Talanta 2016, 146, 358–363. [Google Scholar] [CrossRef]
- Yang, B.; Gong, Q.; Zhao, L.; Sun, H.; Ren, N.; Qin, J.; Xu, J.; Yang, H. Preconcentration and determination of lead and cadmium in water samples with a MnO2 coated carbon nanotubes by using ETAAS. Desaliantion 2011, 278, 65–69. [Google Scholar] [CrossRef]
- Su, S.; Chen, B.; He, M.; Hu, B.; Xiao, Z. Determination of trace/ultratrace rare earth elements in environmental samples by ICP-MS after magnetic solid phase extraction with Fe3O4@SiO2@polyaniline–graphene oxide composite. Talanta 2014, 119, 458–466. [Google Scholar] [CrossRef]
- Feist, B.; Sitko, R. Fast and sensitive determination of heavy metal ions as batophenanthroline chelates in food and water samples after dispersive micro-solid phase extraction using graphene oxide as sorbent. Microchem. J. 2019, 147, 30–36. [Google Scholar] [CrossRef]
- Feist, B.; Pilch, M.; Nycz, J. Graphene oxide chemically modified with 5-amino-1,10-phenanthroline as sorbent for separation and preconcentration of trace amount of lead(II). Microchim. Acta 2019, 186, 91–98. [Google Scholar] [CrossRef] [PubMed]
- Gouda, A.A.; Amin, A.H.; Ali, I.S.; Al Malah, Z. Green Dispersive Micro Solid- Phase Extraction using Multiwalled Carbon Nanotubes for Preconcentration and Determination of Cadmium and Lead in Food, Water, and Tobacco Samples. Cur. Anal. Chem. 2018, 16, 381–392. [Google Scholar] [CrossRef]
- Lari, A.; Esmaeili, N.; Ghafari, H. Ionic liquid functionlized on multiwall carbon nanotubes for nickel and lead determination in human serum and urine sample by micro solid-phase extraction. Anal. Methods Environ. Chem. J. 2021, 4, 72–85. [Google Scholar] [CrossRef]
- Babaei, A.; Zeeb, M.; Es-haghi, A. Magnetic dispersive solid-phase extraction based on graphene oxide/Fe3O4@polythionine nanocomposite followed by atomic absorption spectrometry for zinc monitoring in water, flour, celery and egg. J. Sci. Food Agric. 2018, 98, 3571–3579. [Google Scholar] [CrossRef]
- Seval, K.; Akdoğan, A. Silica nanoparticle-covered Graphene Oxide as solid-phase extraction sorbent coupled with FAAS for the determination of some of heavy metals in water sample. Int. J. Environ. Anal. Chem. 2020, 102, 8402–8418. [Google Scholar] [CrossRef]
- Abbasabadi, M.K.; Shirkhanloo, H. Speciation of cadmium in human blood samples based on Fe3O4-supported naphthalene-1-thiol functionalized graphene oxide nanocomposite by ultrasound-assisted dispersive magnetic micro solid phase extraction. J. Pharm. Biomed. Anal. 2020, 189, 113455. [Google Scholar] [CrossRef]
- Rofouei, M.K.; Jamshidi, S.; Seidi, S.; Saleh, A. A bucky gel consisting of Fe3O4 nanoparticles, graphene oxide and ionic liquid as an efficient sorbent for extraction of heavy metal ions from water prior to their determination by ICP-OES. Microchim. Acta. 2017, 184, 3425–3432. [Google Scholar] [CrossRef]
- Li, Z.; Wang, R.; Young, R.J.; Deng, L.; Yang, F.; Hao, L.; Jiao, W.; Liu, W. Control of the Functionality of Graphene Oxide for its Application in Epoxy Nanocomposites. Polymer 2013, 54, 6437–6446. [Google Scholar] [CrossRef]
- Sitko, R.; Janik, P.; Feist, B.; Talik, E.; Gagor, A. Suspended aminosilanized graphene oxide nanosheets for selective preconcentration of lead ions and ultrasensitive determination by electrothermal atomic absorption spectrometry. ACS Appl. Mater. Inter. 2014, 6, 20144–20153. [Google Scholar] [CrossRef]


| Analyte/ R2 | PF | Linear Range, ng mL−1 | DL (3σ), ng mL−1 | QL (3σ), ng mL−1 | Determined, ng mL−1, n = 8 RSD, % | ||
|---|---|---|---|---|---|---|---|
| 5 ng mL−1 | 10 ng mL−1 | 20 ng mL−1 | |||||
| Neocuproine/GO | |||||||
| Cd 0.9995 | 10 | 1–1000 | 0.24 | 0.79 | 4.56 ± 0.12 2.71 | 9.37 ± 0.24 2.71 | 18.49 ± 0.31 1.67 |
| Pb 0.9998 | 100 | 1–1000 | 0.22 | 0.73 | 4.76 ± 0.15 3.15 | 9.27 ± 0.22 2.43 | 18.40 ± 0.72 3.89 |
| Zn 0.9997 | 100 | 0.5–1000 | 0.035 | 0.12 | 4.74 ± 0.10 2.19 | 9.18 ± 0.33 3.59 | 18.86 ± 0.69 3.65 |
| Fe 0.9989 | 10 | 3–1000 | 0.84 | 2.80 | 4.89 ± 0.17 3.48 | 9.38 ± 0.35 3.73 | 18.34 ± 0.57 3.11 |
| Mn 0.9984 | 20 | 1–1000 | 0.17 | 0.57 | 4.83 ± 0.14 2.90 | 9.42 ± 0.35 3.71 | 18.21 ± 0.39 2.14 |
| Batocuproine/GO | |||||||
| Cd 0.9995 | 40 | 0.5–1000 | 0.047 | 0.16 | 4.83 ± 0.22 1.72 | 9.68 ± 0.19 1.83 | 18.83 ± 0.09 1.75 |
| Pb 0.9998 | 100 | 0.5–1000 | 0.089 | 0.30 | 4.84 ± 0.36 1.72 | 9.80 ± 0.17 1.69 | 19.13 ± 0.07 1.28 |
| Zn 0.9997 | 100 | 0.5–1000 | 0.083 | 0.27 | 4.78 ± 0.49 2.34 | 9.48 ± 0.34 3.21 | 18.65 ± 0.08 1.43 |
| Fe 0.9989 | 40 | 0.5–1000 | 0.12 | 0.40 | 4.76 ± 0.29 1.38 | 9.45 ± 0.25 2.37 | 93.06 ± 0.02 1.63 |
| Mn 0.9984 | 40 | 0.5–1000 | 0.13 | 0.43 | 4.69 ± 0.42 1.98 | 9.48 ± 0.29 2.78 | 18.71 ± 0.12 2.33 |
| Cr 0.9987 | 40 | 0.5–1000 | 0.077 | 0.25 | 4.70 ± 0.45 2.10 | 9.62 ± 0.23 2.20 | 18.98 ± 0.14 2.60 |
| Cu 0.9985 | 40 | 2–1000 | 0.54 | 1.78 | 4.65 ± 0.52 2.41 | 9.28 ± 0.30 2.79 | 18.32 ± 0.12 2.11 |
| Co 0.9995 | 40 | 0.5–1000 | 0.071 | 0.23 | 4.61 ± 0.51 2.36 | 9.29 ± 0.29 2.67 | 18.51 ± 0.17 3.20 |
| Ni 0.9991 | 40 | 1–1000 | 0.15 | 0.50 | 4.60 ± 0.43 1.97 | 9.19 ± 0.25 2.26 | 18.39 ± 0.08 1.53 |
| Interferent Ions | Al | Ba | Sr | Mg | Ca | K | Na |
|---|---|---|---|---|---|---|---|
| Interferent to analyte ratio | 1:500 | 1:1000 | 1:1000 | 1:10,000 | 1:20,000 | 1:20,000 | 1:20,000 |
| Recovery,% | Neocuproine/Go | ||||||
| Cd | 92.5 ± 2.6 | 98.1 ± 3.7 | 90.2 ± 1.8 | 95.6 ± 4.0 | 96.9 ± 2.3 | 92.2 ± 1.9 | 90.2 ± 2.1 |
| Pb | 93.7 ± 2.7 | 95.6 ± 3.3 | 96.7 ± 4.2 | 91.1 ± 3.5 | 91.4 ± 2.1 | 90.9 ± 2.3 | 99.0 ± 1.5 |
| Zn | 100 ± 3 | 92.1 ± 1.5 | 100 ± 3 | 92.8 ± 3.9 | 97.1 ± 2.6 | 99.1 ± 1.7 | 100 ± 3 |
| Fe | 99.7 ± 1.4 | 92.6 ± 1.7 | 92.6 ± 3.7 | 97.3 ± 2.3 | 99.2 ± 2.8 | 97.3 ± 3.2 | 98.4 ± 3.3 |
| Mn | 100 ± 2 | 93.6 ± 1.8 | 94.9 ± 3.4 | 92.5 ± 2.7 | 92.4 ± 1.3 | 100 ± 3 | 98.2 ± 1.8 |
| Batocuproine/GO | |||||||
| Cd | 94.6 ± 1.1 | 94.1 ± 2.4 | 90.8 ± 2.9 | 92.5 ± 1.9 | 93.2 ± 2.2 | 93.2 ± 3.1 | 91.5 ± 3.5 |
| Pb | 98.5 ± 2.4 | 91.4 ± 2.8 | 92.0 ± 2.8 | 95.2 ± 1.9 | 101 ± 3 | 96.2 ± 2.9 | 94.7 ± 3.5 |
| Zn | 97.0 ± 1.7 | 93.8 ± 2.9 | 92.9 ± 2.1 | 99.7 ± 2.3 | 102 ± 3 | 103 ± 3 | 93.8 ± 3.2 |
| Fe | 93.2 ± 2.8 | 93.3 ± 2.6 | 103 ± 3 | 95.8 ± 2.6 | 101 ± 3 | 97.5 ± 1.6 | 98.1 ± 2.4 |
| Mn | 91.9 ± 0.7 | 92.0 ± 2.5 | 90.8 ± 2.8 | 98.9 ± 0.8 | 99.1 ± 0.9 | 99.5 ± 1.5 | 96.5 ± 3.1 |
| Cr | 96.5 ± 2.9 | 94.5 ± 2.8 | 98.9 ± 2.4 | 91.5 ± 2.5 | 97.0 ± 2.4 | 90.8 ± 3.2 | 96.8 ± 2.3 |
| Cu | 92.6 ± 2.5 | 93.7 ± 2.7 | 91.3 ± 3.1 | 92.7 ± 0.7 | 98.9 ± 2.5 | 94.2 ± 1.9 | 92.8 ± 2.1 |
| Co | 93.5 ± 1.4 | 96.7 ± 2.5 | 93.7 ± 2.2 | 96.4 ± 1.7 | 94.4 ± 1.1 | 94.4 ± 2.6 | 91.6 ± 2.9 |
| Ni | 95.1 ± 1.1 | 69.5 ± 2.7 | 92.9 ± 2.4 | 91.3 ± 2.3 | 95.0 ± 1.6 | 93.9 ± 2.8 | 91.4 ± 3.2 |
| Analyte | Certified Value, mg kg−1 (ng g−1) * | Found, mg kg−1 (ng g−1) * | Recovery, % | RSD, % | Found, mg kg−1 (ng g−1) * | Recovery, % | RSD, % |
|---|---|---|---|---|---|---|---|
| M-3 HerTis | Neocuproine/GO | Batocuproine/GO | |||||
| Fe | 119 ± 13 | 118 ± 4 | 99.2 | 3.4 | 117 ± 6 | 98.3 | 5.1 |
| Mn | 5.78 ± 0.61 | 5.48 ± 0.23 | 94.8 | 4.2 | 5.63 ± 0.31 | 97.4 | 5.5 |
| Zn | 111 ± 6 | 110 ± 5 | 99.0 | 4.5 | 107 ± 3 | 96.4 | 2.8 |
| Cd | 325 ± 30 * | 319 ± 17 * | 98.2 | 5.3 | 311 ± 9 * | 95.7 | 2.9 |
| Pb | 104 ± 13 * | 99 ± 6 * | 95.2 | 6.0 | 102 ± 5 * | 98.1 | 4.9 |
| Cu | 3.19 ± 0.22 | - | - | - | 3.14 ± 0.08 | 98.4 | 2.5 |
| Co | 81 ± 12 * | - | - | - | 77 ± 4 * | 95.1 | 5.2 |
| Cr | 900 ± 110 * | - | - | - | 870 ± 33 * | 96.7 | 3.8 |
| Ni | 316 ± 49 * | - | - | - | 298 ± 11 * | 94.3 | 3.7 |
| M-4 CormTis | Neocuproine/Go | Batocuproine/GO | |||||
| Fe | 280 ± 16 | 263 ± 12 | 93.9 | 4.6 | 270 ± 14 | 96.4 | 5.2 |
| Mn | 2.16 ± 0.17 | 2.07 ± 0.09 | 95.8 | 4.3 | 2.09 ± 0.12 | 96.8 | 5.7 |
| Zn | 63.3 ± 3.5 | 58.4 ± 2.6 | 92.3 | 4.4 | 61.8 ± 2.9 | 97.6 | 4.7 |
| Pb | 2.33 ± 0.28 | 2.19 ± 0.08 | 94.0 | 3.6 | 2.27 ± 0.12 | 97.4 | 5.3 |
| Cd | 17.2 ± 2.1 * | 16.6 ± 0.80 * | 96.5 | 4.8 | 17.1 ± 1.1 * | 99.4 | 6.4 |
| Cu | 19.5 ± 1.2 | - | - | - | 18.7 ± 0.6 | 95.9 | 3.2 |
| Co | 41.0 ± 0.28 * | - | - | - | 40.7 ± 0.23 * | 99.3 | 0.6 |
| M-5 CodTis | Neocuproine/GO | Batocuproine/GO | |||||
| Fe | 13.2 ± 1.1 | 12.4 ± 0.18 | 94.0 | 1.5 | 12.6 ± 0.23 | 95.5 | 1.8 |
| Mn | 921 ± 75 | 873 ± 37 | 94.8 | 4.2 | 881 ± 32 | 95.7 | 3.6 |
| Zn | 20.1 ± 1.1 | 19.7 ± 0.80 | 98.0 | 4.1 | 19.3 ± 0.7 | 96.0 | 3.6 |
| Cd | 5 * | 4.9 ± 0.32 * | 98.0 | 6.5 | 4.7 ± 0.27 * | 94.0 | 5.7 |
| Pb | 45 * | 44 ± 1 * | 97.8 | 2.3 | 43 ± 2 * | 95.6 | 4.7 |
| Cu | 1.38 ± 0.09 | - | - | - | 1.34 ± 0.04 | 97.1 | 3.0 |
| Co | 14 * | - | - | - | 12.9 ± 0.43 * | 92.1 | 3.3 |
| Cr | 201 * | - | - | - | 189 ± 4 * | 94.0 | 2.1 |
| Ni | 136 * | - | - | - | 124 ± 3 * | 91.2 | 2.4 |
| Adsorbent | Analytes | Technique | Eluent Volume, mL | Volume max, mL | PF | DL, ng mL−1 | Ref. |
|---|---|---|---|---|---|---|---|
| CNT-BMBATT 1 | Cd(II), Pb(II) | FAAS | 2 | 100 | 200 | 0.08, 0.1 | [45] |
| CNT-IL 2 | Pb(II), Ni(II) | ETAAS | 0.4 | 10 | 25 | 0.05, 0.1 | [46] |
| GO-Fe3O4@PTh 3 | Zn(II) | FAAS | 2 | 30 | 60 | 0.08 | [47] |
| GO-SiO2 | Cd(II), Pb(II), Zn(II), Cr(III), Cu(II), Co(II), Ni(II) | FAAS | 1 | 10 | 10 | 5.8–23 | [48] |
| GO-Fe3O4@NpSH 4 | Cd(II) | ETAAS | 0.2 | 1 | 5 | 0.01 | [49] |
| GO-Fe3O4@BMIM 5 | Cd(II), Pb(II), Zn(II), Cr(III), Cu(II), Co(II) | ICP-OES | 0.5 | 25 | 50 | 0.1–1 | [50] |
| GO/Batophenanthroline | Cd(II), Pb(II), Zn(II), Cr(III), Fe(III), Mn(II) | ICP-OES | 4 | 200 | 50 | 0.06–0.25 | [43] |
| GO/Neocuproine | Pb(II), Zn(II), Mn(II) Cd(II), Fe(III) | ICP-OES | 5 | 500 100 50 | 100 20 10 | 0.035–0.84 | This work |
| GO/Batocuproine | Pb(II), Zn(II), Cd(II), Fe(III), Mn(II), Cr(III), Cu(II), Co(II), Ni(II) | ICP-OES | 5 | 500 200 | 100 40 | 0.047–0.54 | This work |
| Analite | Found, mg kg−1 | Spiked Pork Liver, mg kg−1 | Recovery, % | RSD, % | Found, mg kg−1 | Spiked Pork Kidney, mg kg−1 | Recovery, % | RSD, % |
|---|---|---|---|---|---|---|---|---|
| Neocuproine/GO | ||||||||
| Cd | 1.41 ± 0.01 | 6.38 ± 0.19 | 99.4 | 2.97 | 2.83 ± 0.09 | 7.76 ± 0.15 | 98.6 | 1.93 |
| Pb | 7.31 ± 0.26 | 12.28 ± 0.33 | 99.4 | 2.69 | 15.65 ± 0.16 | 20.57 ± 0.38 | 98.4 | 1.85 |
| Zn | 156 ± 3 | 205 ± 3 | 98 | 1.46 | 62.03 ± 2.83 | 110 ± 2 | 95.9 | 1.82 |
| Fe | 208 ± 3 | 258 ± 4 | 99 | 1.55 | 138 ± 2 | 185 ± 3 | 94 | 1.62 |
| Mn | 6.39 ± 0.06 | 11.19 ± 0.17 | 96 | 1.52 | 3.15 ± 0.08 | 7.98 ± 0.12 | 96.6 | 1.50 |
| Batocuproine/GO | ||||||||
| Cd | 1.32 ± 0.04 | 6.29 ± 0.09 | 99.4 | 1.43 | 2.45 ± 0.018 | 7.49 ± 0.02 | 101 | 0.27 |
| Pb | 5.97 ± 0.08 | 10.68 ± 0.23 | 94.2 | 2.15 | 14.81 ± 0.17 | 19.63 ± 0.13 | 96.4 | 0.66 |
| Zn | 155 ± 2 | 204 ± 2 | 98 | 0.98 | 67.47 ± 0.24 | 118 ± 1 | 101 | 0.85 |
| Fe | 203 ± 4 | 251 ± 3 | 96 | 1.19 | 135 ± 3 | 184 ± 2 | 98 | 1.09 |
| Mn | 6.80 ± 0.081 | 11.74 ± 0.17 | 98.8 | 1.45 | 3.68 ± 0.076 | 8.70 ± 0.11 | 100.4 | 1.26 |
| Cr | 0.22 ± 0.002 | 1.19 ± 0.002 | 97 | 0.17 | 0.16 ± 0.001 | 0.64 ± 0.005 | 96 | 0.78 |
| Cu | 25.15 ± 0.21 | 30.06 ± 0.38 | 98.2 | 1.26 | 9.5 ± 0.036 | 14.28 ± 0.23 | 95.6 | 1.61 |
| Co | 0.23 ± 0.004 | 1.24 ± 0.003 | 101 | 0.24 | 0.23 ± 0.002 | 0.74 ± 0.007 | 102 | 0.95 |
| Ni | 0.12 ± 0.003 | 1.09 ± 0.002 | 97 | 0.18 | 0.51 ± 0.005 | 1.49 ± 0.003 | 98 | 0.20 |
Disclaimer/Publisher’s Note: The statements, opinions and data contained in all publications are solely those of the individual author(s) and contributor(s) and not of MDPI and/or the editor(s). MDPI and/or the editor(s) disclaim responsibility for any injury to people or property resulting from any ideas, methods, instructions or products referred to in the content. |
© 2023 by the author. Licensee MDPI, Basel, Switzerland. This article is an open access article distributed under the terms and conditions of the Creative Commons Attribution (CC BY) license (https://creativecommons.org/licenses/by/4.0/).
Share and Cite
Feist, B. Dispersive Micro-Solid Phase Extraction Using a Graphene Oxide Nanosheet with Neocuproine and Batocuproine for the Preconcentration of Traces of Metal Ions in Food Samples. Molecules 2023, 28, 4140. https://doi.org/10.3390/molecules28104140
Feist B. Dispersive Micro-Solid Phase Extraction Using a Graphene Oxide Nanosheet with Neocuproine and Batocuproine for the Preconcentration of Traces of Metal Ions in Food Samples. Molecules. 2023; 28(10):4140. https://doi.org/10.3390/molecules28104140
Chicago/Turabian StyleFeist, Barbara. 2023. "Dispersive Micro-Solid Phase Extraction Using a Graphene Oxide Nanosheet with Neocuproine and Batocuproine for the Preconcentration of Traces of Metal Ions in Food Samples" Molecules 28, no. 10: 4140. https://doi.org/10.3390/molecules28104140