
FTIR as a Method for Qualitative Assessment of Solid Samples in Geochemical Research: A Review


Abstract
:1. Introduction
2. Construction and Working Principle
3. Sampling Techniques, According to the Research Paper
4. Sample Preparation for ATR and DRIFT Accessories, According to the Research Paper
5. Shifts and Overlapping in FTIR Spectra
6. Data Pre-Processing
6.1. Normalization
6.2. Baseline Correction
6.3. Spectral Derivatives
7. Identification of IR Spectra for Geological Samples
7.1. Vibration of (OH)-Group in the Sediments/Soils
7.2. Vibrational Deformations of Si-O in the Sediments/Soils
7.3. Carbonates, Nitrates, Sulphates, and Phosphates in the Sediments/Soils
7.4. Water and Carbon Dioxide in the FTIR Spectrum
7.5. Organic Matters in the Soils
8. Conclusions
Funding
Institutional Review Board Statement
Informed Consent Statement
Data Availability Statement
Conflicts of Interest
Abbreviations
| AAS | Atomic Absorption Spectroscopy |
| ATR | Attenuated Total Reflection |
| DRIFT | Diffuse Reflectance InfraRed Fourier Transform spectroscopy |
| 2D-IR | Two-dimensional InfraRed spectroscopy |
| FTIR | Fourier Transform InfraRed spectroscopy |
| HRI | High Refractive Index |
| ICP-MS | Inductively Coupled Plasma Mass Spectroscopy |
| ICP-OES | Inductively Coupled Plasma Optical Emission Spectroscopy |
| IR | InfraRed |
| IRS | Internal Reflection Spectroscopy |
| MIR | Mid-InfraRed |
| S/N ratio | Signal-to-Noise ratio |
| SOM | Soil Organic Matter |
| SR-FTIR | Synchrotron Radiation-Based Infrared spectromicroscopy |
| XRF | X-Ray Fluorescence spectroscopy |
References
- Demetriades, A. Geochemical Mapping. In Encyclopedia of Geology; Elsevier: Amsterdam, The Netherlands, 2021; pp. 267–280. [Google Scholar] [CrossRef]
- Sangwan, P.; Nain, T.; Singal, K.; Hooda, N.; Sharma, N. Soil as a tool of revelation in forensic science: A review. Anal. Methods 2020, 12, 5150–5159. [Google Scholar] [CrossRef] [PubMed]
- Reig, F. FTIR quantitative analysis of calcium carbonate (calcite) and silica (quartz) mixtures using the constant ratio method. Application to geological samples. Talanta 2002, 58, 811–821. [Google Scholar] [CrossRef] [PubMed]
- Evans, E.H.; Day, J.A.; Fisher, A.; Price, W.J.; Smith, C.M.M.; Tyson, J.F. Atomic spectrometry update. Advances in atomic emission, absorption and fluorescence spectrometry and related techniques. J. Anal. At. Spectrom. 2004, 19, 775. [Google Scholar] [CrossRef]
- Bacon, J.R.; Butler, O.T.; Cairns, W.R.L.; Cook, J.M.; Davidson, C.M.; Cavoura, O.; Mertz-Kraus, R. Atomic spectrometry update – a review of advances in environmental analysis. J. Anal. At. Spectrom. 2020, 35, 9–53. [Google Scholar] [CrossRef]
- Chen, Z.W.; Gibson, W.M.; Huang, H. High Definition X-Ray Fluorescence: Principles and Techniques. X-Ray Opt. Instrum. 2008, 2008, 1–10. [Google Scholar] [CrossRef] [Green Version]
- Xu, J.-L.; Thomas, K.V.; Luo, Z.; Gowen, A.A. FTIR and Raman imaging for microplastics analysis: State of the art, challenges and prospects. TrAC Trends Anal. Chem. 2019, 119, 115629. [Google Scholar] [CrossRef]
- Nandiyanto, A.B.D.; Oktiani, R.; Ragadhita, R. How to Read and Interpret FTIR Spectroscope of Organic Material. Indones. J. Sci. Technol. 2019, 4, 97. [Google Scholar] [CrossRef] [Green Version]
- Mohamed, M.A.; Jaafar, J.; Ismail, A.F.; Othman, M.H.D.; Rahman, M.A. Fourier Transform Infrared (FTIR) Spectroscopy. In Membrane Characterization; Elsevier: Amsterdam, The Netherlands, 2017; pp. 3–29. [Google Scholar] [CrossRef]
- Subramanian, A.; Rodriguez-Saona, L. Fourier Transform Infrared (FTIR) Spectroscopy. In Infrared Spectroscopy for Food Quality Analysis and Control; Elsevier: Amsterdam, The Netherlands, 2009; pp. 145–178. [Google Scholar] [CrossRef]
- Parikh, S.J.; Goyne, K.W.; Margenot, A.J.; Mukome, F.N.D.; Calderón, F.J. Soil Chemical Insights Provided through Vibrational Spectroscopy. In Advances in Agronomy; Elsevier: Amsterdam, The Netherlands, 2014; pp. 1–148. [Google Scholar] [CrossRef] [Green Version]
- Bell, R.J. Historical Sketch and Crucial Ideas. In Introductory Fourier Transform Spectroscopy; Elsevier: Amsterdam, The Netherlands, 1972; pp. 16–32. [Google Scholar] [CrossRef]
- Chapter 6 Instrumentation. In Comprehensive Analytical Chemistry; Elsevier: Amsterdam, The Netherlands, 2001; pp. 105–129. [CrossRef]
- Chalmers, J.M.; Griffiths, P.R. (Eds.) Handbook of Vibrational Spectroscopy: Chalmers Vibrat 5V Set; John Wiley & Sons, Ltd.: Chichester, UK, 2001. [Google Scholar] [CrossRef]
- Smith, B.C. Fundamentals of Fourier Transform Infrared Spectroscopy, 2nd ed.; CRC Press: Boca Raton, FL, USA, 2011. [Google Scholar]
- Settle, F.A. (Ed.) Handbook of Instrumental Techniques for Analytical Chemistry; Prentice Hall PTR: Upper Saddle River, NJ, USA, 1997. [Google Scholar]
- Reh, C. In-line and off-line FTIR measurements. In Instrumentation and Sensors for the Food Industry; Elsevier: Amsterdam, The Netherlands, 2001; pp. 213–232. [Google Scholar] [CrossRef]
- Dutta, A. Fourier Transform Infrared Spectroscopy. In Spectroscopic Methods for Nanomaterials Characterization; Elsevier: Amsterdam, The Netherlands, 2017; pp. 73–93. [Google Scholar] [CrossRef]
- Shaw, R.A.; Mantsch, H.H. Near-IR Spectrometers. In Encyclopedia of Spectroscopy and Spectrometry; Elsevier: Amsterdam, The Netherlands, 1999; pp. 1451–1461. [Google Scholar] [CrossRef]
- Spragg, R.A. IR Spectrometers. In Encyclopedia of Spectroscopy and Spectrometry; Elsevier: Amsterdam, The Netherlands, 1999; pp. 1048–1057. [Google Scholar] [CrossRef]
- Efimova, A.I.; Zaitsev, V.B.; Boldyrev, N.Y.; Kashkarov, P.K. Infrared Fourier Spectrometry; Faculty of Physics of Moscow State University: Moscow, Russia, 2008; 133p. [Google Scholar]
- Derrick, M.R.; Stulik, D.; Landry, J.M. Infrared Spectroscopy in Conservation Science; Getty Conservation Institute: Los Angeles, CA, USA, 1999. [Google Scholar]
- Larrabee, J.A.; Choi, S. Fourier transform infrared spectroscopy. In Methods in Enzymology; Elsevier: Amsterdam, The Netherlands, 1993; pp. 289–305. [Google Scholar] [CrossRef]
- Jaleh, B.; Fakhri, P. Infrared and Fourier transform infrared spectroscopy for nanofillers and their nanocomposites. In Spectroscopy of Polymer Nanocomposites; Elsevier: Amsterdam, The Netherlands, 2016; pp. 112–129. [Google Scholar] [CrossRef]
- Withrow, J. Infrared Spectroscopy; Research World: Delhi, India, 2012. [Google Scholar]
- Hind, A.R.; Bhargava, S.K.; McKinnon, A. At the solid/liquid interface: FTIR/ATR–the tool of choice. Adv. Colloid Interface Sci. 2001, 93, 91–114. [Google Scholar] [CrossRef]
- Buchanan, L.E.; Xiong, W. Two-Dimensional Infrared (2D IR) Spectroscopy. In Encyclopedia of Modern Optics; Elsevier: Amsterdam, The Netherlands, 2018; pp. 164–183. [Google Scholar] [CrossRef]
- Ghosh, D.; Deshmukh, S.; Chatterjee, S.; Sakpal, S.; Haldar, T.; Dhakad, A.; Kashid, S.; Bagchi, S. Two Dimensional Infrared Spectroscopy: A Structure Sensitive Technique with Ultrafast Time Resolution. In Modern Techniques of Spectroscopy; Singh, D.K., Pradhan, M., Materny, A., Eds.; Springer: Singapore, 2021; pp. 39–56. [Google Scholar] [CrossRef]
- Hill, R.E.; Hunt, N.T.; Hirst, J.D. Studying Biomacromolecules with Two-Dimensional Infrared Spectroscopy. In Advances in Protein Chemistry and Structural Biology; Elsevier: Amsterdam, The Netherlands, 2013; pp. 1–36. [Google Scholar] [CrossRef]
- Noda, I. Two-Dimensional Infrared (2D IR) Spectroscopy: Theory and Applications. Appl. Spectrosc. 1990, 44, 550–561. [Google Scholar] [CrossRef]
- Wang, J. Ultrafast two-dimensional infrared spectroscopy for molecular structures and dynamics with expanding wavelength range and increasing sensitivities: From experimental and computational perspectives. Int. Rev. Phys. Chem. 2017, 36, 377–431. [Google Scholar] [CrossRef]
- Ghosh, A.; Ostrander, J.S.; Zanni, M.T. Watching Proteins Wiggle: Mapping Structures with Two-Dimensional Infrared Spectroscopy. Chem. Rev. 2017, 117, 10726–10759. [Google Scholar] [CrossRef] [PubMed] [Green Version]
- Cho, M. Two-Dimensional Optical Spectroscopy; CRC Press: Boca Raton, FL, USA, 2009. [Google Scholar]
- Hamm, P.; Zanni, M.T. Concepts and Methods of 2d Infrared Spectroscopy; Cambridge University Press: Cambridge, UK; New York, NY, USA, 2011. [Google Scholar]
- Yu, P. Application of advanced synchrotron radiation-based Fourier transform infrared (SR-FTIR) microspectroscopy to animal nutrition and feed science: A novel approach. Br. J. Nutr. 2004, 92, 869–885. [Google Scholar] [CrossRef] [PubMed]
- Holman, H.-Y.N. Synchrotron Infrared Spectromicroscopy for Studying Chemistry of Microbial Activity in Geologic Materials. In Developments in Soil Science; Elsevier: Amsterdam, The Netherlands, 2010; pp. 103–130. [Google Scholar] [CrossRef]
- Lehmann, J.; Solomon, D. Organic Carbon Chemistry in Soils Observed by Synchrotron-Based Spectroscopy. In Developments in Soil Science; Elsevier: Amsterdam, The Netherlands, 2010; pp. 289–312. [Google Scholar] [CrossRef]
- Bantignies, J.-L.; Carr, L.; Dumas, P.; Miller, L.; Williams, G.P. Applications of Infrared Microspectroscopy to Geology, Biology and Cosmetics. Synchrotron Radiat. News 1998, 11, 31–37. [Google Scholar] [CrossRef]
- Saviello, D.; Pouyet, E.; Toniolo, L.; Cotte, M.; Nevin, A. Synchrotron-based FTIR microspectroscopy for the mapping of photo-oxidation and additives in acrylonitrile–butadiene–styrene model samples and historical objects. Anal. Chim. Acta 2014, 843, 59–72. [Google Scholar] [CrossRef] [PubMed]
- Jungman, E.; Laugel, C.; Rutledge, D.N.; Dumas, P.; Baillet-Guffroy, A. Development of a percutaneous penetration predictive model by SR-FTIR. Int. J. Pharm. 2013, 441, 628–635. [Google Scholar] [CrossRef] [PubMed]
- Reuben, S.; Banas, K.; Banas, A.; Swarup, S. Combination of synchrotron radiation-based Fourier transforms infrared microspectroscopy and confocal laser scanning microscopy to understand spatial heterogeneity in aquatic multispecies biofilms. Water Res. 2014, 64, 123–133. [Google Scholar] [CrossRef] [PubMed]
- Nimer, R.; Kamel, G.; Obeidat, M.A.; Dahabiyeh, L.A. Investigating the molecular structure of plasma in type 2 diabetes mellitus and diabetic nephropathy by synchrotron Fourier-transform infrared microspectroscopy. Spectrochim. Acta Part A Mol. Biomol. Spectrosc. 2022, 264, 120259. [Google Scholar] [CrossRef] [PubMed]
- Barón-Sola, Á.; Toledo-Basantes, M.; Arana-Gandía, M.; Martínez, F.; Ortega-Villasante, C.; Dučić, T.; Yousef, I.; Hernández, L.E. Synchrotron Radiation-Fourier Transformed Infrared microspectroscopy (μSR-FTIR) reveals multiple metabolism alterations in microalgae induced by cadmium and mercury. J. Hazard. Mater. 2021, 419, 126502. [Google Scholar] [CrossRef]
- Martin, M.C.; Schade, U.; Lerch, P.; Dumas, P. Recent applications and current trends in analytical chemistry using synchrotron-based Fourier-transform infrared microspectroscopy. TrAC Trends Anal. Chem. 2010, 29, 453–463. [Google Scholar] [CrossRef]
- Holman, H.N.; Martin, M.C. Synchrotron Radiation Infrared Spectromicroscopy: A Noninvasive Chemical Probe for Monitoring Biogeochemical Processes. In Advances in Agronomy; Elsevier: Amsterdam, The Netherlands, 2006; pp. 79–127. [Google Scholar] [CrossRef]
- Guilhaumou, N.; Sautter, V.; Dumas, P. Synchrotron FTIR microanalysis of volatiles in melt inclusions and exsolved particles in ultramafic deep-seated garnets. Chem. Geol. 2005, 223, 82–92. [Google Scholar] [CrossRef]
- Chapter 7 Sampling techniques and applications. In Comprehensive Analytical Chemistry; Elsevier: Amsterdam, The Netherlands, 2001; pp. 131–194. [CrossRef]
- Ferraro, J.R.; Basile, L.J. Fourier Transform Infrared Spectroscopy: Applications to Chemical Systems; Academic Press: Orlando, FL, USA, 1985; Volume 4, Available online: http://site.ebrary.com/id/10667316 (accessed on 8 May 2022).
- Burns, D.A.; Ciurczak, E.W. (Eds.) Handbook of Near-Infrared Analysis, 3rd ed.; CRC Press: Boca Raton, FL, USA, 2007. [Google Scholar] [CrossRef]
- Simmons, E.L. Reflectance spectroscopy: Application of the Kubelka-Munk theory to the rates of photoprocesses of powders. Appl. Opt. 1976, 15, 951. [Google Scholar] [CrossRef] [PubMed]
- Yang, L.; Kruse, B. Revised Kubelka–Munk theory I Theory and application. J. Opt. Soc. Am. A 2004, 21, 1933. [Google Scholar] [CrossRef] [PubMed]
- Yang, L.; Miklavcic, S.J. Revised Kubelka–Munk theory III A general theory of light propagation in scattering and absorptive media. J. Opt. Soc. Am. A 2005, 22, 1866. [Google Scholar] [CrossRef] [PubMed] [Green Version]
- Kokhanovsky, A.A. Physical interpretation and accuracy of the Kubelka–Munk theory. J. Phys. D Appl. Phys. 2007, 40, 2210–2216. [Google Scholar] [CrossRef]
- Aleksashkin, I.V.; Bobra, T.V.; Dubas, V.V. Study of the inorganic component of piedmont chernozems in the Belogorsk region of the Republic of Crimea by IR spectroscopy. Geopolit. Ecogeodynamics Reg. 2020, 6, 287–297. [Google Scholar]
- Campos, P.V.; Albuquerque, A.R.L.; Angélica, R.S.; Paz, S.P.A. FTIR spectral signatures of amazon inorganic phosphates: Igneous, weathering, and biogenetic origin. Spectrochim. Acta Part A Mol. Biomol. Spectrosc. 2021, 251, 119476. [Google Scholar] [CrossRef]
- Madejová, J. FTIR techniques in clay mineral studies. Vib. Spectrosc. 2003, 31, 1–10. [Google Scholar] [CrossRef]
- Soriano-Disla, J.M.; Janik, L.; McLaughlin, M.J.; Forrester, S.; Kirby, J.K.; Reimann, C. Prediction of the concentration of chemical elements extracted by aqua regia in agricultural and grazing European soils using diffuse reflectance mid-infrared spectroscopy. Appl. Geochem. 2013, 39, 33–42. [Google Scholar] [CrossRef] [Green Version]
- Salama, W.; el Aref, M.; Gaupp, R. Spectroscopic characterization of iron ores formed in different geological environments using FTIR, XPS, Mössbauer spectroscopy and thermoanalyses. Spectrochim. Acta Part A Mol. Biomol. Spectrosc. 2015, 136, 1816–1826. [Google Scholar] [CrossRef]
- Margenot, A.J.; Calderón, F.J.; Goyne, K.W.; Mukome, F.N.D.; Parikh, S.J. IR Spectroscopy, Soil Analysis Applications. In Encyclopedia of Spectroscopy and Spectrometry; Elsevier: Amsterdam, The Netherlands, 2017; pp. 448–454. [Google Scholar] [CrossRef]
- Simakova, Y.S. Crystal-chemical features of glauconite from Karinskoe deposit (South Urals), Institute of Geology Komi SC UB RAS. Vestn. IG KomiSC 2019, 3, 41–50. [Google Scholar] [CrossRef]
- Povarennykh, A.S. The use of infrared spectra for the determination of minerals. Am. Mineral. 1978, 63, 956–959. [Google Scholar]
- De Aragão, J.G.B.; Younes, M. Peak separation by derivative spectroscopy applied to FTIR analysis of hydrolized silica. J. Braz. Chem. Soc. 2008, 19, 1582–1594. [Google Scholar] [CrossRef] [Green Version]
- Ferraro, J.R.; Basile, L.J. (Eds.) Fourier Transform Infrared Spectra: Applications to Chemical Systems; Academic Press: Cambridge, MA, USA, 2012. [Google Scholar]
- Holler, F.; Burns, D.H.; Callis, J.B. Direct Use of Second Derivatives in Curve-Fitting Procedures. Appl. Spectrosc. 1989, 43, 877–882. [Google Scholar] [CrossRef]
- Siqueira, L.F.S.; Lima, K.M.G. A decade (2004–2014) of FTIR prostate cancer spectroscopy studies: An overview of recent advancements. TrAC Trends Anal. Chem. 2016, 82, 208–221. [Google Scholar] [CrossRef]
- Lasch, P. Spectral pre-processing for biomedical vibrational spectroscopy and microspectroscopic imaging. Chemom. Intell. Lab. Syst. 2012, 117, 100–114. [Google Scholar] [CrossRef] [Green Version]
- Rinnan, Å.; van den Berg, F.; Engelsen, S.B. Review of the most common pre-processing techniques for near-infrared spectra. TrAC Trends Anal. Chem. 2009, 28, 1201–1222. [Google Scholar] [CrossRef]
- Chukanov, N.V.; Chervonnyi, A.D. Infrared Spectroscopy of Minerals and Related Compounds; Springer International Publishing: Cham, Germany, 2016. [Google Scholar] [CrossRef]
- Oloyede, O.G.; Aroke, U.O.; Giwa, S.O.; Jock, A.A. Characterisation of Natural and HDTMA-Br Modified Dijah-Monkin Bentonite Clay: FTIR, XRF, XRD and SEM. Path Sci. 2021, 7, 2010–2018. [Google Scholar] [CrossRef]
- Volkov, D.; Rogova, O.; Proskurnin, M. Organic Matter and Mineral Composition of Silicate Soils: FTIR Comparison Study by Photoacoustic, Diffuse Reflectance, and Attenuated Total Reflection Modalities. Agronomy 2021, 11, 1879. [Google Scholar] [CrossRef]
- So, R.T.; Blair, N.E.; Masterson, A.L. Carbonate mineral identification and quantification in sediment matrices using diffuse reflectance infrared Fourier transform spectroscopy. Environ. Chem. Lett. 2020, 18, 1725–1730. [Google Scholar] [CrossRef]
- Shi, Z.; Sanguinito, S.; Goodman, A.; Jessen, K.; Tsotsis, T.T. Investigation of Mass Transfer and Sorption in CO2/Brine/Rock Systems via In Situ FT-IR. Ind. Eng. Chem. Res. 2020, 59, 20181–20189. [Google Scholar] [CrossRef]
- Pärnpuu, S.; Astover, A.; Tõnutare, T.; Penu, P.; Kauer, K. Soil organic matter qualification with FTIR spectroscopy under different soil types in Estonia. Geoderma Reg. 2022, 28, e00483. [Google Scholar] [CrossRef]
- Stenberg, B.; Rossel, R.A.V.; Mouazen, A.M.; Wetterlind, J. Visible and Near Infrared Spectroscopy in Soil Science. In Advances in Agronomy; Elsevier: Amsterdam, The Netherlands, 2010; pp. 163–215. [Google Scholar] [CrossRef] [Green Version]
- Nuzzo, A.; Buurman, P.; Cozzolino, V.; Spaccini, R.; Piccolo, A. Infrared spectra of soil organic matter under a primary vegetation sequence. Chem. Biol. Technol. Agric. 2020, 7, 6. [Google Scholar] [CrossRef] [Green Version]
- Krivoshein, P.K.; Volkov, D.S.; Rogova, O.B.; Proskurnin, M.A. FTIR photoacoustic spectroscopy for identification and assessment of soil components: Chernozems and their size fractions. Photoacoustics 2020, 18, 100162. [Google Scholar] [CrossRef] [PubMed]


| Categories | FTIR | Other IR |
|---|---|---|
| SNR or Jacquinot’s Advantage | Has a high throughput and, as a result, a high SNR. | IR beams pass through prisms, slits, and gratings that restrict the intensity of the beam and reduce throughput. |
| Multiplex or Fellgett’s Advantage | Simultaneously encode all wavelengths of light. | Every wavelength must be measured individually. |
| Laser-Referenced Frequencies or Conne’s Advantage | Uses a He-Ne laser as an interferometer reference. This allows the wavenumbers in a measured FTIR spectrum to be determined with a precision of ±0.01 cm−1. | Needs to be calibrated by the users. |
| Artifacts | The major disadvantage of FTIR. These are features present in the spectrum of a sample that is not from the sample (peaks of water vapor and carbon dioxide). | There are no extraneous peaks in the spectrum of the sample. |
| Matrix Sample Type | Accessories | Parameters of Measurement | Sample Preparation | Characteristic Wavenumbers, cm−1 | Ref. | ||
|---|---|---|---|---|---|---|---|
| Reagents | Other | Peaks | Description | ||||
| Geological samples of rocks and sediments (limestone, sandstone, and sediments) | ATR | MIR range: 4000–400 cm−1; scanning: 32; resolution: 4 cm−1 | K3[Fe(CN)6]; KBr | ND c | 798 and 779 | silica | [3] |
| 875 and 712 | calcium carbonate | ||||||
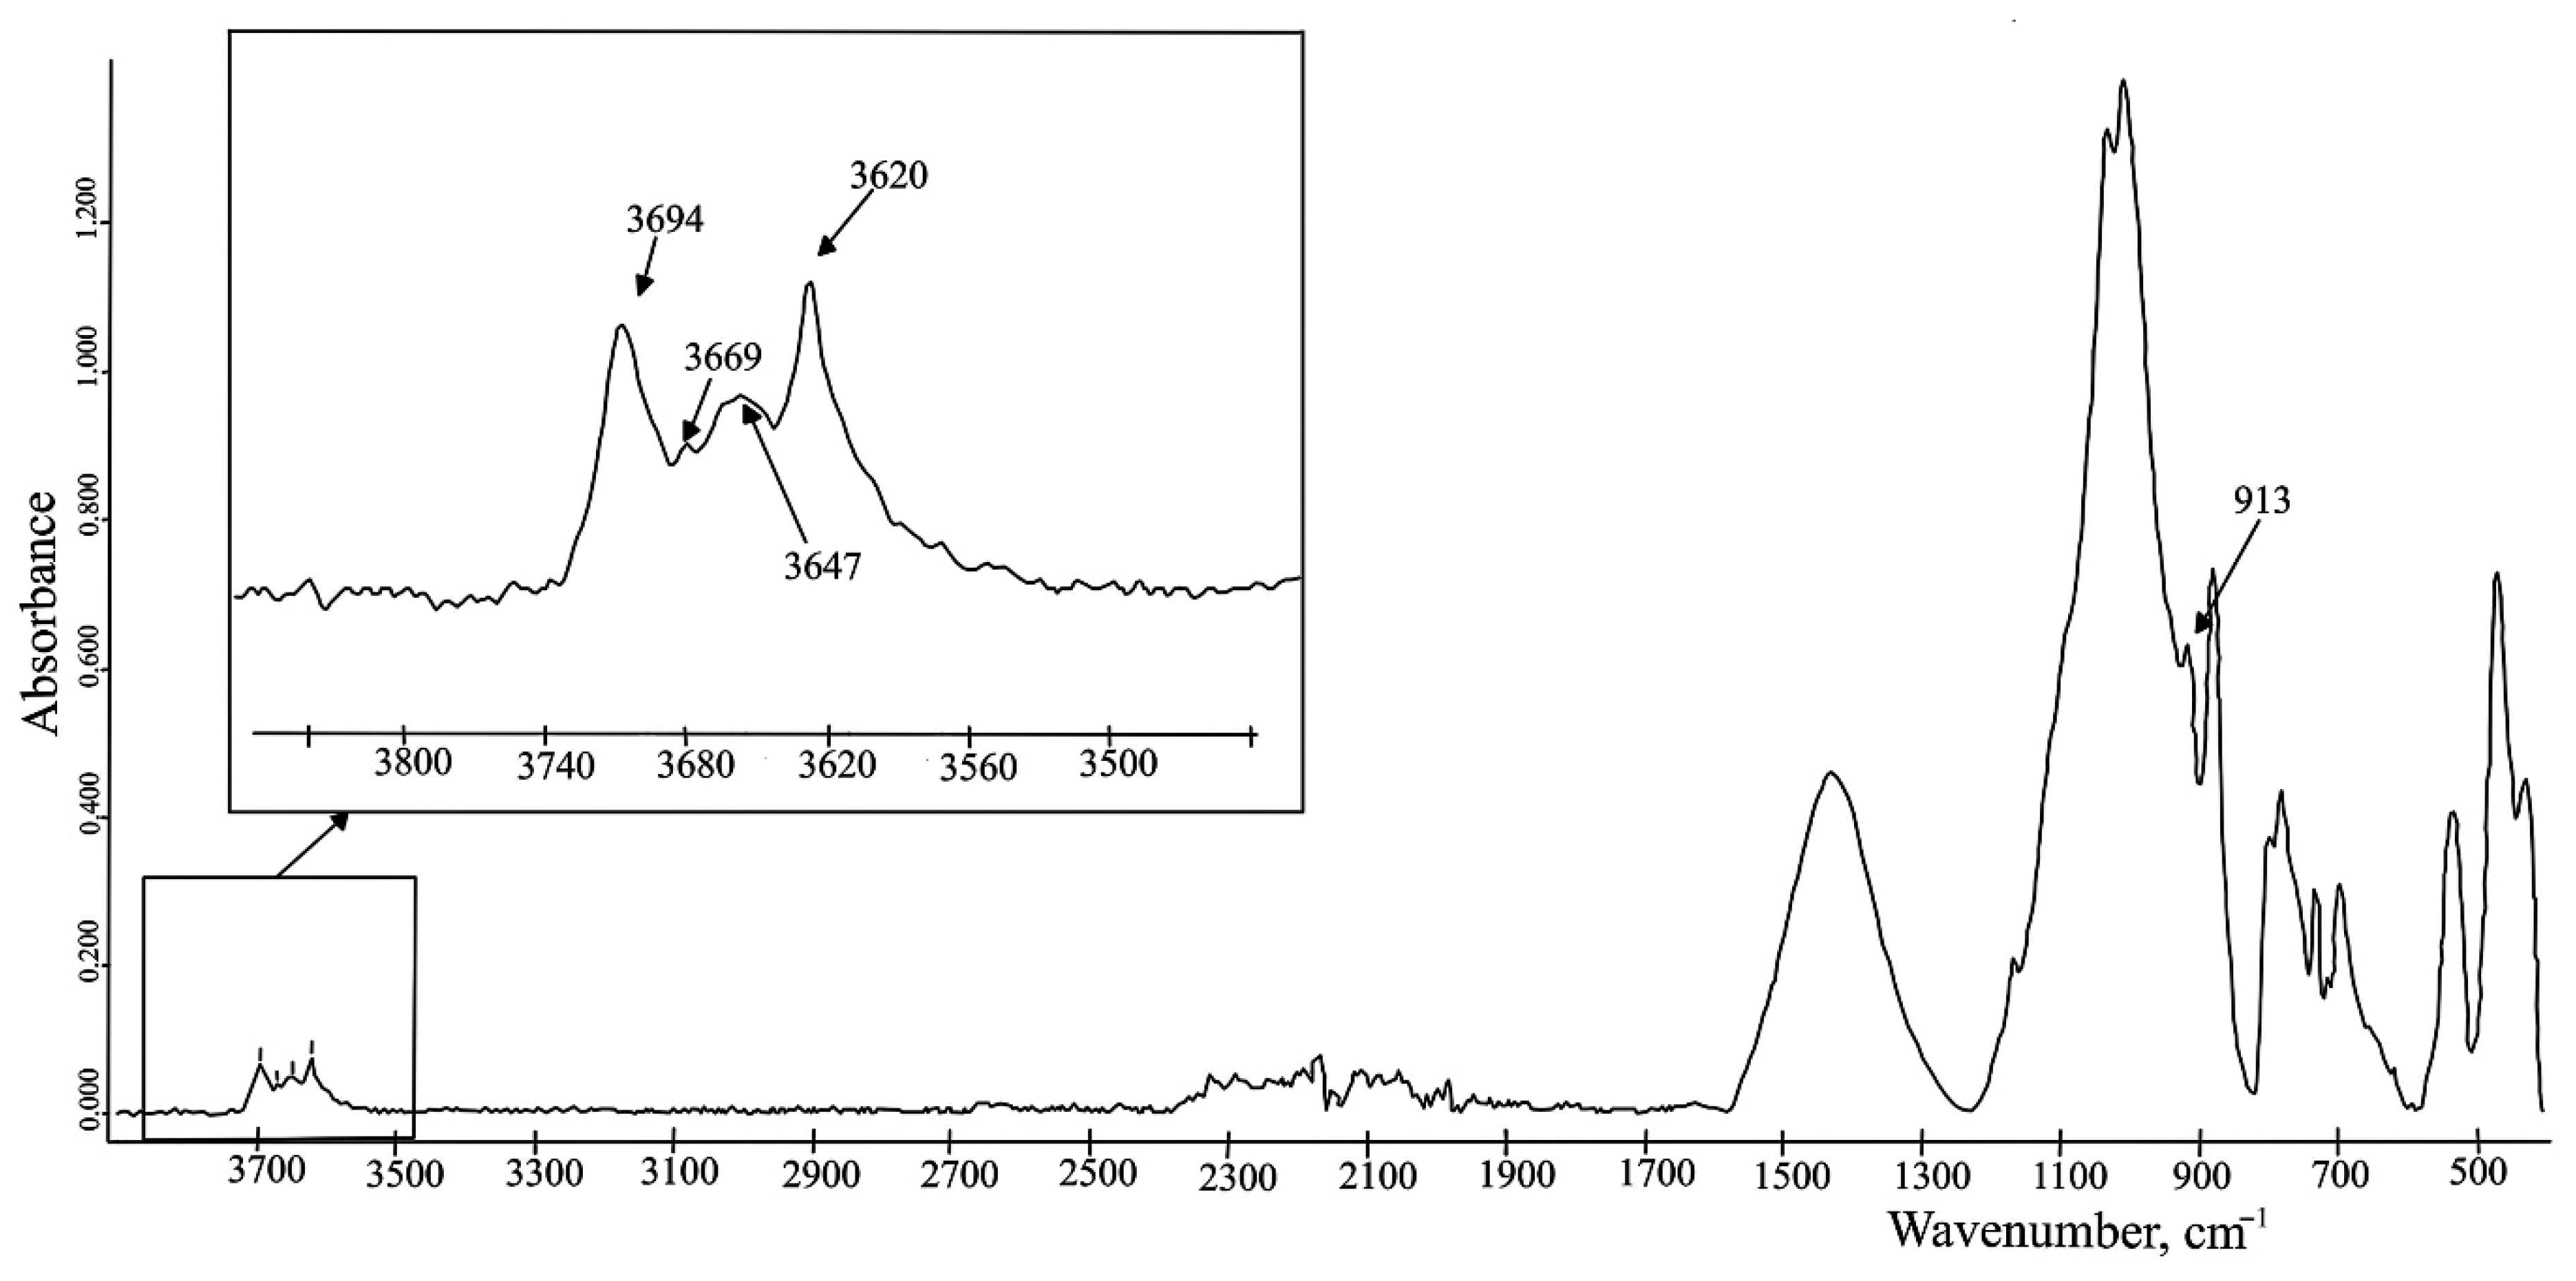
| Clay mineral | ATR; DRIFT | MIR range: 4000–400 cm−1; scanning: 128; resolution: 4 cm−1 | without any dilution in KBr | ND | 3620, 3653, 3669, and 3695 | ν-OH for kaolinite | [36] |
| 3620, 3653, and 3703 | ν-OH for dickite | ||||||
| 3648 and 3694 | ν-OH for chrysotile | ||||||
| 3620 | ν-OH for montmorillonite | ||||||
| 3567 | ν-OH for nontronites (FeFeOH) | ||||||
| ~3680 | ν-OH for hectorite and saponite | ||||||
| ~3430 | H-O-H vibration into all smectites | ||||||
| 1120–1000 | ν-Si-O for kaolinite and dickite | ||||||
| 960 | main ν-Si-O for chrysotile | ||||||
| 1030 | ν-Si-O for montmorillonite | ||||||
| 1019 | ν-Si-O for nontronite | ||||||
| 1012 | ν-Si-O for hectorite | ||||||
| 1009 | ν-Si-O for saponite | ||||||
| 914 | δ-OH for kaolinite (Al2OH) | ||||||
| 936 | δ-OH for dickite (Al2OH) | ||||||
| ~600 | δ-OH for chrysotile (Mg3OH) | ||||||
| 916 | δ-OH for montmorillonite (Al2OH) | ||||||
| 844 | δ-OH for montmorillonite (AlMgOH) | ||||||
| 817 676 | δ-OH for nontronite (Fe2OH) Fe-O out-of-plane vibration | ||||||
| 655 | δ-OH for hectorite (Mg3OH) | ||||||
| 660 | δ-OH for saponite (Mg3OH) | ||||||
| Agricultural and grazing European soils | DRIFT | MIR range: 4000–500 cm−1, scanning: 60; resolution: 8 cm−1, d d = 9 mm | ND | sieved: <2 mm; dried: 40 °C for 12 h | 3632 and 1630; | illites and/or smectites | [37] |
| 2000–1800 and 1180–1160 and 1044 | quartz | ||||||
| 3696 and 3628 | kaolinite | ||||||
| 670, 740, 780, and 860 | Ti oxide | ||||||
| Iron ore | ND | MIR range: 4000–400 | KBr | Mixing of a 1–2 mg sample with 200 mg KBr; pressed | 3416 and 3133 | ν a-OH for goethite | [38] |
| 1620 and 1634 | H2O | ||||||
| 982 and ~610 | SO4 band | ||||||
| 1384 and 1796 | NO3 band | ||||||
| 1085 | quartz or polysaccharide carbohydrates | ||||||
| 892 and 795 | δ b-OH and γ b-OH for goethite, respectively | ||||||
| 418, 455, and 670 | other absorption bands of goethite | ||||||
| 471 and 540 or 545 | hematite | ||||||
| 1082 | Si-O in the quartz | ||||||
| 1032, 1011, 940, and 914 | Si-O-Si, Si-O-Al, Al-O-H for kaolinite respectively | ||||||
| 540 471 | Si-O-Al Si-O common in the kaolinite and hematite | ||||||
| Minerals and SOM e | ATR and DRIFT | ND | KBr | finely ground <900 μm for DRIFT; | 3750–3400 | ν-OH for phyllosilicates | [38] |
| 950–600 | δ-OH for phyllosilicates | ||||||
| 1200–700 and 700–400 | ν-Si-O | ||||||
| 1120–950 | Si-O for 1:1-layer silicates | ||||||
| 1030–1010 | Si-O for 2:1-layer silicates | ||||||
| 3800–2800 | ν-OH for allophane and imogolite | ||||||
| 1700–1550 | δ-OH for allophane and imogolite | ||||||
| 1200–800 | ν-Si-O for allophane and imogolite | ||||||
| Glauconite | ND | MIR range: 4000–400 cm−1; scanning: 256; resolution: 2 cm−1 | KBr | ND | 1121, 1077, 1026, 992, and 957 | ν-Si-O-Si | [40] |
| 914 | ν-Si-O-Al | ||||||
| 818 | δ-[(Mg)Fe3+OHFe3+] | ||||||
| 677 | ν-[Fe3+-O] | ||||||
| 533 | ν-[Al-O] | ||||||
| 497 | ν-[Mg-O] | ||||||
| 460 | δ-Si-O-Si(Al) | ||||||
| 3534.4 | ν-OH for Fe3+OHFe3+ | ||||||
| 3543.2 | ν-OH for MgOHFe2+ | ||||||
| 3558.4 | ν-OH for MgOHFe3+ or AlOHFe2+ | ||||||
| 3566.2 | ν-OH for AlOHFe3+ | ||||||
| 3583.9 | ν-OH for MgOHMg | ||||||
| 3604.8 | ν-OH for AlOHMg | ||||||
| 3619.0 and 3647.3 | ν-OH for AlOHAl | ||||||
| River bank, alluvial sediments, and lake bed sediments | DRIFT | MIR range: 4000–400 cm−1; scanning: 16; resolution: 4 cm−1; d = 3 mm | ND | lyophilizing | 1796, 875, and 712 | CO3 band for calcite | [43] |
| 1814, 880, and 730 | CO3 band for dolomite | ||||||
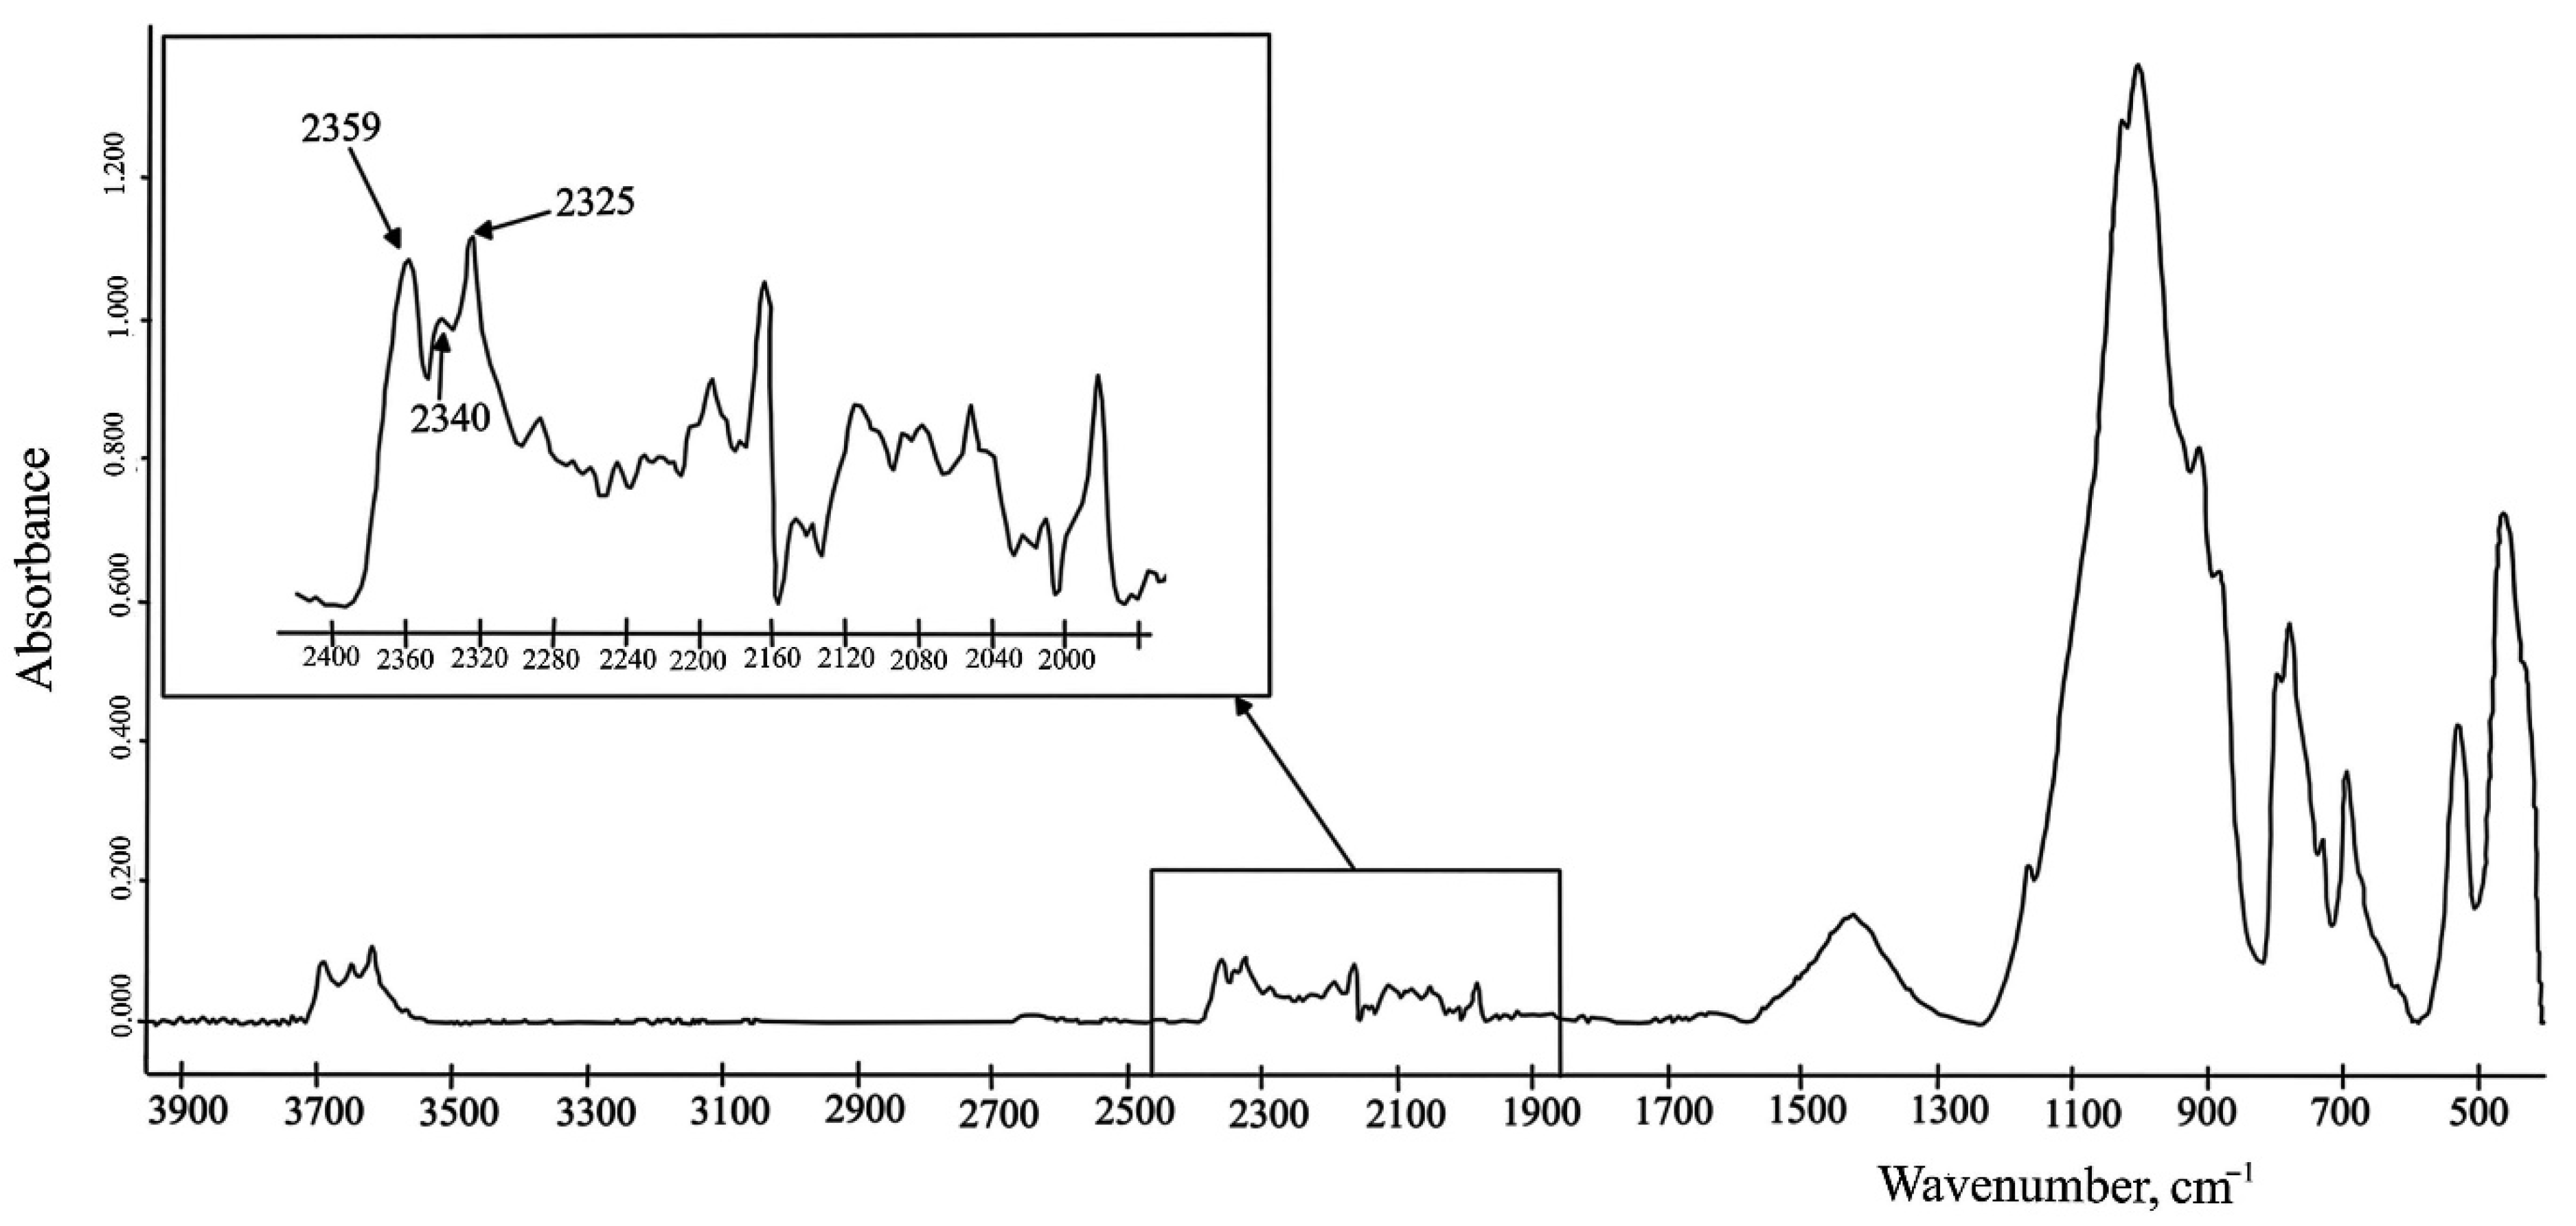
| CO2/Brine/Rock systems | ATR | MIR range: 4000–400 cm−1; scanning: 500 resolution: 2 cm−1; cell temperature 50 °C; cell pressure 0.7, 2.8, 5.5, and 8.3 MPa | ND | powdered; sieved to 73 μm; mixed with brine | 2361 and 2336 | ν-CO2 | [44] |
| 667 | δ-CO2 | ||||||
| 3385 | ν-H-O-H | ||||||
| 1635 | δ-H-O-H | ||||||
| 1300–1400 | aqueous carbonate and bicarbonate ions region | ||||||
| Phosphate rocks | DRIFT and ATR | MIR range: 4000–400 cm−1; scanning: 100; resolution: 8 cm−1 | KBr | mixed with KBr: 10% sample/90%KBr for DRIFT | 1182–1005 | ν-P-O | [35] |
| 634–539 | δ-O-P-O symmetric | ||||||
| 516–451 | δ-O-P-O asymmetric | ||||||
| 1458–1427 | ν-C-O asymmetric (into CO3) | ||||||
| 870 | δ-C-O-C symmetric (into CO3) | ||||||
| 717 and 672 | δ-C-O-C asymmetric (into CO3) | ||||||
| 672, 588, ~470, and ~460 | ν-Al2OH | ||||||
| ~1180, ~1040 and 800 | δ-Al2OH | ||||||
| ~840 | δ-Al-O-Fe | ||||||
| 3045–3033 | ν-N-H | ||||||
| Foothill chernozems | ND | MIR range: 4000–400 cm−1 | Not used | ground to a fine powder | 3695 | ν-(Al,Fe,Mg)-OH | [34] |
| 3627–3617 | ν-Al-Al-OH | ||||||
| ~915 | δ-Al-Al-OH | ||||||
| 3405–3357 | ν-H-O-H | ||||||
| 1639–1629 | δ-H-O-H | ||||||
| 1425–1393 | ν-C-O into CaCO3 | ||||||
| 1022–1000 | ν-Si-O | ||||||
| 874–872 and 712 | δ-C-O into CaCO3 | ||||||
| 797–794 and 779-776 | ν-Si-O into SiO2 | ||||||
| 694–693 and 528–513 | δ-Si-O | ||||||
| 649–645 | δ-Si-O(-Si) | ||||||
| 564–459 | δ-Si-O-(Si,Al,Mg) | ||||||
| 428–413 | δ-Si-O | ||||||
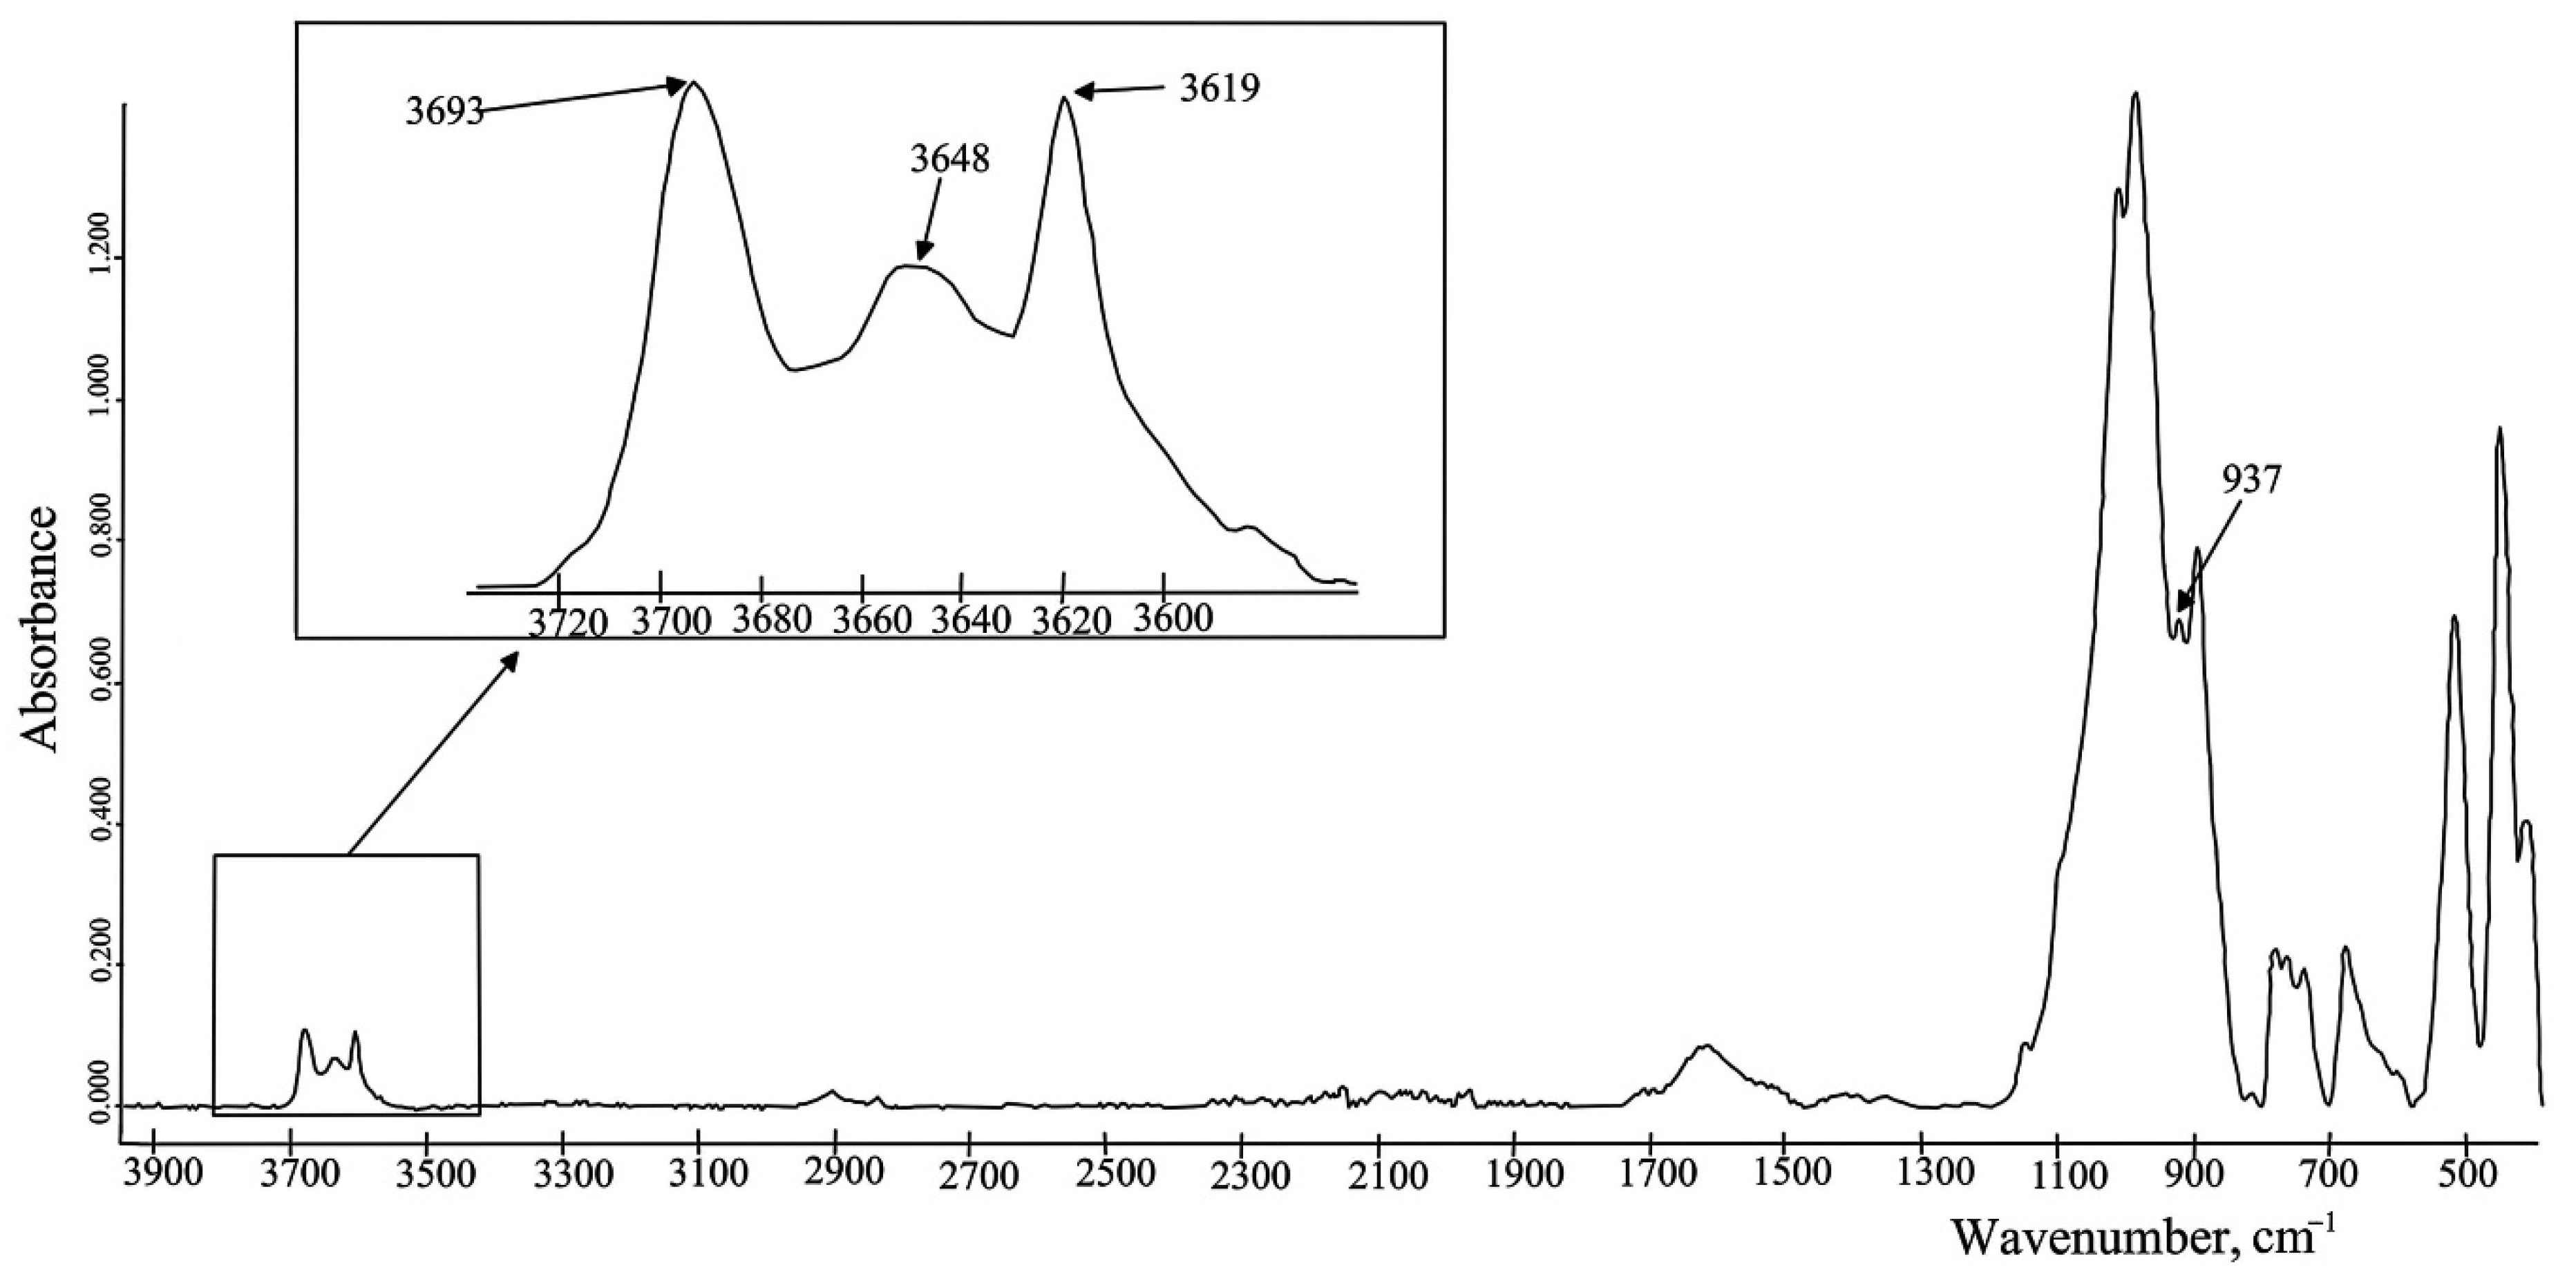
| Bentonite Clay | ND | MIR range: 4000–650 cm−1; resolution: 1 cm−1 | ND | dried; powdered; sieved to 125 μm | 685.8 | OH deformation | [41] |
| 749.2 | Al-O-Si | ||||||
| 777.1 | Si-O deformation | ||||||
| 909.5 | Al-Al-OH | ||||||
| 997.1 | Si-O planar stretching | ||||||
| 3617.4 | OH-stretching | ||||||
| 3690.1 | structural OH stretching | ||||||
| Silicate matrix soil (sod-podzolic and chernozems) | DRIFT, ATR, and FTIR-PAS | MIR range: 4000–100 cm−1 | ND | dried; sieved | 3700 | unbonded SiO-H stretch (DRIFT) | [42] |
| 3690–3680 | hydrogen-bonded SiO-H…H2O stretch (amorphous) (DRIFT and ATR) | ||||||
| 3670–3650 | ν-OH of inner-surface hydroxyl groups (DRIFT) | ||||||
| 3620 | ν-Al(Mg)SiO-H (DRIFT and ATR) | ||||||
| 1650–1640 | absorbed liquid water bend, ν-HO-H (DRIFT and ATR) | ||||||
| 1460 | carbonate (DRIFT and ATR) | ||||||
| 1420 | ν-Mg-OH (DRIFT and ATR) | ||||||
| 1185 | amorphous silica (DRIFT) | ||||||
| 1165–1153 | SiO2 lattice (DRIFT and ATR) | ||||||
| 1115–1105 | amorphous silica (DRIFT and ATR) | ||||||
| 1095 | SiO2 silicate ν-Si-O (DRIFT) | ||||||
| 1080–1075 | O-Si-O lattice stretch (ATR) | ||||||
| 1010–995 | SiO2 ν-Si-O lattice (DRIFT and ATR) | ||||||
| 975 | SiO2 silicate (kaolinite and illite) (DRIFT and ATR) | ||||||
| 930–910 | silicate and aluminosilicate (DRIFT and ATR) | ||||||
| 860 | Al-OH (clay minerals) (ATR) | ||||||
| 840–830 | Al-OH (clay minerals), smectite, illite, and AlMgOH (DRIFT) | ||||||
| 813 | amorphous silica and Ti-O (DRIFT) | ||||||
| 796 | ν-Si-O-Si (DRIFT and ATR) | ||||||
| 697–696 | δ-Si-O-Si (DRIFT and ATR) | ||||||
| 675–650 | CO2 (DRIFT and ATR) | ||||||
| 655–650 | δ-Si-O-Si and amorphous iron oxide (DRIFT and ATR) | ||||||
| 645–640 | Sulfate (ATR) | ||||||
| 565 | PO4 tetrahedra (DRIFT) | ||||||
| 535–525 | Si-O-Al deformation in kaolinite and iron oxide (ATR) | ||||||
| 470 | O-Si-O bend, O-Al-O, and iron oxide (ATR) | ||||||
| 430–420 | Si-O deformation of kaolinite, Mg-OH, and Al-OH (clay minerals) (DRIFT and ATR) | ||||||
Publisher’s Note: MDPI stays neutral with regard to jurisdictional claims in published maps and institutional affiliations. |
© 2022 by the authors. Licensee MDPI, Basel, Switzerland. This article is an open access article distributed under the terms and conditions of the Creative Commons Attribution (CC BY) license (https://creativecommons.org/licenses/by/4.0/).
Share and Cite
Tkachenko, Y.; Niedzielski, P. FTIR as a Method for Qualitative Assessment of Solid Samples in Geochemical Research: A Review. Molecules 2022, 27, 8846. https://doi.org/10.3390/molecules27248846
Tkachenko Y, Niedzielski P. FTIR as a Method for Qualitative Assessment of Solid Samples in Geochemical Research: A Review. Molecules. 2022; 27(24):8846. https://doi.org/10.3390/molecules27248846
Chicago/Turabian StyleTkachenko, Yana, and Przemysław Niedzielski. 2022. "FTIR as a Method for Qualitative Assessment of Solid Samples in Geochemical Research: A Review" Molecules 27, no. 24: 8846. https://doi.org/10.3390/molecules27248846