
Valorization of Kraft Pulp and Paper Mill Slaker Grits and Biomass Fly Ash as Fillers in a Commercial Screed Mortar Formulation
 , , , , and
Abstract
: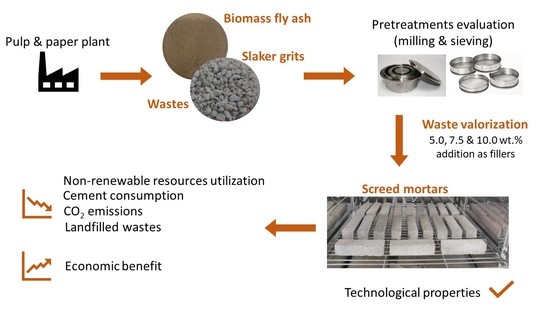
1. Introduction
2. Results and Discussion
2.1. Slaker Grits (SG) and Biomass Fly Ash (BFA1 and BFA2) Characterization
2.1.1. Chemical Composition
2.1.2. Mineralogical Composition
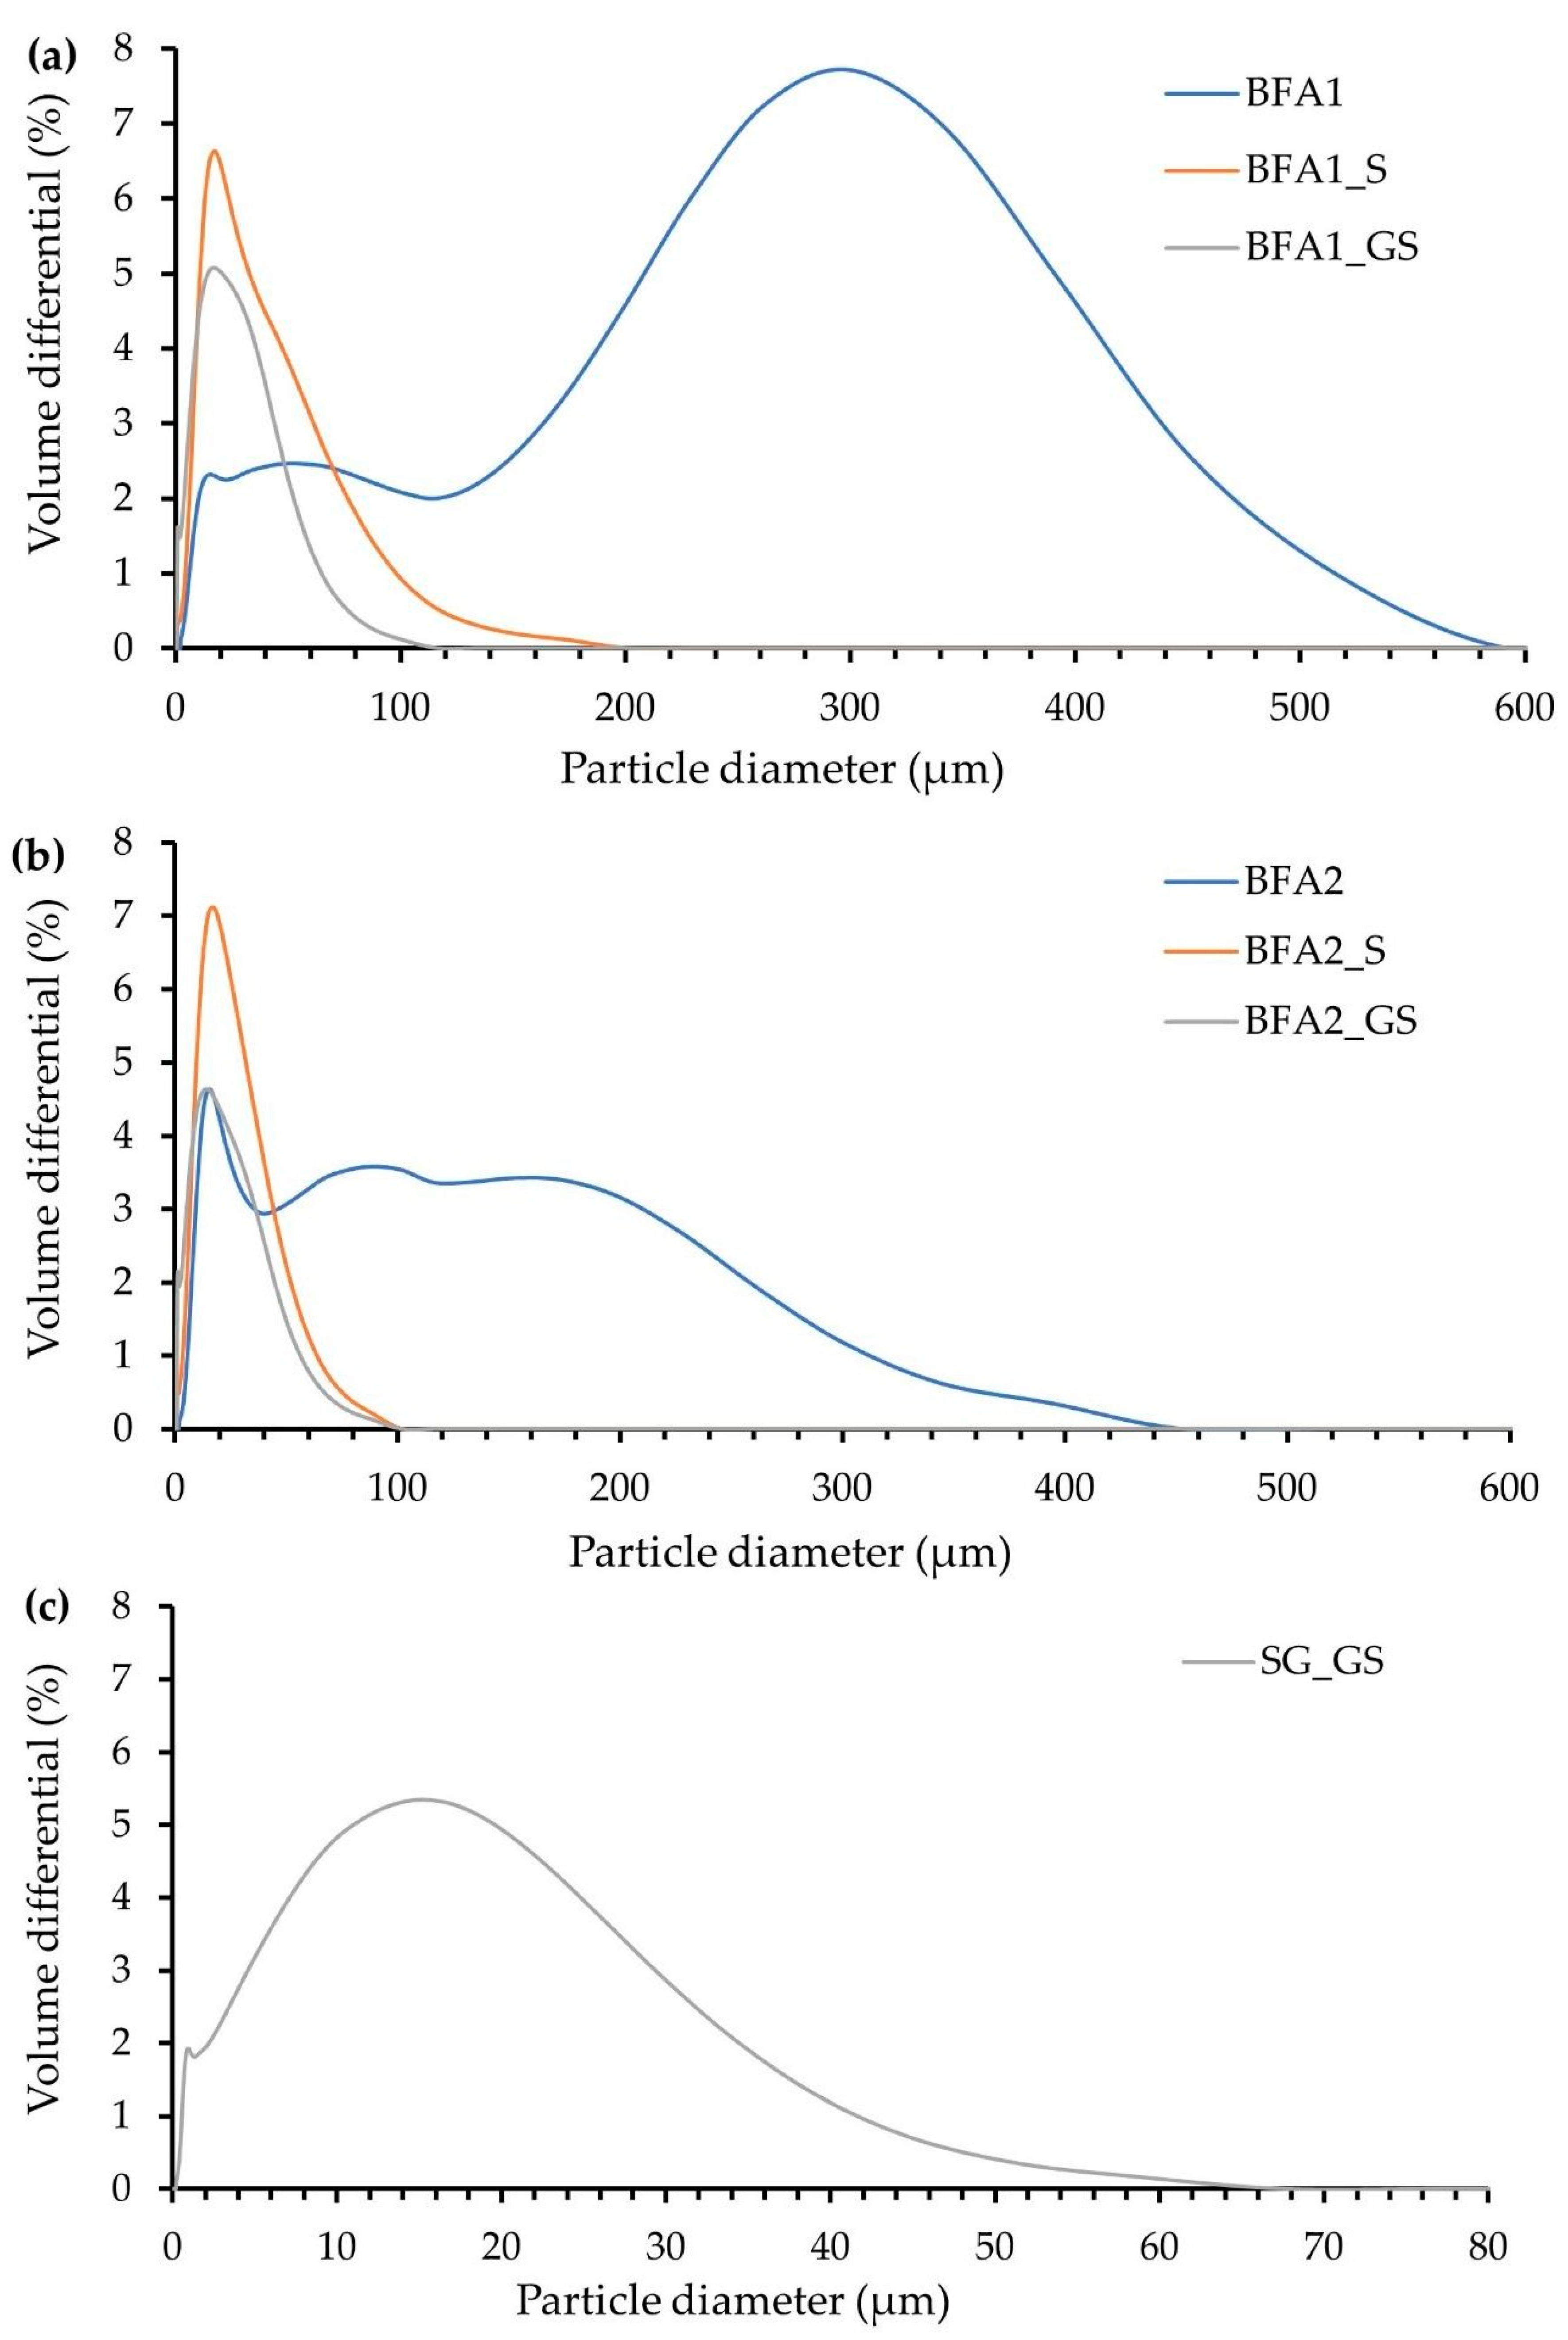
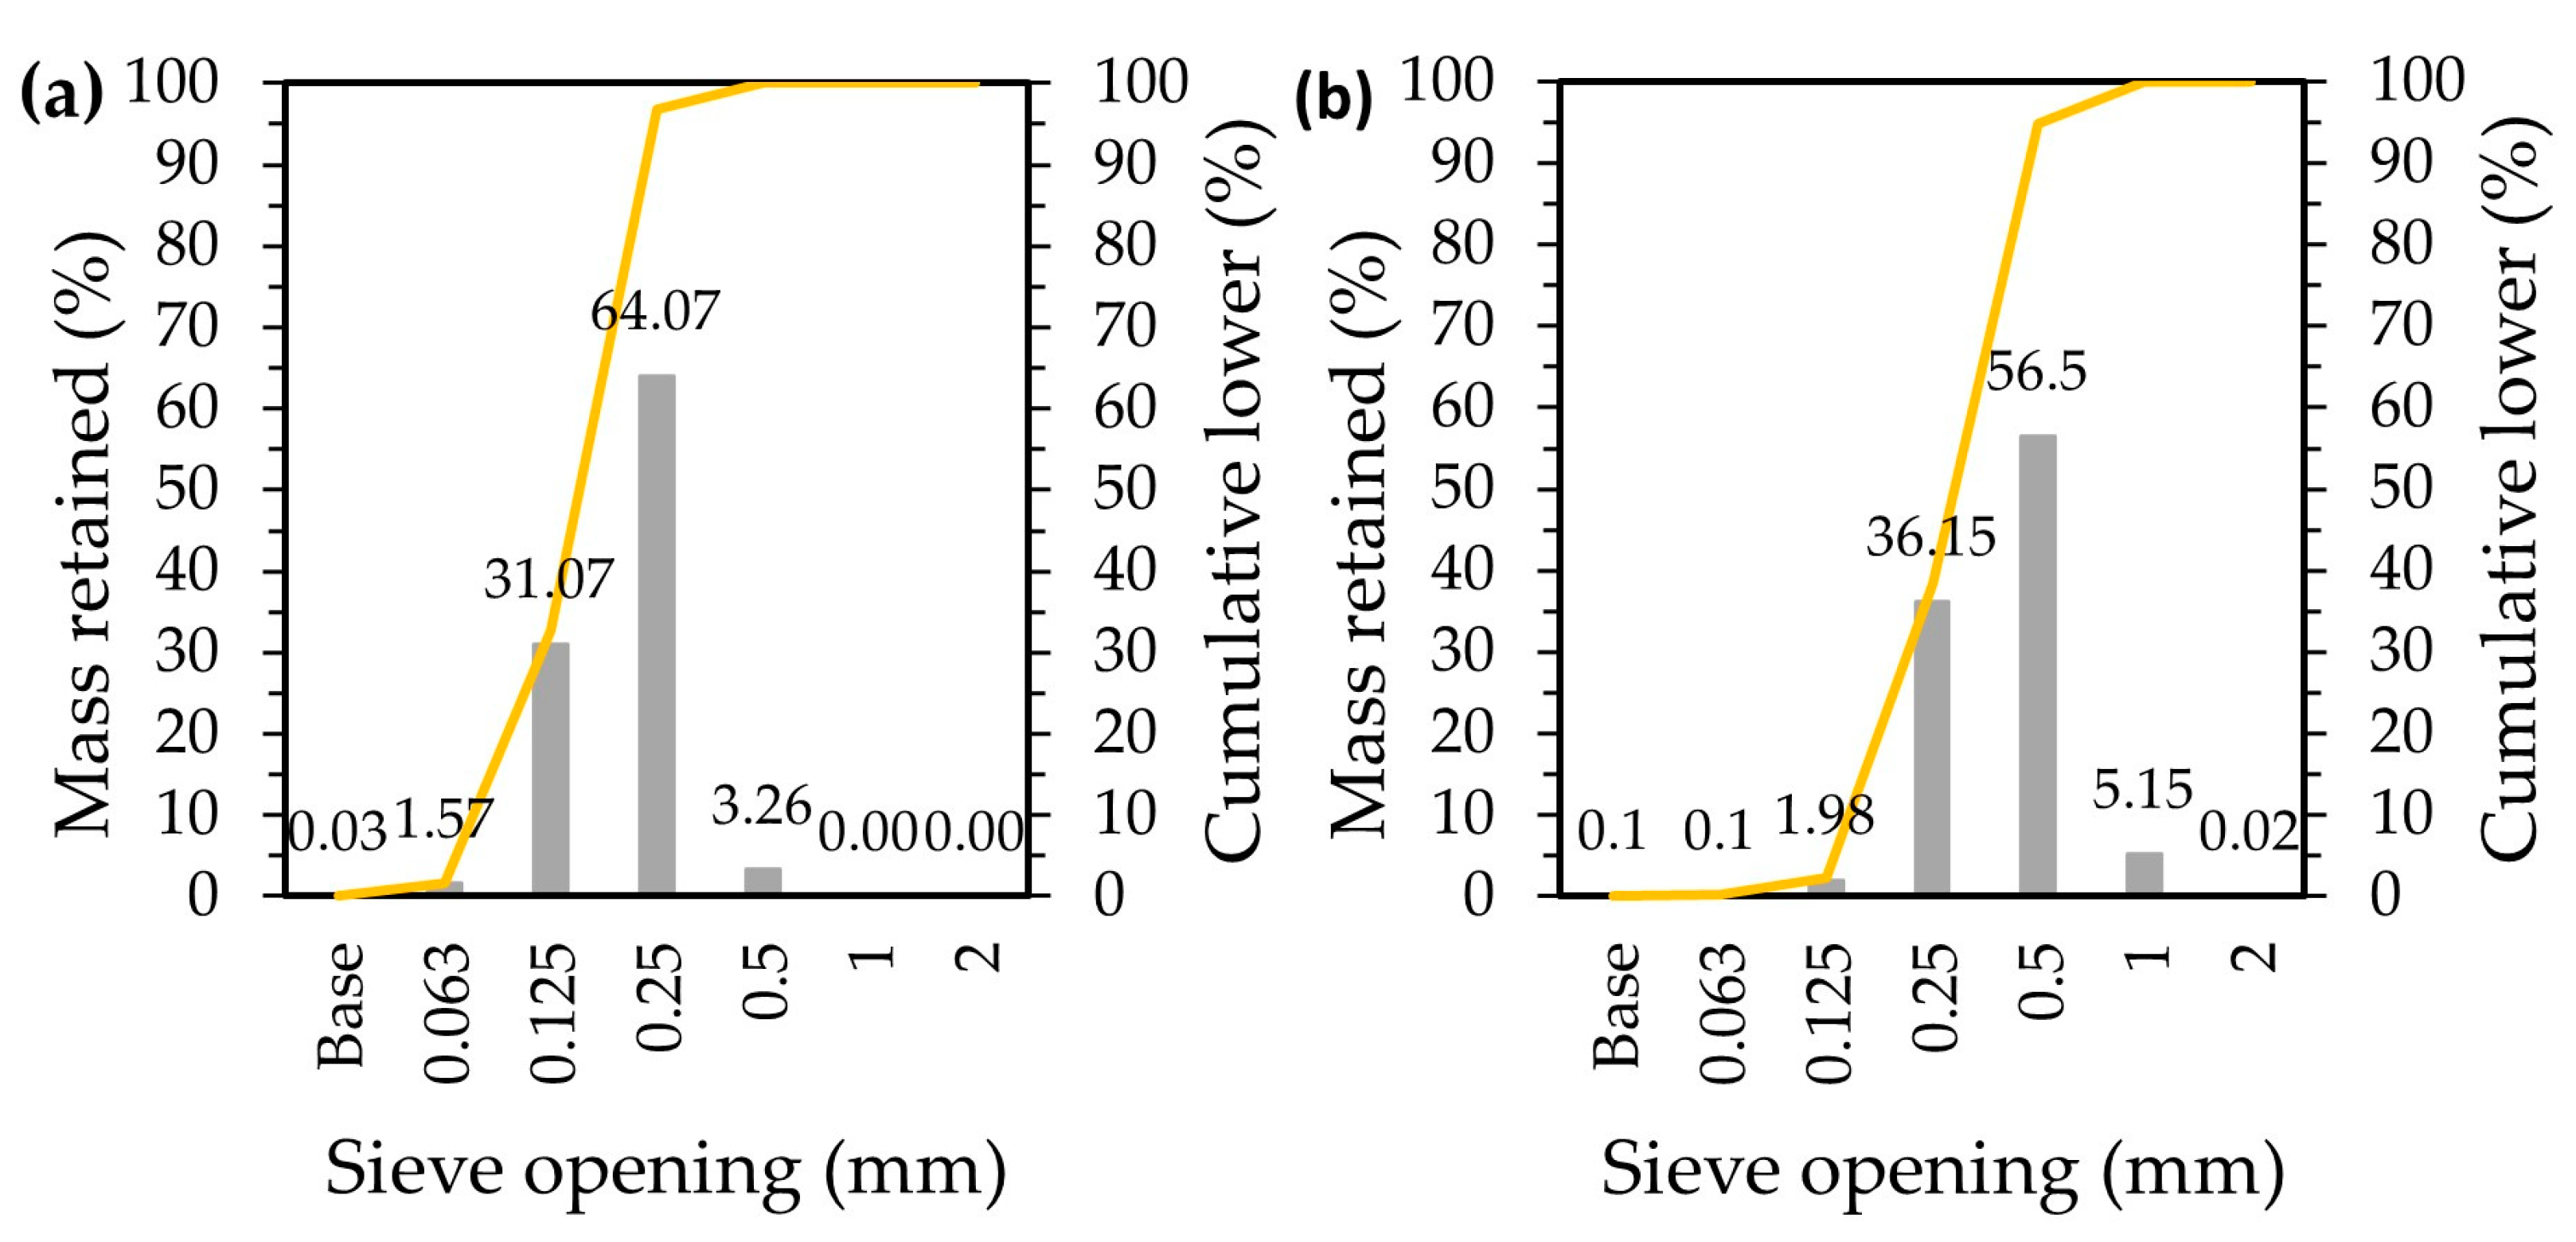
2.1.3. Particle Size Distribution and True Density
2.1.4. Particle Morphology
2.2. Screed Mortars Characterization
2.2.1. Spread of the Fresh Mortars
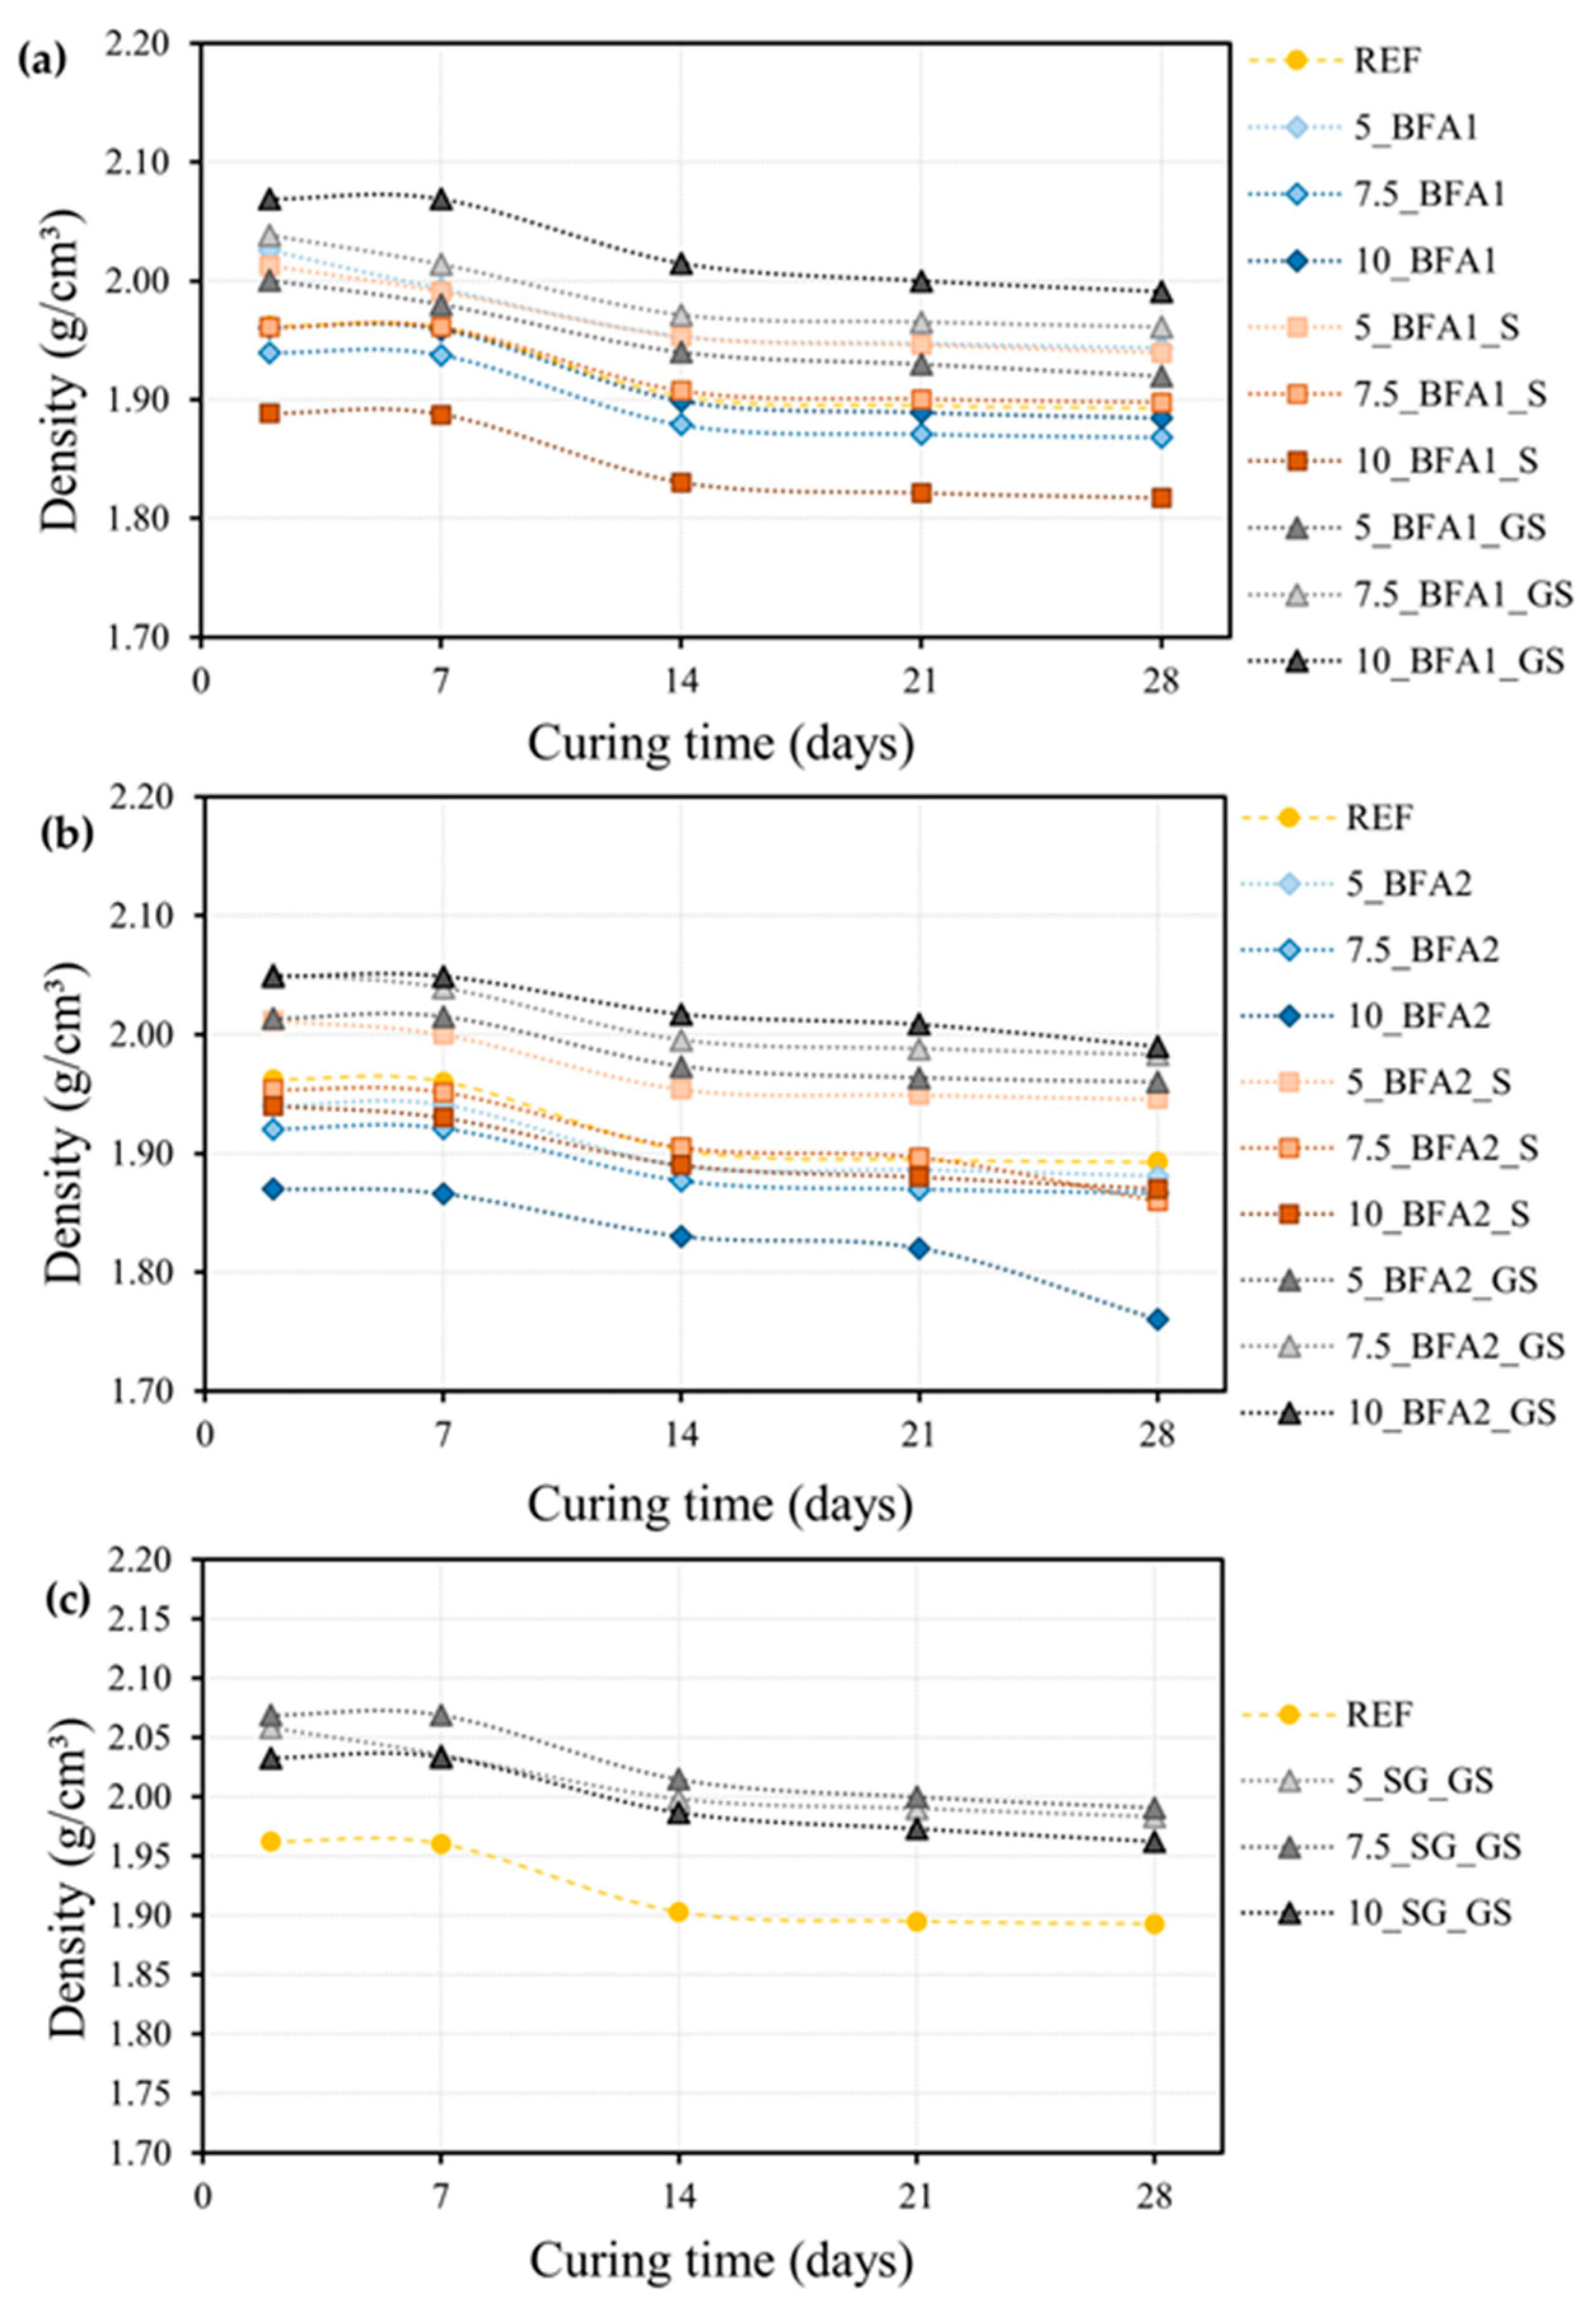
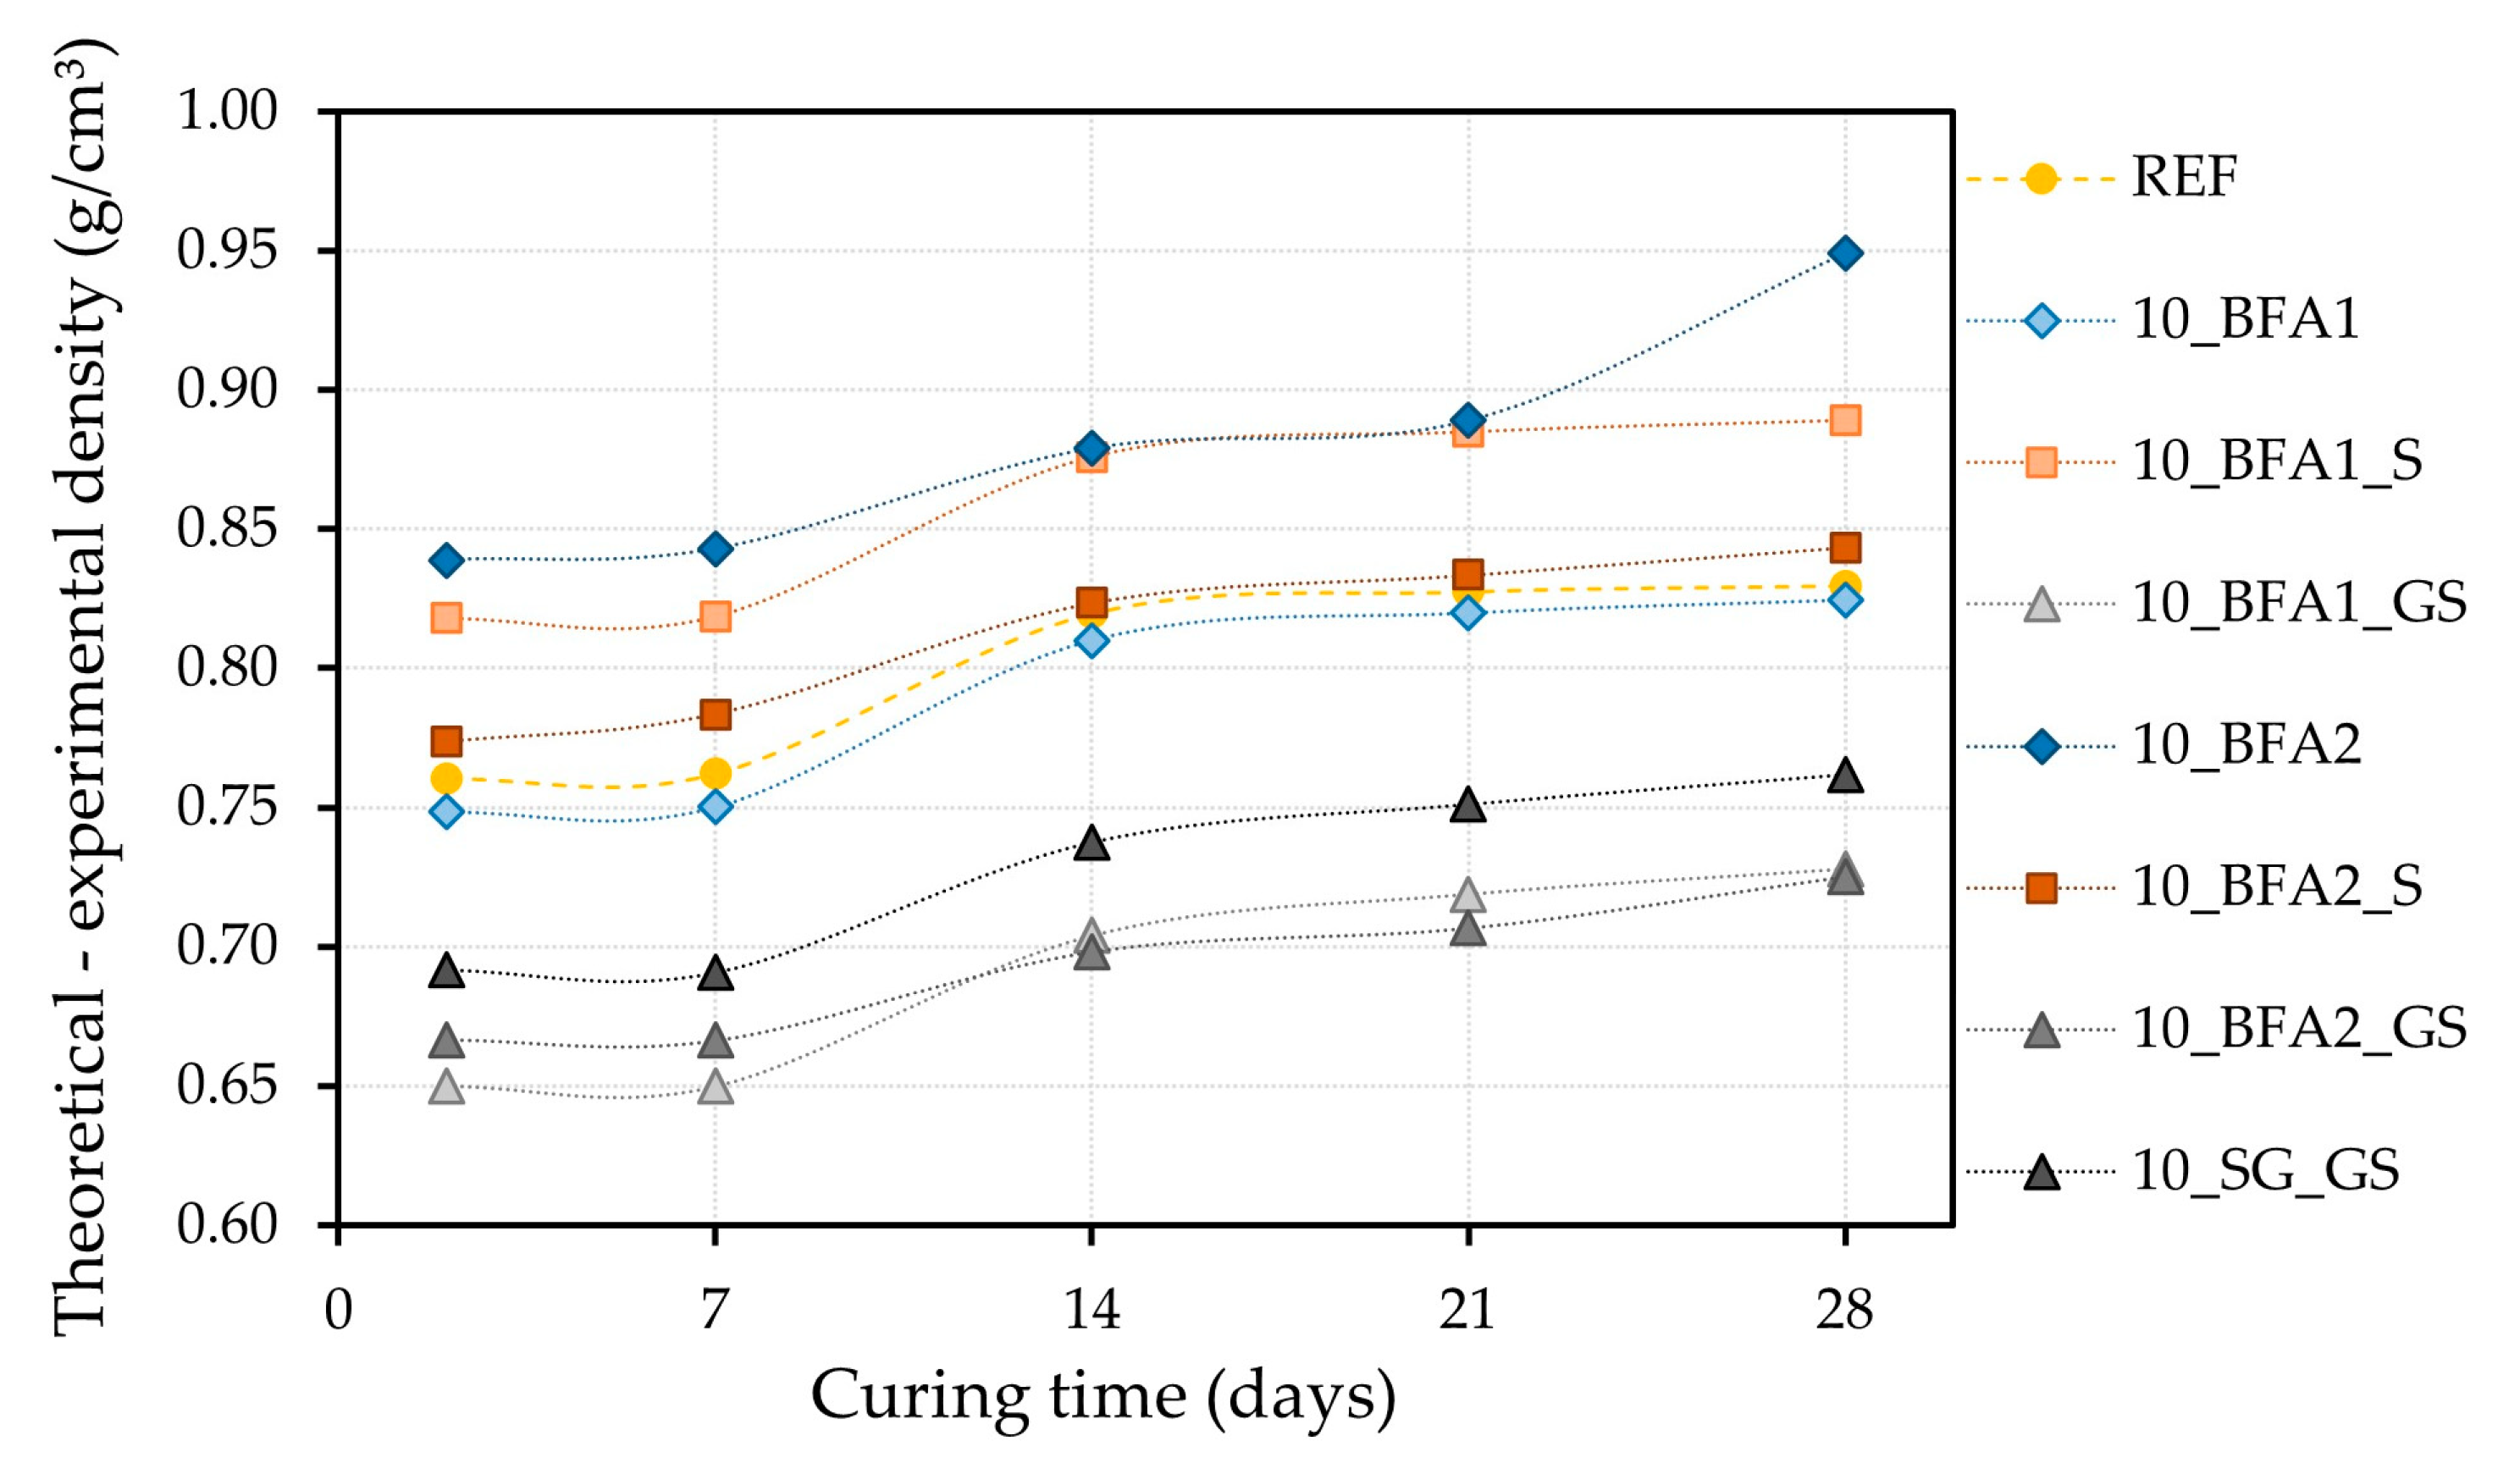
2.2.2. Density Changes upon Curing
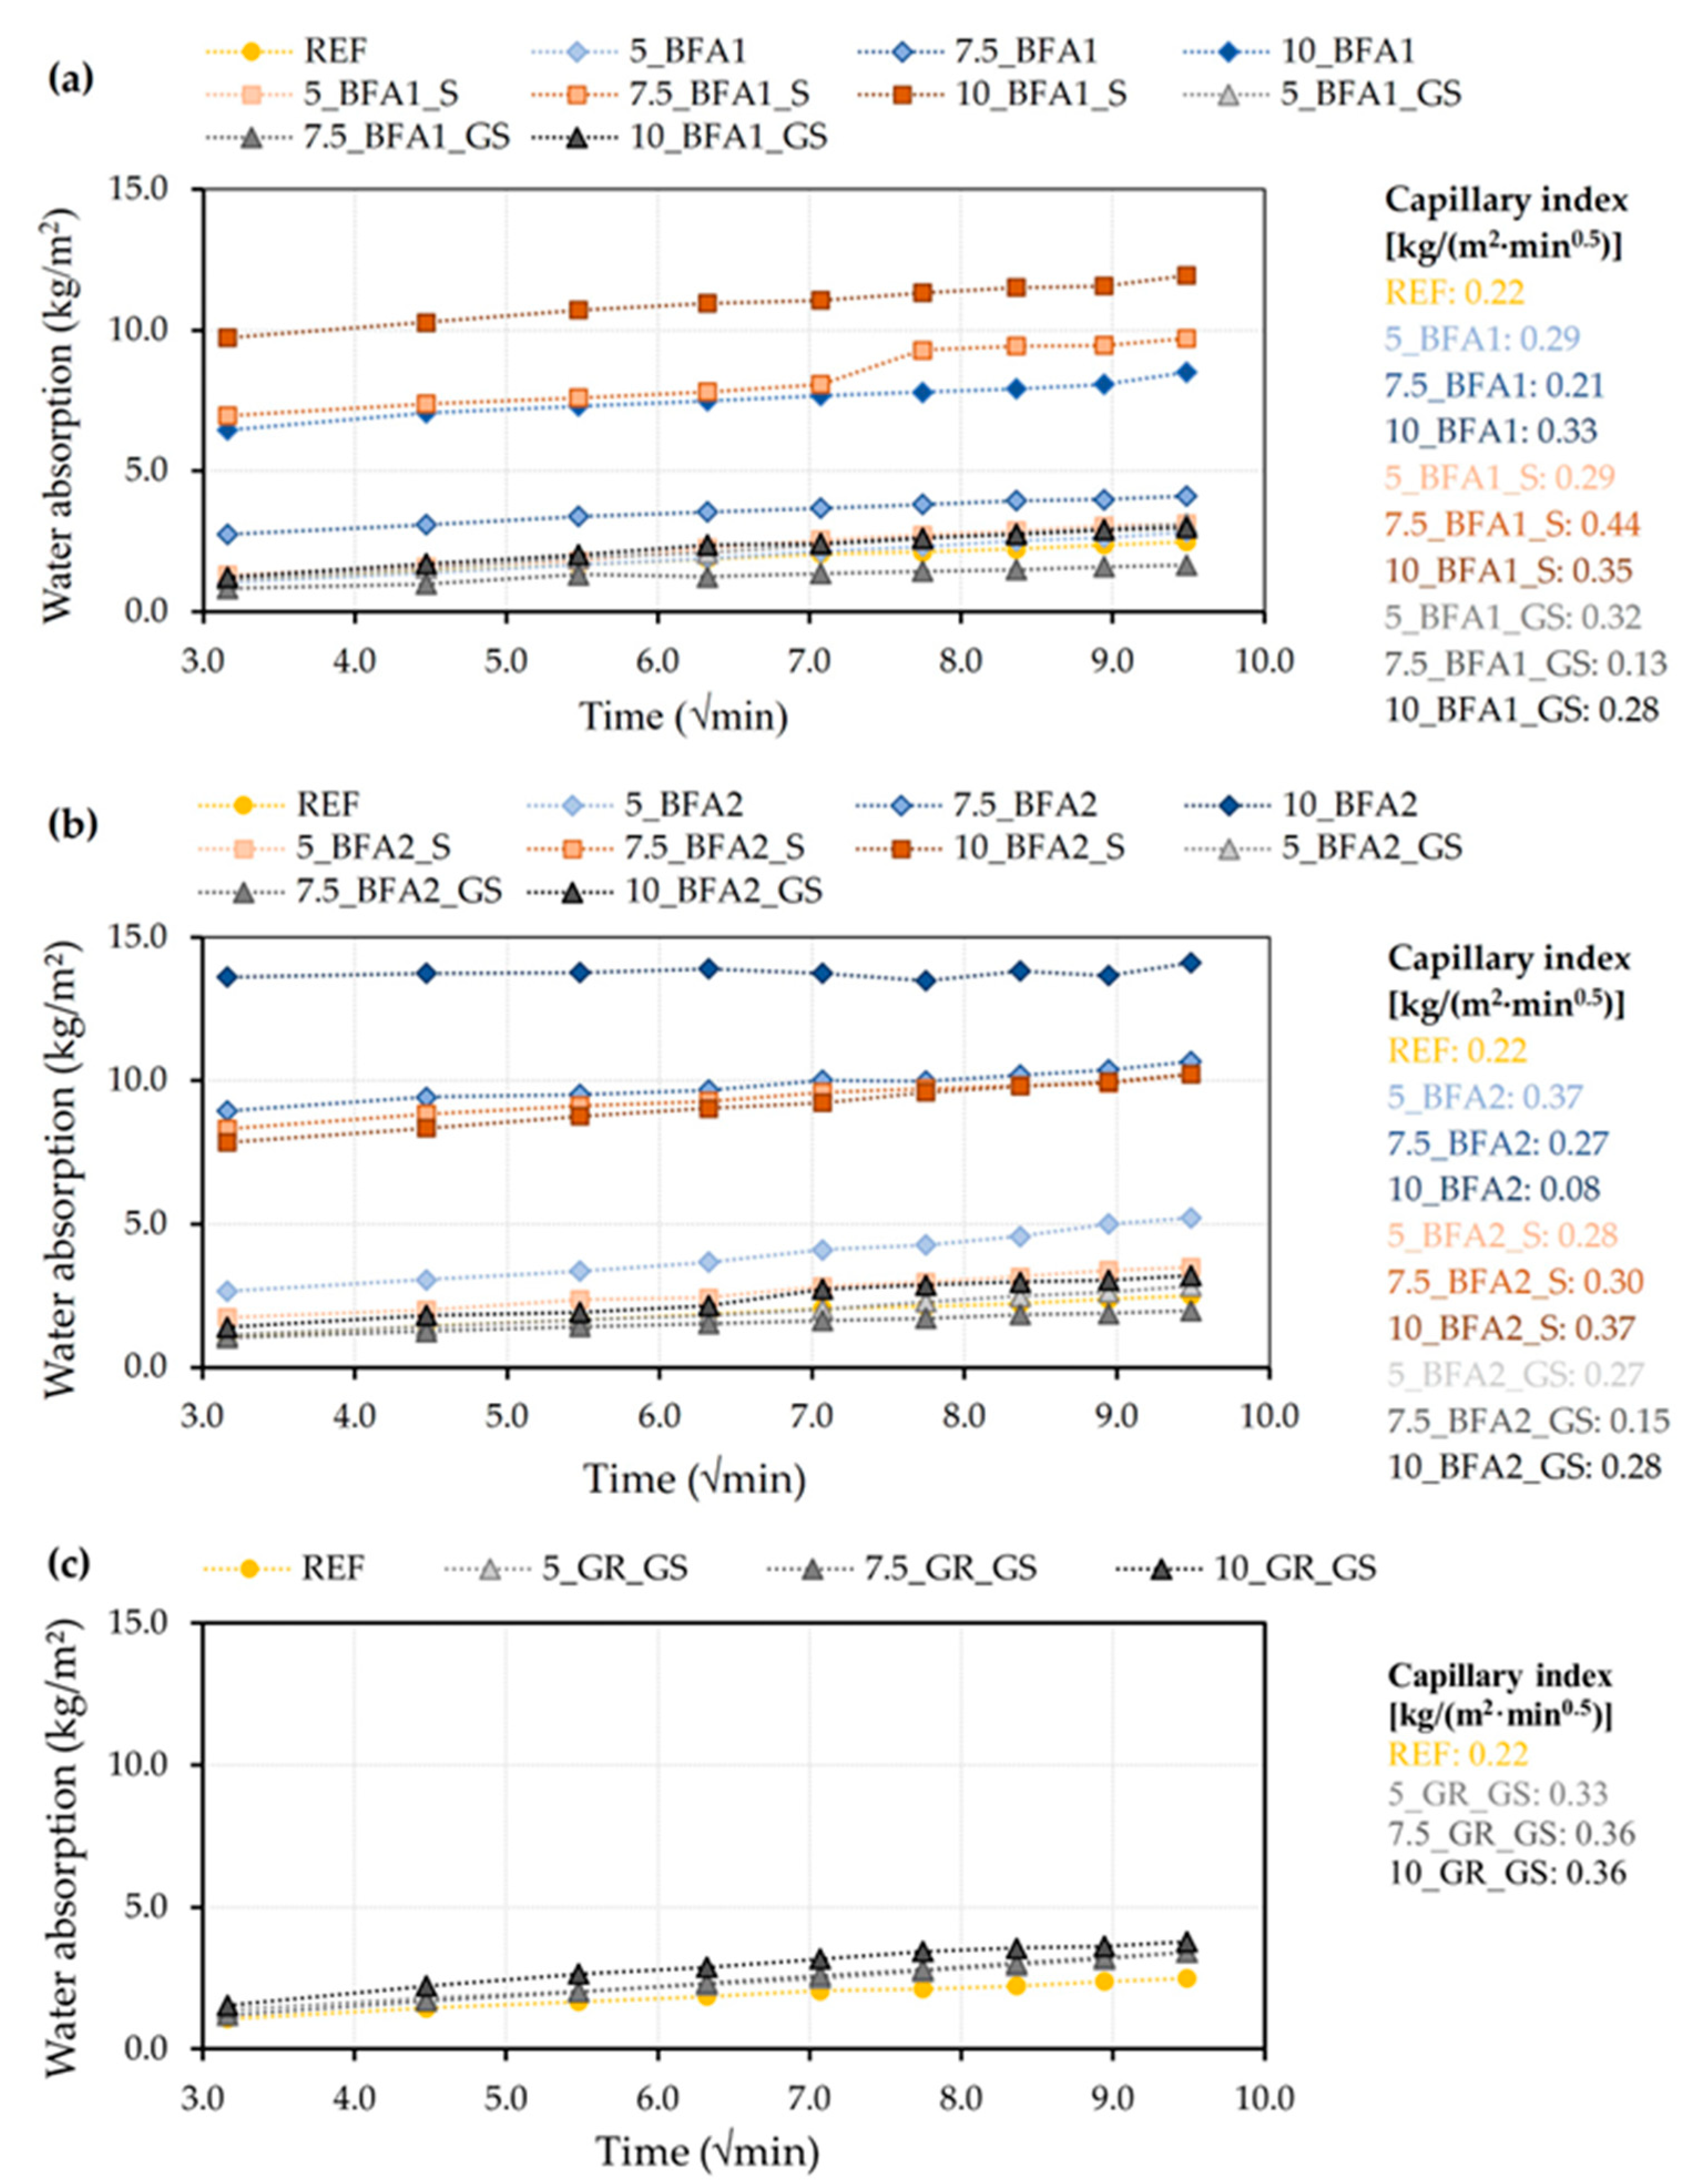
2.2.3. Water Absorption by Capillary of the Hardened Samples
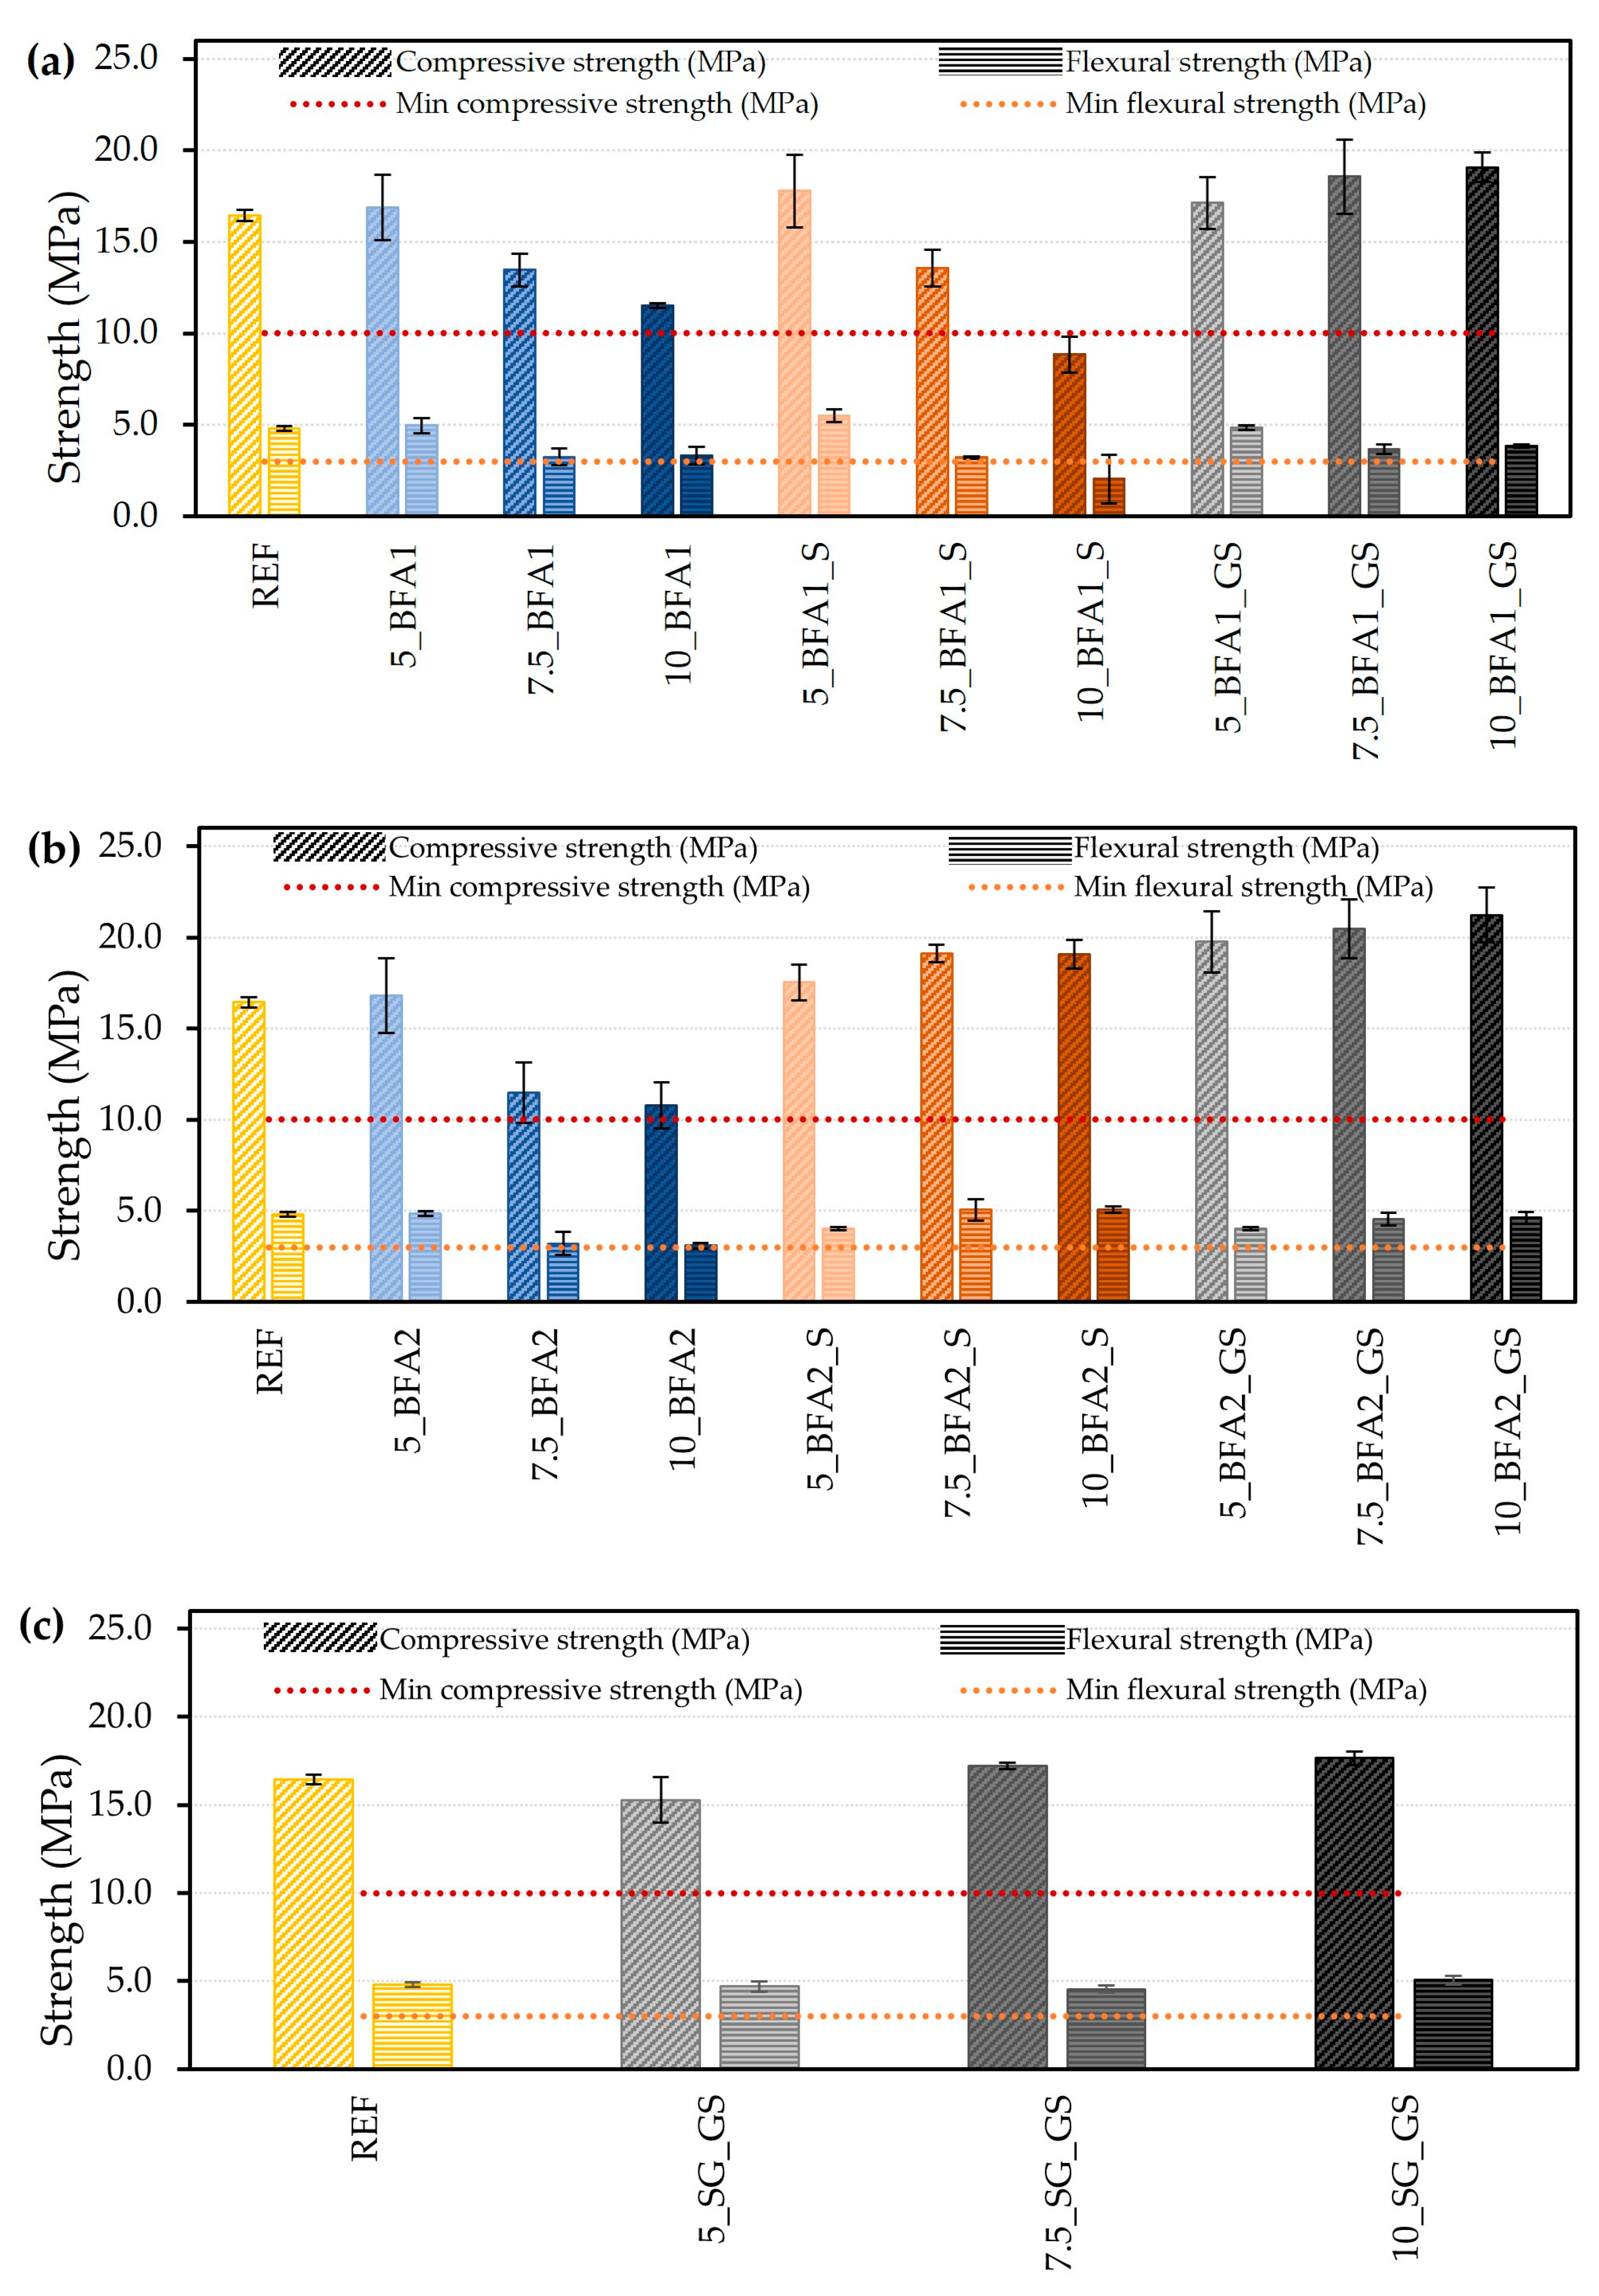
2.2.4. Mechanical Resistance of the Hardened Samples
2.3. Freeze-Thaw Resistance of the Hardened Samples
3. Economic Evaluation
4. Materials and Methods
4.1. Raw Materials
4.2. Specimens Preparation
- Tap water was weighted and added to the solids previously blended in a plastic bag;
- Mixing for 1 min at 60 rpm (KitchenAid, Artisan 175PS, Benton Harbor, USA);
- Stop for 1 min and manual mixing;
- Mechanically mixing for 1 min at the same speed (60 rpm).
4.3. Materials Characterization
4.4. Resistance to Freeze/Thaw of Cured Mortars
- (i)
- Immersion in distilled water throughout 24 h at 20 °C (±2 °C);
- (ii)
- Freezing at 20 °C (±2 °C) for 24 h;
- (iii)
- Drying at 60 °C (±2 °C) for 24 h.
5. Conclusions
Author Contributions
Funding
Institutional Review Board Statement
Informed Consent Statement
Data Availability Statement
Acknowledgments
Conflicts of Interest
Sample Availability
References
- Mandeep, G.; Gupta, K.; Shukla, P. Insights into the resources generation from pulp and paper industry wastes: Challenges, perspectives and innovations. Bioresour. Technol. 2019, 297, 122496. [Google Scholar] [CrossRef] [PubMed]
- Júnior, A.L.D.O.; Pedroti, L.G.; Oliveira, J.D.A.; Fernandes, W.E.H.; Fineza, A.G.; Monteiro, S.N.; Nalon, G. The influence of partial replacement of natural sand aggregates by grits residues on the mechanical properties of an ecological mortar. J. Build. Eng. 2019, 26, 100912. [Google Scholar] [CrossRef]
- Sigvardsen, N.M.; Geiker, M.R.; Ottosen, L.M. Reaction mechanisms of wood ash for use as a partial cement replacement. Constr. Build. Mater. 2021, 286, 122889. [Google Scholar] [CrossRef]
- Capela, M.N.; Tobaldi, D.M.; Tarelho, L.A.C.; Seabra, M.P.; Labrincha, J.A. Development of a Commercial Screed Mortar with Low OPC Content by Incorporation of Biomass Fly Ash. Appl. Sci. 2021, 11, 9630. [Google Scholar] [CrossRef]
- Tavares, J.C.; Lucena, L.F.; Henriques, G.F.; Ferreira, R.L.; dos Anjos, M.A. Use of banana leaf ash as partial replacement of Portland cement in eco-friendly concretes. Constr. Build. Mater. 2022, 346, 128467. [Google Scholar] [CrossRef]
- Wu, N.; Ji, T.; Huang, P.; Fu, T.; Zheng, X.; Xu, Q. Use of sugar cane bagasse ash in ultra-high performance concrete (UHPC) as cement replacement. Constr. Build. Mater. 2022, 317, 125881. [Google Scholar] [CrossRef]
- Berra, M.; Mangialardi, T.; Paolini, A.E. Reuse of woody biomass fly ash in cement-based materials. Constr. Build. Mater. 2015, 76, 286–296. [Google Scholar] [CrossRef]
- Al-Shwaiter, A.; Awang, H.; Khalaf, M.A. Performance of sustainable lightweight foam concrete prepared using palm oil fuel ash as a sand replacement. Constr. Build. Mater. 2022, 322, 126482. [Google Scholar] [CrossRef]
- Cuenca, J.; Rodríguez, J.; Martín-Morales, M.; Sánchez-Roldán, Z.; Zamorano, M. Effects of olive residue biomass fly ash as filler in self-compacting concrete. Constr. Build. Mater. 2013, 40, 702–709. [Google Scholar] [CrossRef]
- Modolo, R.C.E.; Senff, L.; Ferreira, V.; Tarelho, L.A.D.C.; Moraes, C.A.M. Fly ash from biomass combustion as replacement raw material and its influence on the mortars durability. J. Mater. Cycles Waste Manag. 2017, 20, 1006–1015. [Google Scholar] [CrossRef]
- Dos Santos, V.R.; Cabrelon, M.D.; Trichês, E.D.S.; Quinteiro, E. Green liquor dregs and slaker grits residues characterization of a pulp and paper mill for future application on ceramic products. J. Clean. Prod. 2019, 240, 118220. [Google Scholar] [CrossRef]
- Siqueira, F.; Holanda, J. Reuse of grits waste for the production of soil–cement bricks. J. Environ. Manag. 2013, 131, 1–6. [Google Scholar] [CrossRef] [PubMed]
- Saeli, M.; Senff, L.; Tobaldi, D.M.; Seabra, M.P.; Labrincha, J.A. Novel biomass fly ash-based geopolymeric mortars using lime slaker grits as aggregate for applications in construction: Influence of granulometry and binder/aggregate ratio. Constr. Build. Mater. 2019, 227, 116643. [Google Scholar] [CrossRef]
- Saeli, M.; Senff, L.; Tobaldi, D.M.; La Scalia, G.; Seabra, M.P.; Labrincha, J.A. Innovative Recycling of Lime Slaker Grits from Paper-Pulp Industry Reused as Aggregate in Ambient Cured Biomass Fly Ash-Based Geopolymers for Sustainable Construction Material. Sustainability 2019, 11, 3481. [Google Scholar] [CrossRef] [Green Version]
- Capela, M.N.; Cesconeto, F.R.; Pinto, P.C.; Tarelho, L.A.C.; Seabra, M.P.; Labrincha, J.A. Biomass Fly Ash Self - Hardened Adsorbent Monoliths for Methylene Blue Removal from Aqueous Solutions. Appl. Sci. 2022, 12, 5134. [Google Scholar] [CrossRef]
- Teixeira, E.R.; Camões, A.; Branco, F.G. Valorisation of wood fly ash on concrete. Resour. Conserv. Recycl. 2019, 145, 292–310. [Google Scholar] [CrossRef]
- Rissanen, J.; Ohenoja, K.; Kinnunen, P.; Romagnoli, M.; Illikainen, M. Milling of peat-wood fly ash: Effect on water demand of mortar and rheology of cement paste. Constr. Build. Mater. 2018, 180, 143–153. [Google Scholar] [CrossRef]
- Oliveira, M.J.; Ribeiro, A.B.; Branco, F.G. Shrinkage of self-compacting concrete. A comparative analysis. J. Build. Eng. 2017, 9, 117–124. [Google Scholar] [CrossRef]
- Modolo, R.C.E.; Ferreira, V.M.; Tarelho, L.A.; Labrincha, J.A.; Senff, L.; Silva, L. Mortar formulations with bottom ash from biomass combustion. Constr. Build. Mater. 2013, 45, 275–281. [Google Scholar] [CrossRef]
- Rojo-López, G.; González-Fonteboa, B.; Martínez-Abella, F.; González-Taboada, I. Rheology, durability, and mechanical performance of sustainable self-compacting concrete with metakaolin and limestone filler. Case Stud. Constr. Mater. 2022, 17, e01143. [Google Scholar] [CrossRef]
- Sigvardsen, N.M.; Geiker, M.R.; Ottosen, L.M. Phase development and mechanical response of low-level cement replacements with wood ash and washed wood ash. Constr. Build. Mater. 2021, 269, 121234. [Google Scholar] [CrossRef]
- dingbocrusher.net. Available online: https://www.dingbocrusher.net/products/screening-washing-machine/Vibrating-Screen.html (accessed on 29 August 2022).
- datahub.ren.pt. Available online: https://datahub.ren.pt/pt/eletricidade/mercado/ (accessed on 29 August 2022).
- m.zenith-mills.com. Available online: mill.zenith-mills.com/products/mills/ball-mill.html (accessed on 29 August 2022).
- EN 196-1:2005; Methods of Testing Cement—Part 1: Determination of Strength. CEN: Brussels, Belgium, 2005.
- BS 8204-1:2003; Screeds, Bases and In Situ Floorings—Part 1: Concrete Bases and Cement Sand Levellings Screeds to Receive Floorings—Code of Practice. BSI: London, UK, 2003.
- EN 1015-3:1998; Methods of Test for Mortar for Masonry—Part 3: Determination of Consistence of Fresh Mortar by Flow Table (1998). CEN: Brussels, Belgium, 1998.
- EN 1015-18:2002; Methods of Test for Mortar for Masonry—Part 18: Determination of Water Absorption Coefficient due to Capillary Action of Hardened Mortar. CEN: Brussels, Belgium, 2002.
- Gruszczyński, M.; Lenart, M. Durability of mortars modified with the addition of amorphous aluminum silicate and silica fume. Theor. Appl. Fract. Mech. 2020, 107, 102526. [Google Scholar] [CrossRef]
- Török, Á.; Szemerey-Kiss, B. Freeze-thaw durability of repair mortars and porous limestone: Compatibility issues. Prog. Earth Planet. Sci. 2019, 6, 42. [Google Scholar] [CrossRef]
- EN 998-2:2016; Specification for Mortar for Masonry—Part 2: Masonry Mortar. CEN: Brussels, Belgium, 2016.


| Chemical Composition (wt.%) | |||||||||||
|---|---|---|---|---|---|---|---|---|---|---|---|
| Si | Ca | Al | K | Fe | Mg | S | Na | P | Cl | LOI | |
| BFA1 | 17.83 | 19.28 | 6.28 | 5.44 | 3.81 | 1.92 | 0.96 | 0.99 | 0.58 | 1.12 | 6.05 |
| BFA1_S | 14.02 | 22.82 | 6.08 | 6.55 | 3.81 | 1.99 | 1.18 | 0.95 | 0.59 | 2.65 | 12.34 |
| BFA2 | 10.18 | 23.11 | 4.63 | 7.71 | 3.07 | 2.65 | 1.50 | 4.48 | 0.57 | 6.21 | 10.48 |
| BFA2_S | 6.21 | 18.39 | 2.98 | 9.42 | 2.09 | 1.67 | 1.29 | 13.38 | 0.38 | 14.66 | 15.02 |
| SG | 0.23 | 63.60 | 0.14 | 0.12 | 0.05 | 0.50 | 0.37 | 5.02 | 0.63 | 0.04 | 41.38 |
| Physical Characteristics | BFA1 | BFA1_S | BFA1_GS | BFA2 | BFA2_S | BFA2_GS | SG_GS |
|---|---|---|---|---|---|---|---|
| True density (g/cm3) | 2.57 | 2.54 | 2.68 | 2.57 | 2.62 | 2.64 | 2.74 |
| Mean particle diameter (µm) | 146.80 | 25.01 | 15.91 | 65.41 | 17.80 | 12.85 | 10.43 |
| Particle size fractions (μm) | |||||||
| D10 | 10.42 | 5.84 | 1.45 | 8.33 | 4.15 | 1.11 | 0.97 |
| D50 | 109.14 | 18.08 | 11.62 | 33.86 | 14.49 | 8.70 | 7.88 |
| D90 | 333.36 | 53.88 | 36.50 | 173.47 | 36.00 | 30.94 | 23.72 |
| D100 | 517.13 | 174.40 | 101.33 | 394.09 | 88.52 | 88.49 | 58.90 |
| Spread Values (mm) | |
|---|---|
| Slurries | Final |
| REF | 109 |
| 5_BFA1 | 107 |
| 7.5_BFA1 | Fell apart |
| 10_BFA1 | Fell apart |
| 5_BFA1_S | 106 |
| 7.5_BFA1_S | Fell apart |
| 10_BFA1_S | Fell apart |
| 5_BFA1_GS | 111 |
| 7.5_BFA1_GS | 112 |
| 10_BFA1_GS | 115 |
| 5_BFA2 | 102 |
| 7.5_BFA2 | Fell apart |
| 10_BFA2 | Fell apart |
| 5_BFA2_S | 106 |
| 7.5_BFA2_S | 108 |
| 10_BFA2_S | 111 |
| 5_BFA2_GS | 104 |
| 7.5_BFA2_GS | 107 |
| 10_BFA2_GS | 111 |
| 5_SG_GS | 113 |
| 7.5_SG_GS | 114 |
| 10_SG_GS | 118 |
| Density | Water Absorption | Compressive Strength | |||||||
|---|---|---|---|---|---|---|---|---|---|
| Sample | 5 Cycles | 15 Cycles | 25 Cycles | 5 Cycles | 15 Cycles | 25 Cycles | 5 Cycles | 15 Cycles | 25 Cycles |
| REF | −2.1 | 0.9 | −0.2 | 5.1 | −1.4 | −0.9 | −11.0 | 1.7 | −27.3 |
| 7.5_BFA1 | 0.6 | 0.5 | −3.0 | 5.7 | 3.2 | 0.7 | −21.0 | −63.3 | −20.2 |
| 7.5_BFA2 | 3.0 | 1.6 | 0.7 | 2.1 | 4.6 | −9.7 | −15.1 | −17.1 | 5.1 |
| 10_BFA1_GS | 5.1 | 4.9 | −1.0 | 10.3 | 17.2 | 3.8 | 12.2 | 18.6 | 6.6 |
| 10_BFA2_GS | 4.1 | 1.1 | −0.9 | 9.5 | 11.0 | −2.8 | 1.9 | 6.0 | −10.6 |
| 10_SG_GS | 6.1 | 5.1 | −1.8 | 1.3 | 5.3 | 3.7 | 17.6 | 8.8 | −9.2 |
| 7.5 wt.% BFA | 10.0 wt.% BFA_GS | 10.0 wt.% SG_GS | |
|---|---|---|---|
| Screed mortar price (€/t) | 103.60 | 103.60 | 103.60 |
| Screed mortar saved with the addition (Kg/tmortar) 1 | −69.80 | −90.90 | −90.90 |
| Screed mortar saved (€/tmortar) | 7.23 | 9.42 | 9.42 |
| BFA/SG consumed (Kg/tmortar) | 69.80 | 90.90 | 90.90 |
| BFA/SG moisture (wt.%) | ~1 | ~1 | ~7 [14] |
| Wet BFA/SG consumed (Kg/tmortar) | 70.51 | 91.82 | 97.74 |
| BFA/SG transport distance (km) 2 | 2 × 6 | 2 × 6 | 2 × 6 |
| BFA/SG transport cost (€/twaste) 3 | 0.45 | 0.45 | 0.45 |
| BFA/SG transport cost (€/tmortar) | 0.03 | 0.04 | 0.04 |
| Sieving cost (Ø < 2 mm) (€/twaste) 4 | 0.21 | 0.21 | - |
| BFA/SG sieving cost (€/tmortar) | 0.01 | 0.02 | - |
| Milling cost (€/twaste) 5 | - | 5.36 | 5.36 |
| BFA/SG milling cost (€/tmortar) | - | 0.49 | 0.52 |
| Sieving cost (€/twaste) 4 | - | 0.21 | 0.21 |
| BFA/SG sieving cost (Ø < 63 µm/75 µm) (€/tmortar) | - | 0.02 | 0.02 |
| Storage cost (€/tmortar) 6 | - | - | - |
| Blending cost (€/tmortar) 6 | - | - | - |
| Packaging cost (€/ton) (€/tmortar) 6 | - | - | - |
| Estimated savings (€/tmortar) | 7.19 | 8.85 | 8.84 |
| Raw Materials (g) | ||||||||||||
|---|---|---|---|---|---|---|---|---|---|---|---|---|
| Formulations | Water | OPC | S1 | S2 | L | BFA1 | BFA1_S | BFA1_GS | BFA2 | BFA2_S | BFA2_GS | SG_GS |
| REF | 10.00 | 15.00 | 35.00 | 35.00 | 15.00 | - | - | - | - | - | - | - |
| 5_BFA1 | 10.50 | 15.00 | 35.00 | 35.00 | 15.00 | 5.00 | - | - | - | - | - | - |
| 5_BFA1_S | 10.50 | 15.00 | 35.00 | 35.00 | 15.00 | - | 5.00 | - | - | - | - | - |
| 5_BFA1_GS | 10.50 | 15.00 | 35.00 | 35.00 | 15.00 | - | - | 5.00 | - | - | - | - |
| 5_BFA2 | 10.50 | 15.00 | 35.00 | 35.00 | 15.00 | - | - | - | 5.00 | - | - | - |
| 5_BFA2_S | 10.50 | 15.00 | 35.00 | 35.00 | 15.00 | - | - | - | - | 5.00 | - | - |
| 5_BFA2_GS | 10.50 | 15.00 | 35.00 | 35.00 | 15.00 | - | - | - | - | - | 5.00 | - |
| 5_SG_GS | 10.50 | 15.00 | 35.00 | 35.00 | 15.00 | - | - | - | - | - | - | 5.00 |
| 7.5_BFA1 | 10.75 | 15.00 | 35.00 | 35.00 | 15.00 | 7.50 | - | - | - | - | - | - |
| 7.5_BFA1_S | 10.75 | 15.00 | 35.00 | 35.00 | 15.00 | - | 7.50 | - | - | - | - | - |
| 7.5_BFA1_GS | 10.75 | 15.00 | 35.00 | 35.00 | 15.00 | - | - | 7.50 | - | - | - | - |
| 7.5_BFA2 | 10.75 | 15.00 | 35.00 | 35.00 | 15.00 | - | - | - | 7.50 | - | - | - |
| 7.5_ BFA2_S | 10.75 | 15.00 | 35.00 | 35.00 | 15.00 | - | - | - | - | 7.50 | - | - |
| 7.5_BFA2_GS | 10.75 | 15.00 | 35.00 | 35.00 | 15.00 | - | - | - | - | - | 7.50 | - |
| 7.5_SG_GS | 10.75 | 15.00 | 35.00 | 35.00 | 15.00 | - | - | - | - | - | - | 7.50 |
| 10_BFA1 | 11.00 | 15.00 | 35.00 | 35.00 | 15.00 | 10.00 | - | - | - | - | - | - |
| 10_BFA1_S | 11.00 | 15.00 | 35.00 | 35.00 | 15.00 | - | 10.00 | - | - | - | - | - |
| 10_BFA1_GS | 11.00 | 15.00 | 35.00 | 35.00 | 15.00 | - | - | 10.00 | - | - | - | - |
| 10_BFA2 | 11.00 | 15.00 | 35.00 | 35.00 | 15.00 | - | - | - | 10.00 | - | - | - |
| 10_BFA2_S | 11.00 | 15.00 | 35.00 | 35.00 | 15.00 | - | - | - | - | 10.00 | - | - |
| 10_BFA2_GS | 11.00 | 15.00 | 35.00 | 35.00 | 15.00 | - | - | - | - | - | 10.00 | - |
| 10_SG_GS | 11.00 | 15.00 | 35.00 | 35.00 | 15.00 | - | - | - | - | - | - | 10.00 |
Publisher’s Note: MDPI stays neutral with regard to jurisdictional claims in published maps and institutional affiliations. |
© 2022 by the authors. Licensee MDPI, Basel, Switzerland. This article is an open access article distributed under the terms and conditions of the Creative Commons Attribution (CC BY) license (https://creativecommons.org/licenses/by/4.0/).
Share and Cite
Capela, M.N.; Vilarinho, I.S.; Vieira, I.; Tarelho, L.A.C.; Seabra, M.P.; Labrincha, J.A. Valorization of Kraft Pulp and Paper Mill Slaker Grits and Biomass Fly Ash as Fillers in a Commercial Screed Mortar Formulation. Molecules 2022, 27, 8613. https://doi.org/10.3390/molecules27238613
Capela MN, Vilarinho IS, Vieira I, Tarelho LAC, Seabra MP, Labrincha JA. Valorization of Kraft Pulp and Paper Mill Slaker Grits and Biomass Fly Ash as Fillers in a Commercial Screed Mortar Formulation. Molecules. 2022; 27(23):8613. https://doi.org/10.3390/molecules27238613
Chicago/Turabian StyleCapela, Marinélia N., Inês S. Vilarinho, Inês Vieira, Luís A. C. Tarelho, Maria P. Seabra, and João A. Labrincha. 2022. "Valorization of Kraft Pulp and Paper Mill Slaker Grits and Biomass Fly Ash as Fillers in a Commercial Screed Mortar Formulation" Molecules 27, no. 23: 8613. https://doi.org/10.3390/molecules27238613