Article

Investigation of In Vitro and In Vivo Metabolism of α-Amanitin in Rats Using Liquid Chromatography-Quadrupole Time-of-Flight Mass Spectrometric Method

College of Pharmacy and Institute of Drug Research and Development, Chungnam National University, 99 Daehak-ro, Yuseong-gu, Daejeon 34134, Republic of Korea
*
Author to whom correspondence should be addressed.
Molecules 2022, 27(23), 8612; https://doi.org/10.3390/molecules27238612
Submission received: 11 October 2022 / Revised: 22 November 2022 / Accepted: 1 December 2022 / Published: 6 December 2022

Abstract

:
The purpose of this study is to investigate the difference of in vitro–in vivo correlation of α-amanitin from clearance perspectives as well as to explore the possibility of extra-hepatic metabolism of α-amanitin. First, a liquid chromatography-quadrupole-time-of-flight-mass spectrometric (LC-qTOF-MS) method for α-amanitin in rat plasma was developed and applied to evaluate the in vitro liver microsomal metabolic stability using rat and human liver microsomes and the pharmacokinetics of α-amanitin in rat. The predicted hepatic clearance of α-amanitin in rat liver microsomes was quite low (5.05 mL/min/kg), whereas its in vivo clearance in rat (14.0 mL/min/kg) was close to the borderline between low and moderate clearance. To find out the difference between in vitro and in vivo metabolism, in vitro and in vivo metabolite identification was also conducted. No significant metabolites were identified from the in vivo rat plasma and the major circulating entity in rat plasma was α-amanitin itself. No reactive metabolites such as GSH-adducts were detected either. A glucuronide metabolite was newly identified from the in vitro liver microsomes samples with a trace level. A semi-mass balance study was also conducted to understand the in vivo elimination pathway of α-amanitin and it showed that most α-amanitin was mainly eliminated in urine as intact which implies some unknown transporters in kidney might play a role in the elimination of α-amanitin in rat in vivo. Further studies with transporters in the kidney would be warranted to figure out the in vivo clearance mechanism of α-amanitin.

1. Introduction

An antibody-drug-conjugate (ADC) is one of the interesting classes of targeted therapy and many pharmaceutical companies are working on ADC development [1]. Currently, 11 ADCs have been approved so far by US Food and Drug Administration (FDA) and more than 230 ADC compounds are being developed in the preclinical/clinical development stage [1]. ADC is composed of antibody, linker, and payload for targeting and killing cancer cells. Payloads are normally cytotoxic agents, and the payloads currently used in popular are auristatins, maytansinoids, calicheamicins, duocarmycins, pyrrolobenzodiazepines (PBD), and α-amanitin [1]. Heidelberg Pharma, a German pharmaceutical company, is actively developing ADC programs using α-amanitin as a payload featuring antibody targeted amanitin conjugate (ATAC) platform [2]. HDP-101, an ADC developed by Heidelberg Pharma, is already in the clinical stage targeting multiple myeloma [2].
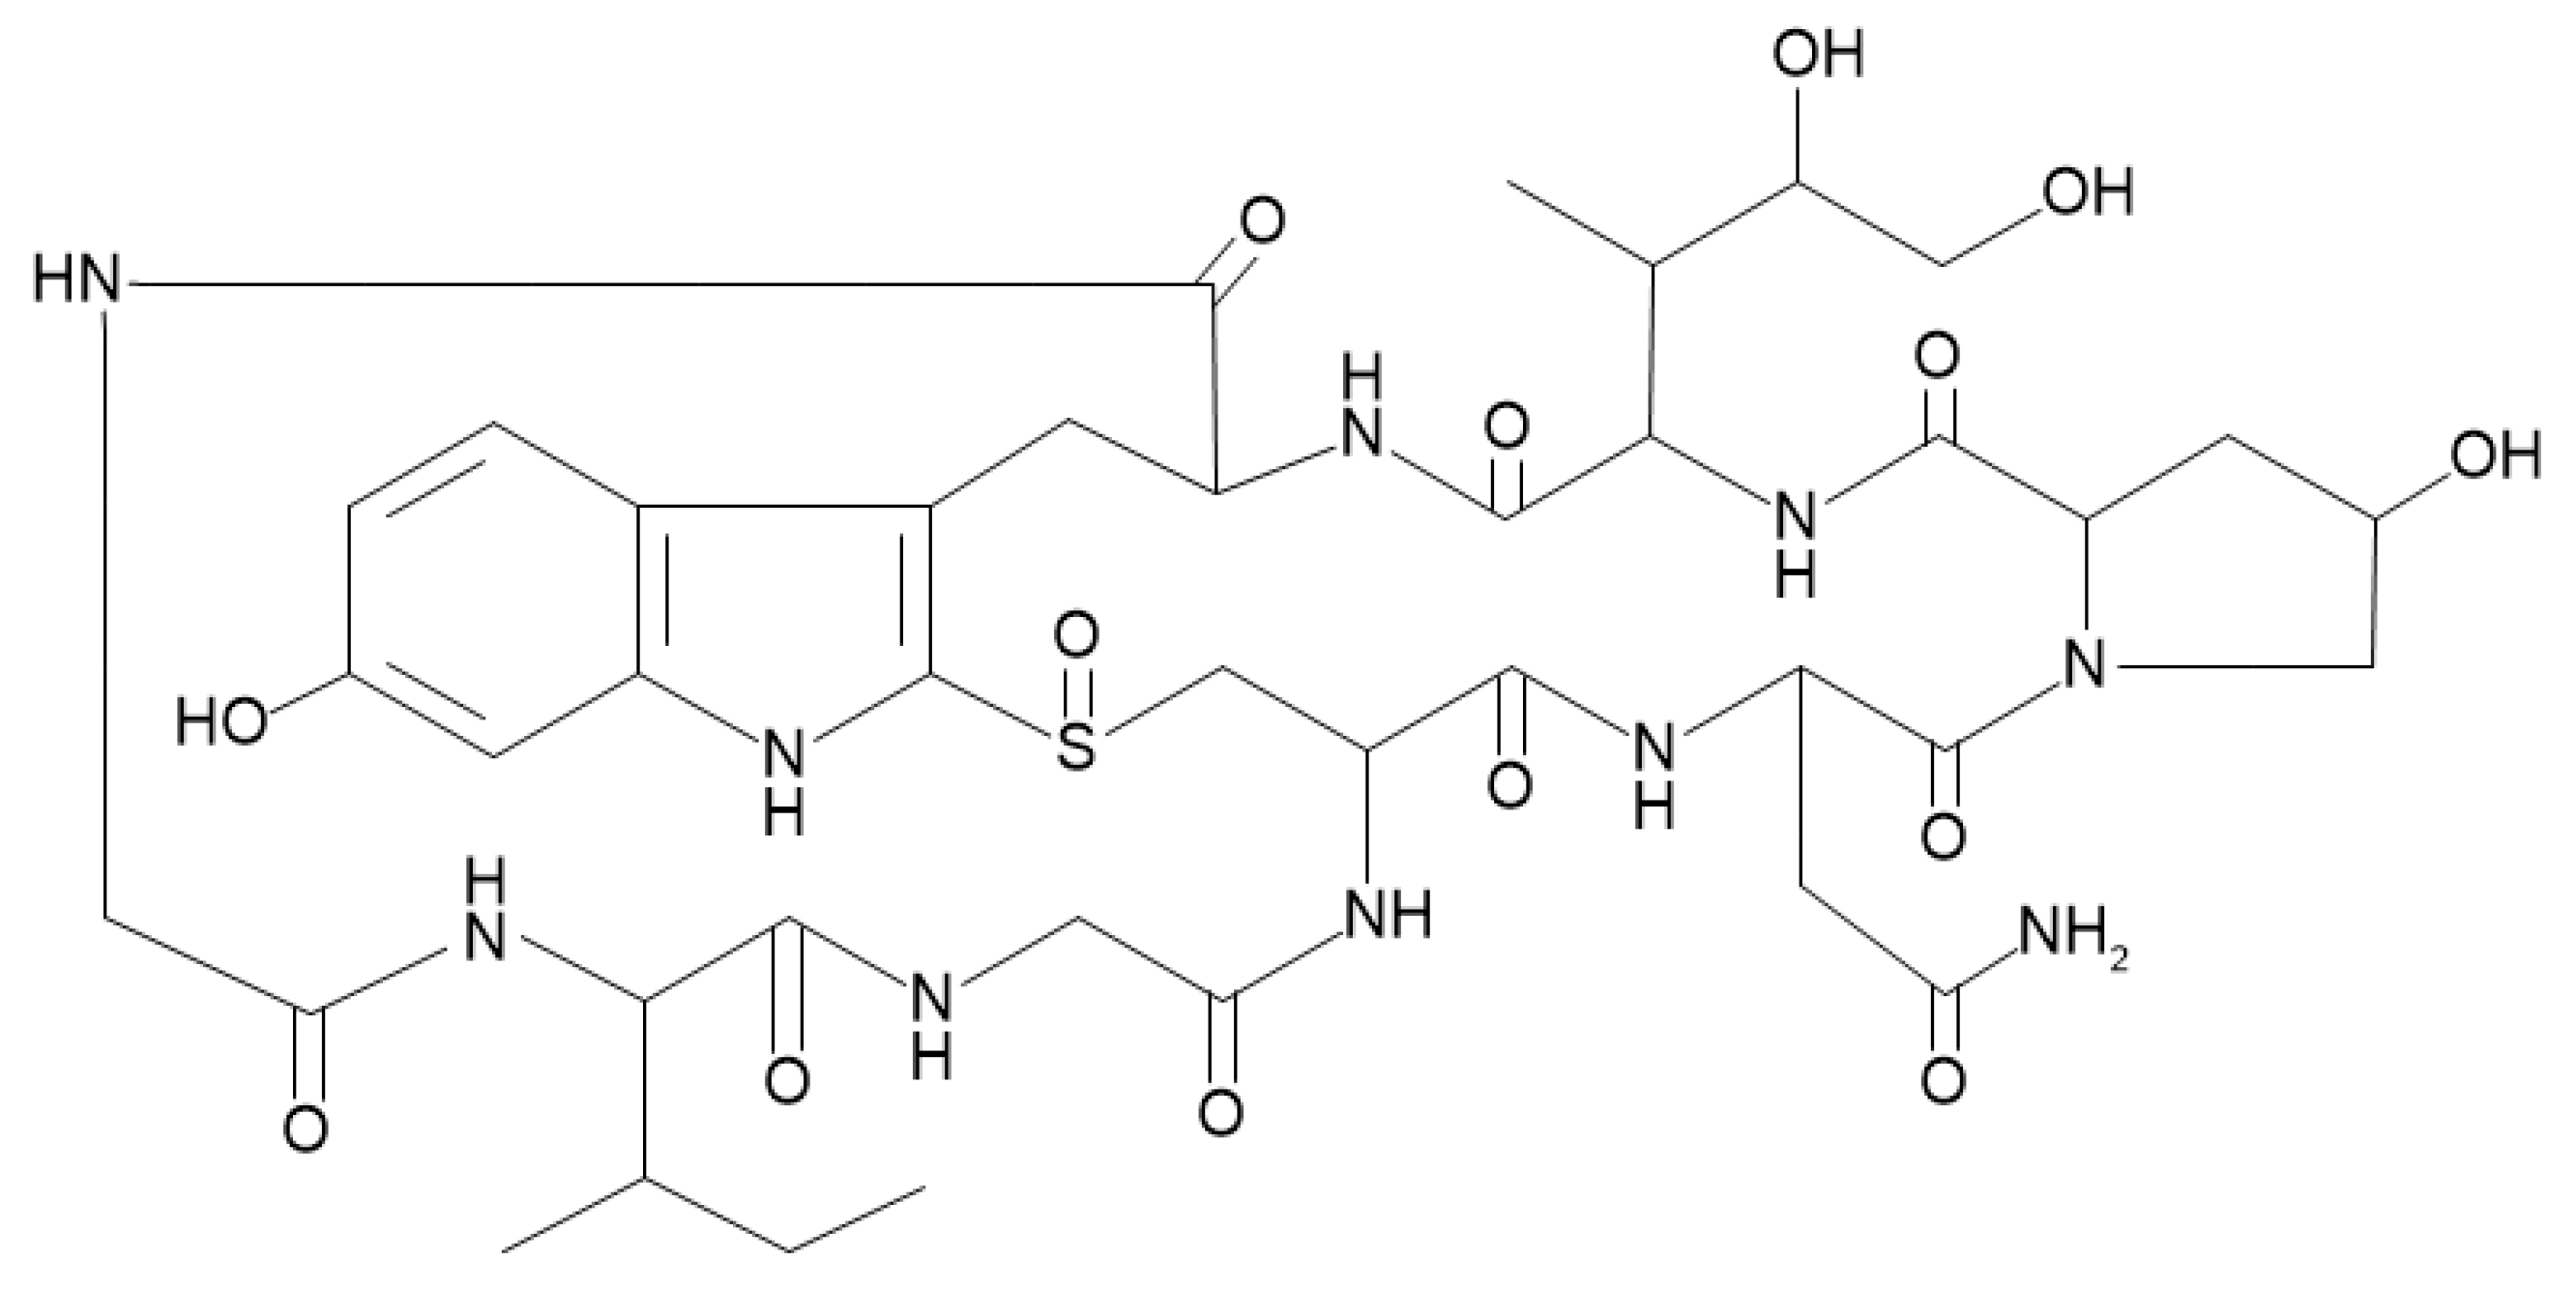
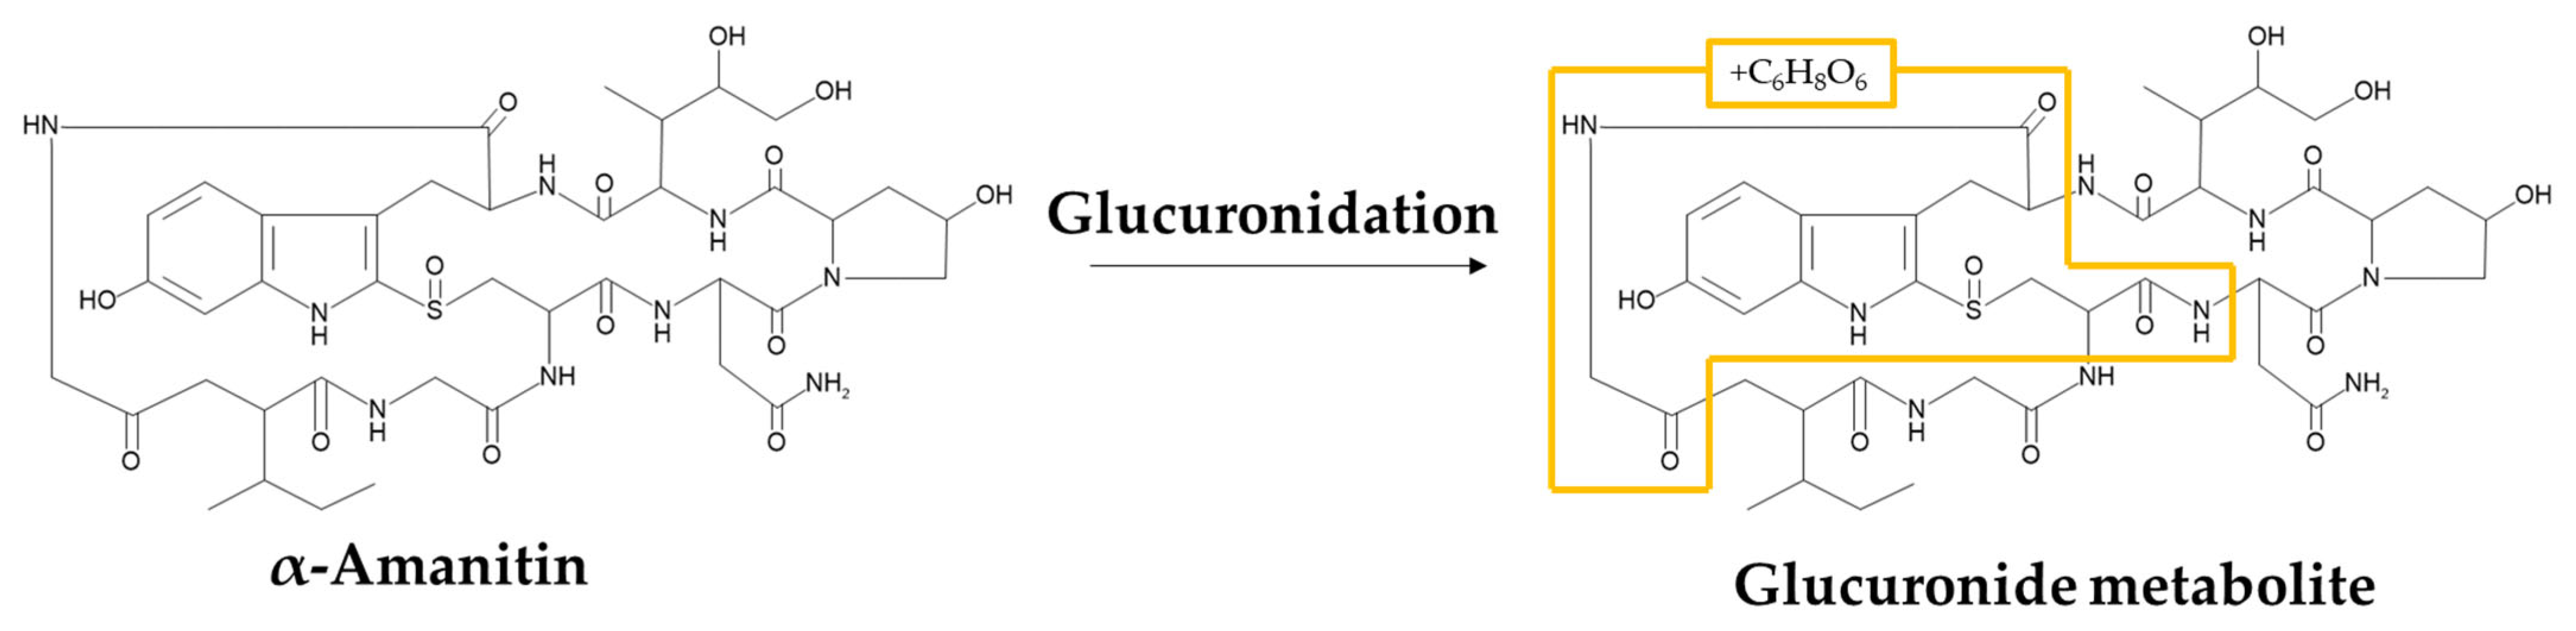
α-Amanitin is a bicyclic octapeptide derived from mushrooms of the genus Amanita and has cytotoxicity by inhibiting RNA polymerase Ⅱ (Figure 1) [3,4].
In general, understanding the drug metabolism and pharmacokinetics (DMPK) properties of the ADC’s payload is essential for the ADC development and regulatory approval. The DMPK assessment of payload also helps not only to predict the in vivo behavior of ADC but also to understand the pharmacological and toxicological characteristics of ADC [5,6]. So far, limited studies have been conducted for α-amanitin for in vitro experiments and in vivo pharmacokinetics (PK), however, DMPK studies of α-amanitin in rats have not been fully studied yet.
In this study, a liquid chromatography-quadrupole-time-of-flight-mass spectrometric (LC-qTOF-MS) method for α-amanitin in rat plasma was first developed and applied for PK study of α-amanitin via intravenous (IV) or oral (PO) administration in rats. In vitro metabolic stability study in liver microsomes as well as metabolite identification (MetID) study were also performed to assess whether the metabolic behavior of α-amanitin was different between in vitro and in vivo environments. Finally, a semi-mass balance study in rat was conducted to explore the major elimination route of α-amanitin. To our best knowledge, this is the first paper to explore the in vitro–in vivo correlation of α-amanitin using the PK, in vitro/in vivo MetID and semi-mass balance studies to better understand the DMPK properties of α-amanitin in rats.

2. Results and Discussion

2.1. Method Development and Qualification

The method for quantification of α-amanitin in rat plasma was developed in this study. The calibration curve consists of duplicate standard (STD) samples at seven levels of concentration and quality control (QC) samples at three levels. The calibration curve was established in the range of 3.05–2220 ng/mL by the quadratic regression (weighted 1/concentration) with a correlation coefficient > 0.99 which is sufficient to cover the PK of α-amanitin. The calibration curve and the chromatogram of the lower limit of quantification (LLOQ) for α-amanitin in rat plasma are shown in Figure 2.
Assay performance was determined by assessing the mean accuracy and precision of QC samples with three levels of concentrations (15.0, 165, and 1820 ng/mL). The intra and inter-run accuracy and precision were evaluated using triplicates and the results are shown in Table 1. The values (%) were all within ±25% of accuracy.
To evaluate the stability of α-amanitin in rat plasma under the actual experimental environments, some stability tests were also conducted. The results of the stability tests are shown in Table 2. The accuracy (%) and precision (% CV) of the stability test met the acceptance criteria of ±25%, identifying α-amanitin was stable under the short-term, long-term, and freeze-thaw conditions.
The extraction recovery of α-amanitin after protein precipitation for sample preparation was 30.7 ± 3.16%. The robust results are shown in Table 3. Although the extraction recovery of α-amanitin in rat plasma was relatively low in this experiment, the accuracy and precision of the calibration curve samples and QC samples were all within the acceptance criteria (Table 1 and Table 2) and therefore the impact of the recovery from this extraction procedure was not significant. Nevertheless, further extraction methods to increase the recovery would be continued for other biological matrices in the future.

2.2. In Vitro Metabolic Stability in Liver Microsomes

In vitro stability of α-amanitin at liver microsomal system was evaluated by a LC-qTOF-MS. The remaining % represents the percentage of the sample (α-amanitin) peak area to the internal standard (verapamil) peak area. The remaining % according to incubation time is presented in Table 4. The incubation time to ln (Remaining %) profile is shown in Figure 3.
The in vitro half-life (T1/2) and the in vitro intrinsic clearance (CLint, in vitro) were calculated by using the slope (k) of the graph shown in Figure 3. The calculation formula is shown in Equations (1) and (2) [7].
T 1 / 2 = ln 2 k
CL int , in   vitro mL / min / mg = k × microsomal   volume   mL microsomal   protein   mg
The concentration of liver microsomes (microsomal volume/microsomal protein) used in the experiment was 0.5 mL/mg. The obtained CLint, in vitro was used to calculate in vivo intrinsic clearance (CLint, in vivo). The equations for calculating CLint, in vivo is shown at Equation (3) [7]:
CL int , in   vivo mL / min / kg = CL int , in   vitro × mg   microsomal   protein g   liver   weight × ( g   liver   weight kg   body   weight )
The ratio of mg microsomal protein to g liver weight was 44.8 and 48.8 in rat and human, respectively [8]. And the ratio of g liver weight/kg body weight was 40 and 25.7 in rat and human, respectively [8]. The hepatic clearance (CLh) was calculated from CLint, in vivo in a well-stirred model using the following Equation (4) [8]:
CL h mL / min = ( Q h × CL int , in   vivo Q h + CL int , in   vivo )
Qh (mL/min/kg), the hepatic blood flow, is known to be 55.2 and 20.7 mL/min/kg in rat and human, respectively [8]. The calculated metabolic stability parameters of α-amanitin in rat and human microsomes are shown in Table 5. As a result, α-amanitin has a low hepatic clearance according to the aforementioned well-stirred model.

2.3. Application for PK Study in Rat

The above developed LC-qTOF-MS method was applied to obtain the PK parameters after IV and PO administration in rat. Most of the PK samples were within the qualified calibration curve, except the 2 min-time point samples in the IV group which were slightly above the upper limit of quantification (ULOQ). Since the calibration curve was linear in the range of quantification, the concentrations of these early time point IV samples have been calculated by extrapolation of the calibration curve which is also applicable for discovery study in pharmaceutical industries [9]. The time to concentration profile of α-amanitin after IV administration is shown in Figure 4. The PK parameters were calculated with the non-compartmental analysis (NCA) using WinNonlin® version 8.1.0 (Certara, Princeton, NJ, USA) and the results are summarized in Table 6. The results of the PO administration are not shown, because all PO samples were below the LLOQ, which was likely due to the limited absorption process in the gastrointestinal tracts.
The abbreviations shown are as follows: T1/2 (half-life), Cmax (the observed maximum concentration in plasma), AUClast (area under the concentration–time curve to the last time point), and Vss (volume of distribution at steady state). The PK parameters of α-amanitin in this rat study showed comparable values to those in mice and dogs [10,11].

2.4. Semi-Mass Balance Study in Rat

The excretion characteristic of α-amanitin after IV and PO administration is shown in Table 7, and the time to recovery of α-amanitin profile is shown in Figure 5. The recovery represents the percentage of the excreted amount (mg) to the administrated amount (mg).
In the IV group, the total recovery of α-amanitin was 68.9% and most of the administered α-amanitin was excreted in urine within 8 h, while the total recovery of α-amanitin in PO group was only 23.5%, and most of the detected α-amanitin was excreted in feces. The recovered α-amanitin after PO administration in feces would be likely the non-absorbed α-amanitin but the recovery was much less than anticipated. There are a couple of possibilities about the low excretion of α-amanitin after PO administration and one is probably due to the limited collection time for the semi-mass balance study (although we used more than five times the half-life of α-amanitin for the semi-mass balance study). The other likelihood of the low excretion of α-amanitin in feces is its binding to the surface of GI tracts. The latter could be explained if the α-amanitin was quantitated from the GI tracts after homogenization. Another approach would be to administer charcoal to the rats after a semi-mass balance experiment to quantitate the remaining amount of α-amanitin in the GI tracts. Either way, further investigation would be warranted to understand the mass balance characteristics of α-amanitin in rats.

2.5. In Vitro and In Vivo MetID for α-Amanitin

Although the predicted hepatic clearance of α-amanitin in rat liver microsomes was quite low (5.05 mL/min/kg), the in vivo clearance from the rat PK study (14.0 mL/min/kg) was relatively higher than anticipated which implies that either extra-hepatic clearance or different metabolism in vivo might play a role. Therefore, in vitro and in vivo MetID were conducted to explore any possible different metabolites between the two systems. The in vitro and in vivo MetID samples were analyzed by a LC-qTOF-MS, and the data were used to elucidate a metabolite of α-amanitin using PeakView® and MetabolitePilot™. The structure of the metabolite of α-amanitin was predicted by MetabolitePilot™. The fragmentation pattern of the predicted metabolite ion from product ion scan was compared to the fragmentation pattern of the parent ion using PeakView®.
α-Amanitin had a parent ion of m/z 919.36 ([M+H]+) with a retention time of 9.03 min. The product ion of m/z 919.36 was formed by m/z 143.12, 171.11, 259.13, 373.18, 749.26, 806.28, and 901.35. These fragment ions were used to prove that the predicted metabolite was derived from α-amanitin. The fragmentation pattern of m/z 919.36 in mass spectrometry is shown in Figure 6.
The predicted metabolite ion was m/z 548.20 ([M+2H]2+), suggesting that 176 amu was increased through metabolism. This suggests that the α-amanitin may have undergone glucuronidation (+C6H8O6, 176.0321 amu). After performing product ion scan of m/z 919.36 (parent) and 548.20 (a glucuronide metabolite), the two fragmentation patterns were compared, and as a result, a glucuronide metabolite was generated only in CLM and HLM, not in MLM, RLM, DLM or in vivo rat plasma. In addition, no other significant metabolites of α-amanitin were identified from the in vivo rat plasma samples and the major circulating metabolic component of α-amanitin was α-amanitin itself. The compared fragmentation patterns of parent ion and metabolite in CLM and HLM are shown in Figure 7.
The fragment ions with m/z 171.11, 259.13, and 373.18 were found in non-metabolized form, and the fragment ion with 539.20 ([M+2H]2+) was found in metabolized form, increasing 176 amu from m/z 901.35. Consequently, the characterization of α-amanitin and its metabolite is shown in Table 8, and the predicted metabolic pathway of α-amanitin in CLM and HLM is shown in Figure 8.
The total ion chromatogram (TIC) of parents and a proposed glucuronide metabolite of α-amanitin is shown in Figure 9.

3. Materials and Methods

3.1. Reagents and Chemicals

α-Amanitin was purchased from Biosynth Carbosynth (Compton, Berkshire, United Kingdom). Verapamil, glutathione (GSH), and uridine-5′-diphosphoglucuronic acid triammonium salt (UDPGA) were purchased from Sigma-Aldrich (St. Louis, MO, USA). Dimethyl sulfoxide (DMSO), formic acid, and methanol (MeOH) were purchased from Dae-Jung reagents (Siheung, Gyeonggi, Republic of Korea). Blank plasma from male Sprague Dawley (SD) rats treated with heparin as anti-coagulant was purchased from Biomedex (Seoul, Republic of Korea). Acetonitrile (ACN) and distilled water (DW) were purchased from Samchun Chemical (Pyeongtaek, Gyeonggi, Republic of Korea). Mouse, rat, cynomolgus monkey, dog, and human liver microsomes (MLM, RLM, CLM, DLM, and HLM), β-nicotinamide adenine dinucleotide hydrate (NADPH) regenerating system solution A (26 mM NADP+, 66 mM glucose-6-phosphate, and 66 mM MgCl2 in water), and B (40 U/mL glucose 6-phosphate dehydrogenase in 5 mM sodium citrate) were purchased from Corning (Tewksbury, MA, USA). Other chemicals and reagents were purchased from commercial sources.

3.2. Preparation of Stock Solution, Calibration Standard (STD), and Quality Control (QC) Samples

3.2.1. Stock Solution, Sub-Stock Solution, and Working Solutions for STD and QC

A stock solution of α-amanitin was prepared by dissolving powder compound in DMSO to make the concentration to 1 mg/mL and stored at –20 °C. A sub-stock solution was prepared by diluting the stock solution in DMSO to a concentration of 0.1 mg/mL. The sub-stock solution was serially diluted with DMSO to obtain a final concentration of 3.05, 9.14, 27.4, 82.3, 247, 741, and 2220 ng/mL for STD working solutions and 15.0 (low) 165 (medium) and 1820 (high) ng/mL for QC working solutions.

3.2.2. STD and QC Samples for Calibration Curve in Pharmacokinetic (PK) Study

Seven calibration STD of α-amanitin were prepared in duplicate by spiking 8 μL of freshly prepared STD working solutions into 40 μL of blank rat plasma. Three levels of QCs were prepared by spiking 8 μL of freshly prepared QC working solutions into 40 μL of blank rat plasma.

3.2.3. STD and QC Samples for Calibration Curve in a Semi-Mass Balance Study

Seven calibration STD of α-amanitin were prepared in duplicate by spiking 8 μL of freshly prepared STD working solutions into 40 μL of a mixed blank matrix (rat blank urine: rat blank bile: rat blank feces: DW = 1:1:1:1, v/v/v/v). Rat blank urine were prepared with 30% ACN in DW in a ratio of 1:1 (v/v). Rat blank feces were ground using a blender and mixed with phosphate buffered solution (PBS) and ACN (feces: PBS: ACN = 1:9:5, w/v/v), then homogenized by beads. Three levels of QCs were prepared by spiking 8 μL of freshly prepared QC working solutions into 40 μL of the mixed blank matrices.

3.3. Sample Preparation

3.3.1. Sample Preparation for PK Study Samples

For the plasma PK sample, 8 μL of make-up DMSO was spiked into 40 μL of rat PK samples to make them in identical matrix condition as STD or QC samples. Then, 200 μL of internal standard solution (20 ng/mL of verapamil in ACN) was spiked into STD, QC, and PK samples and vortexed for 30 s. The samples were centrifuged at 12,000 rpm for 5 min. After centrifugation, 200 μL of the supernatant was transferred into a different 1.5 mL Eppendorf tube (E-tube), and evaporated to dryness under vacuum using rotary evaporator (Eyela CVE-3110 and UT-1000, Tokyo, Japan) for 3 h. Evaporated samples were reconstituted with 60 μL of 50% MeOH with 5 mM ammonium formate, and vortexed for 30 s. The reconstituted samples were centrifuged at 12,000 rpm for 5 min and then 50 μL of the supernatant was transferred to a LC vial for LC-qTOF-MS analysis.

3.3.2. Sample Preparation for Semi-Mass Balance Samples

Urine collected from rats were diluted two-fold with 30% ACN in DW. Feces collected from rats were diluted 15-fold with PBS and ACN (feces: PBS: ACN = 1:9:5, w/v/v) and homogenized by beads.
For urine samples, 8 μL of make-up DMSO was spiked into 40 μL of a mixed urine sample (urine sample: blank bile: blank feces: DW = 1:1:1:1, v/v/v/v). For bile samples collected from rats, 8 μL of make-up DMSO was spiked into 40 μL of a mixed bile sample (bile sample: blank urine: blank feces: DW = 1:1:1:1, v/v/v/v). For feces samples, 8 μL of make-up DMSO was spiked into 40 μL of a mixed feces sample (feces sample: blank urine: blank bile: DW = 1:1:1:1, v/v/v/v).
For sample pretreatment, 200 μL of internal standard solution (20 ng/mL of verapamil in ACN) was spiked into STD, QC, and semi-mass balance samples and vortexed for 30 s. The samples were centrifuged at 12,000 rpm for 5 min. After centrifugation, 200 μL of the supernatant was transferred into a different tube, 1.5 mL E-tube, and evaporated using the rotary evaporator for 3 h. Evaporated samples were reconstituted with 60 μL of 50% MeOH with 5 mM ammonium formate and vortexed for 30 s. The reconstituted samples were centrifuged at 12,000 rpm for 5 min, and then 50 μL of supernatant was transferred to a LC-vial for a LC-qTOF-MS analysis.

3.3.3. Sample Preparation for In Vitro Metabolic Stability Test in Liver Microsomes

A metabolic stability test of α-amanitin was performed in rat and human liver microsomes. Cofactors (NADPH regenerating system solution A and B), compound (100 μg/mL of α-amanitin), 0.5 M potassium phosphate buffer with pH 7.4, and DW were mixed and pre-incubated for 5 min at 37 °C. After the pre-incubation, 12 μL of rat or human liver microsome (20 mg/mL each) was added to a 468 μL of pre-incubated cofactor mixture and the mixture was incubated for 0, 15, 30, and 60 min. After the incubation for each time point, 100 μL of the mixture was aliquoted to a 1.5 mL E-tube at each time point and 100 μL of 50% ACN in MeOH which containing 250 ng/mL of verapamil as an internal standard for protein precipitation was added for stopping the reaction. Then the mixture was centrifuged at 10,000 rpm for 5 min. Then 180 μL of the supernatants was collected in a fresh E-tube and evaporated for 3 h. After evaporation, samples were reconstituted with 150 μL of 50% MeOH with 5 mM ammonium formate. After centrifugation at 10,000 rpm for 5 min, 140 μL of reconstituted sample was transferred to a LC-vial.

3.3.4. Sample Preparation for In Vitro/In Vivo MetID

In vitro MetID was conducted in 5 species (mouse, rat, cynomolgus monkey, dog, and human) of liver microsomes. Cofactors (NADPH solution A and B, 5 mM UDPGA, and 0.5 mM GSH), compound (2 mg/mL of α-amanitin), and DW were mixed and pre-incubated for 5 min at 37 °C. After the pre-incubation, 20 μL of liver microsome (20 mg/mL) was added to 380 μL of cofactor mixture and incubated for 0 and 120 min at 37 °C. After the incubation for each time point, 150 μL of the mixture was transferred to 450 μL of 50% ACN in MeOH for stopping the reaction. Then the mixture was centrifuged at 10,000 rpm for 5 min. Then 550 μL of the supernatant was collected in a fresh E-tube and evaporated for 4 h. After evaporation, samples were reconstituted with 60 μL of 50% MeOH with 5 mM ammonium formate. After centrifugation at 10,000 rpm for 5 min, 50 μL of reconstituted sample was transferred to a LC-vial.
For rat in vivo MetID, rat plasma samples collected after IV administration of α-amanitin with the dose of 1 mg/kg were pooled according to the Hamilton pooling method [12]. Then 3 μL of DMSO was added to the 300 μL of pooled rat plasma. A control sample was made by mixing 300 μL of blank rat plasma and 3 μL of 0.5 mg/mL α-amanitin. Eight hundred microliter of 50% ACN in MeOH was added to the pooled rat plasma mixture and a control sample, respectively. Then the mixture was centrifuged at 10,000 rpm for 5 min. Then 900 μL of the supernatants was collected to a fresh E-tube and evaporated for 4 h. After evaporation, samples were reconstituted with 120 μL of 50% MeOH with 5 mM ammonium formate. After centrifugation at 10,000 rpm for 5 min, 100 μL of reconstituted sample was transferred to a LC-vial.

3.4. LC-qTOF-MS Conditions

The LC-qTOF-MS method consisted of a chromatographic pump system (Shimadzu CBM-20A/LC-20AD, Shimadzu Corporation, Columbia, MD, USA), an auto-sampler system (Eksigent CTC HTS PAL, LEAP Technologies, Carrboro, NC, USA), and a quadrupole time-of-flight mass spectrometer (TripleTOFTM 5600, Sciex, Foster City, CA, USA) with an ion source (Duospray™, Sciex, Foster City, CA, USA).
A Kinetex XB-C18 analytical column (2.1 mm × 50 mm, 2.6 μm; Phenomenex) was used for bioanalytical sample quantification and a Hydro-RP analytical column (2 mm × 100 mm, 2.5 μm; Phenomenex) was used for MetID. Security Guard Cartridge (4 mm × 2 mm; Phenomenex) was placed on the upstream of the analytical column. The LC mobile phase was DW containing 0.1% formic acid for the mobile phase A and ACN containing 0.1% formic acid for the mobile phase B. The LC gradient is shown in Table 9. The flow rate was 0.4 mL/min and the injection volume was 10 μL.

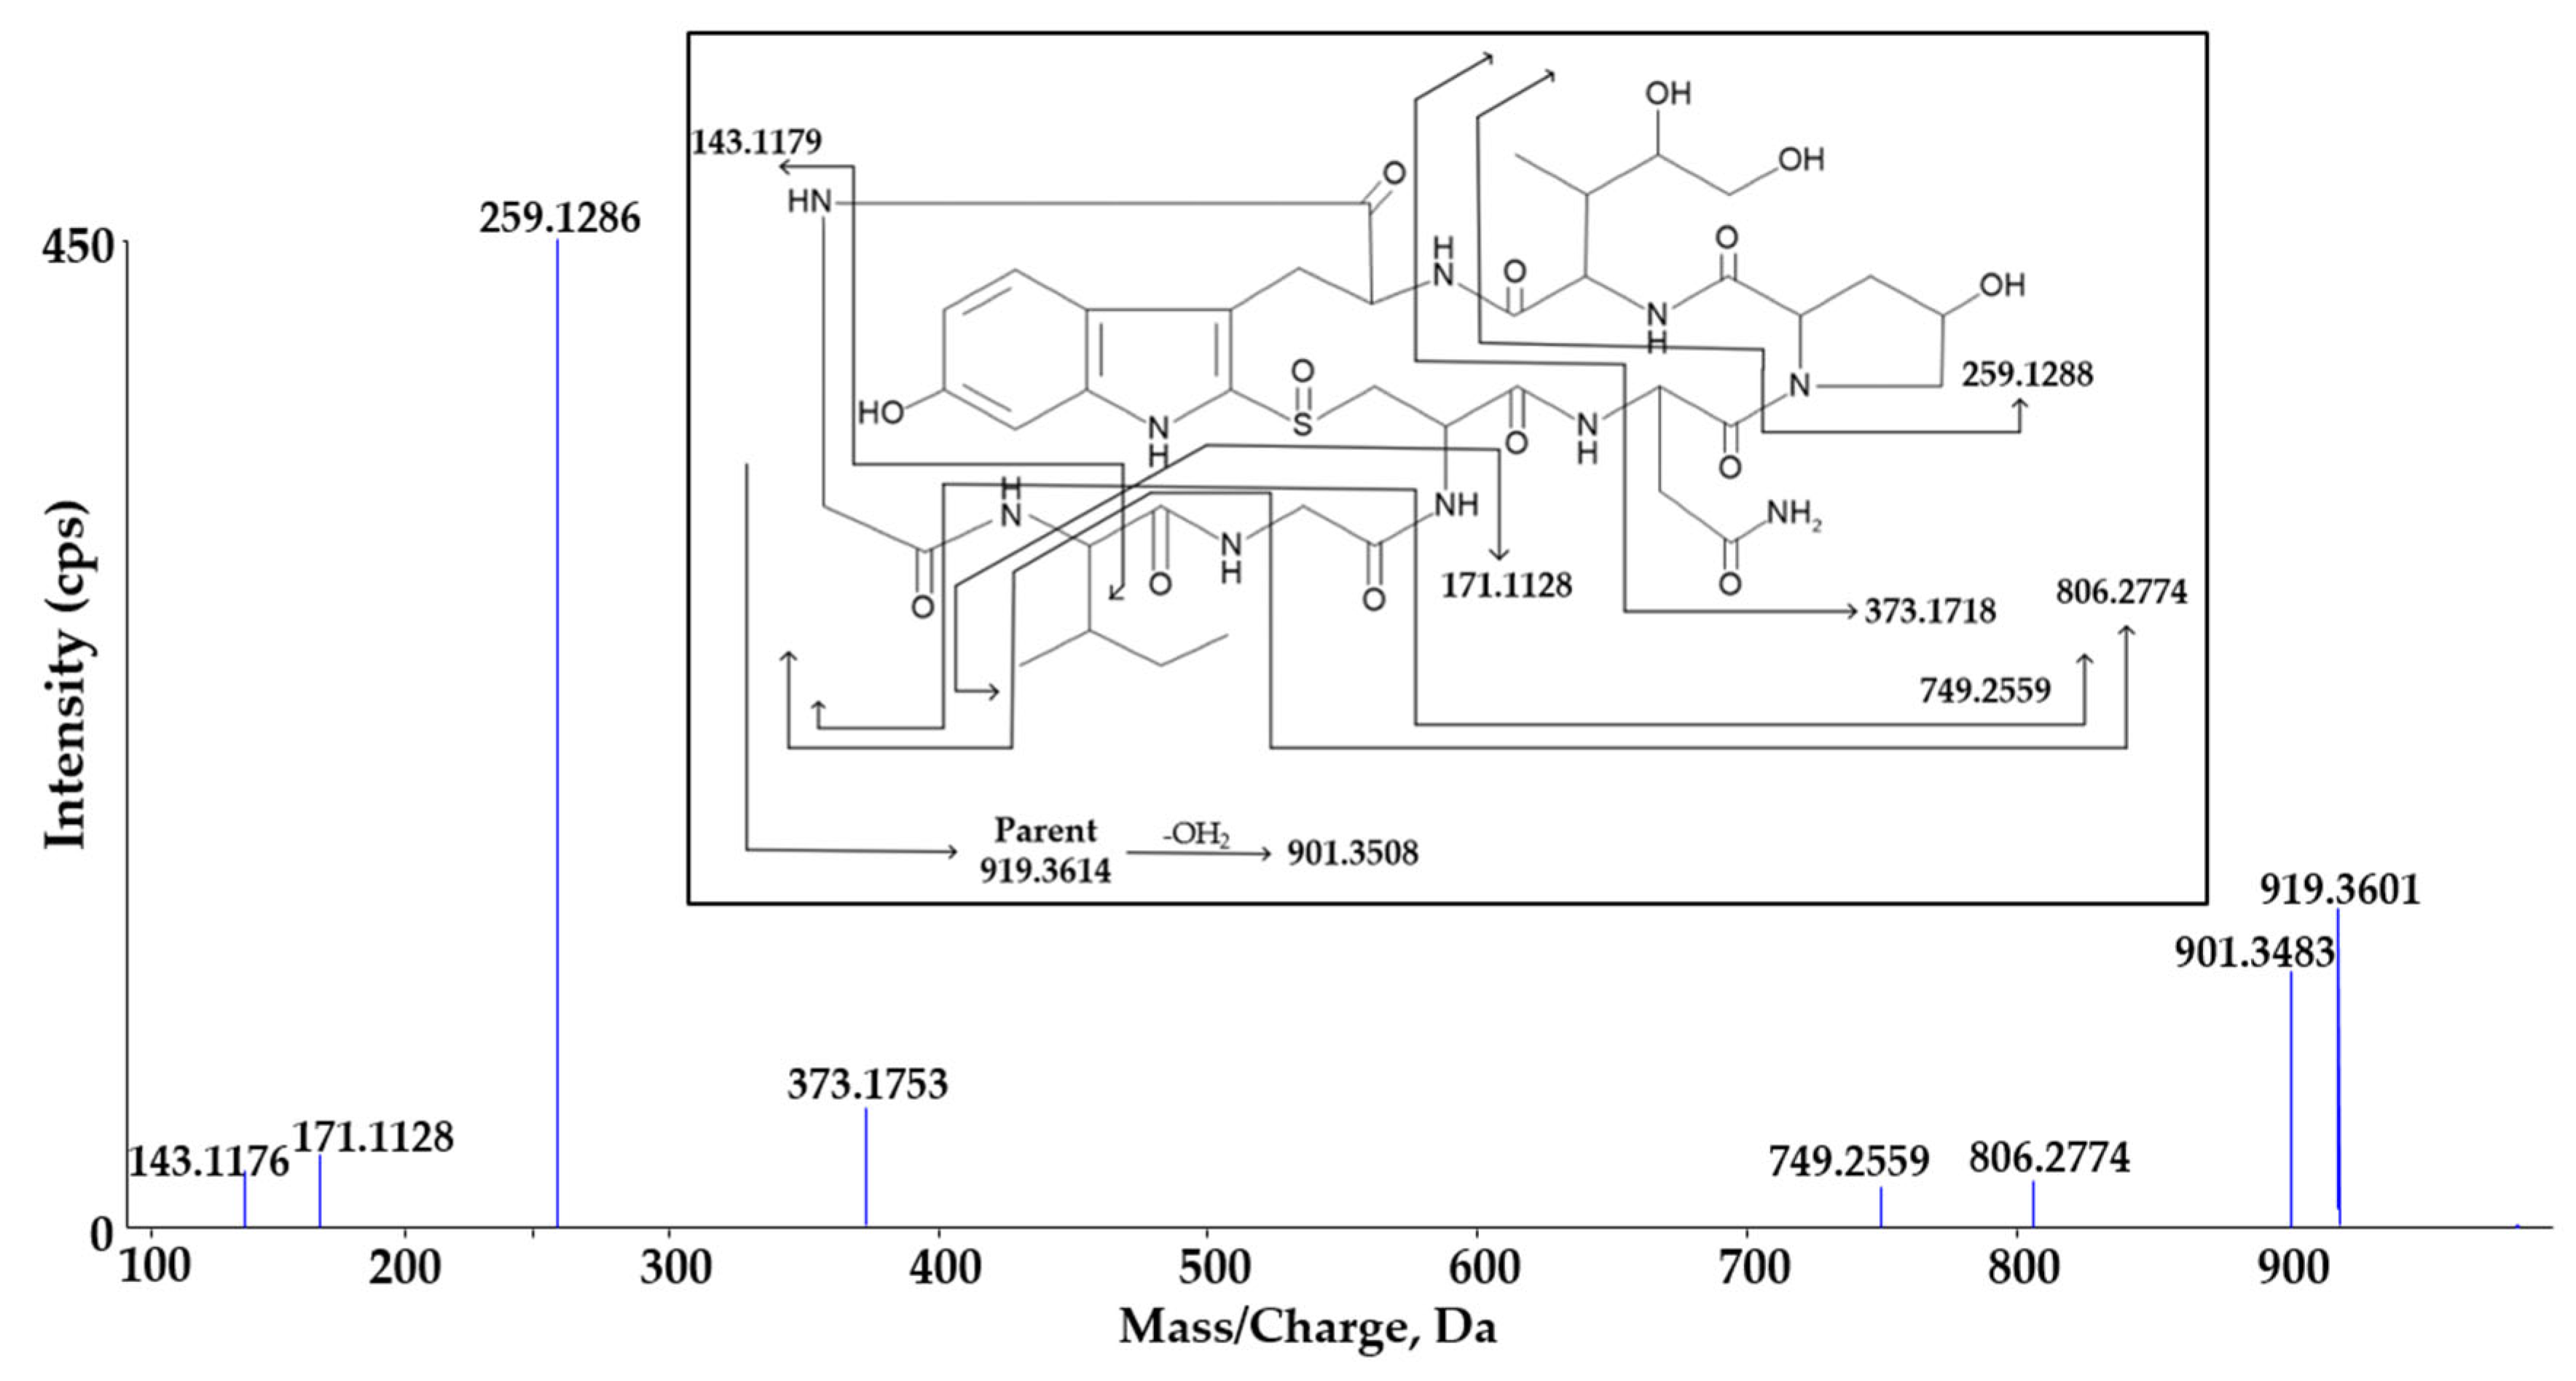
3.4.1. TOF-MS Method for Quantification of α-Amanitin

For the TOF-MS scan, the scan range was m/z 100–1000. For the product ion scan, the parent ion of α-amanitin was m/z 919.36 ([M+H]+) and a product ion at m/z 901.35 was used as a quantitative ion (DP: 10 and CE: 31). The parent ion of verapamil (internal standard) was m/z 455.3 ([M+H]+), and a product ion at m/z 165.1 was used as a quantitative ion (DP: 125 and CE: 30). Gas sources 1 and 2 were set to 50 psi and the curtain gas flow was 30 L/min. The ion spray voltage (ISVF) was 5500 V, and the source temperature was 500 °C.

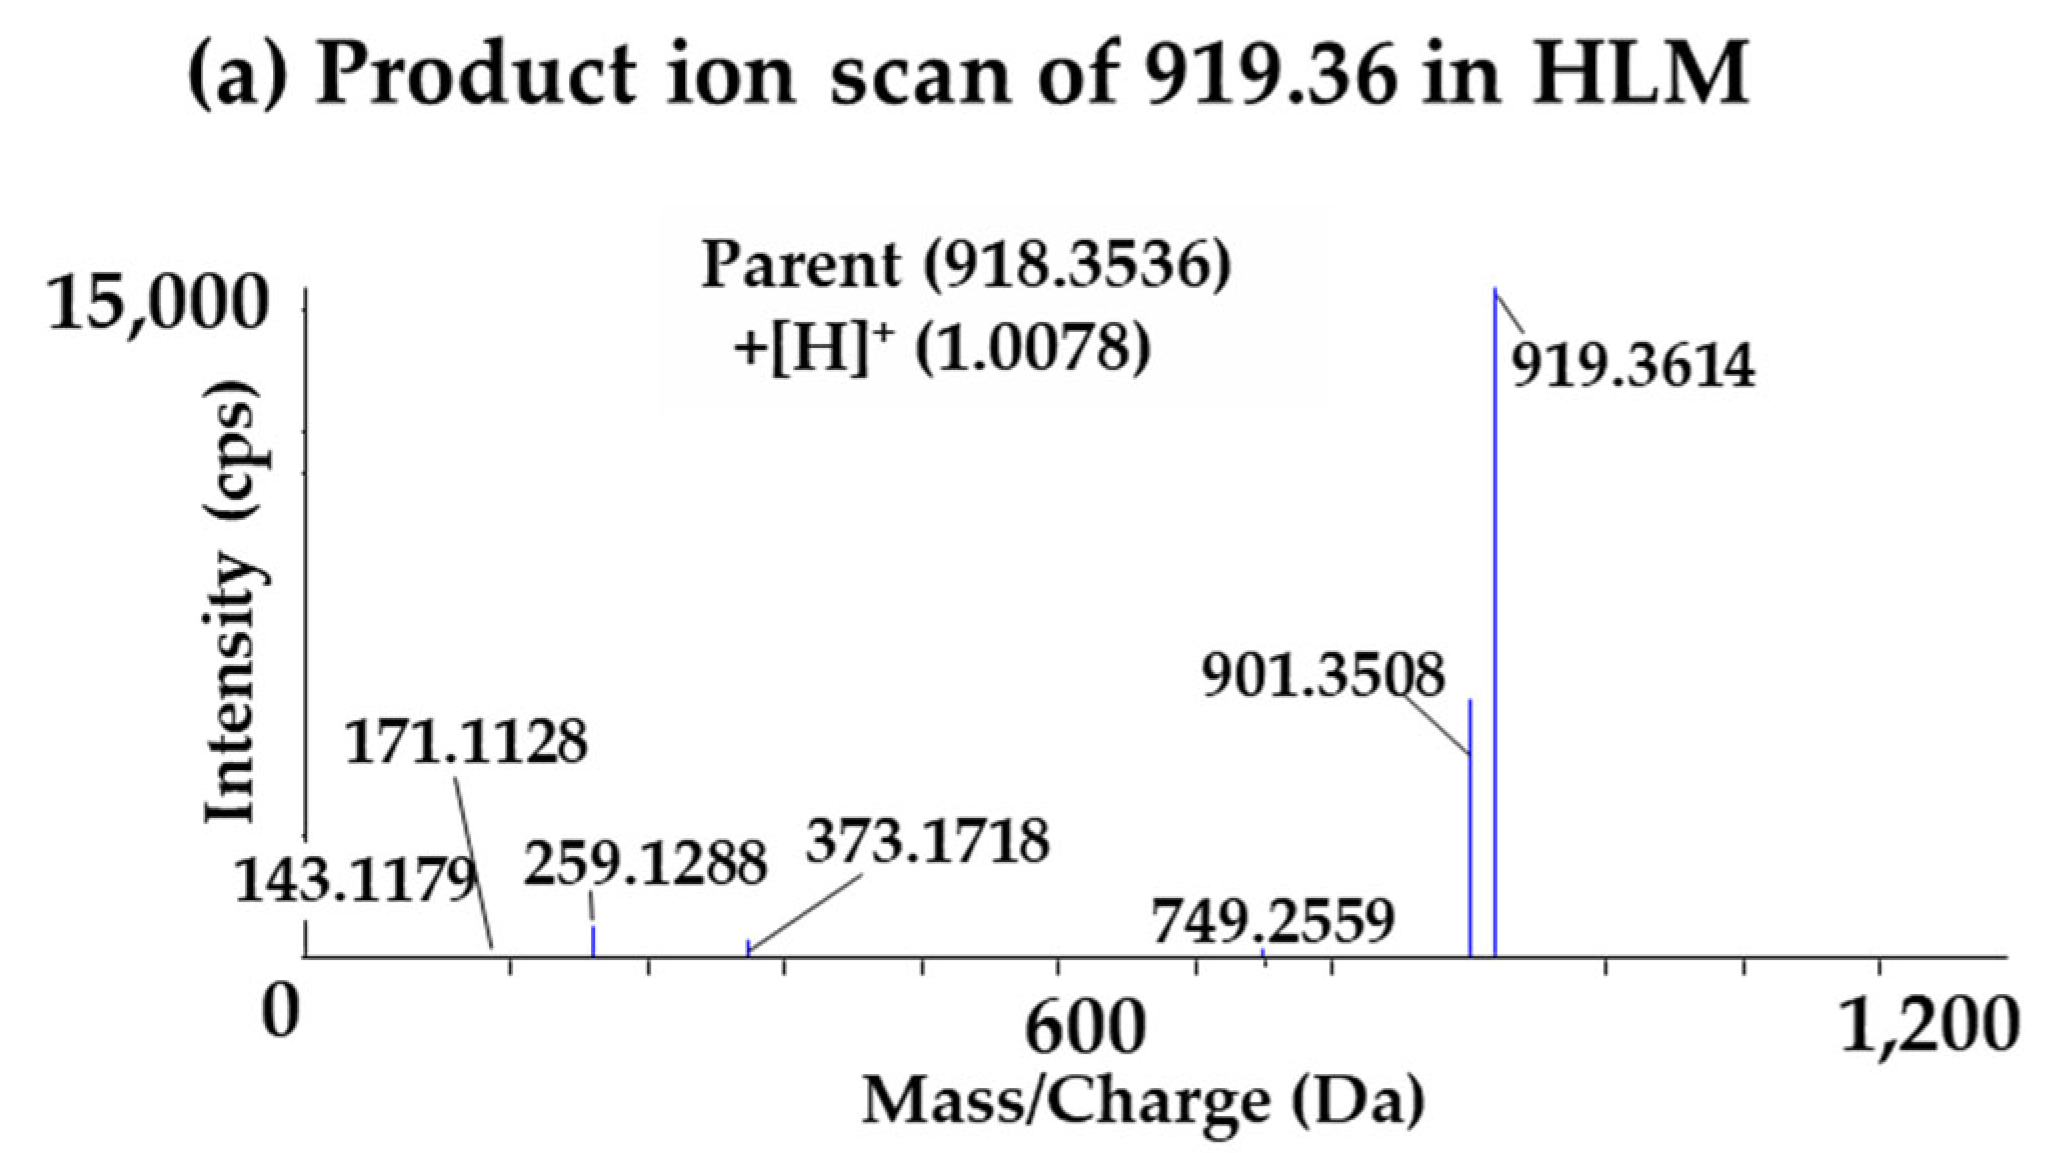
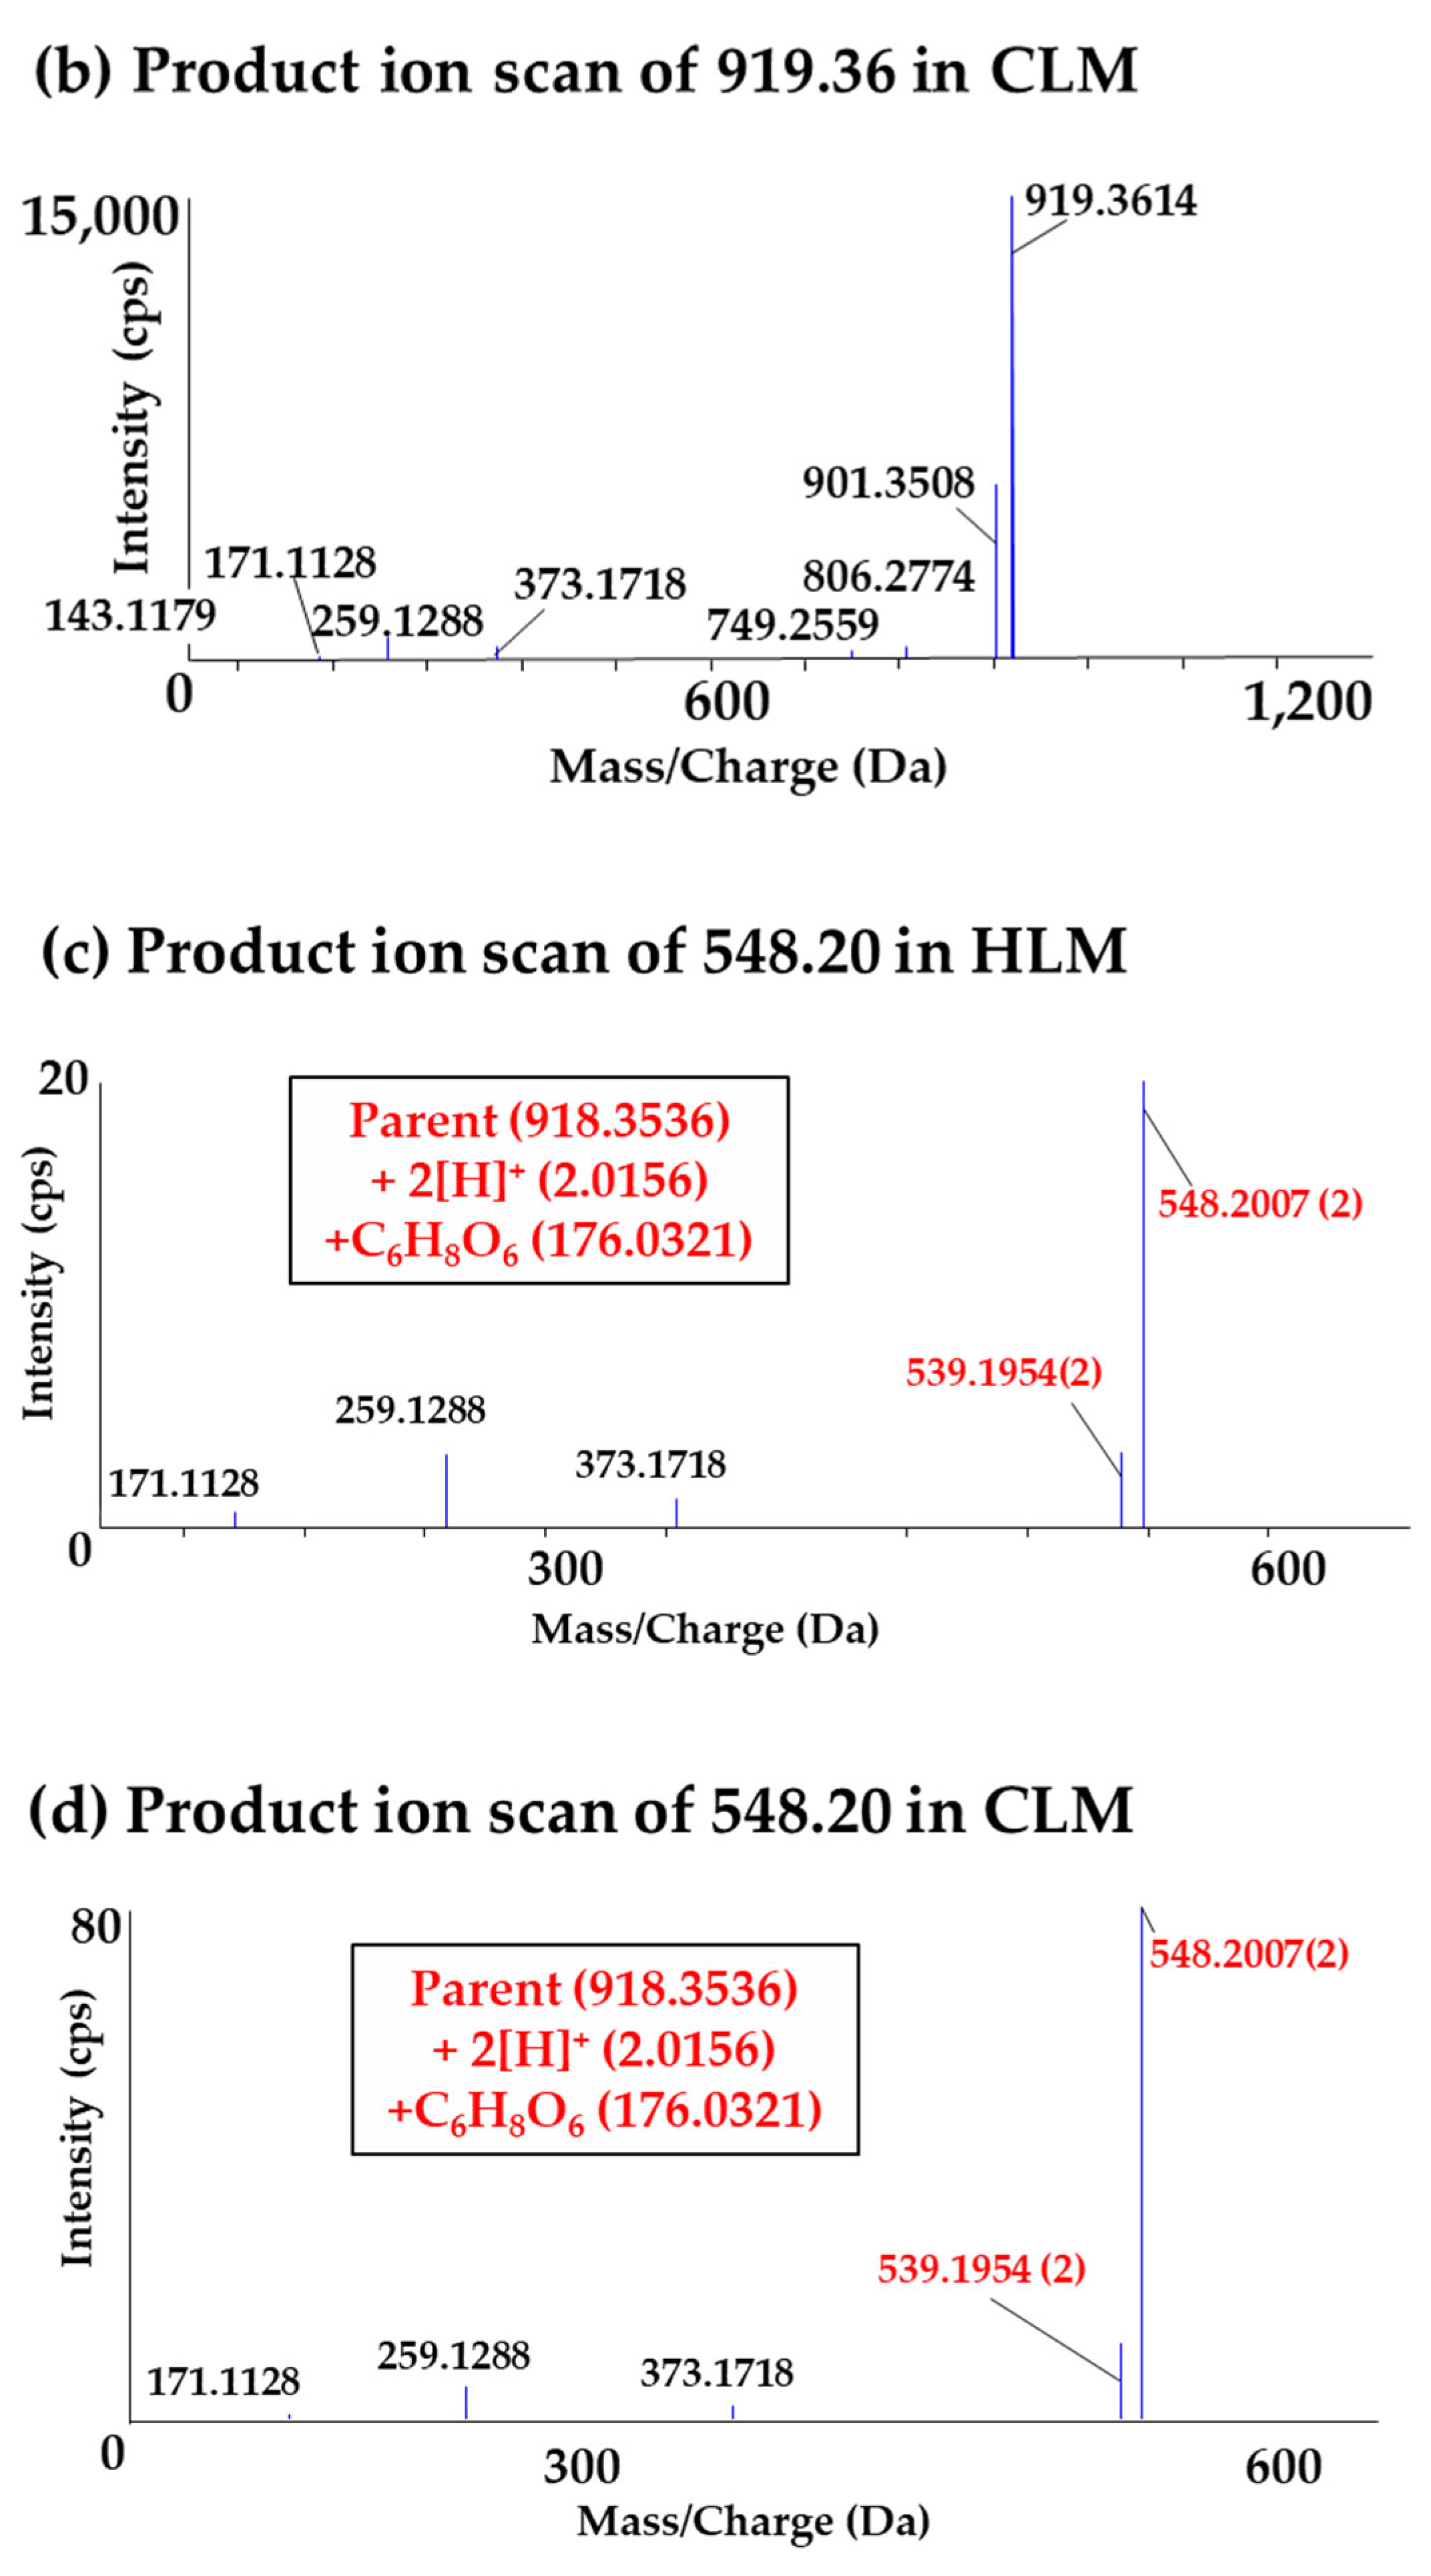
3.4.2. TOF-MS Method for MetID of α-Amanitin

The high-resolution TOF full scan was used for metabolite profiling. The scan range was m/z 50–1300 (DP: 50 and CE: 10). In product ion mode, α-amanitin was set to m/z 919.36 (DP: 10 and CE: 31), and the suspected metabolite was set to m/z 548.20 (DP: 10 and CE: 10) to determine the metabolite. Gas sources 1 and 2 were set to 50 psi and the curtain gas flow was 35 mL/min. The ISVF was 5500 V and the source temperature was 500 °C. The MetID analysis was done by the Information-Dependent Analysis (IDA) method which includes both a real time multiple mass defect filtering (MDF) function and a dynamic background subtraction function.

3.5. Method Qualification in Rat Plasma

The method qualification was performed with “fit-for-purpose” criteria which are suitable for discovery stage research. The qualification contained seven levels of STD and three levels of QC in duplicate. To prove the qualification of the bioanalytical method, intra- and inter-day precision and accuracy were also conducted on three different days based on our in-house criteria. Preliminary stability tests were performed at low, medium, and high QC in rat plasma. The stability test was performed under three different conditions: a short-term, a long-term, and a freeze-thaw condition. The short-term stability test was conducted at room temperature (RT) for 4 h. The long-term stability was conducted at –20 °C for 2 weeks. The freeze-thaw stability was conducted for three freeze and thaw cycles at –20 °C and RT. The extraction recovery of protein precipitation was evaluated by analyzing the difference between extracted Medium-QC (165 ng/mL) samples and post-extraction QC samples. The post-extraction QC sample was prepared by spiking the α-amanitin after protein precipitation.
The precision and accuracy of the acceptance criteria for this qualification runs were within ± 25% which are also similar to the discovery-stage bioanalytical criteria in pharmaceutical industry [13]. All experiments were performed in triplicate or more.

3.6. The PK Study in Rats

Animal Male SD rats (320 ± 10 g) were purchased from the Samtako Biokorea co. (Gyeonggi, Republic of Korea) and housed in a group of four units per cage and given standard rodent chow. The rats were fasted overnight with free access to water for 12 h before administration. The formulation was prepared by dissolving α-amanitin in normal saline (NS) and DMSO (4:1, v/v).
The rats with femoral artery and femoral vein cannulation were prepared for the IV administration, and the rats with single femoral artery cannulation were prepared for the PO administration. The cannulated SD rats were given 1 mg/kg of α-amanitin by either IV bolus or PO (n = 4, both). After administration of α-amanitin, blood sample was collected through a femoral artery cannula and transferred into a heparin-containing tube at each sampling time point (IV: 2, 5, 15, 30, 60, 120, 240, 480, and 1440 min after drug administration and PO: 5, 15, 30, 60, 120, 240, 480, and 1440 min after drug administration). Then plasma sample was obtained by centrifuging the blood sample at 13,000 rpm for 5 min. The obtained plasma samples were stored at –20 °C until analysis. After analysis, the PK parameter was calculated using WinNonlin®.

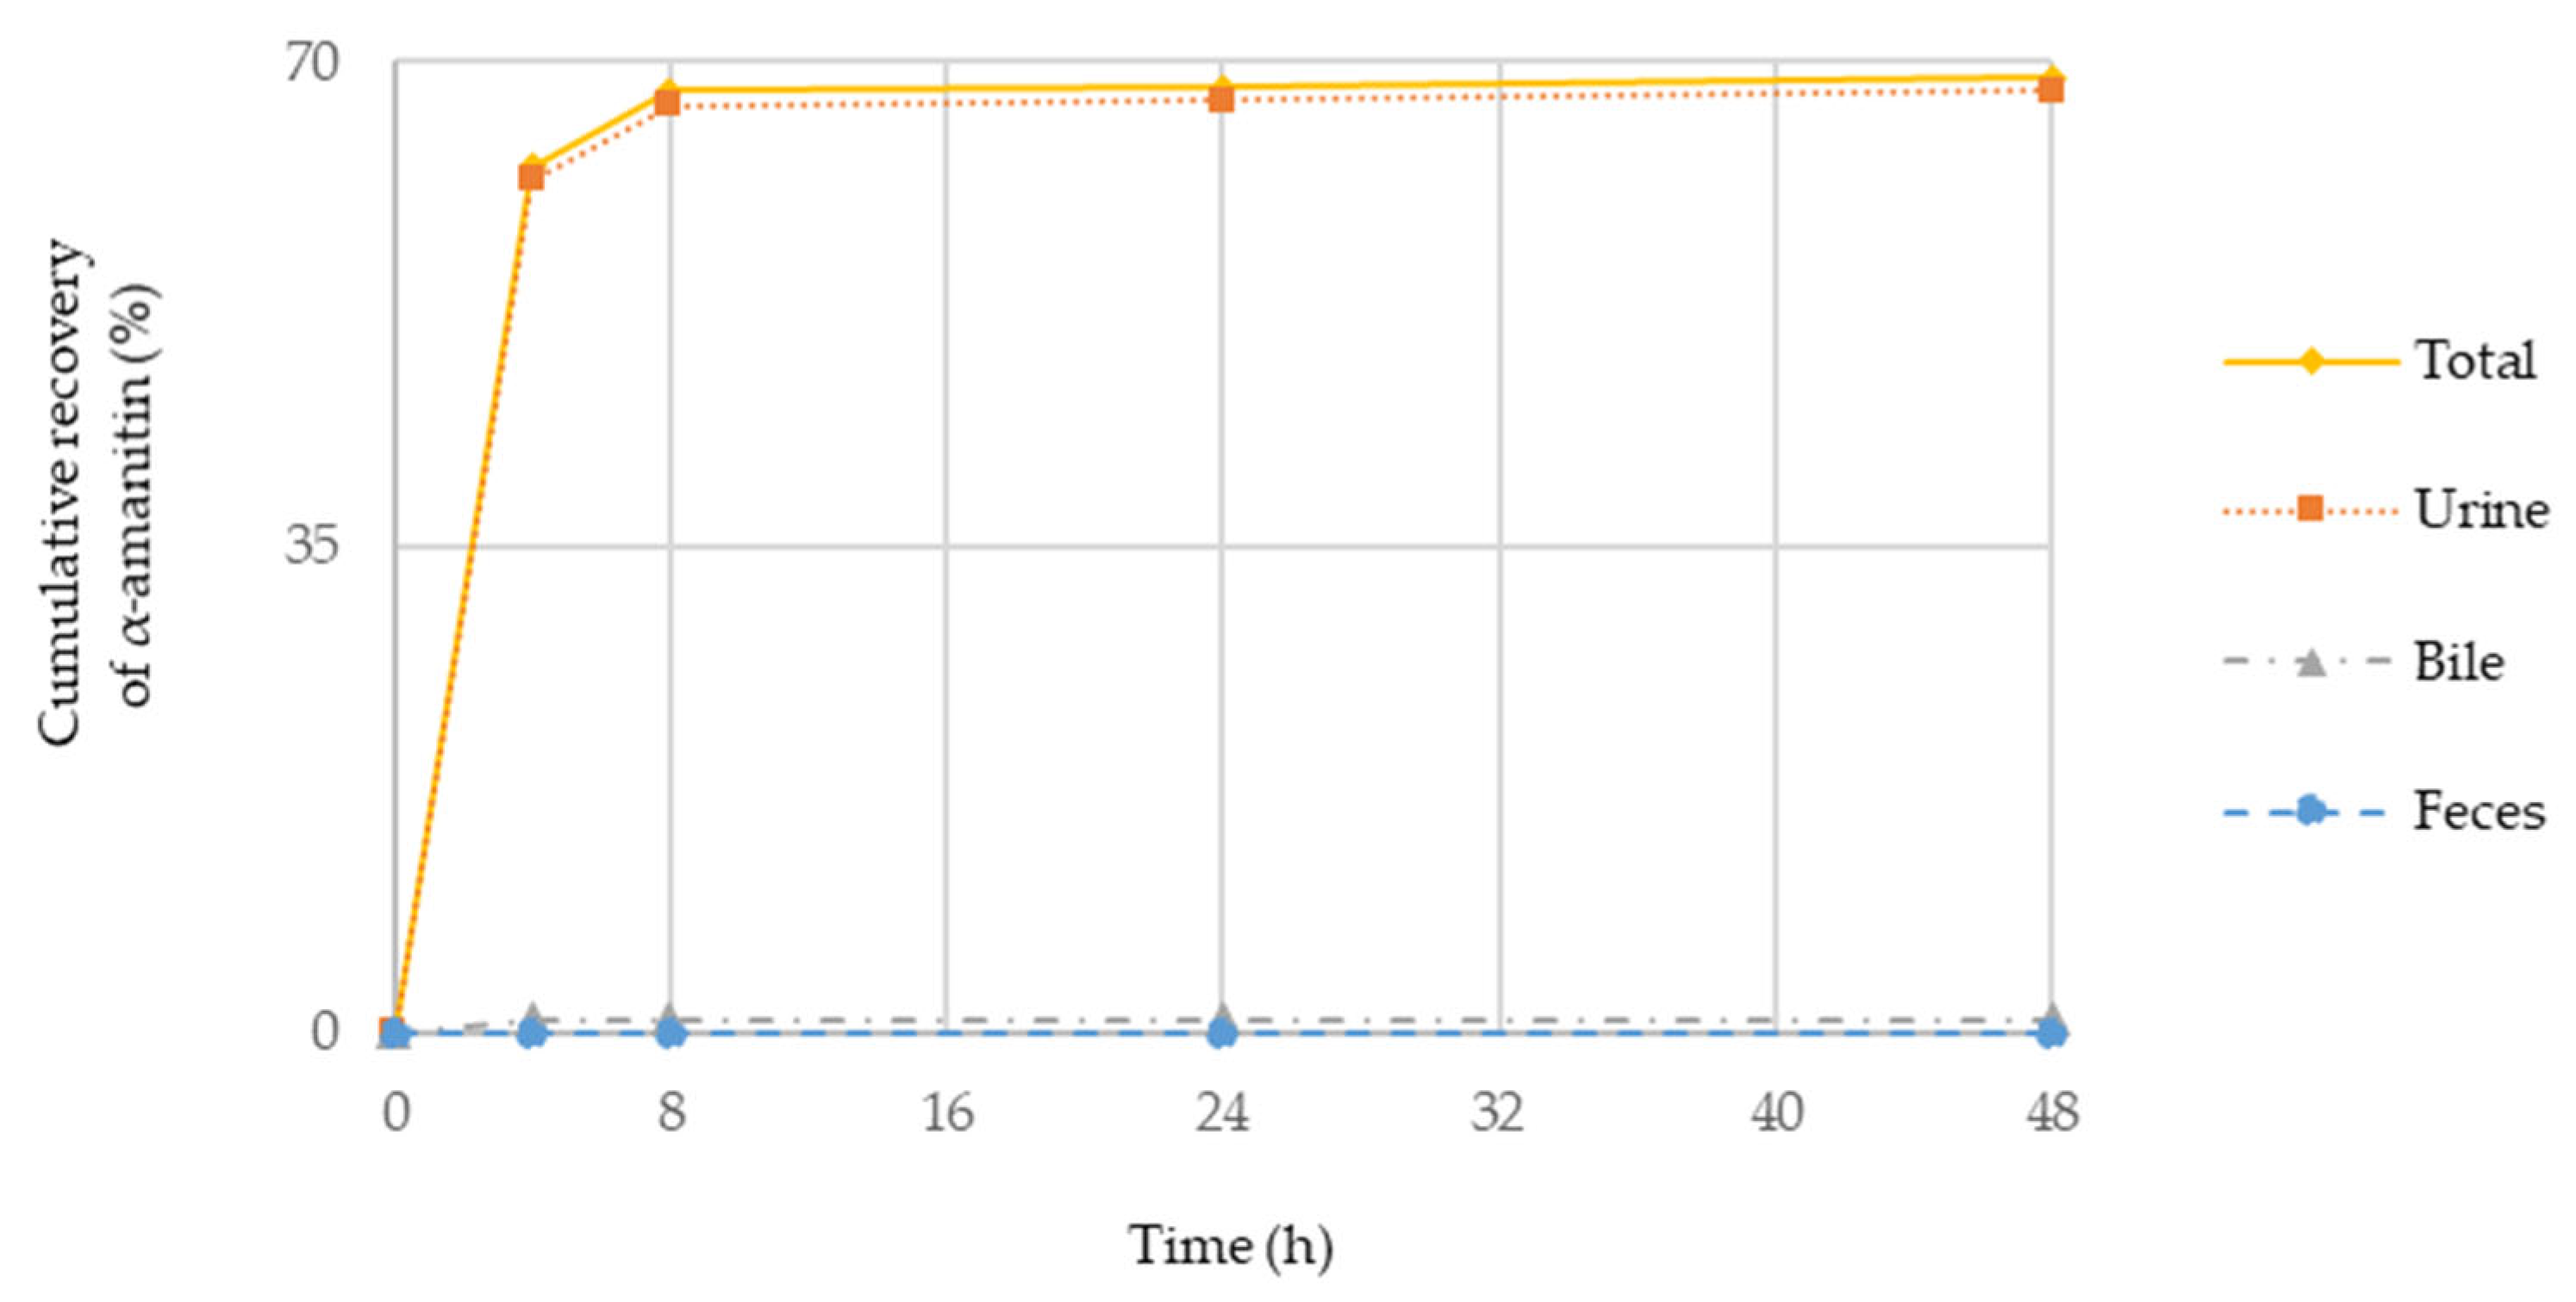
3.7. Semi-Mass Balance Study in Rats

A semi-mass balance study was performed to explore the major elimination route of α-amanitin in rats. A non-radiolabeled α-amanitin was used for the semi-mass balance study which seems acceptable due to low metabolic turn-over of α-amanitin.
For the semi-mass balance study, the housed rats were prepared with a bile duct cannulation and administrated by IV bolus in a lateral tail vein or by PO at 1 mg/kg for each dosing route. Urine and feces were collected using a metabolic cage (Jeungdo Bio & Plant co., Seoul, Republic of Korea), and bile was collected through a bile duct cannula. The sampling time interval were 0–4, 4–8, 8–24, and 24–48 h after administration. The urine, bile, and feces samples were stored at –20 °C until further analysis.

3.8. Software

Data acquisition and a LC-qTOF-MS operation were conducted using Analyst® TF Version 1.6 (Sciex, Foster City, CA, USA). α-Amanitin was quantified by MultiQuant® Version 2.1.1 (Sciex, Foster City, CA, USA) using peak integration. The PK parameters of α-amanitin were calculated by WinNonlin® version 8.1.0 (Certara, Princeton, NJ, USA) in a non-compartment analysis. For MetID analysis, PeakView® Version 2.2 (Sciex, Foster City, CA, USA) and MetabolitePilot™ Version 2.0.2 (Sciex, Foster City, CA, USA) were used for the structural elucidation of α-amanitin metabolites. Excel 2016 spreadsheet (Microsoft®) was also used to process the statistical analysis of results.

4. Conclusions

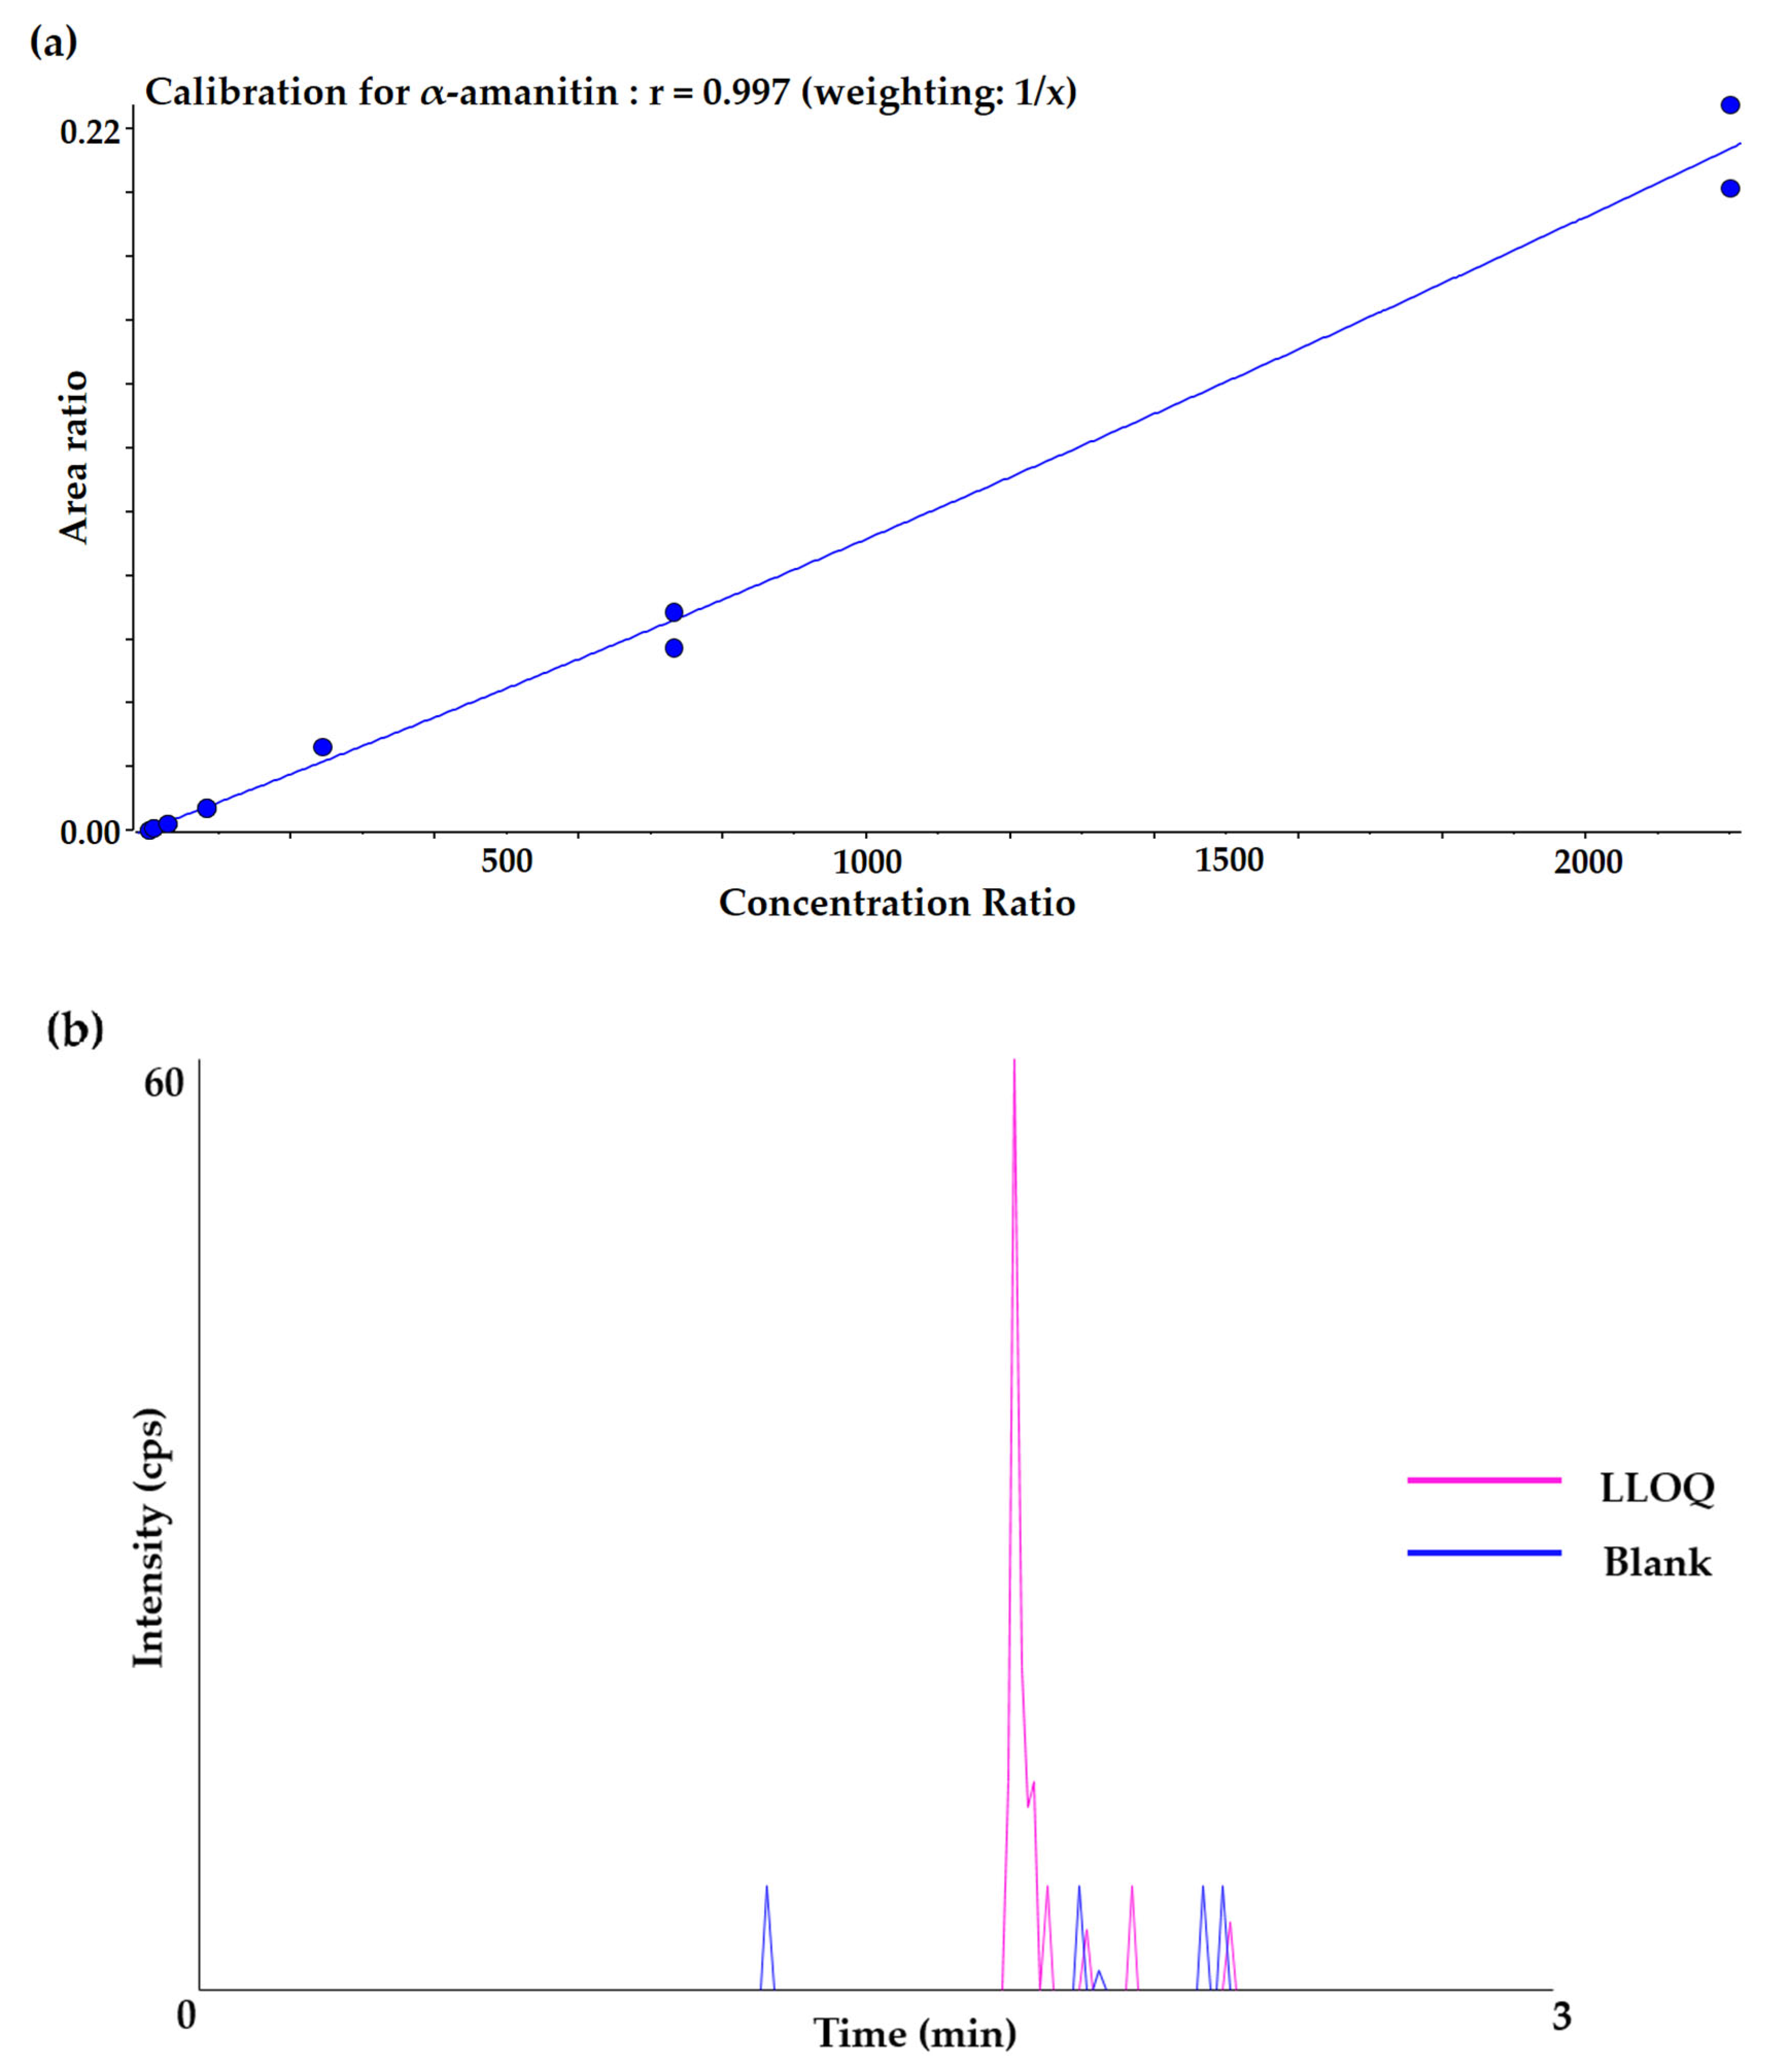
α-Amanitin is recently acknowledged as one of the most popular payloads of ADC and many researchers and pharmaceutical companies are interested in the application of α-amanitin to their ADC research. However, the ADME/PK studies of α-amanitin in various preclinical species are still in premature stages so far. To understand the ADME/PK properties of α-amanitin in rats better, we have explored several in vitro and in vivo studies including bioanalytical method qualification, in vitro liver microsomal stability, in vivo/in vitro MetID, in vivo semi-mass balance study, and in vivo IV/PO PK study. A LC-qTOF-MS method for quantifying α-amanitin in rat plasma was well developed over the calibration range from 3.05 to 2220 ng/mL for quadratic regression with a correlation coefficient > 0.99.
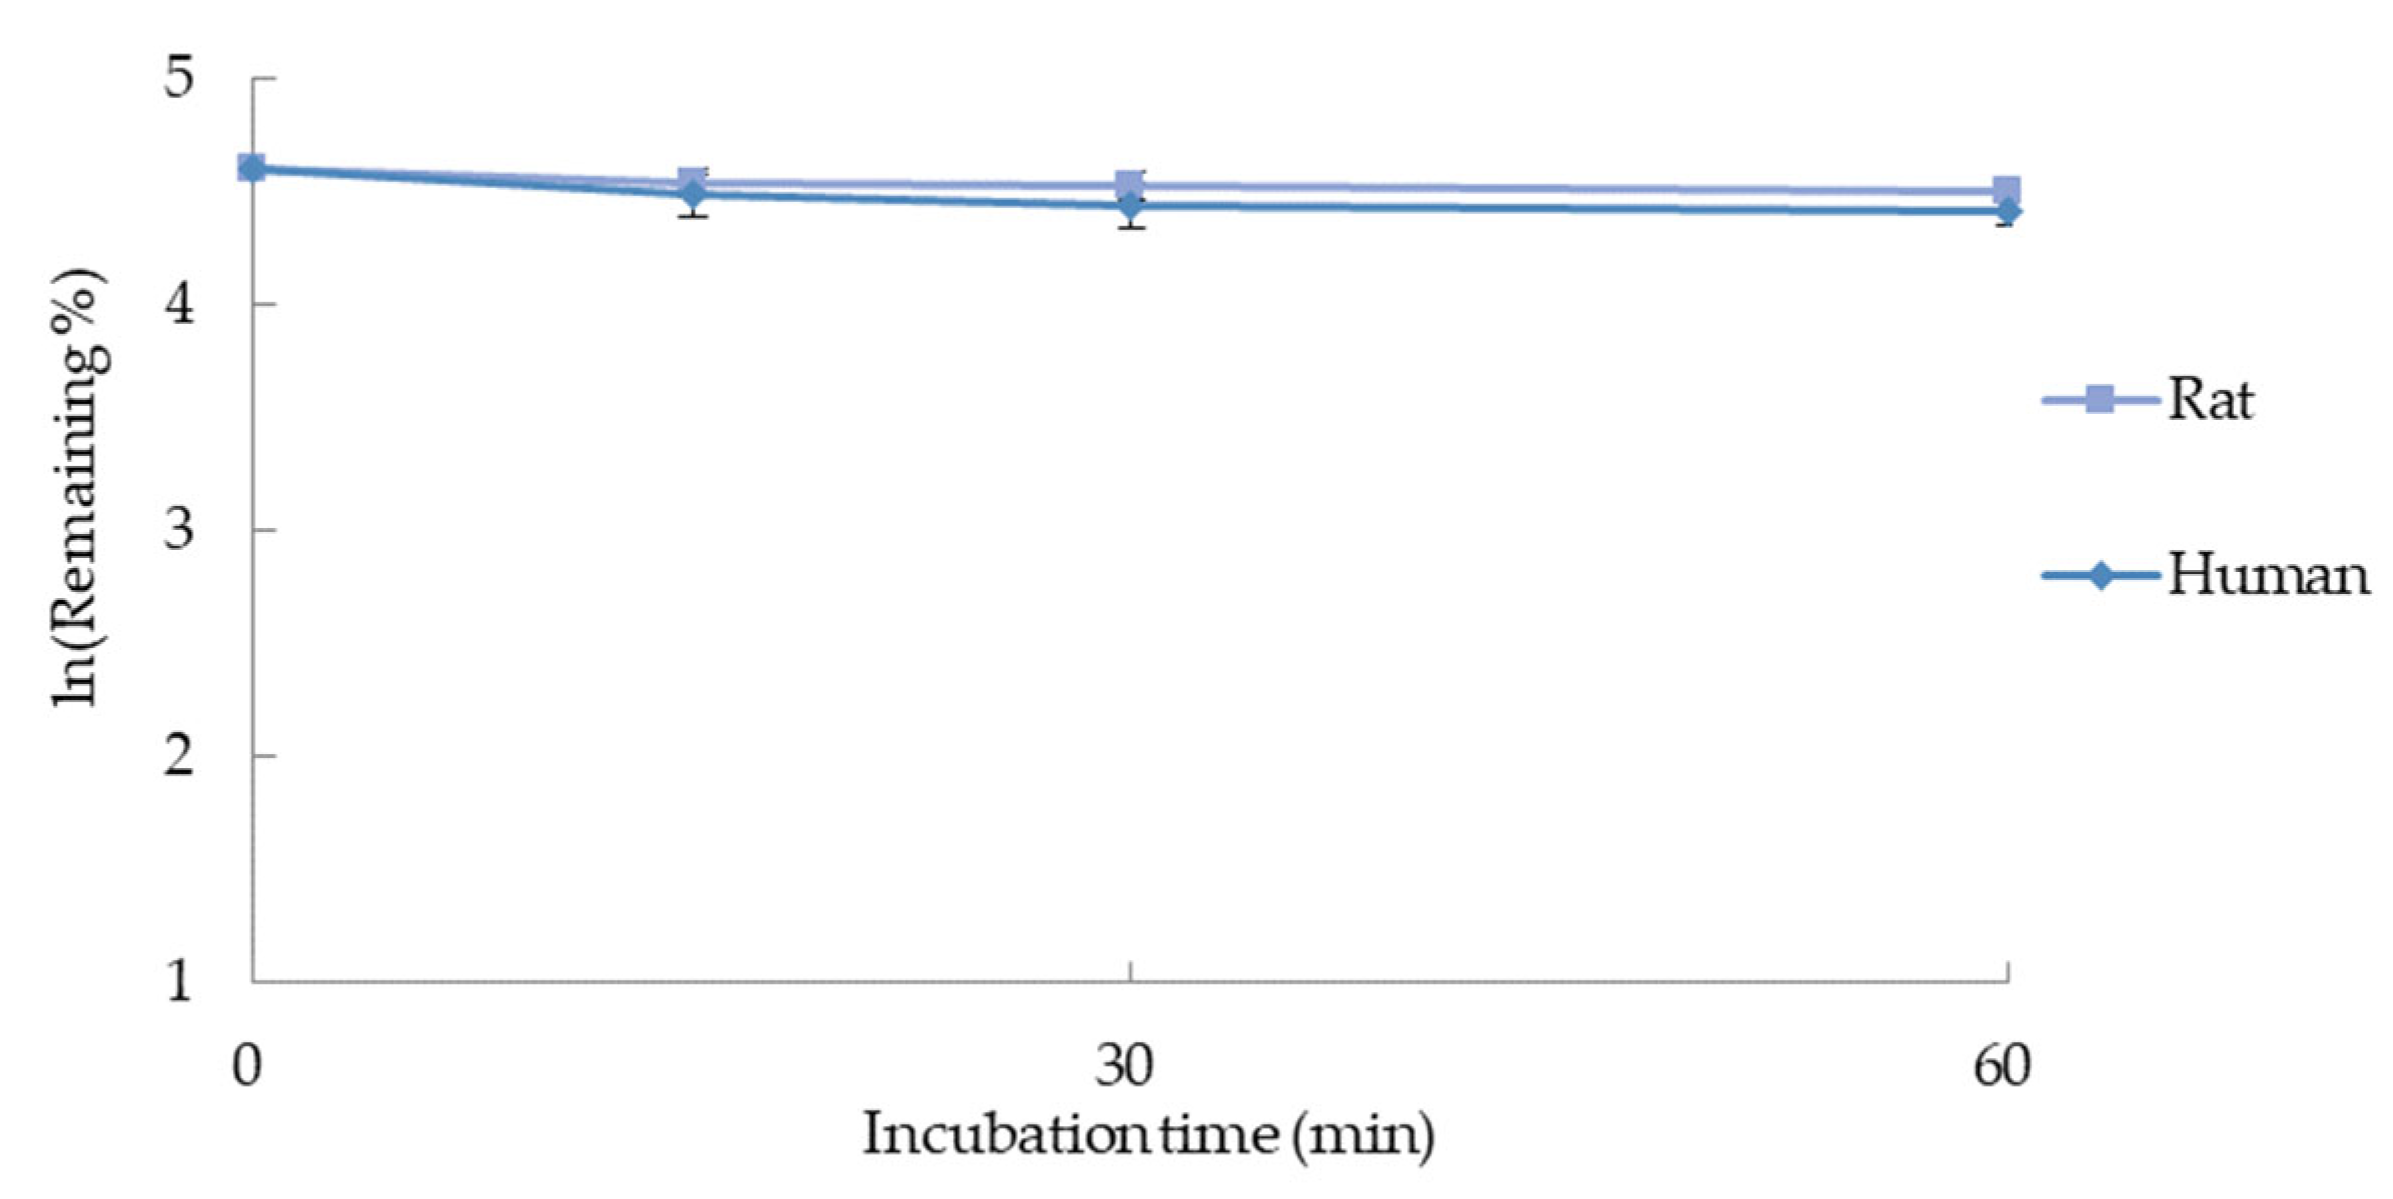
The in vitro metabolic stability test incubated with UDPGA and GSH suggested that α-amanitin rarely underwent liver microsomal metabolism and the predicted clearance was quite low. Moreover, no reactive metabolites with GSH adducts were detected. However, a glucuronide metabolite was found in CLM and HLM as a minor metabolite from in vitro MetID study. To our best knowledge, this is the first report of the glucuronide metabolite of α-amanitin.
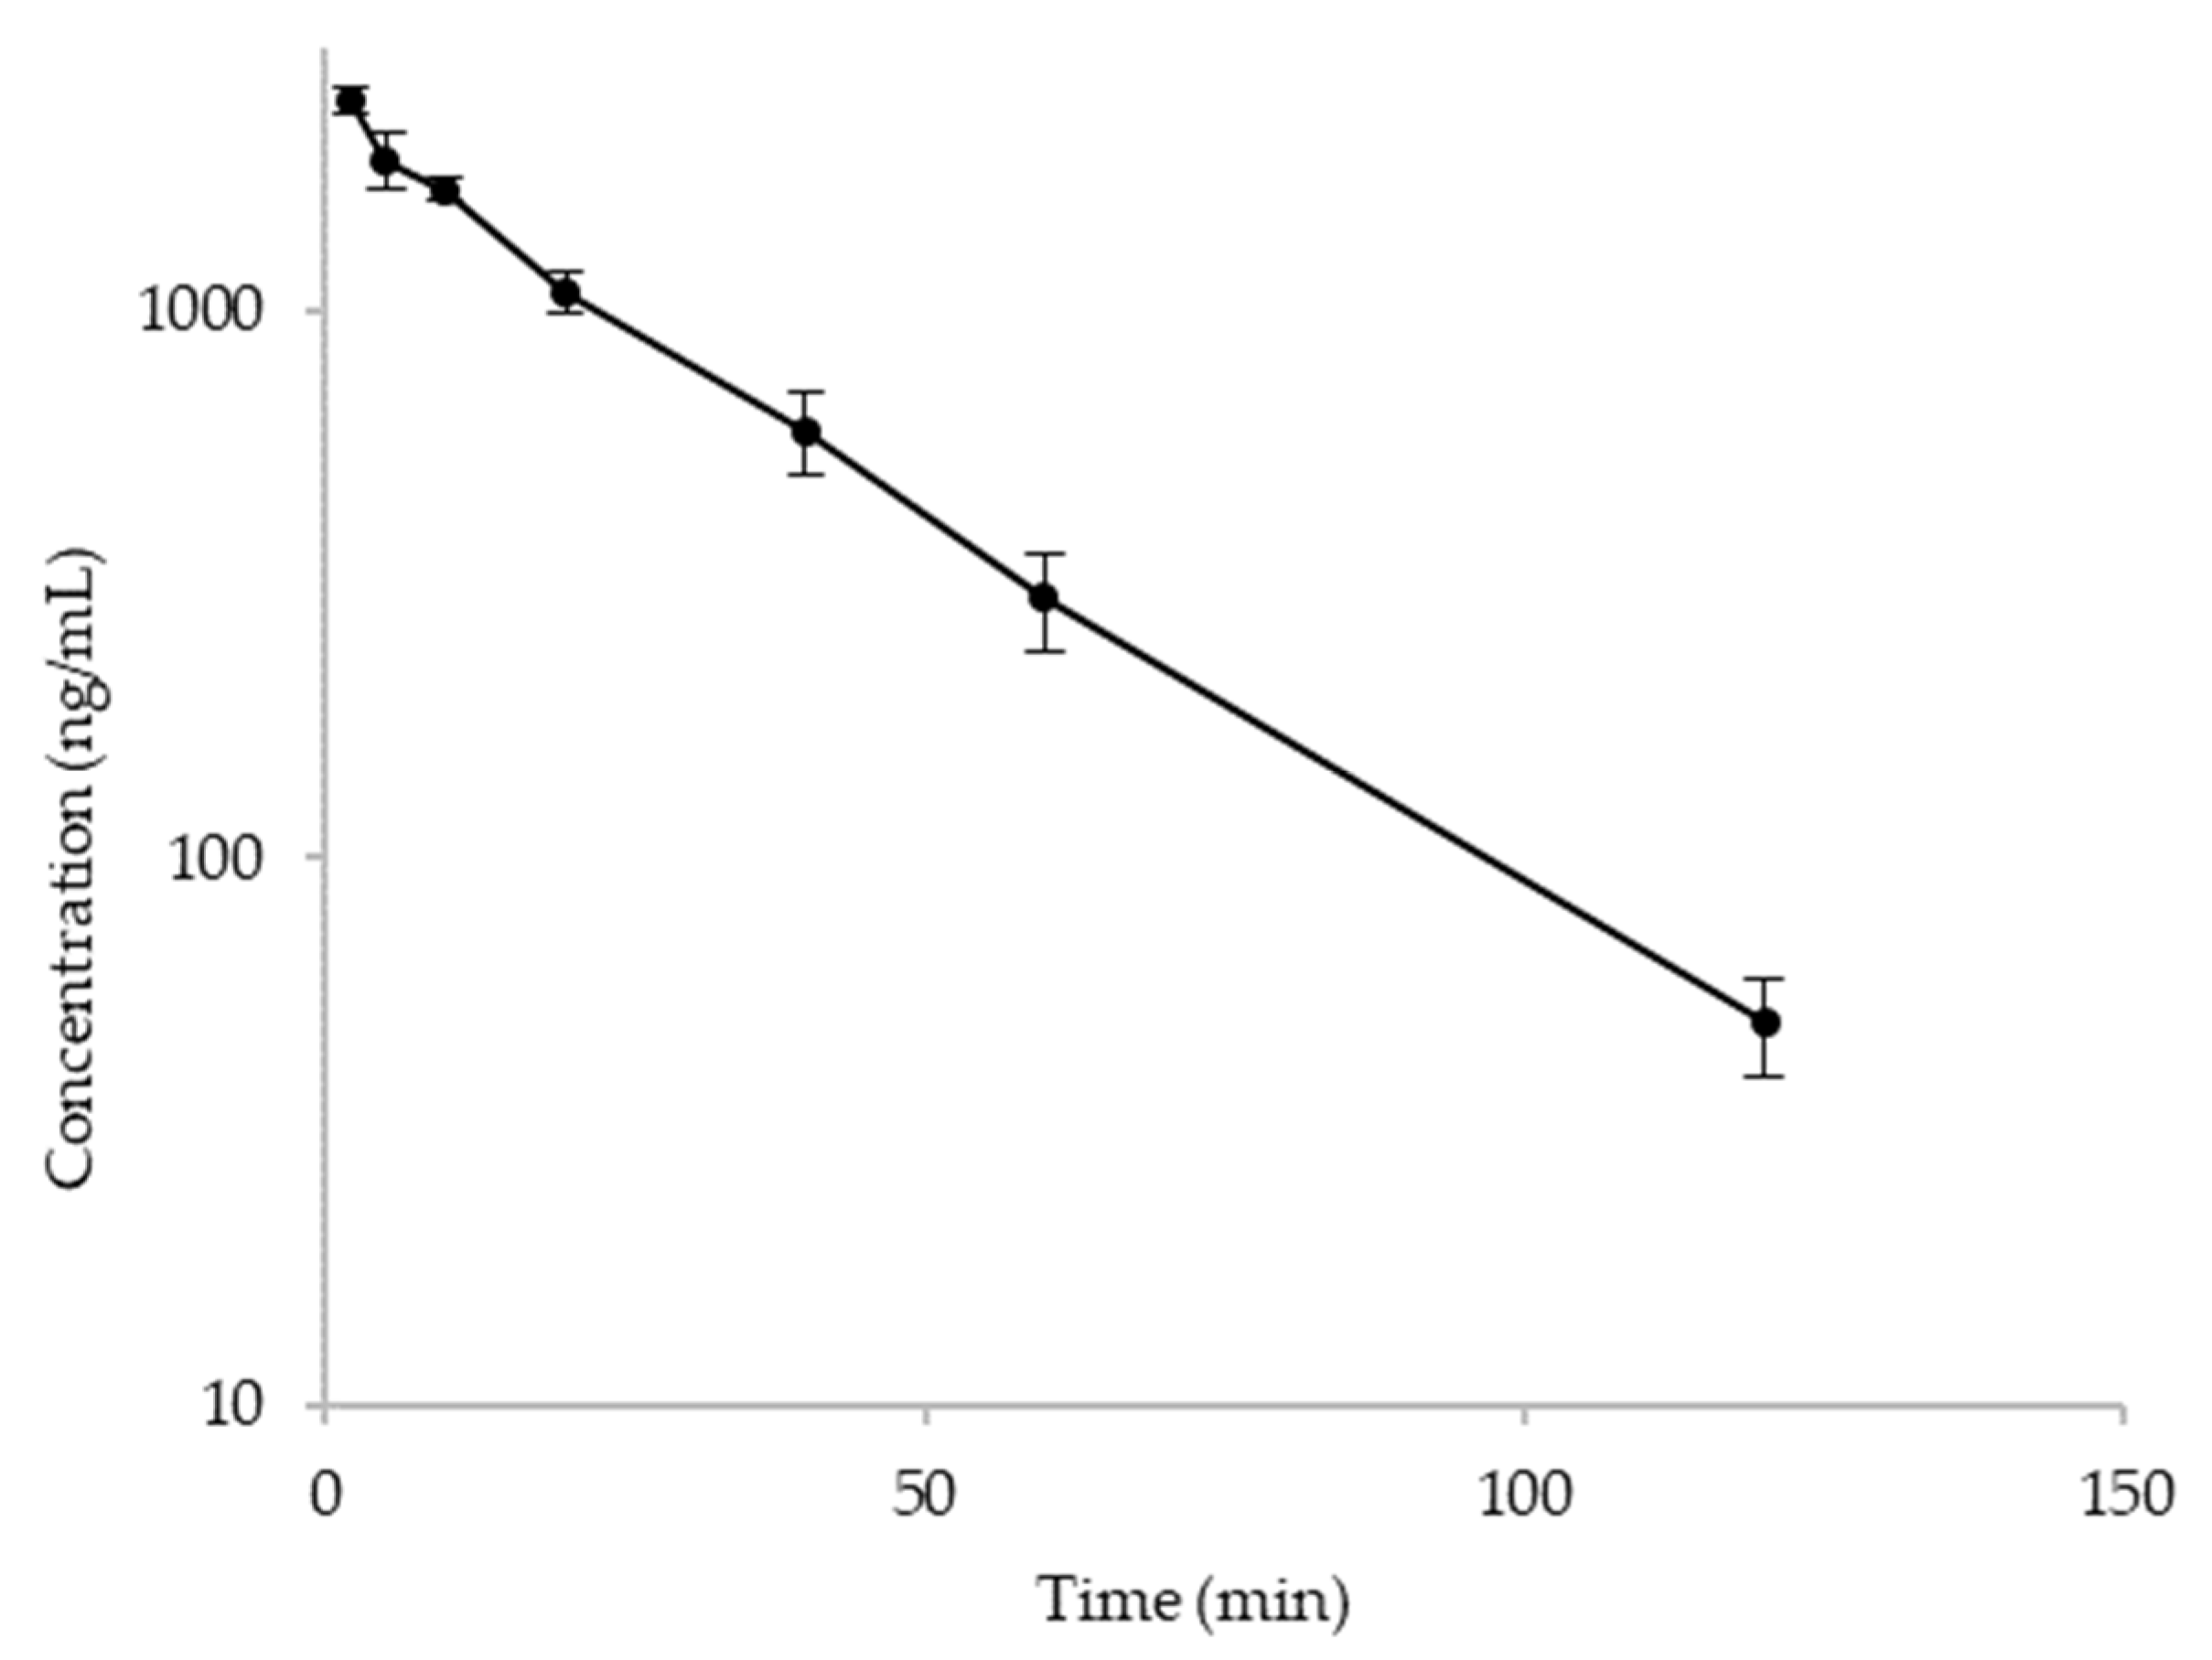
The PK study of α-amanitin in rat demonstrated that α-amanitin had a clearance close to 30% of hepatic blood flow and very low bioavailability, which was different from what we anticipated from the in vitro liver microsomal stability. To investigate the possibility of extra-hepatic metabolism, in vivo MetID was also conducted to compare with in vitro MetID results. No difference was observed between the two matrices, and the major circulating entity in in vivo rat plasma sample was still α-amanitin.
Therefore, semi-mass balance study was conducted to explore the contribution of in vivo α-amanitin clearance from the elimination perspective. The semi-mass balance study showed that most α-amanitin was eliminated very quickly in urine within 8 h after IV administration which suggests that some renal transporters in the kidney might actively play a role in terms of in vivo clearance of α-amanitin. Recently US FDA also indicated the importance of several transporters such as OATP1B1, OAT, OCT, etc., in terms of drug–drug interaction and since the renal excretion is the main elimination route of α-amanitin, the evaluation of transporters for α-amanitin would be quite necessary for its ADC drug development in the future [14]. Further studies will be warranted to understand the roles of transporters in renal clearance of α-amanitin as well as the in vivo MetID of α-amanitin in urine.

Author Contributions

Conceptualization, J.L. and B.i.L.; methodology, J.L. and B.i.L.; software, J.L.; validation, J.L., B.i.L., J.C., Y.P., S.-J.P., J.-H.L., M.P., S.H. and J.-M.L.; formal analysis, J.L. and B.i.L.; investigation, J.L. and B.i.L.; resources, Y.G.S.; data curation, J.L.; writing—original draft preparation, J.L.; writing—review and editing, B.i.L., J.C., Y.P., S.-J.P., J.-H.L., M.P., S.H., J.-M.L. and Y.G.S.; visualization, J.L.; supervision, Y.G.S.; project administration, Y.G.S. All authors have read and agreed to the published version of the manuscript.

Funding

This research was supported by a research fund of Chungnam National University.

Institutional Review Board Statement

The study was conducted according to the guidelines of the Declaration of Helsinki, and approved by the Institutional Review Board (or Ethics Committee) of Chungnam National University (protocol code No. 202112A-CNU-221). All procedures related to animal experiments were also performed in accordance with the guidelines established by the Association for Assessment and Accreditation of Laboratory Animal Care International (AAALAC International).

Informed Consent Statement

Not applicable.

Data Availability Statement

The data presented in this study are available on request from the corresponding author.

Conflicts of Interest

The authors declare no conflict of interest.

Sample Availability

Samples of the compounds can be available on request from the corresponding author.

References

  1. Antibody Drug Conjugates Market, 5th ed.; Roots Analysis: Punjab, India, 2019.
  2. Overview of Heidelberg-Pharma. Available online: https://heidelberg-pharma.com/en/company/overview (accessed on 11 October 2022).
  3. Pahl, A.; Lutz, C.; Hechler, T. Amanitins and their development as a payload for antibody-drug conjugates. Drug Discov Today Technol. 2018, 30, 85–89. [Google Scholar] [CrossRef] [PubMed]
  4. Bushnell, D.A.; Cramer, P.; Kornberg, R.D. Structural basis of transcription: Alpha-amanitin-RNA polymerase II cocrystal at 2.8 a resolution. Proc. Natl. Acad. Sci. USA 2002, 99, 1218–1222. [Google Scholar] [CrossRef] [PubMed] [Green Version]
  5. Gorovits, B.; Alley, S.C.; Bilic, S.; Booth, B.; Kaur, S.; Oldfield, P.; Purushothama, S.; Rao, C.; Shord, S.; Siguenza, P. Bioanalysis of antibody-drug conjugates: American Association of Pharmaceutical Scientists Antibody-Drug Conjugate Working Group position paper. Bioanalysis 2013, 5, 997–1006. [Google Scholar] [CrossRef] [PubMed] [Green Version]
  6. Sadekar, S.; Figueroa, I.; Tabrizi, M. Antibody Drug Conjugates: Application of Quantitative Pharmacology in Modality Design and Target Selection. AAPS J. 2015, 17, 828–836. [Google Scholar] [CrossRef] [PubMed] [Green Version]
  7. Baranczewski, P.; Stanczak, A.; Sundberg, K.; Svensson, R.; Wallin, A.; Jansson, J.; Garberg, P.; Postlind, H. Introduction to in vitro estimation of metabolic stability and drug interactions of new chemical entities in drug discovery and development. Pharmacol. Rep. 2006, 58, 453–472. [Google Scholar] [PubMed]
  8. Naritomi, Y.; Terashita, S.; Kimura, S.; Suzuki, A.; Kagayama, A.; Sugiyama, Y. Prediction of human hepatic clearance from in vivo animal experiments and in vitro metabolic studies with liver microsomes from animals and humans. Drug Metab. Dispos. 2001, 29, 1316–1324. [Google Scholar] [PubMed]
  9. Bateman, K.P.; Cohen, L.; Emary, B.; Pucci, V. Standardized workflows for increasing efficiency and productivity in discovery stage bioanalysis. Bioanalysis 2013, 5, 1783–1794. [Google Scholar] [CrossRef] [PubMed]
  10. Faulstich, H.; Talas, A.; Wellhoner, H.H. Toxicokinetics of labeled amatoxins in the dog. Arch. Toxicol. 1985, 56, 190–194. [Google Scholar] [CrossRef] [PubMed]
  11. Park, R.; Choi, W.G.; Lee, M.S.; Cho, Y.Y.; Lee, J.Y.; Kang, H.C.; Sohn, C.H.; Song, I.S.; Lee, H.S. Pharmacokinetics of alpha-amanitin in mice using liquid chromatography-high resolution mass spectrometry and in vitro drug-drug interaction potentials. J Toxicol Environ. Health A 2021, 84, 821–835. [Google Scholar] [CrossRef] [PubMed]
  12. Hop, C.E.; Wang, Z.; Chen, Q.; Kwei, G. Plasma-pooling methods to increase throughput for in vivo pharmacokinetic screening. J. Pharm. Sci. 1998, 87, 901–903. [Google Scholar] [CrossRef] [PubMed]
  13. FDA. Bioanalytical Method Validation Guidance for Industry; FDA-2013-D-1020; FDA: Silver Spring, MD, USA, 2018. [Google Scholar]
  14. FDA. In Vitro Metabolismand TransporterMediated Drug-Drug Interaction Studies Guidance for Industry; FDA: Silver Spring, MD, USA, 2017. [Google Scholar]
Figure 1. Structure of α-amanitin.
Molecules 27 08612 g001
Figure 2. (a) Calibration curve for quantification and (b) chromatogram of LLOQ and blank samples of α-amanitin in rat plasma.
Molecules 27 08612 g002
Figure 3. Metabolic stability of α-amanitin in rat and human liver microsomes.
Molecules 27 08612 g003
Figure 4. Time to concentration profile of α-amanitin in rats after IV administration at 1 mg/kg.
Molecules 27 08612 g004
Figure 5. Cumulative recovery of α-amanitin in urine, bile, and feces after IV administration.
Molecules 27 08612 g005
Figure 6. Fragmentation pattern of parent ion of α-amanitin (m/z 919.36).
Molecules 27 08612 g006
Figure 7. Identification of in vitro glucuronide metabolite of α-amanitin. (a) Product ion scan of α-amanitin in HLM (m/z 919.36); (b) product ion scan of α-amanitin in CLM (m/z 919.36); (c) product ion scan of a glucuronide metabolite in HLM (m/z 548.20); (d) product ion scan of a glucuronide metabolite in CLM (m/z 548.20).
Molecules 27 08612 g007aMolecules 27 08612 g007b
Figure 8. Metabolic pathways of α-amanitin under in vitro MetID (CLM and HLM).
Molecules 27 08612 g008
Figure 9. Total ion chromatograms of α-amanitin and its glucuronide metabolite in liver microsomes.
Molecules 27 08612 g009
Table 1. QC results and statistics from the intra/inter-run assays for α-amanitin in rat plasma.
RunStatisticsLow QCMedium QCHigh QC
(15.0 ng/mL)(165 ng/mL)(1820 ng/mL)
Intra-run 1Mean accuracy (%)107103121
Precision (% CV)13.14.633.83
Intra-run 2Mean accuracy (%)10510595.2
Precision (% CV)6.455.153.72
Intra-run 3Mean accuracy (%)97.897.0103
Precision (% CV)5.898.281.84
Inter-runMean accuracy (%)103102107
Precision (% CV)8.556.0210.5
Table 2. Stability tests for α-amanitin in rat plasma.
StabilityStatisticsLow QCMedium QCHigh QC
Assessment(15.0 ng/mL)(165 ng/mL)(1820 ng/mL)
Short-termMean accuracy (%)81.680.595.7
(4 h, RT)Precision (% CV)4.165.296.06
Long-termMean accuracy (%)106118103
(2 weeks, –20 °C)Precision (% CV)5.314.237.89
Freeze-thawMean accuracy (%)94.9103114
(3 cycles, –20 °C and RT)Precision (% CV)3.106.602.80
Table 3. Extraction recovery of α-amanitin in rat plasma.
RunThe Extraction Recovery (%)
132.0
234.0
328.7
426.7
533.6
mean31.0
% CV10.2
Table 4. Remaining % of α-amanitin in rat and human liver microsomes.
Incubation Time
(min)
Remaining %
RatHuman
0100100
1594.2 ± 8.6089.2 ± 5.72
3093.1 ± 8.6485.1 ± 5.52
6090.3 ± 4.3782.6 ± 3.96
Table 5. Metabolic stability parameters of α-amanitin in rat and human liver microsomes.
SpeciesT1/2 (min)CLint, In Vitro
(mL/min/mg)
CLint, In Vivo
(mL/min/kg)
CLh
(mL/min/kg)
Rat447<0.015.565.05
Human236<0.017.365.43
Table 6. PK parameters of α-amanitin in rats after IV administration at 1 mg/kg.
T1/2 (min)Cmax (ng/mL)AUClast (min·ng/mL)Cl (mL/min/kg)Vss (mL/kg)
22.3 ± 0.982290 ± 27470,400 ± 603014.0 ± 1.30409 ± 18.3
Table 7. Recovery in urine, bile, and feces at IV and PO administration.
Route of AdministrationRoute of ExcretionRecovery (%)
IVUrine67.9
Bile1.00
Feces<0.01
POUrine1.45
Bile0.05
Feces22.0
Table 8. Characterization of α-amanitin and its metabolite using the LC-qTOF-MS assay.
MetabolitesObserved m/zFormulaRetention Time
(min)
Error ppmCLM and HLMMLM, RLM, and DLMPooled Rat Plasma
Parent919.3621C39H54N10O14S9.040.6OOO
Glucuronide548.2005C45H62N10O20S8.120.2ON/D *N/D *
* N/D: Not detected.
Table 9. Mobile phase conditions for LC gradient.
Quantification of α-Amanitin
Time (min)Mobile Phase B (%)
05
0.65
195
1.395
1.45
3.05
MetID for α-Amanitin
Time (min)Mobile Phase B (%)
02
0.52
3.035
17.035
17.595
18.595
18.62
20.02
Publisher’s Note: MDPI stays neutral with regard to jurisdictional claims in published maps and institutional affiliations.

