
Mechanism of Hexane Displaced by Supercritical Carbon Dioxide: Insights from Molecular Simulations
Key Laboratory of Low-Grade Energy Utilization Technologies and Systems, School of Energy and Power Engineering, Chongqing University, Ministry of Education, Chongqing 400044, China
*
Author to whom correspondence should be addressed.
Molecules 2022, 27(23), 8340; https://doi.org/10.3390/molecules27238340
Submission received: 3 November 2022
/
Revised: 21 November 2022
/
Accepted: 23 November 2022
/
Published: 29 November 2022
(This article belongs to the Special Issue Exploration of the Separation Processes in Nanomaterials)
Abstract
:Supercritical carbon dioxide (sCO2) has great potential for displacing shale oil as a result of its high solubility and low surface tension and viscosity, but the underlying mechanisms have remained unclear up to now. By conducting equilibrium molecular dynamics (EMD) simulations, we found that the displacing process could be divided into three steps: the CO2 molecules were firstly injected in the central region of shale slit, then tended to adsorb on the SiO2-OH wall surface and mix with hexane, resulting in loose hexane layer on the shale surface, and finally displaced hexane from the wall due to strong interactions between CO2 and wall. In that process, the displacing velocity and efficiency of hexane exhibit parabolic and increased trends with pressure, respectively. To gain deep insights into this phenomenon, we further performed non-equilibrium molecular dynamics (NEMD) simulations and found that both the Onsager coefficients of CO2 and hexane were correlated to increase with pressure, until the diffusion rate of hexane being suppressed by the highly dense distribution of CO2 molecules at 12 MPa. The rapid transportation of CO2 molecules in the binary components (CO2 and hexane) actually promoted the hexane diffusion, which facilitated hexane flowing out of the nanochannel and subsequently enhanced oil recovery efficiency. The displacing process could occur effectively at pressures higher than 7.5 MPa, after which the interaction energies of the CO2-wall were stronger than that of the hexane-wall. Taking displacing velocity and efficiency and hexane diffusion rate into consideration, the optimal injection pressure was found at 10.5 MPa in this work. This study provides detailed insights into CO2 displacing shale oil and is in favor of deepening the understanding of shale oil exploitation and utilization.
1. Introduction
In the past decade, the global consumption of fossil energy has tremendously increased, which increases the urgency of the development of new hydrocarbon resources [1,2,3]. Among the unconventional sources, shale oil has aroused extensive interest attributed to its abundant reserves, continuous distribution, and easy exploitation in comparison with the existing primary fossil energy [4,5,6]. Shale oil is widely presented in nano-porous shale slit through physicochemical changes such as adsorption and deposition [7,8,9,10]. Some technologies such as horizontal drilling, hydraulic fracturing, and supercritical carbon dioxide (sCO2) displacing methods have been developed to exploit shale oil [1,11,12]. The method of sCO2 displacing shale oil has some unique advantages, such as high solubility, swelling shale oil, low surface tension and viscosity, and enhanced crude oil recovery, compared with other technologies [13,14]. In consideration of the high efficiency involved in extracting shale oil and weakening greenhouse effects, the sCO2 displacing shale oil technology has developed rapidly in recent years [12,15,16,17]. However, the underlying mechanisms of the displacing process involved have remained unclear up to now.
Some studies have compared the performance of shale oil displacing by various components, and summarized common rules in the displacing process. For instance, Zhang et al. [18] investigated the adsorption and diffusion of shale oil in nanopores using molecular dynamics (MD) simulations. They found that the oil adsorption capacity followed the sequential order of organic matter > inorganic material > montmorillonite, and the diffusivities of octane in the shale nanopores were on the order of 10−9 m2/s. Zhong et al. [19] adopted four components with different polarities including decane, methyl benzene, pyridine and acetic acid in crude oil to reveal the adsorption behaviors of different sorbates on a silica surface. They found that the adsorption capability of the adsorbent was closely associated with interactions between the adsorbate and the silica surface. The polar oil components were preferentially absorbed on the mineral surface, which acted as an anchor to promote the adsorption of nonpolar counterparts.
Attributed to the essential and fundamental phenomenon, the flow and diffusion behaviors for shale gases in nano-porous shale have aroused wide attentions. By using simulations, Chen et al. [20] investigated the flow and transport of shale gas in a nano-porous shale structure. They found that shale with high tortuosity demonstrated extremely low intrinsic permeability, whereas the diffusion mode was dominated by Knudsen diffusion. In addition, the transport process was also taken into consideration by Wang et al. [21], who revealed the flow characteristics of CH4 molecules transport through calcite nanopores, and found that the slower mass transfer arose from strong interactions and the rough inner surface.
Extensive efforts have also been devoted to the displacing process of shale oil for exploring useful methods in enhancing oil recovery. Shuai et al. [22] investigated the sCO2 extraction process of organic matter from shale oil by experiments and simulations. They revealed that the displacement interface was more centralized as injection flow and residence increased, which could further enhance displacement rates. Lara et al. [23] studied the effect of improved oil recovery (IOR) agents, including NaCl solutions, CO2, N2, and CH4 on IOR process by MD simulations. They found that CO2 outperformed other components since its miscibility increased with pressure. Attributed to low interfacial tension and rapid diffusion in the oil phase, sCO2 was especially suitable for IOR applications. Similar conclusions were also drawn by Nguyen et al. [24], who compared the performance of three different injection fluids, including sCO2, N2, and water in oil recovery, and found that sCO2-based recovery approached 90% and outperformed the other two fluids. Seyyedi et al. [25] studied the interactions between carbonated water injection (CWI) and live crude oil through experimentation. The results revealed that CO2 was gradually transferred to the oil, which liberated lean gases and improved oil recovery in the CW-oil system. However, the mutual mass transfer between CO2 and oil in the CO2-oil system led to heavier oil than the original. Lashgari et al. [15] revealed the dominant mechanisms of improved oil recovery in the injection of miscible enriched gas and CO2. They found that the diffusion could enhance CO2 flux delivery and contribute to oil recovery efficiency.
Apart from the essential role of the diffusion process, pressure and temperature both have an enormous influence on the displacing outcome. Fakher et al. [12] investigated oil recovery and carbon capture from shale reservoirs in the CO2 injection process. They found that cyclic CO2 injection had strong potential in enhancing oil recovery. The increasing pressure in conjunction with low temperature were both acted to improve oil recovery and CO2 storage. Similar results were also obtained by Elwegaa et al. [11], who studied oil recovery from shale oil reservoirs by using cyclic cold CO2 and found that the cold CO2 injection enhanced both porosities and permeabilities of the core samples up to 3.5% and 8.8%, leading to a higher oil recovery factor in comparison with that at ambient temperature.
As reviewed above, the current studies mainly concentrated on adsorption and diffusion behaviors in nano-porous shale, but placed insufficient emphasis on the shale oil displacing process by sCO2. Since the huge advantages of this technology in exploiting shale oil, the underlying mechanisms, especially the detailed displacing process, injection pressure, and mutual interference should be revealed urgently. In this study, the hydroxylated silica and hexane were adopted as shale slit and shale oil, respectively. We revealed the process of sCO2 displacing hexane, searching for the optimal pressure by taking the displacing velocity and efficiency, as well as the displacing mechanisms in the presence of sCO2 and hexane into consideration. This study provides new insights in sCO2 displacing shale oil, and supports the deepening of the understanding of shale oil exploitation and utilization.
2. Results and Discussions
2.1. CO2 Displacing Hexane from SiO2-OH Wall
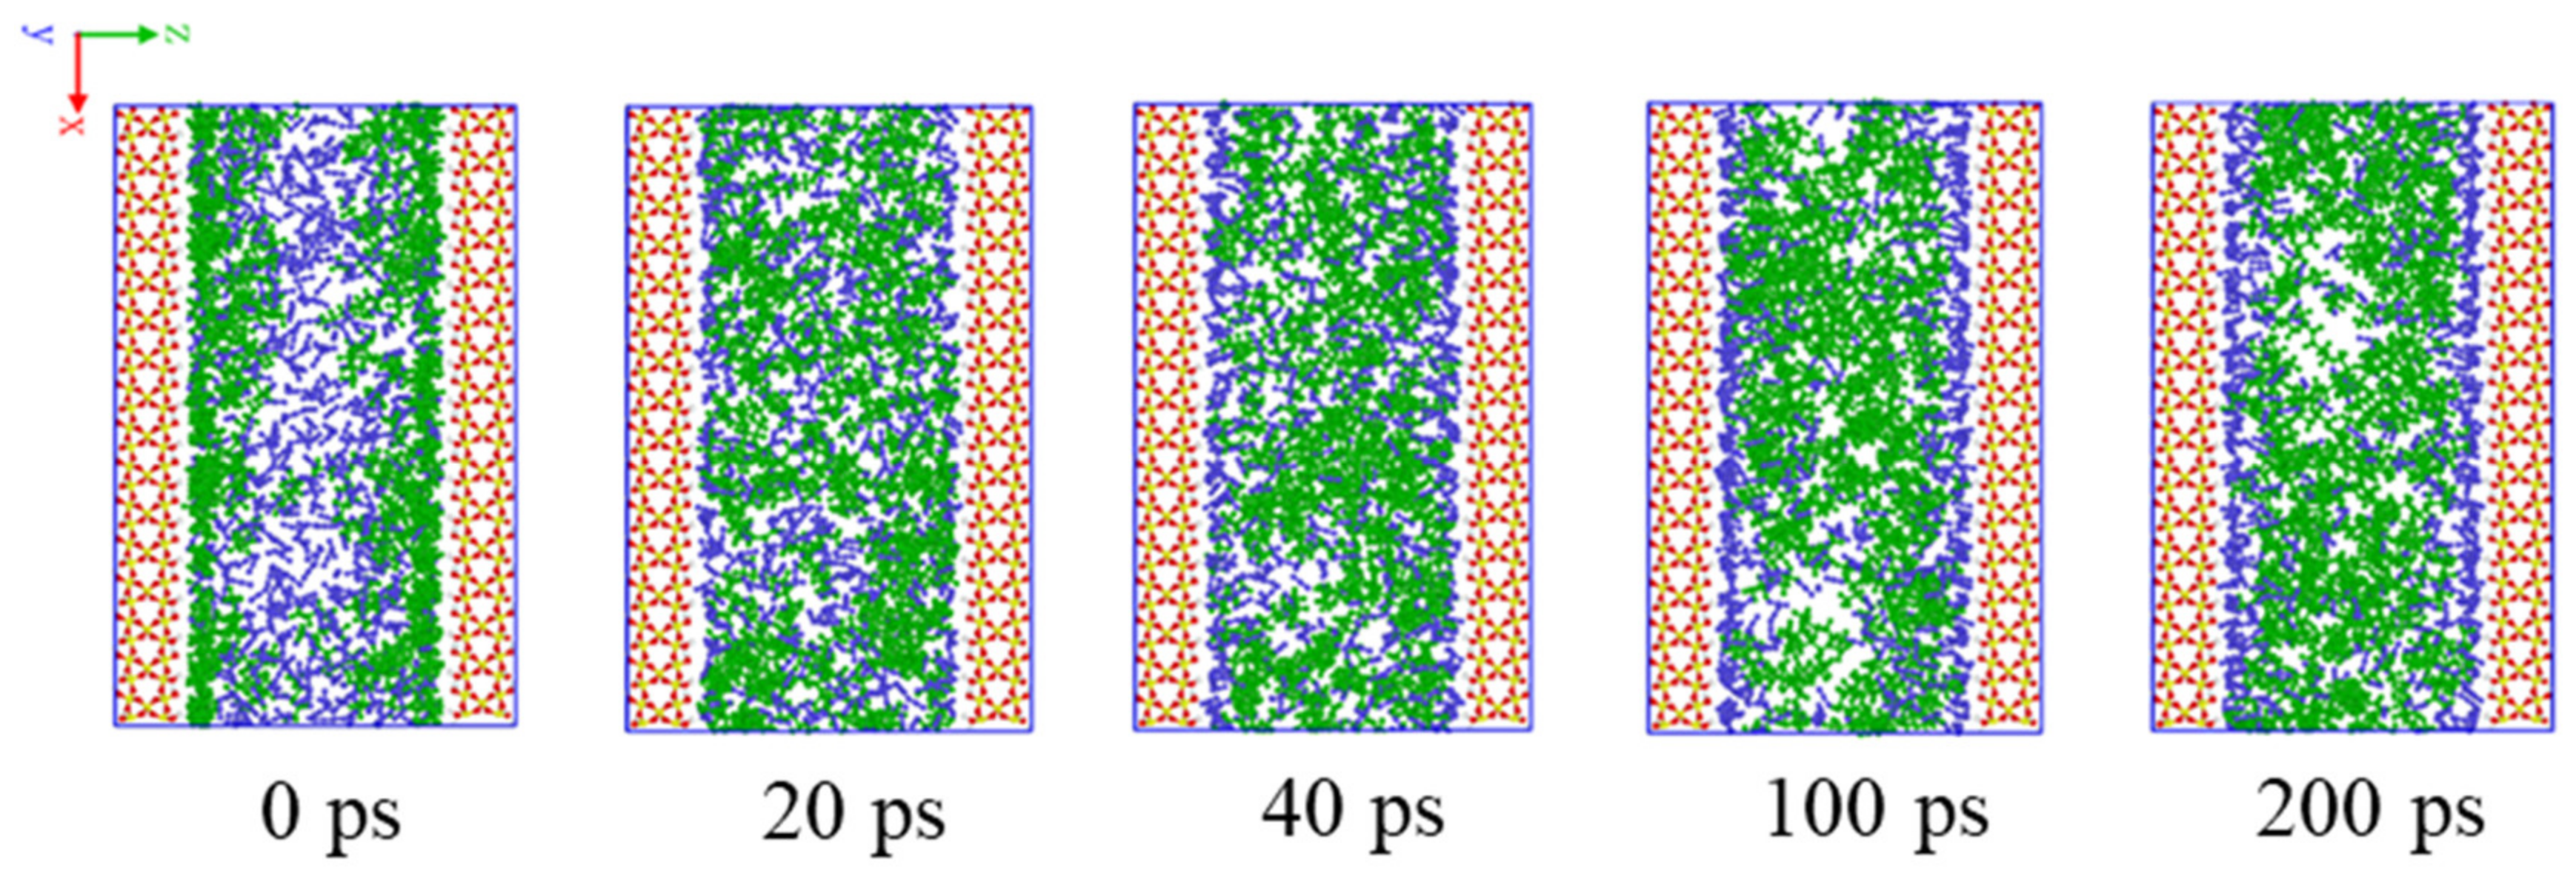
Figure 1 shows the time evolution of CO2 displacing hexane from the SiO2-OH wall at 10.5 MPa from the initial moment, t = 0 ps, to t = 200 ps. It is seen from Figure 1 that hexane molecules adsorb stably at the wall and form a uniform oil layer at the initial moment. This distribution is gradually disturbed as CO2 molecules diffuse into the area near the wall, occupy on the wall surface and displace hexane from the wall. As simulation time increases from t = 20 to t = 40 ps, the displacing process is clearly exhibited. More and more CO2 molecules displace hexanes and adsorb on the wall surface. When it evolves to 100 ps, the displacing process approaches completion, and remains little difference when evolving to 200 ps. The supercritical CO2 molecules almost completely occupy the wall surface and form several thin gas layers. As the result of CO2′s strong dissolving capacity, the free hexanes are mixed well with CO2 and no clusters are formed in the shale slit.
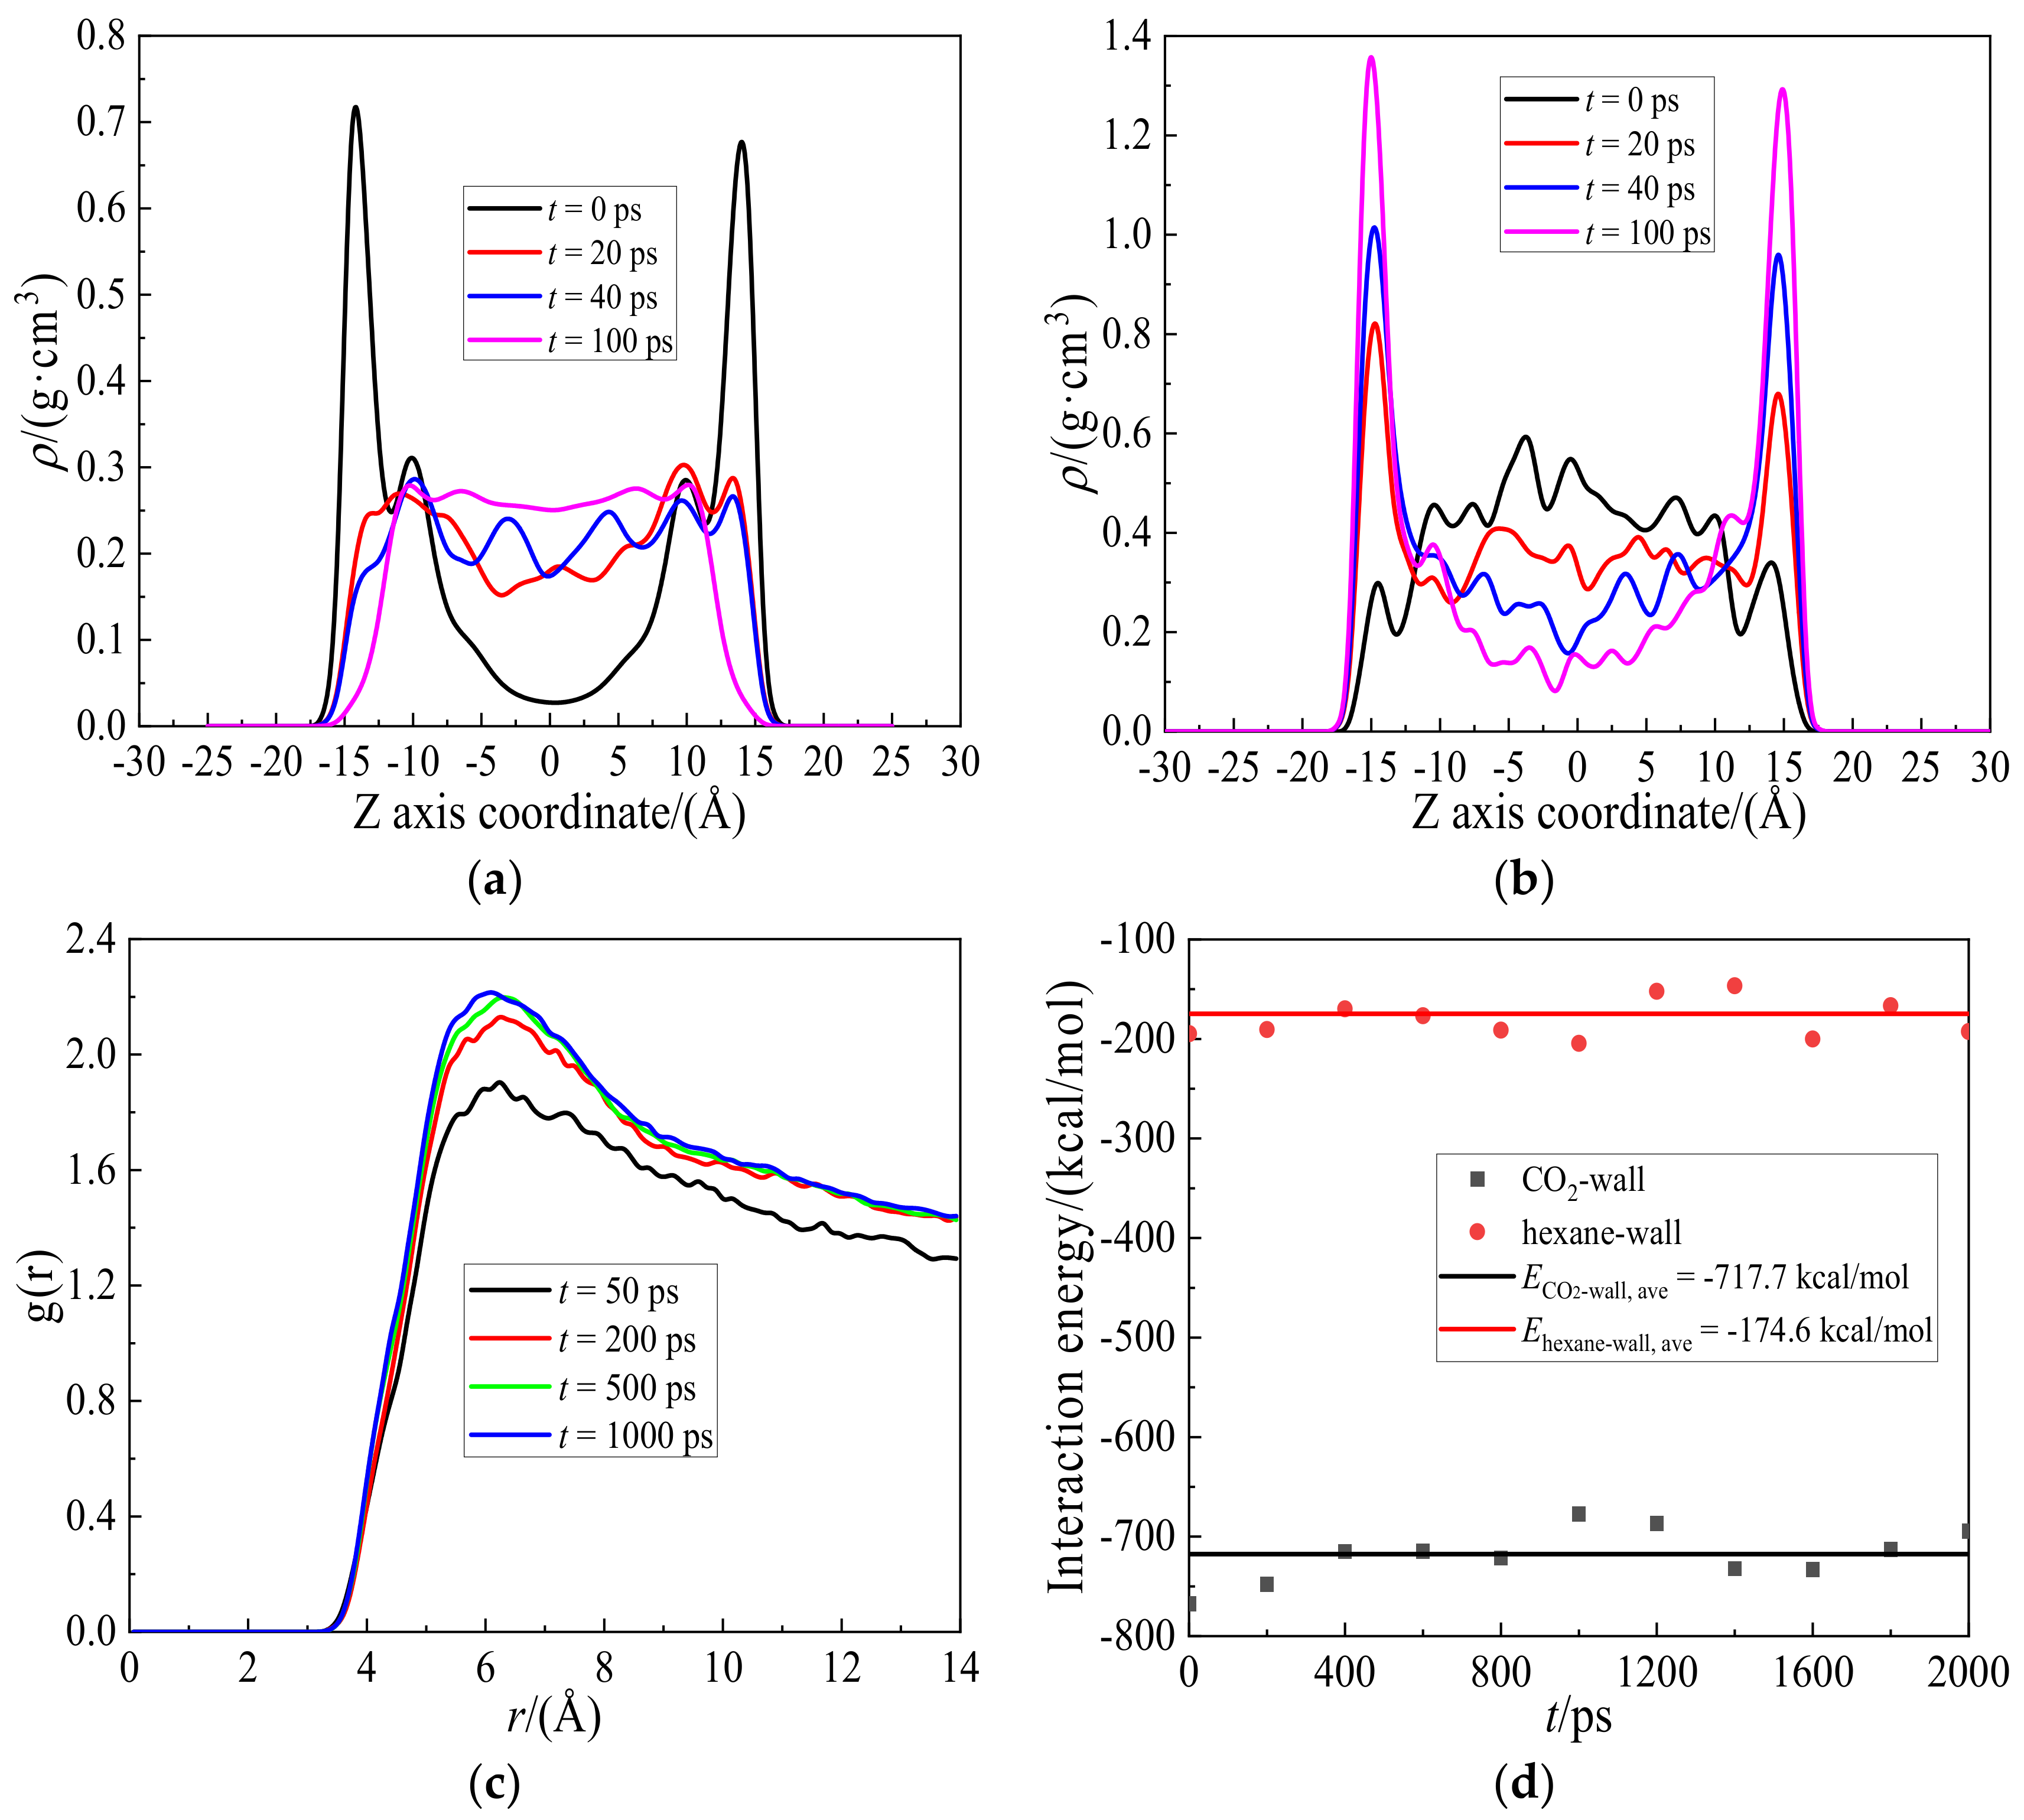
To analyze the displacing process in detail, the density distributions of hexane and CO2 along the Z direction with time were calculated and are shown in Figure 2a,b. At the initial moment (t = 0 ps), the density of hexane exhibits two symmetrical peaks about 0.73 g/cm3 near the wall. The two-layer hexanes adsorb firmly on the wall surface, and form two stable oil layers. However, the hexane density decreases to nearly 0.05 g/cm3 at the center location. This huge distribution difference gradually diminishes as simulation time reaches 100 ps. At this time, the hexane molecules distribute uniformly in the bulk region, while the density gradually decreases to near zero when approaching the wall. This can be understood that hexane molecules are displaced by CO2 thoroughly from the wall, while the density of CO2 approaches to the maximum. It can be seen from Figure 2b that the evolution of CO2 density distribution with time is opposite to that of hexane. The density variation trends of CO2 and hexane have explicitly elucidated the procedure of CO2 displacing hexane adsorbed on the shale wall, which is the same as the snapshots shown in Figure 2.
Figure 2c shows radial distribution functions, g(r), of carbon-to-carbon atoms, C-C, in CO2 molecules from 50 to 1000 ps. It can be seen from Figure 2c that the peak values of g(r) decrease with time, indicating that the distribution for CO2 at 6.2 Å becomes less tight as time evolves. As the displacing process continues, CO2 molecules distribute widely in the whole system, resulting in fewer CO2 molecules around each other. Due to strong interactions between the CO2 and SiO2-OH wall, some CO2 molecules adsorb and gradually aggregate on the wall surface, resulting in slightly denser distribution. In this study, the interaction energy between CO2 and the wall drives hexane away from the wall.
Figure 2d shows the variations of interaction energies for the hexane-wall and the CO2-wall with time from the initial moment to 2000 ps. The interaction energies of the hexane-wall and CO2-wall, Ehexane-wall and E-wall, are stabilized at −174.6 and −717.7 kcal/mol respectively and kept almost constant in the simulation process. The stronger interactions of the CO2-wall in comparison with the hexane-wall’s render CO2 preferentially occupy hexane’s locations on the wall surface and displace hexane from it. Plenty of hexanes are driven to fall into the shale slit and mix with CO2 molecules. Therefore, the whole displacing process is completed.
2.2. Effect of CO2 Injection Pressure on Hexane Displacement
Figure 3 shows variations of snapshots of CO2 displacing hexane from the SiO2-OH wall at the equilibrium state with injection pressures from 6.0 to 12.0 MPa. As shown in Figure 3, the amount of CO2 adsorbed on the wall increases with pressures from 6.0 to 9.0 MPa, and keeps almost constant at pressures higher than 9.0 MPa. The increasing and then nearly constant trends show unsaturated and saturated adsorption states for CO2 on the wall, resulting in the increasing and constant thickness of the adsorption layer respectively. The limited adsorption capacity of the SiO2-OH wall cannot hold more CO2 molecules after saturated adsorption, allowing some desorbed ones to diffuse in the shale slit, thereby destroying the cluster structure that may have formed previously.
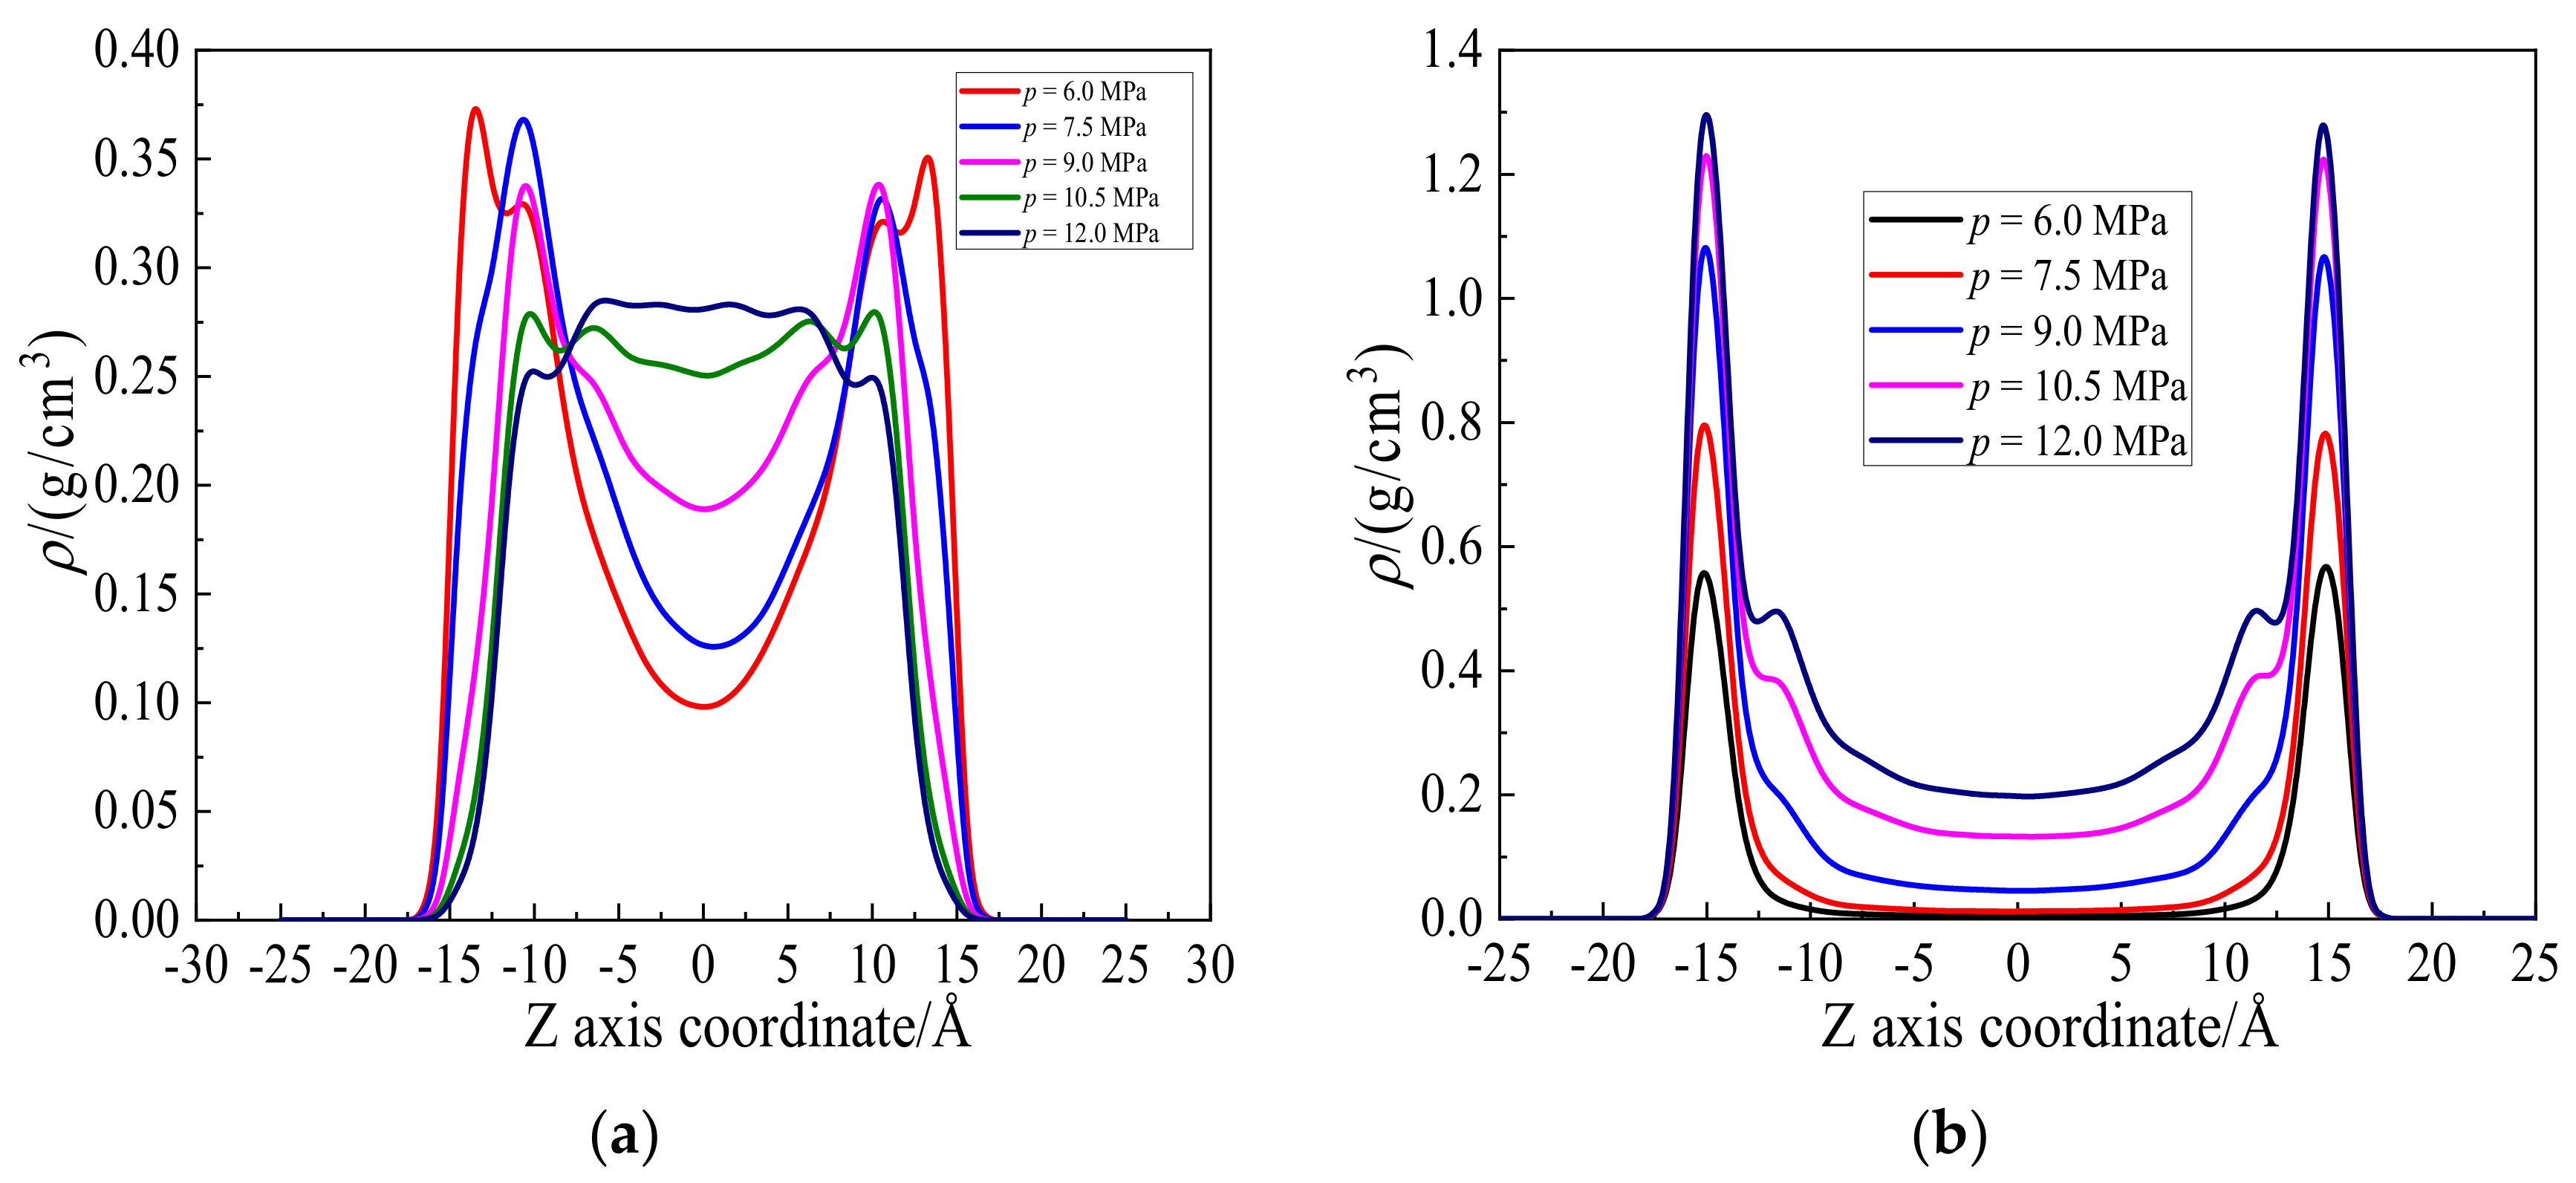
Figure 4 shows the density distributions of hexane and CO2 along the Z axis direction at pressures from 6.0 to 12.0 MPa. The density of hexane near the wall and in the shale slit gradually decreases and increases as pressure increases from 6.0 to 12.0 MPa, respectively. The uniform density distribution along Z direction of hexane is opposite to CO2′s at higher pressure in Figure 4b, as revealed in the previous section. At low pressure, there are still some hexanes remaining on the unsaturated wall surface. As pressure increases, more CO2 molecules adsorb on the wall and displace the rest of the hexanes from the wall. The hexanes are pushed into the shale slit, while the CO2 molecules are aggregated on the wall. Therefore, the densities of hexanes and CO2 molecules exhibit opposite trends, in agreement with the snapshots in Figure 3.
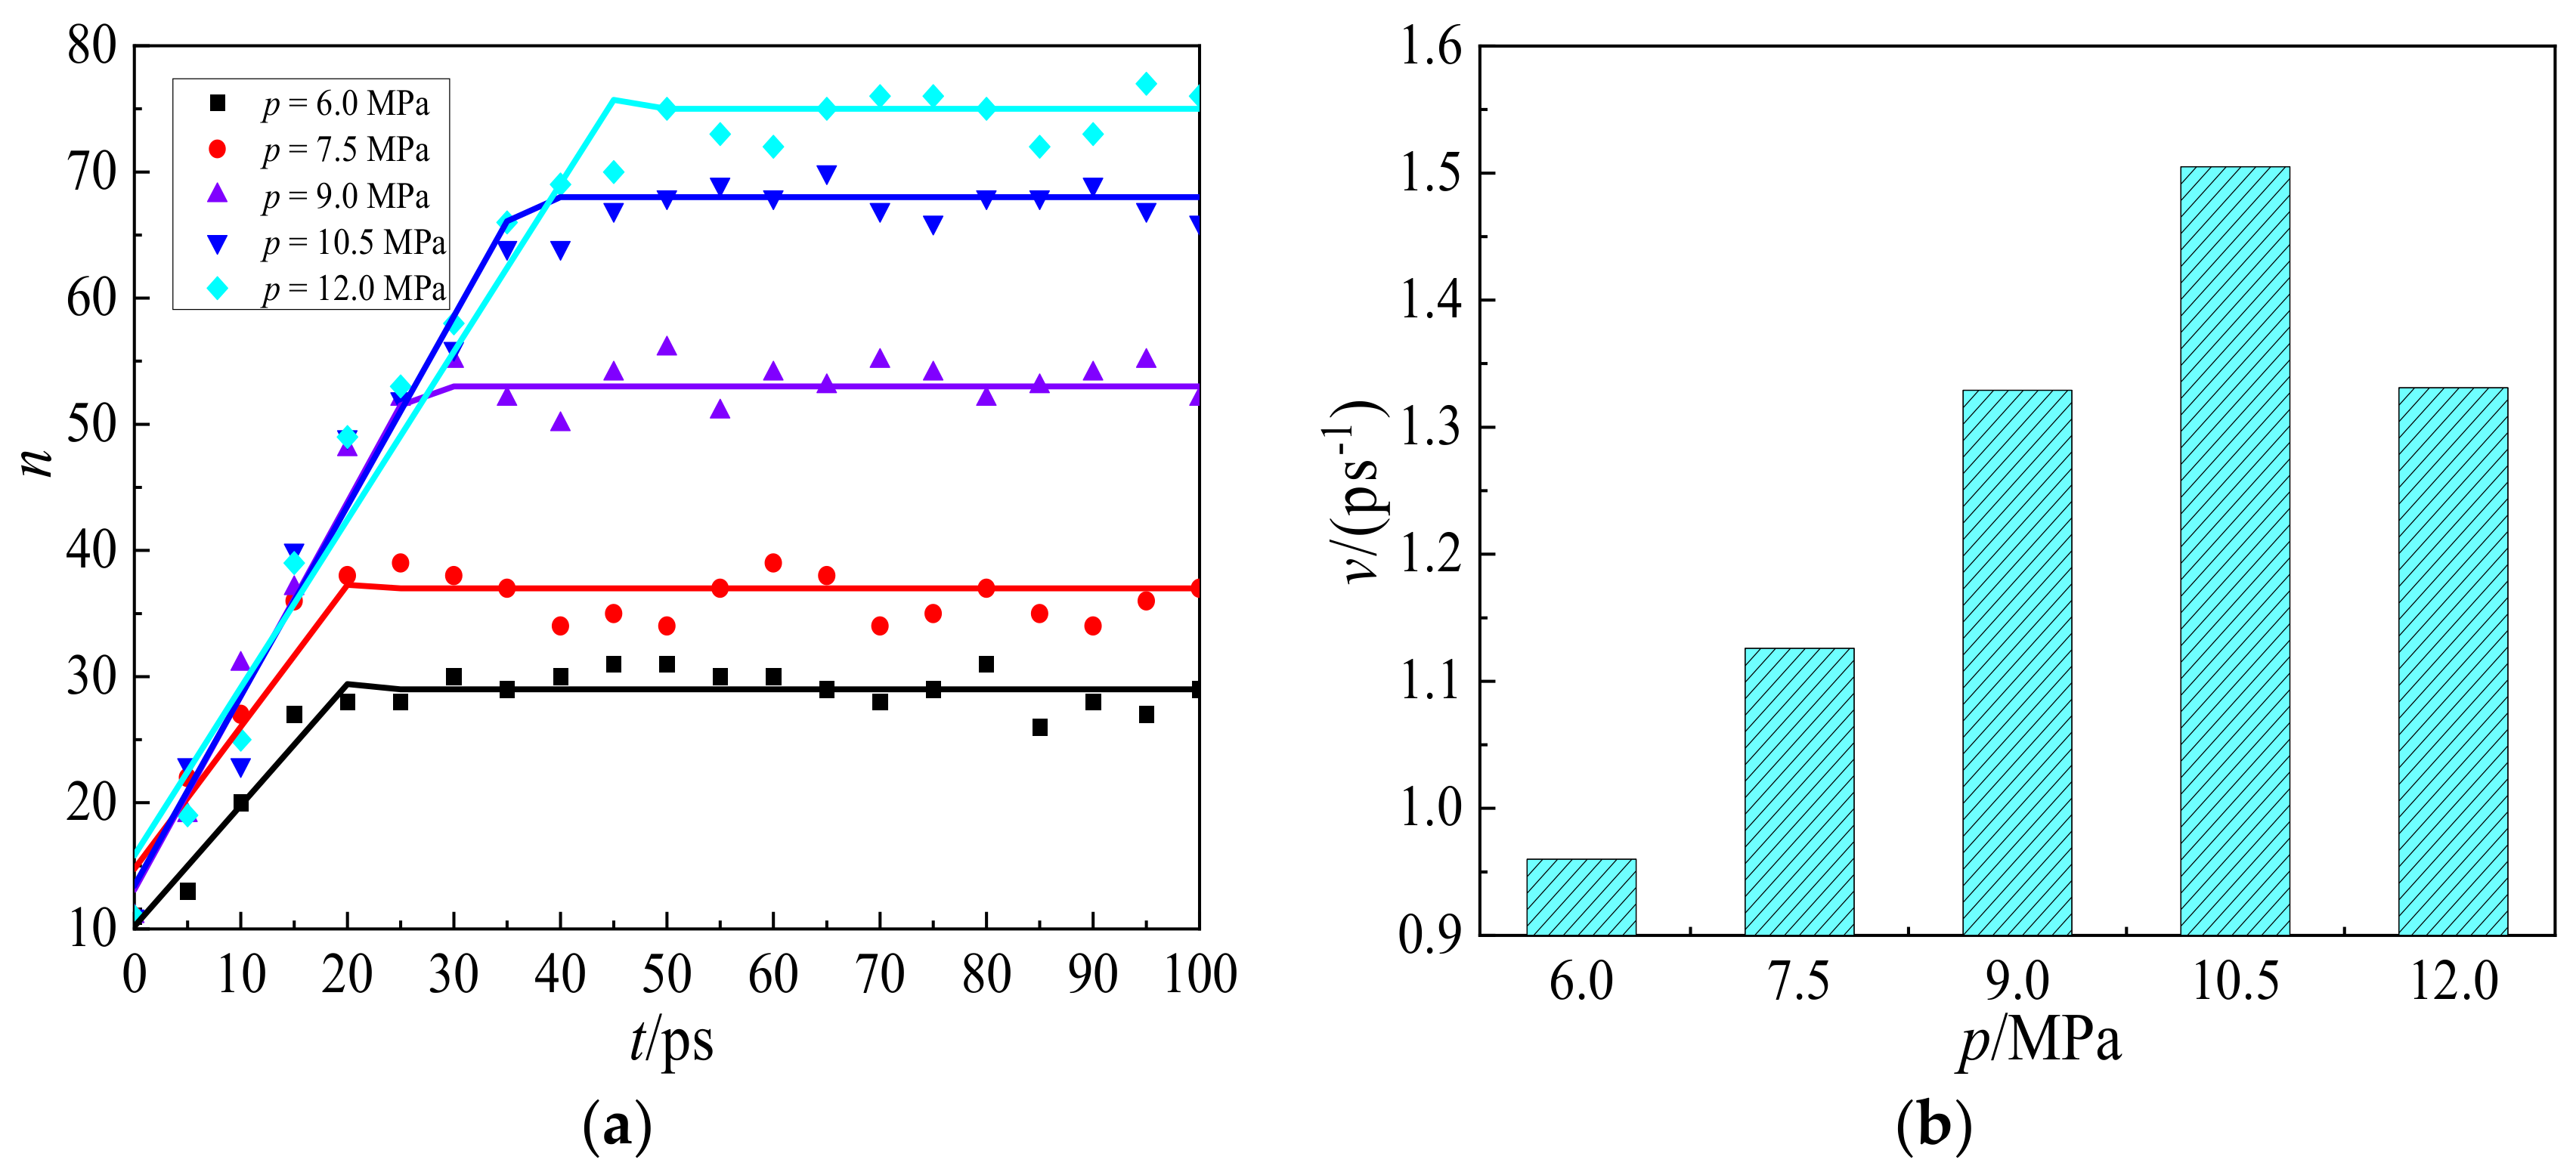
To quantificationally analyze the displacement performance, Figure 5 illustrates the time evolution of the number of hexanes being displaced from the wall by CO2 injections with different pressures. It can be seen from Figure 5a that the number of hexanes departing from the wall, n, increases linearly with time, t, and remains almost constant after a certain time frame. By linearly fitting the displacing number, n, with time t, n~t, in the linear area the displacing velocity, v, was obtained and shown in Figure 5b. The displacing velocity increases from 0.96 to 1.51 ps−1, when CO2 injection pressure increases from 6.0 to 10.5 MPa, and then decreases to 1.33 ps−1 at 12.0 MPa. As pressure increases from 6.0 to 10.5 MPa, CO2 molecules displace hexane from the wall more rapidly due to enhanced adsorption. However, the hindrance effect is enhanced as pressure increases to 12.0 MPa. Some unabsorbed CO2 molecules in the shale slit can be a hindrance to hexane diffusion, which could slow down the displacing velocity of hexane. Therefore, the optimal pressure in the displacing velocity is 10.5 MPa.
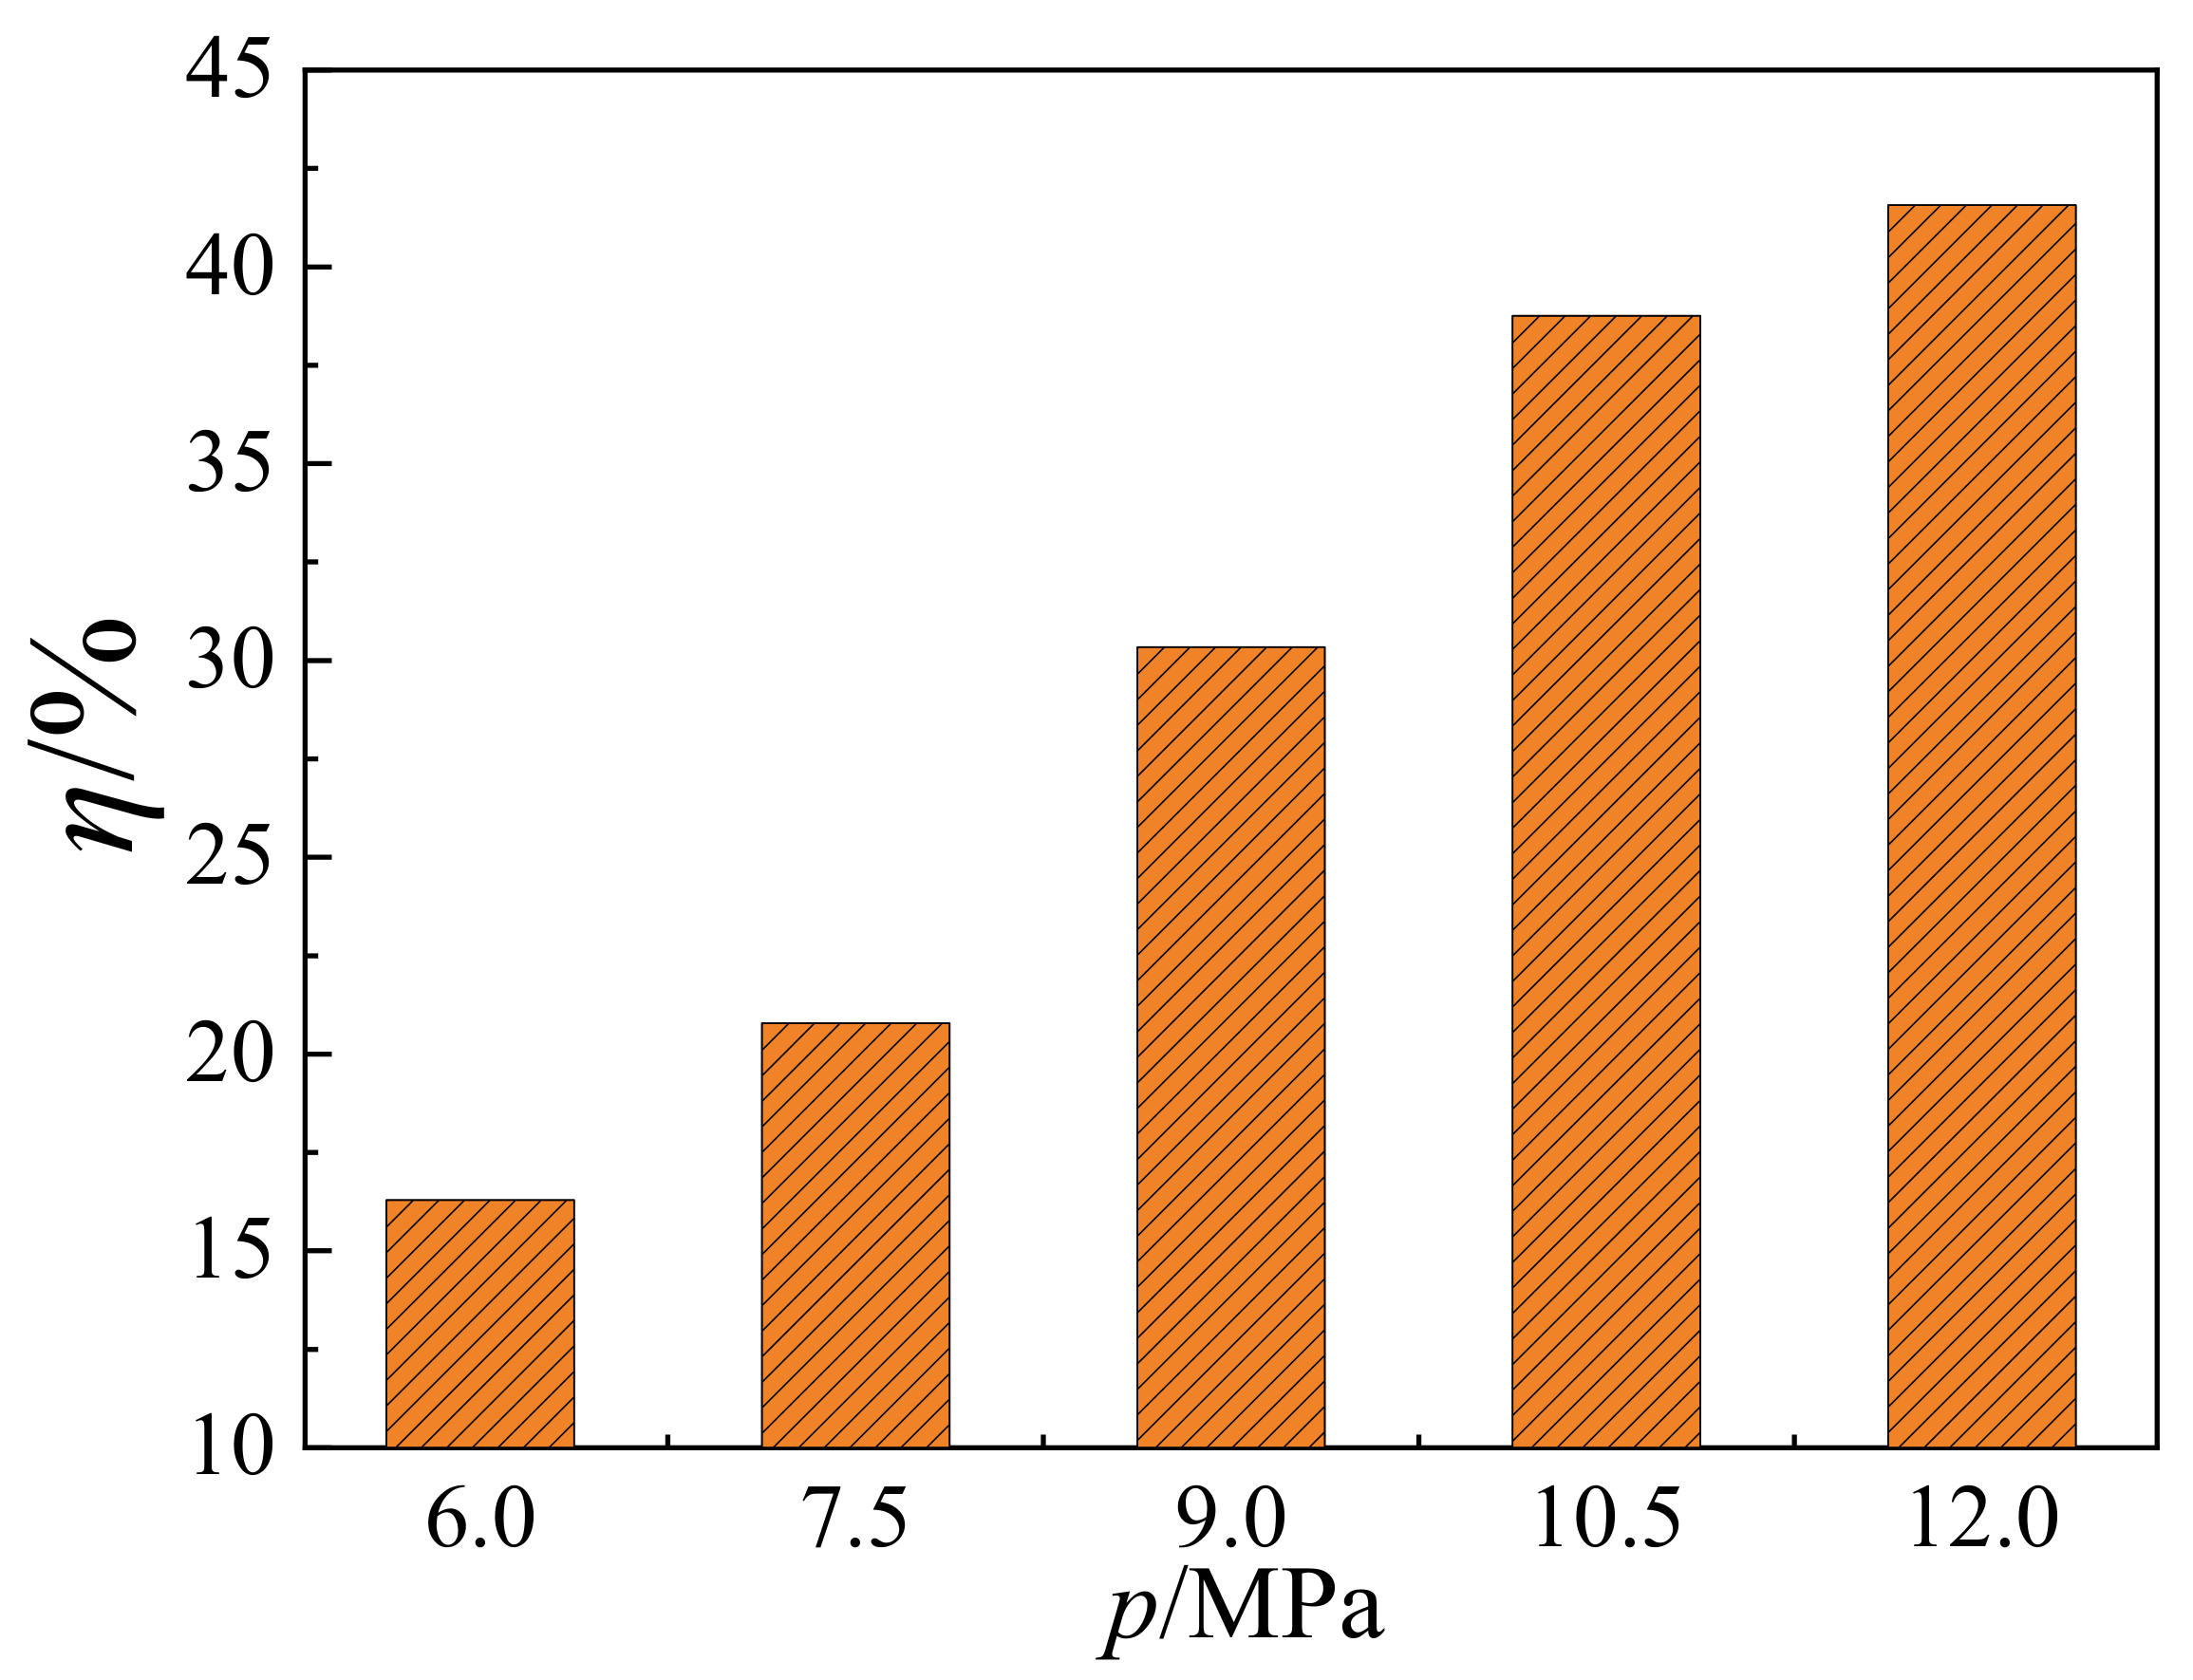
The displacing velocity, v, cannot directly tell the recovering efficiency under the practical conditions, which is essential to unconventional shale oil production industry. To address this problem, the displacing efficiency, η, is accordingly proposed and defined as,
where, n and N represent the number of hexanes displacing from the wall and the total number of hexanes in the system, respectively. According to Figure 5a, the number of hexanes displacing from the wall, n, keeps almost constant at equilibrium after 50 ps. In that case, the number, n, was counted and averaged. As shown in Figure 6, the displacing efficiency of hexane, η, increases from 16.3% to 42.1%, when the injection pressure increases from 6.0 to 12.0 MPa. At lower pressure, the adsorption of CO2 in the shale slit pore is still far away from saturation. As the pressure increases further, additional CO2 molecules adsorb on the wall surface and displace the hexane from the wall surface for the enhanced adsorption affinity of CO2. Nevertheless, such an increasing trend of displacing efficiency slows down at higher pressure due to the steric hindrance effect in the shale slit. As shown in Figure 3 and Figure 4b, the shale slit is full of CO2 and hexane molecules, rendering it more difficult to further conduct the displacing process. Taking both displacing velocity and efficiency into consideration, the optimal injection pressure is 10.5 MPa.
2.3. Mechanisms of CO2 Injection Pressure on the Hexane Displacing Process
To reveal the underlying mechanisms of the displacing process, NEMD simulations were further conducted to analyze the binary mixture diffusion. The force, Γex, exerting on the molecules to drive the fluid flow can be expressed as,
where, kB, T, f1, f2, and Lx are Boltzmann constant, temperature, inlet fugacity, outlet fugacity, and length of the simulation box, respectively. According to the relationship between the external force and net flux, the Onsager coefficient, Lij, can be obtained and expressed as,
here, ji, Lii, and Lij are net flux of component i, Onsager coefficients of diagonal and off diagonal respectively. The net flux, j, can also be computed by equation, ji = ρi·vcom, i. Here, ρi and vcom, i are density and streaming velocity of component i, respectively. Γex is the external force exerting on the component i, and expressed as, . The hexane and CO2 are marked as components 1 and 2 respectively in this study. We note that by only applying external force to single component i (i.e., Γex,i > 0, Γex,j = 0), the net fluxes can be obtained according to equation, ji = ρi·vcom, i. Accordingly, the Onsager coefficients L11 and L22 for hexane and CO2, can be extracted by L11 = j1/Γex1 and L22 = j2/Γex2, respectively. Meanwhile, the diagonal Onsager coefficients L12 and L21 are calculated as, L12 = j1/Γex2 and L21 = j2/Γex1, respectively.
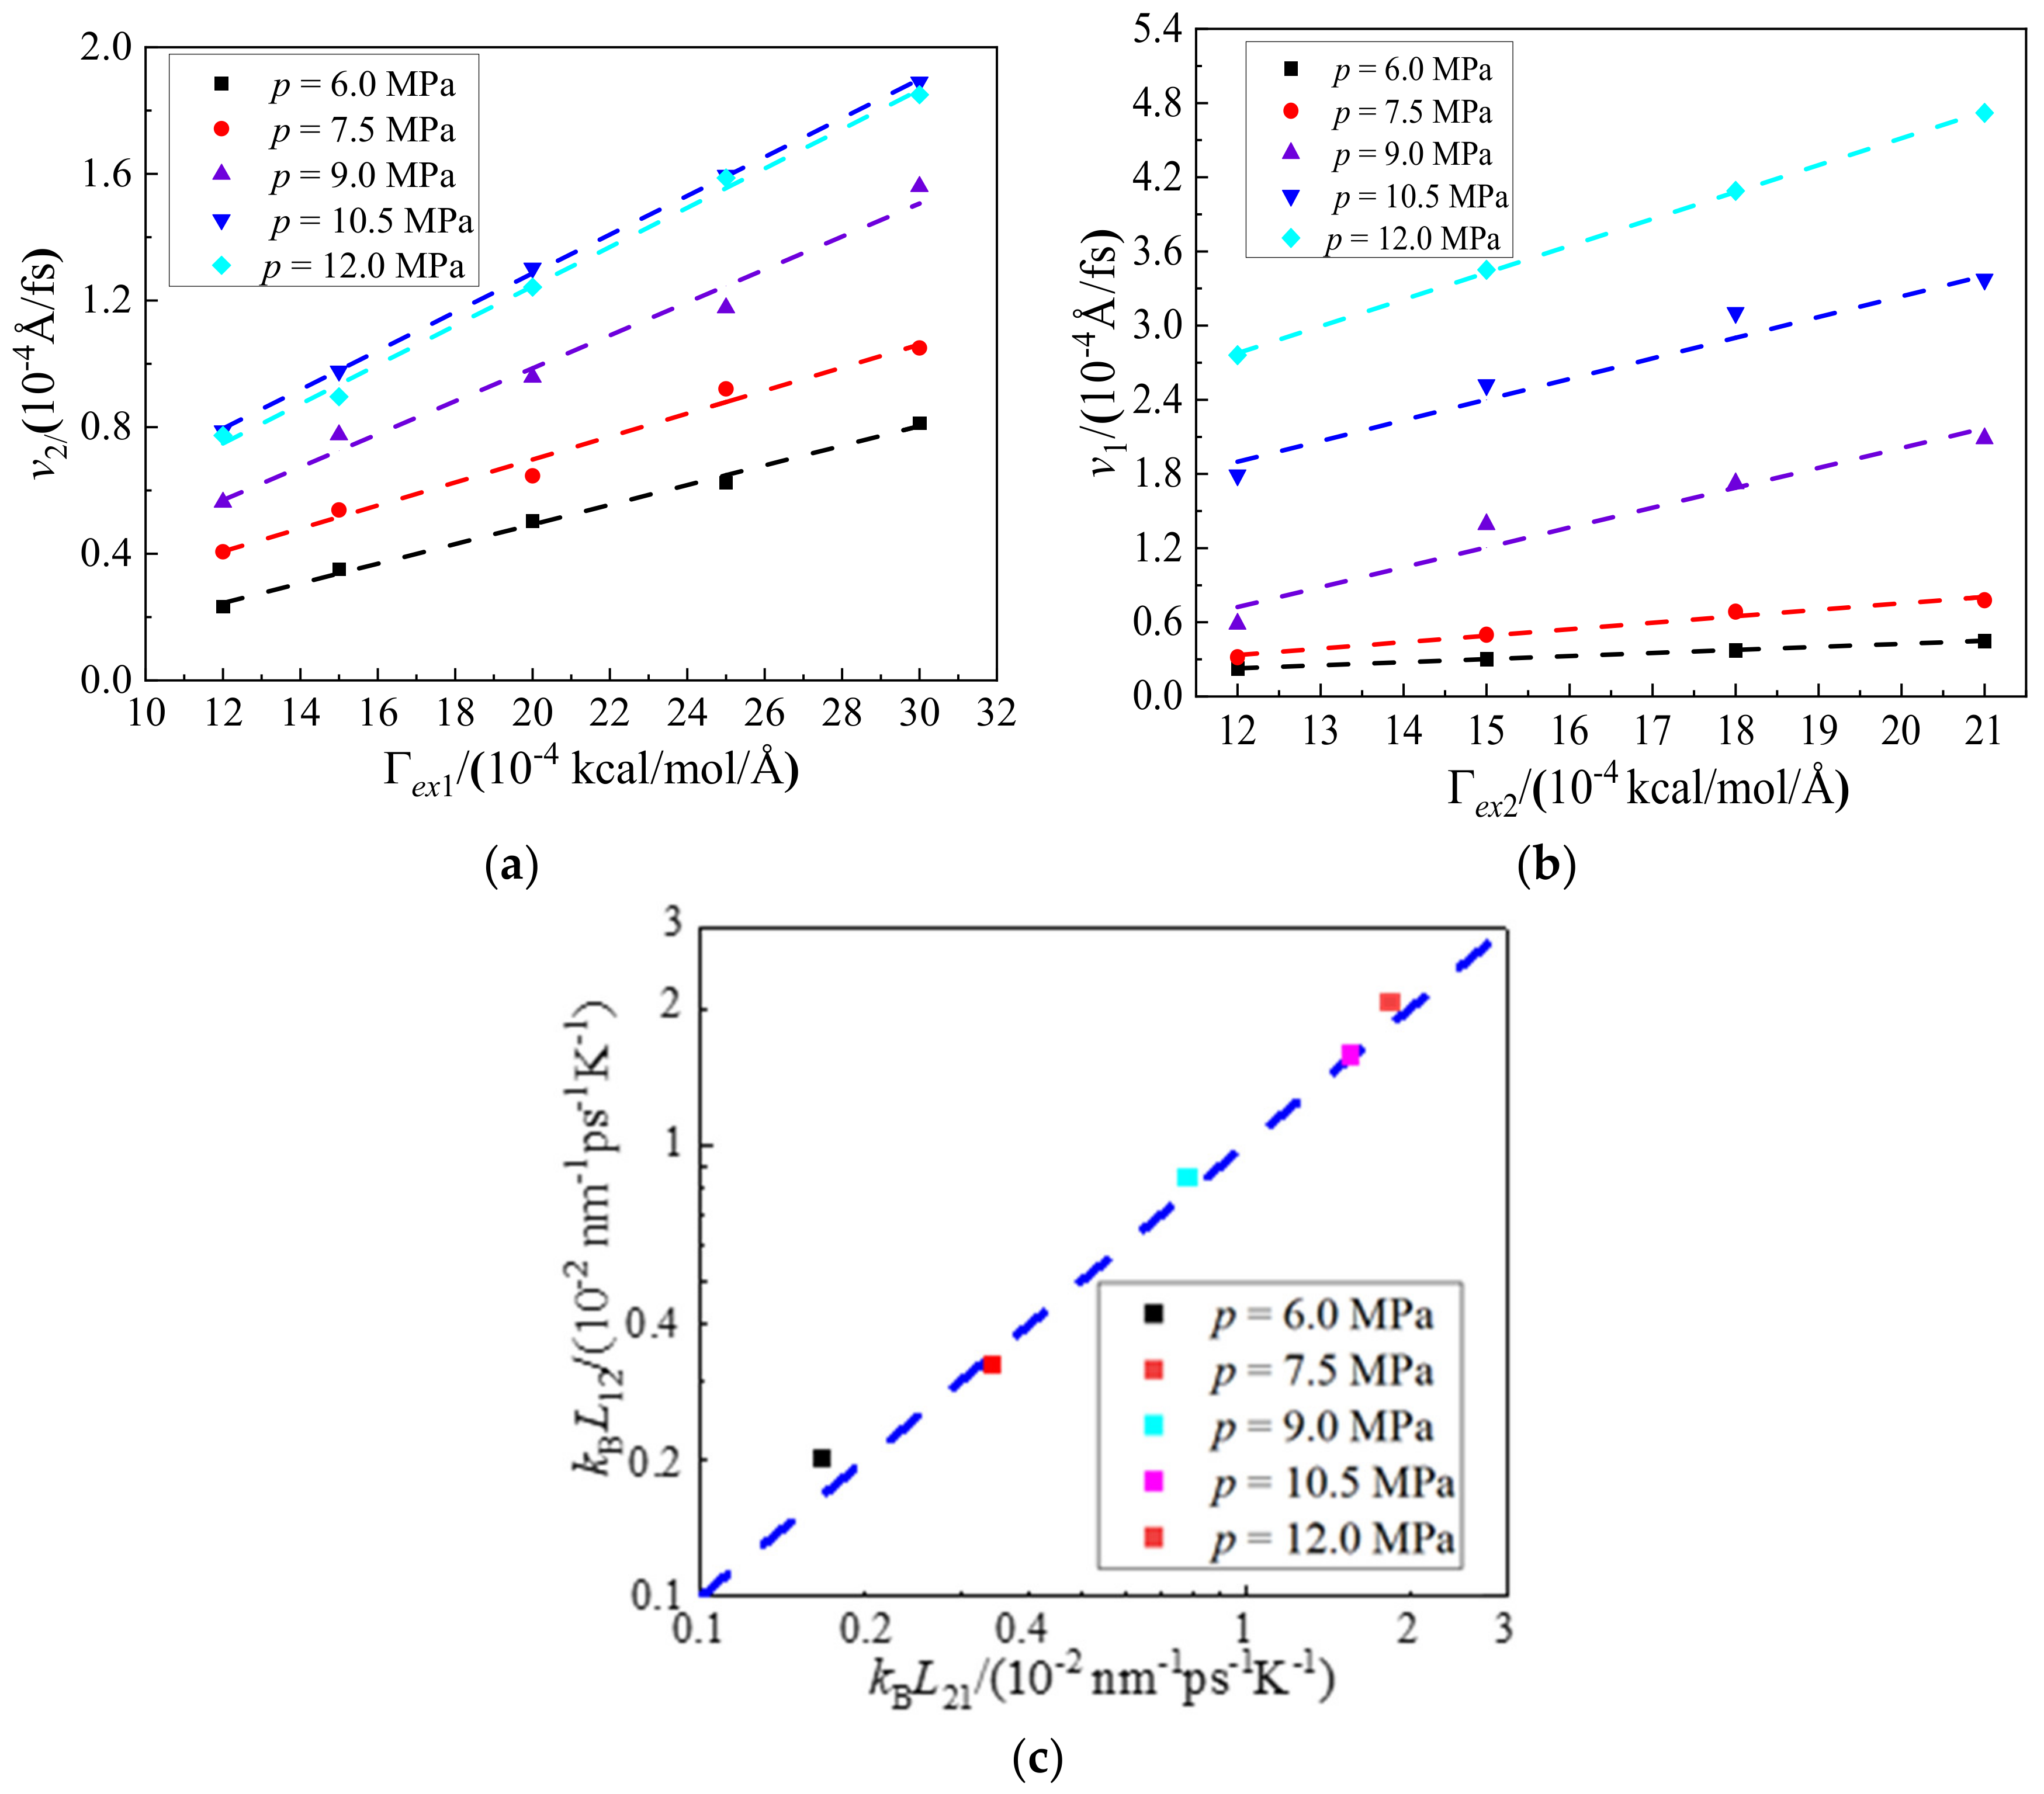
As depicted in Figure 7a,b, the driven streaming velocities of hexane and CO2 exhibit good linear relationships with external forces. This further reveals that the diagonal Onsager coefficients are independent with external force. Figure 7c shows variations of diagonal Onsager coefficients with pressures from 6.0 to 12.0 MPa. It can be seen from Figure 7c that the diagonal Onsager coefficients, L12 and L21, exhibit good agreements with each other, and satisfy well with Onsager reciprocal relation. It can be inferred from this result that the mutual diffusion plays an essential role in the displacing process and will be revealed in detail in the following parts.
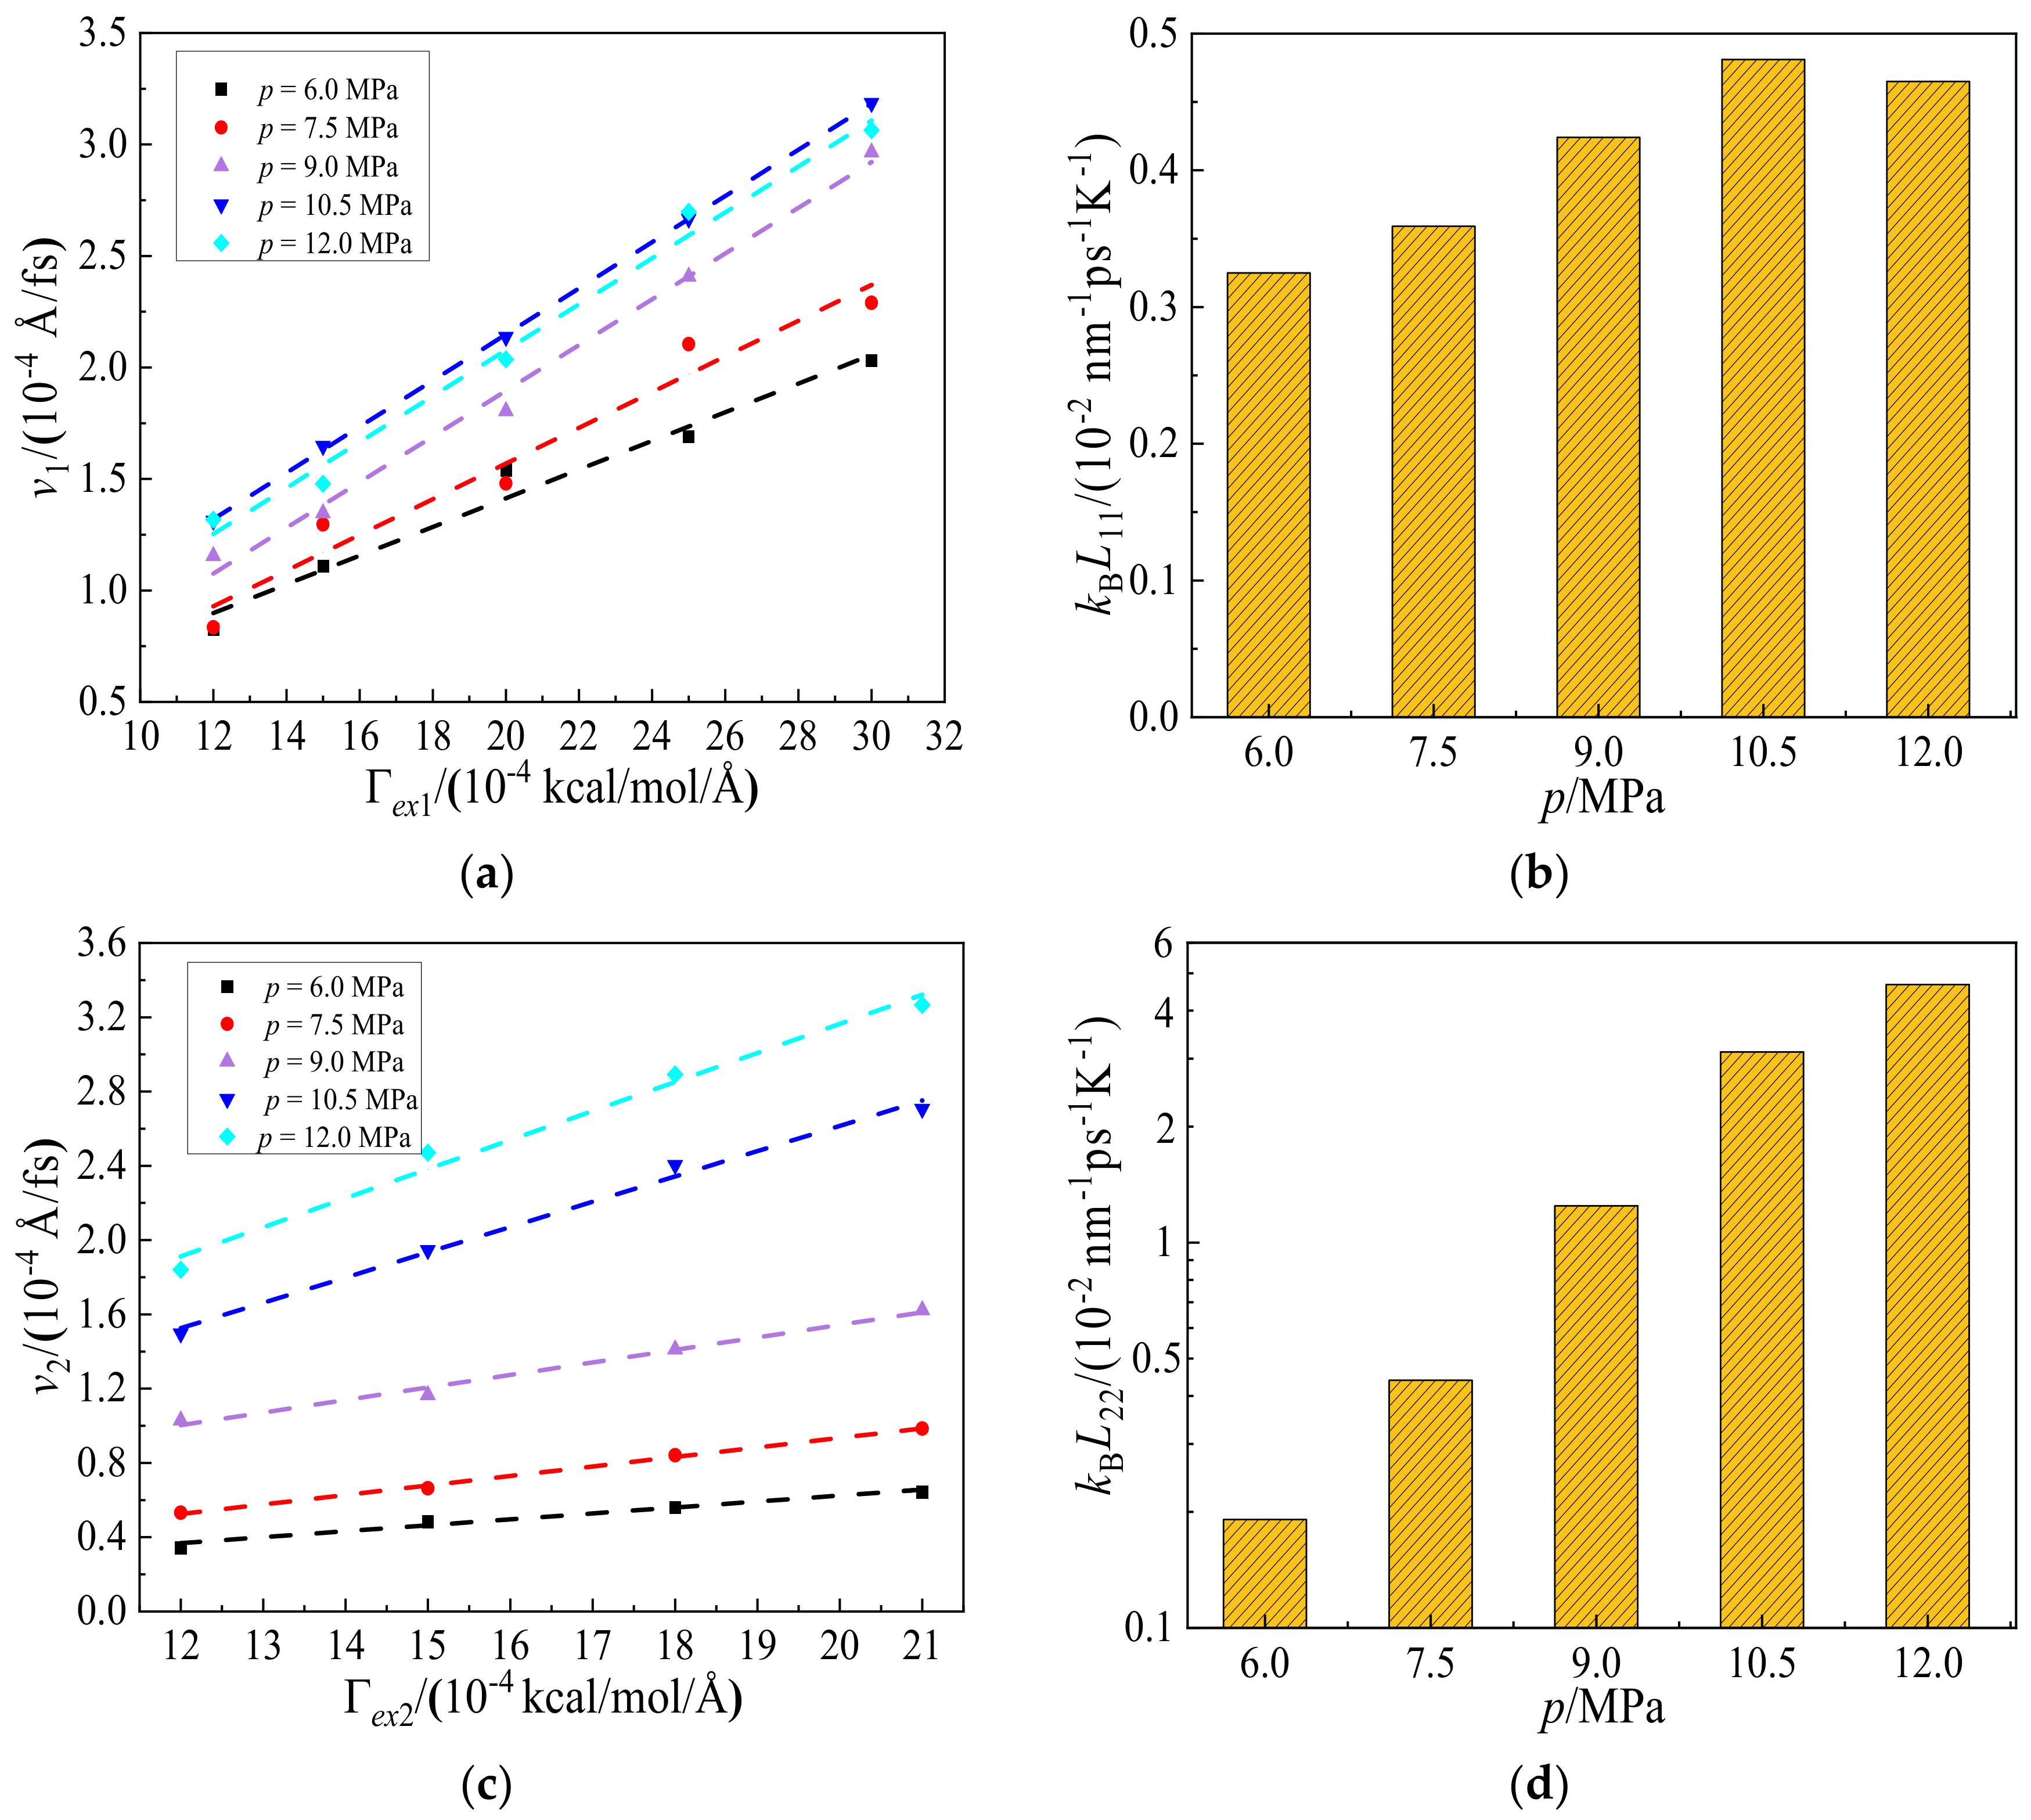
The velocities, v, and Onsager coefficients, Lii, for hexane and CO2, at pressures from 6.0 to 12.0 MPa are shown in Figure 8. It can be seen from Figure 8a that the velocity of hexane increases linearly with force. We can further see that the Onsager coefficients of hexane increase from 0.325 × 10⁻² to 0.481 × 10⁻² nm−1ps−1K−1, when the pressure of CO2 increases from 6.0 to 10.5 MPa. Nevertheless, the Onsager coefficient of hexane decreases after that and slightly reduces to 0.465 × 10⁻² nm−1ps−1K−1 at the pressure of CO2 being 12.0 MPa. It should be pointed out that the injected sCO2 not only displaces the oil from the shale wall, evident from Figure 8, but also generally enhances the diffusion rate of oil (hexane). That is to say, the presence of sCO2 will render it easier for oil to leave out the shale channel. In combining these two effects, one can expect that the sCO2 displacing oil method will achieve high recovery efficiency while reducing the oil exploiting time.
Meanwhile, it can be seen from Figure 8d that the Onsager coefficient of CO2 increases rapidly with pressure. At lower pressures (6.0 and 7.0 MPa), CO2 molecules diffuse slowly due to a larger number of them adsorbing on the wall surface. With increasing pressure to 9.0 and 10.5 MPa, the diffusion of CO2 molecules accelerates sharply. At 12.0 MPa, the Onsager coefficient of CO2 is 4.68 nm−1ps−1K−1, which is over an order of magnitude higher than that of hexane, 0.465 nm−1ps−1K−1. However, the highest pressure corresponding to the highest diffusion for CO2 molecules reduces hexane diffusion, which can reduce shale oil recovery efficiency. In consideration of the displacing velocity, the optimal injection pressure is 10.5 MPa.
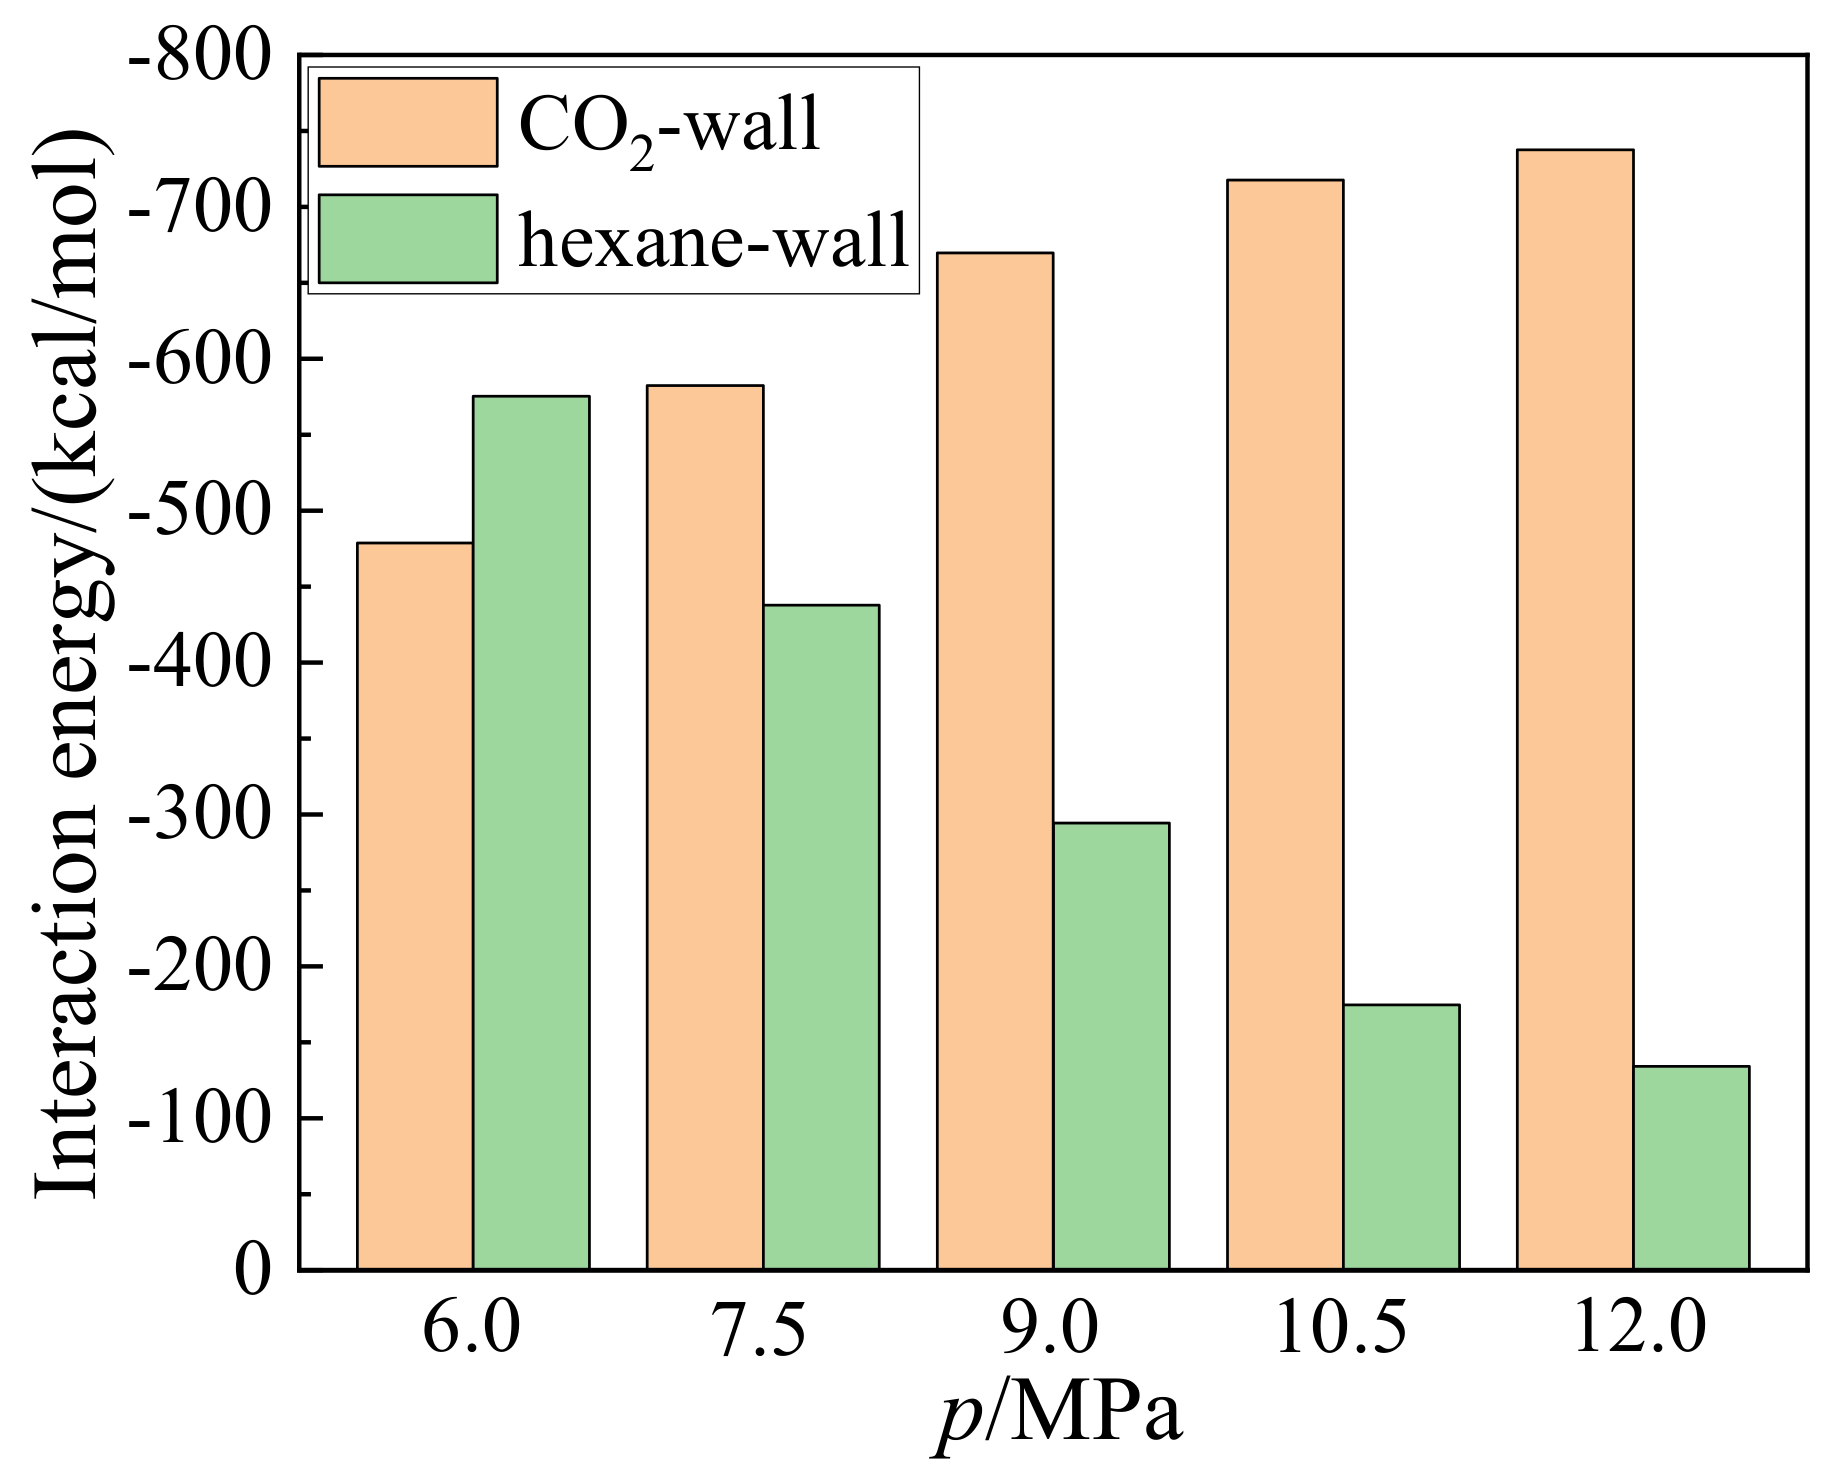
Figure 9 shows the interaction energies of the hexane-wall and CO2-wall with pressures from 6.0 to 12.0 MPa. It can be seen from Figure 9 that the interaction energies for the hexane-wall and the CO2-wall decrease and increase with pressure in the range studied. For instance, the interaction energies for the CO2-wall increase from −478.8 to −737.6 kcal/mol, while that for the hexane-wall decrease from −575.3 to −134.2 kcal/mol, when the pressure increases from 6.0 to 12.0 MPa. At higher pressure, CO2 molecules distribute more densely near the wall, leading to stronger CO2-wall interaction energies, which is similar to the results given in previous studies [26,27]. The dominant interaction energies shift from hexane-wall to CO2-wall at 7.5 MPa, which shows that CO2 molecules are more inclined to adsorb on the wall surface and displace hexane from the surface. It can be understood that the further distance between the hexane and the wall weakens the interactions between them according to Equation (2). On the other hand, the stronger CO2-wall interactions drive more hexane molecules away from the wall, resulting in most hexane distributing in the bulk region, which is in agreement with the results in the previous part.
3. Materials and Methods
3.1. Model and Configurations
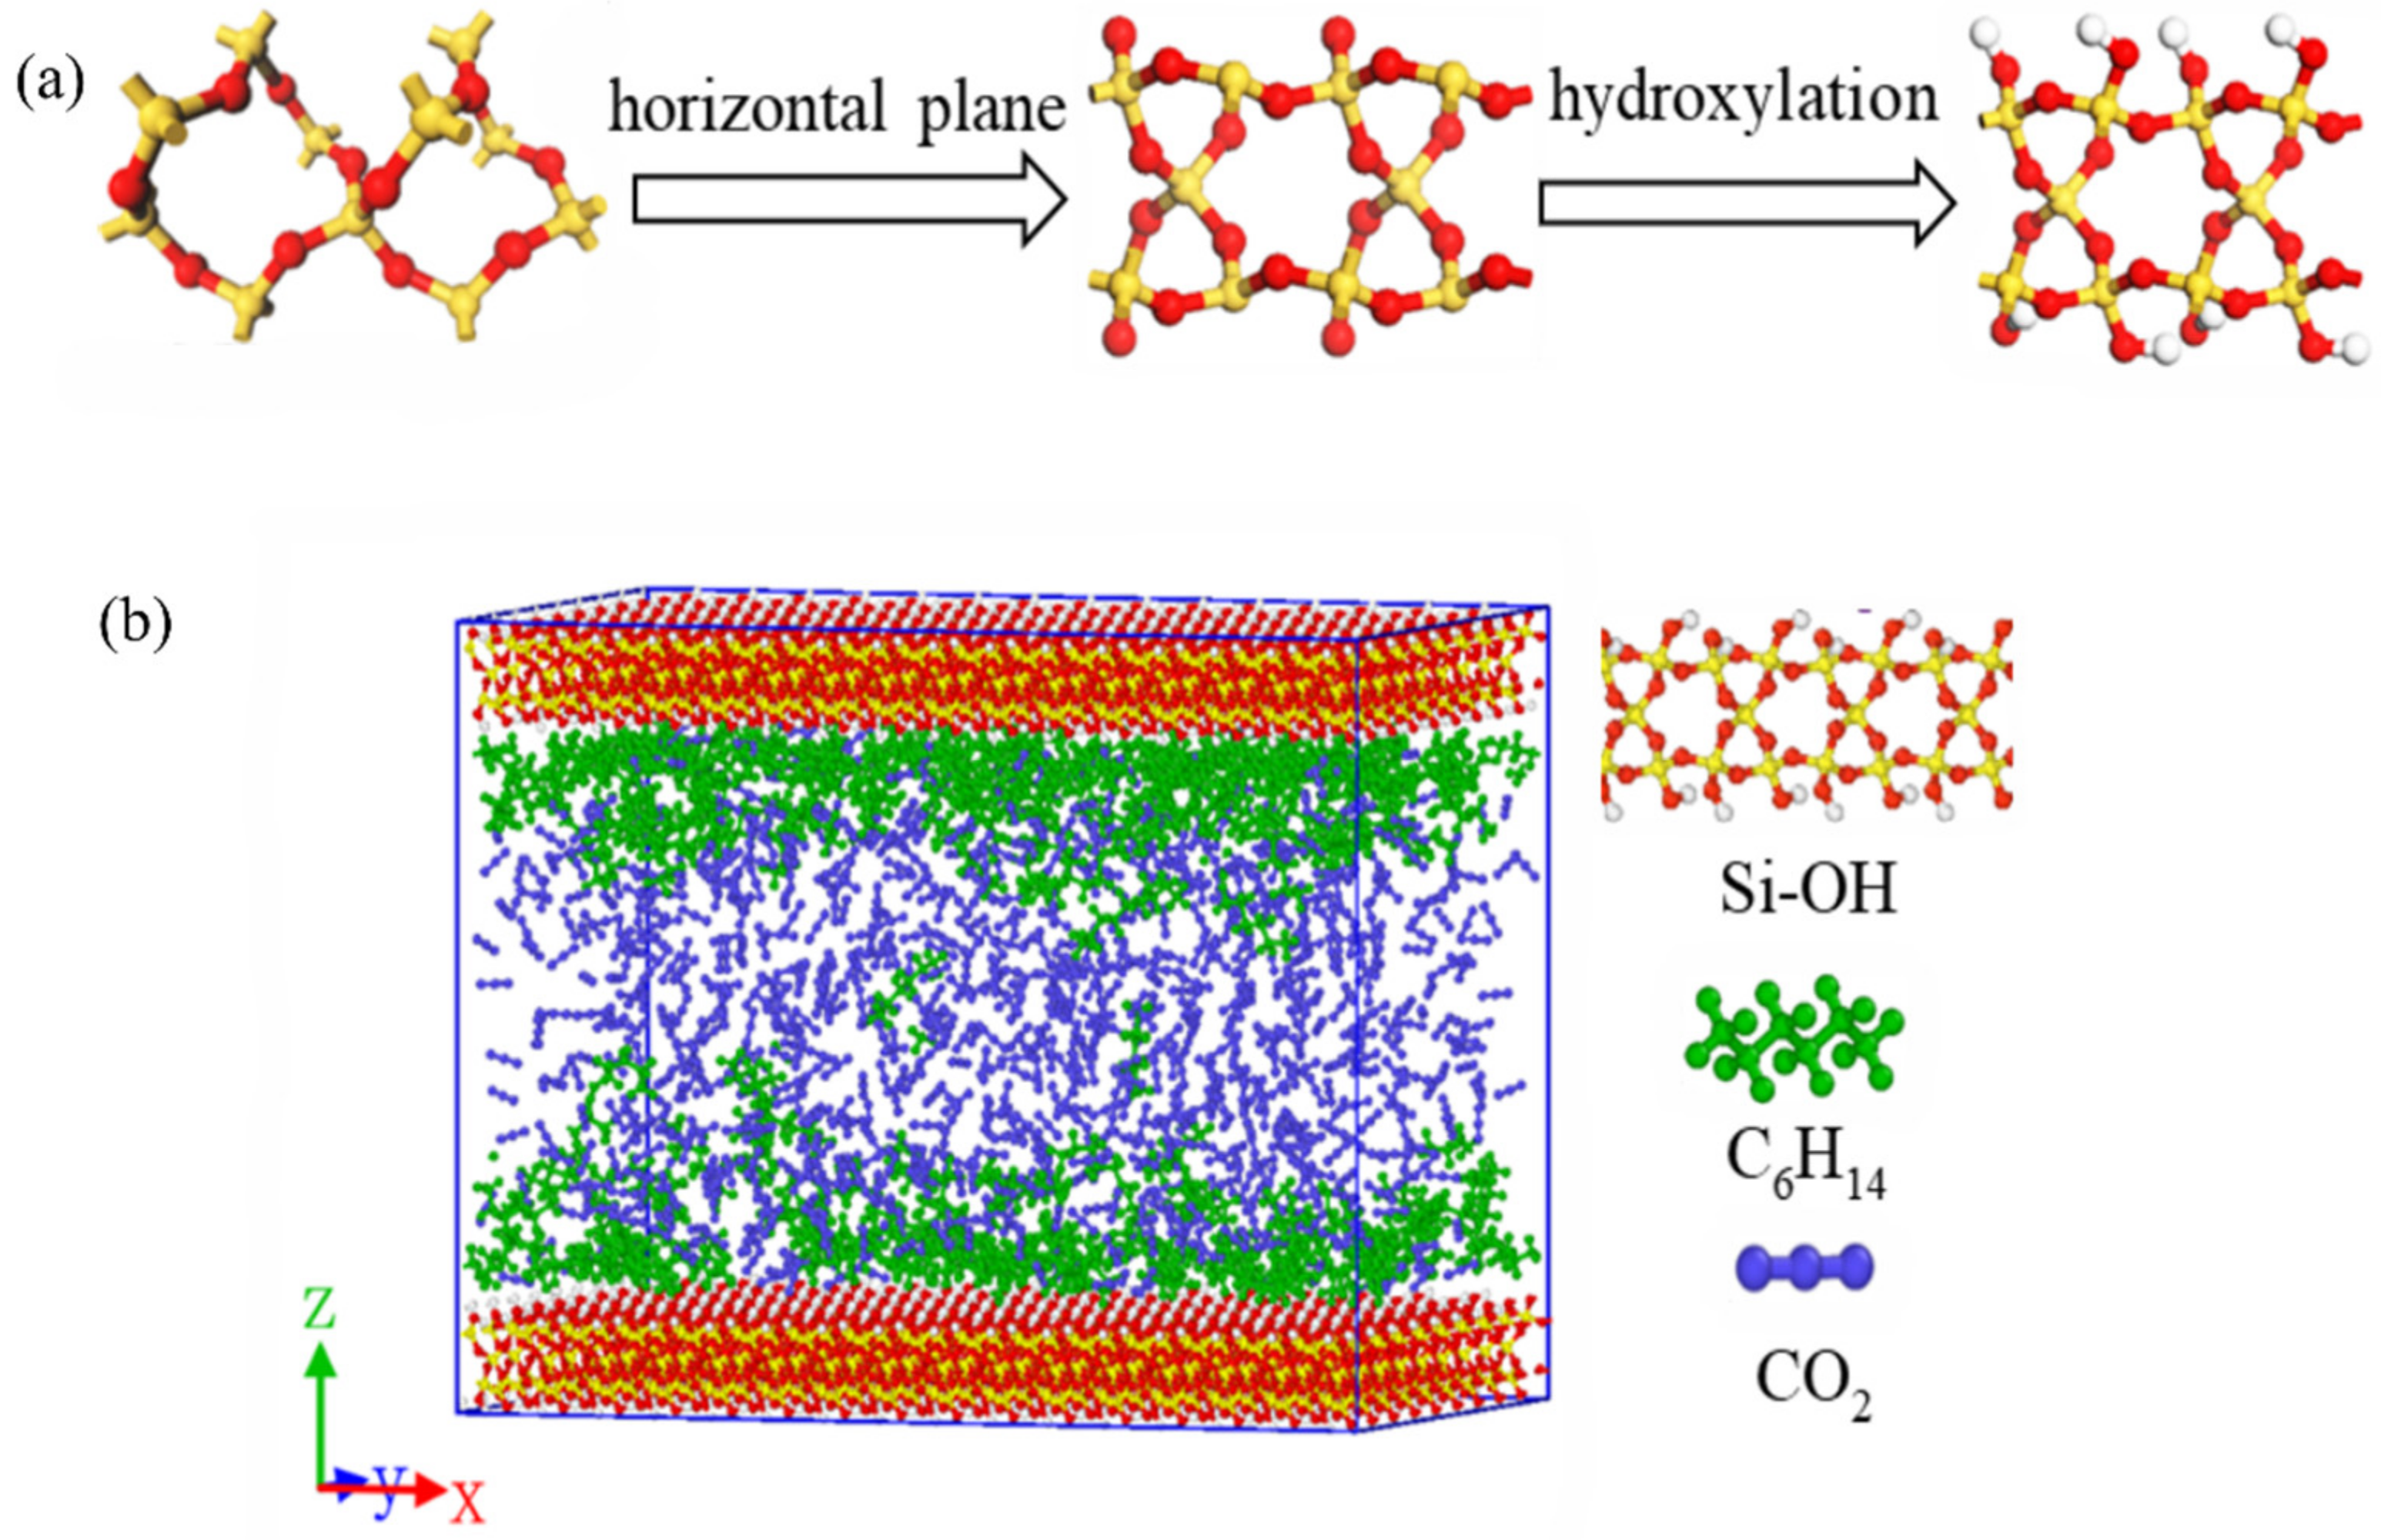
The simulation setup is comprised of three sections, including two hydroxylated silica crystal (SiO2-OH) walls located at the upper and lower edges of the box, creating a channel with the flowing direction being the x axis, as shown in Figure 10b. The chemical structure of the shale wall, SiO2-OH, is illustrated in in Figure 10a. The dimensions of the simulation box, Lx × Ly × Lz, are set as 78.56 × 48.62 × 50 Å3. There are full of chain alkane such as hexane, n-decane, and tetradecane in nano scale shale. Among these alkanes, hexane accounts for a large percentage and has many typical properties. In addition, hexane can well reflect the performances of shale oil in the nanochannel and can work as a representative in extensive studies [18,23,28]. Therefore, hexane was the adopted and represented oil in this study. A snapshot of the integrated simulation system is depicted in Figure 10b.
The simulations were performed as follows. Firstly, the process of CO2 displacing hexane was conducted. In that case, the movement and density distribution of CO2 and hexane were discussed. Secondly, the effects of injection pressures of CO2, which range from 6.0 to 12.0 MPa with 1.5 MPa intervals, on the displacing process were investigated to figure out the optimal pressure, evaluated by displacing velocity and efficiency. Finally, the corresponding underlying mechanisms of the displacing process were further explored.
3.2. Force Fields of Adsorbent and Adsorbates
Adsorbate-adsorbate, adsorbent-adsorbate interactions were both explicitly considered in our simulations. Initially, hexane molecules were described by OPLS-AA force fields [29], which are comprised of bond contraction energy, Ebonds, angular bending energy, Eangle, dihedral angle torsion energy, Etorsions, van der Waals interaction energy, EvdW, and electrostatic interaction energy, Eele, expressed as,
The detailed parameters of the OPLS-AA model for hexane are shown in Table 1, Table 2, Table 3 and Table 4. The flexible CO2 molecule was represented by the EPM2 model [30], with detailed parameters being listed in Table 1, Table 2 and Table 4. In addition, CLAYFF force fields were adopted to describe the SiO2-OH wall [31] given in Table 1, Table 2 and Table 4. The force fields of species, including hexane, CO2 and SiO2-OH, adopted in this work have been verified to be effective in adsorption and diffusion in extensive studies [18,19,32].
In addition to the bonded interactions, the nonbonded ones, including short-range (Lennard-Jones 12–6) and long-range force fields are also summed to describe interactions among atoms, expressed as,
herein, ε and σ are potential well depth and collision distance, respectively. The LJ parameters between two unlike species were calculated from the Lorentz-Berthelot mixing laws [33], following
3.3. Simulation Configurations
The equilibrium and nonequilibrium molecular dynamics (EMD and NEMD) simulations were conducted using LAMMPS packages [34], starting with the initial configurations obtained from grand canonical Monte Carlo (GCMC) simulations that were conducted at 353.15 K throughout the simulations and targeted pressure using DL_MONTE simulation packages [35]. The NEMD simulations were performed by exerting external force on one of the two components in the presence of the sCO2 and hexane mixtures. The Nosé-Hoover thermostat was applied to maintain the temperature of the system with a damp coefficient of 100 fs. In all simulations, the cutoff radius equaling 14.0 Å was applied to truncate short-range and long-range interactions in the real space. The Ewald method with a tolerance of 1.0 × 10⁻⁴ was adopted for the long-range corrections to the coulomb interactions. The time step was set as 1.0 fs and periodic boundary conditions were applied in all three directions. The simulations were performed for 4.0 ns in the canonical ensemble with the first 2.0 ns for equilibration and the remaining 2.0 ns for statistical analysis at a frequency of 500 steps. The temperature of the system remains at 353.15 K as it is the critical temperature of sCO2. We computed the density and number of CO2 molecules in the simulation system using grand canonical Monte Carlo simulations (GCMC) at different pressures, which are listed in Table 5. In our simulations, the number of hexane molecules is 178. Indeed, the number of hexanes remains constant in this work. This is done for the two reasons: (1) In practice, the sCO2 molecules are injected into the shale oil reservoir, with the temperature and pressure of the shale oil reservoir being fixed, which leads to a fixed content of oil molecules for a given reservoir. Therefore, it is justified to investigate the efficiency of sCO2 dispatching the oil by fixed the molecule numbers adsorbed on the shale wall. (2) The second reason is for controlling the variable without neglecting the essential performance. Although the hexane density can be varied at different pressures (i.e., different depths of the reservoirs), the displacing process is basically unchanged. To elucidate the process and its underlying mechanisms more clearly, some necessary simplifications were conducted in this work. This treatment can not only reveal the main mechanisms and characteristics, but also save computation costs. Therefore, the number of hexane molecules remains constant in this work.
3.4. Verification of the Simulation
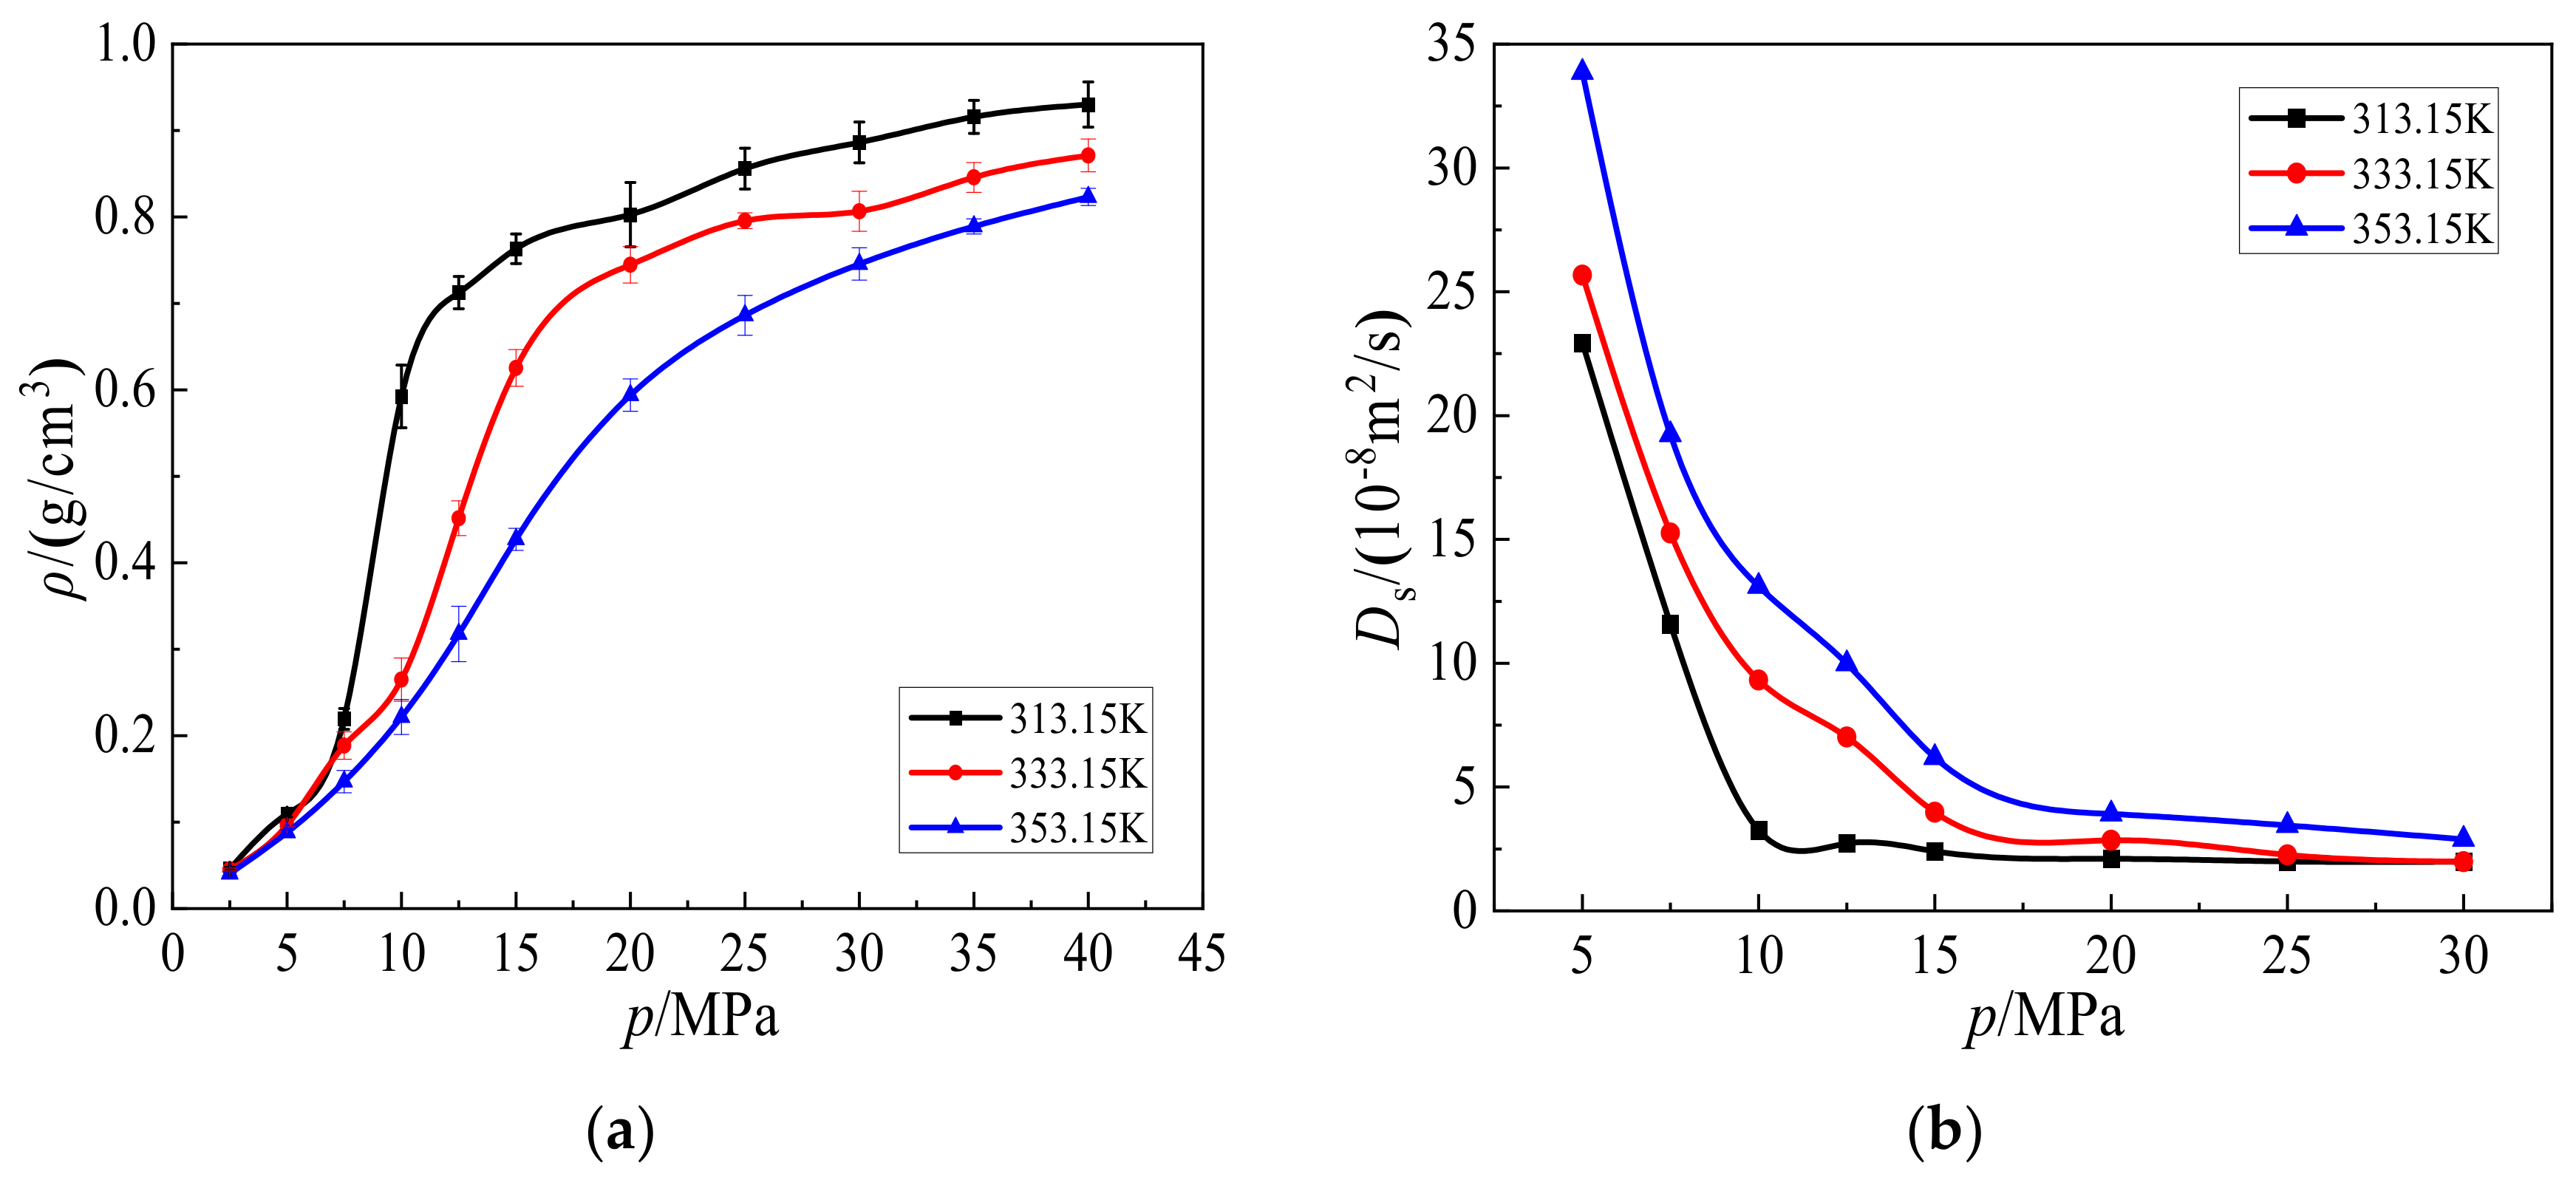
To confirm the accuracy and reliability of this work, the potentials were verified. The density and self-diffusion coefficient for CO2 represented by the EMP2 model at different temperatures and pressures were calculated and shown in Figure 11a,b, respectively. It can be seen from Figure 11a,b that the CO2 density and self-coefficient are close to the results in the database of the American National Standards Institute. Indeed, the standard error between the two is within 6.0%, matching well with each other. As shown in Figure 11b, the self-diffusion coefficients of CO2 decrease/increase with pressure/temperature in a wide range, which caters well to the trend reported in previous studies [36,37].
4. Conclusions
Molecular dynamics simulations were performed to explore process of CO2 displacing hexane from SiO2-OH wall, the effects of CO2 pressure on the displacing velocity and efficiency as well as the underlying oil recovering mechanisms in binary mixtures are discussed in detail. The displacing process can be divided into three steps; first, supercritical CO2 molecules fill in the shale slit, and then adsorb on the wall surface and mix with hexane, resulting in a loose hexane layer, and they finally displace the hexane from the wall due to stronger interactions between CO2 and the wall. The displacing velocity increases to a maximum at 10.5 MPa, and then decreases with pressure. In addition, the displacing efficiency increases from 16.3% to 42.1% when pressure increases from 6.0 to 12.0 MPa. This phenomenon is caused by the change in diffusion circumstance, in which the Onsager coefficients of CO2 and hexane are correlated to increase with pressure, until the diffusion rate of hexane being suppressed by the highly dense distribution of CO2 molecules is equal to 12 MPa. Indeed, the rapid transportation of CO2 molecules in the binary components (CO2 and hexane) promotes the hexane diffusion, which is in favor of driving oil out of nanochannels. The interaction energies of the CO2 wall are stronger than that of the hexane wall when pressures are higher than 7.5 MPa, which originally accounts for the efficient hexane displacement. Taking the displacing velocity and efficiency and the hexane diffusion rate into consideration, the optimal injection pressure of CO2 is 10.5 MPa in this work. Our study provides detailed mechanisms of CO2 displacing hexane from a wall, which contributes to a deeper understanding of unconventional oil and gas exploitation and utilization.
Author Contributions
Conceptualization, Z.Z. and L.L.; methodology, L.L.; software, Z.Z.; validation, J.S., Z.Z. and L.L.; formal analysis, Z.Z.; investigation, Z.Z.; resources, L.L.; data curation, J.S.; writing—original draft preparation, J.S.; writing—review and editing, J.S. and L.L.; visualization, Z.Z.; supervision, L.L.; project administration, L.L.; funding acquisition, L.L. All authors have read and agreed to the published version of the manuscript.
Funding
This research was funded by National Natural Science Foundation of China [Grant No. 52006017] for the funding support and China Postdoctoral Science Foundation for funding support (2021M690175), and thanks the financial support of the Frontier Crossover Project of Central Universities (2021CDJQY-029).
Institutional Review Board Statement
Not applicable.
Informed Consent Statement
Not applicable.
Data Availability Statement
Not applicable.
Conflicts of Interest
The authors declare no conflict of interest.
Sample Availability
Samples of the compounds are not available from the authors.
References
- Song, Y.; Ji, Q.; Du, Y.-J.; Geng, J.-B. The dynamic dependence of fossil energy, investor sentiment and renewable energy stock markets. Energy Econ. 2019, 84, 104564. [Google Scholar] [CrossRef]
- Moh, D.Y.; Zhang, H.; Wang, S.; Yin, X.; Qiao, R. Soaking in CO2 huff-n-puff: A single-nanopore scale study. Fuel 2022, 308, 122026. [Google Scholar] [CrossRef]
- Zhang, L.; Liu, C.; Li, Q. Molecular simulations of competitive adsorption behavior between CH4-C2H6 in K-illite clay at supercritical conditions. Fuel 2020, 260, 116358. [Google Scholar] [CrossRef]
- Gong, L.; Wang, J.; Gao, S.; Fu, X.; Liu, B.; Miao, F.; Zhou, X.; Meng, Q. Characterization, controlling factors and evolution of fracture effectiveness in shale oil reservoirs. J. Pet. Sci. Eng. 2021, 203, 108655. [Google Scholar] [CrossRef]
- Belu Mănescu, C.; Nuño, G. Quantitative effects of the shale oil revolution. Energy Policy 2015, 86, 855–866. [Google Scholar] [CrossRef] [Green Version]
- Zhang, Y.; Fang, T.; Ding, B.; Wang, W.; Yan, Y.; Li, Z.; Guo, W.; Zhang, J. Migration of oil/methane mixture in shale inorganic nano-pore throat: A molecular dynamics simulation study. J. Pet. Sci. Eng. 2020, 187, 106784. [Google Scholar] [CrossRef]
- Taheri-Shakib, J.; Kantzas, A. A comprehensive review of microwave application on the oil shale: Prospects for shale oil production. Fuel 2021, 305, 121519. [Google Scholar] [CrossRef]
- Kong, S.; Feng, G.; Liu, Y.; Li, K. Potential of dimethyl ether as an additive in CO2 for shale oil recovery. Fuel 2021, 296, 120643. [Google Scholar] [CrossRef]
- Moh, D.Y.; Zhang, H.; Sun, S.; Qiao, R. Molecular anatomy and macroscopic behavior of oil extraction from nanopores by CO2 and CH4. Fuel 2022, 324, 124662. [Google Scholar] [CrossRef]
- Zhang, L.; Liu, C.; Liu, Y.; Li, Q.; Cheng, Q.; Cai, S. Transport Property of Methane and Ethane in K-Illite Nanopores of Shale: Insights from Molecular Dynamic Simulations. Energy Fuels 2020, 34, 1710–1719. [Google Scholar] [CrossRef]
- Elwegaa, K.; Emadi, H.; Soliman, M.; Gamadi, T.; Elsharafi, M. Improving oil recovery from shale oil reservoirs using cyclic cold carbon dioxide injection—An experimental study. Fuel 2019, 254, 115586. [Google Scholar] [CrossRef]
- Fakher, S.; Imqam, A. Application of carbon dioxide injection in shale oil reservoirs for increasing oil recovery and carbon dioxide storage. Fuel 2020, 265, 116944. [Google Scholar] [CrossRef]
- Jia, B.; Tsau, J.-S.; Barati, R. A review of the current progress of CO2 injection EOR and carbon storage in shale oil reservoirs. Fuel 2019, 236, 404–427. [Google Scholar] [CrossRef]
- Middleton, R.S.; Carey, J.W.; Currier, R.P.; Hyman, J.D.; Kang, Q.; Karra, S.; Jiménez-Martínez, J.; Porter, M.L.; Viswanathan, H.S. Shale gas and non-aqueous fracturing fluids: Opportunities and challenges for supercritical CO2. Appl. Energy 2015, 147, 500–509. [Google Scholar] [CrossRef] [Green Version]
- Lashgari, H.R.; Sun, A.; Zhang, T.; Pope, G.A.; Lake, L.W. Evaluation of carbon dioxide storage and miscible gas EOR in shale oil reservoirs. Fuel 2019, 241, 1223–1235. [Google Scholar] [CrossRef]
- Lu, Y.; Chen, X.; Tang, J.; Li, H.; Zhou, L.; Han, S.; Ge, Z.; Xia, B.; Shen, H.; Zhang, J. Relationship between pore structure and mechanical properties of shale on supercritical carbon dioxide saturation. Energy 2019, 172, 270–285. [Google Scholar] [CrossRef]
- Wang, S.; Javadpour, F.; Feng, Q. Fast mass transport of oil and supercritical carbon dioxide through organic nanopores in shale. Fuel 2016, 181, 741–758. [Google Scholar] [CrossRef]
- Zhang, W.; Feng, Q.; Wang, S.; Xing, X. Oil diffusion in shale nanopores: Insight of molecular dynamics simulation. J. Mol. Liq. 2019, 290, 111183. [Google Scholar] [CrossRef]
- Zhong, J.; Wang, P.; Zhang, Y.; Yan, Y.; Hu, S.; Zhang, J. Adsorption mechanism of oil components on water-wet mineral surface: A molecular dynamics simulation study. Energy 2013, 59, 295–300. [Google Scholar] [CrossRef]
- Chen, L.; Zhang, L.; Kang, Q.; Viswanathan, H.S.; Yao, J.; Tao, W. Nanoscale simulation of shale transport properties using the lattice Boltzmann method: Permeability and diffusivity. Sci. Rep. 2015, 5, 8089. [Google Scholar] [CrossRef] [Green Version]
- Wang, S.; Feng, Q.; Javadpour, F.; Yang, Y.-B. Breakdown of Fast Mass Transport of Methane through Calcite Nanopores. J. Phys. Chem. C 2016, 120, 14260–14269. [Google Scholar] [CrossRef]
- Shuai, Z.; Xiaoshu, L.; Qiang, L.; Youhong, S. Thermal-fluid coupling analysis of oil shale pyrolysis and displacement by heat-carrying supercritical carbon dioxide. Chem. Eng. J. 2020, 394, 125037. [Google Scholar] [CrossRef]
- De Lara, L.S.; Michelon, M.F.; Miranda, C.R. Molecular Dynamics Studies of Fluid/Oil Interfaces for Improved Oil Recovery Processes. J. Phys. Chem. B 2012, 116, 14667–14676. [Google Scholar] [CrossRef]
- Nguyen, P.; Carey, J.W.; Viswanathan, H.S.; Porter, M. Effectiveness of supercritical-CO2 and N2 huff-and-puff methods of enhanced oil recovery in shale fracture networks using microfluidic experiments. Appl. Energy 2018, 230, 160–174. [Google Scholar] [CrossRef]
- Seyyedi, M.; Mahzari, P.; Sohrabi, M. An integrated study of the dominant mechanism leading to improved oil recovery by carbonated water injection. J. Ind. Eng. Chem. 2017, 45, 22–32. [Google Scholar] [CrossRef]
- Liu, L.; Bhatia, S.K. Molecular Simulation of CO2 Adsorption in the Presence of Water in Single-Walled Carbon Nanotubes. J. Phys. Chem. C 2013, 117, 13479–13491. [Google Scholar] [CrossRef]
- Song, J.; Liu, L.; Liu, C.; Gao, X. Interfacial resistance of gas transport through rigid and flexible zeolites. Sep. Purif. Technol. 2021, 278, 119529. [Google Scholar] [CrossRef]
- Liu, X.; Zhang, D. A review of phase behavior simulation of hydrocarbons in confined space: Implications for shale oil and shale gas. J. Nat. Gas Sci. Eng. 2019, 68, 102901. [Google Scholar] [CrossRef]
- Jorgensen, W.L.; Maxwell, D.S.; Tirado-Rives, J. Development and Testing of the OPLS All-Atom Force Field on Conformational Energetics and Properties of Organic Liquids. J. Am. Chem. Soc. 1996, 118, 11225–11236. [Google Scholar] [CrossRef]
- Harris, J.G.; Yung, K.H. Carbon Dioxide’s Liquid-Vapor Coexistence Curve and Critical Properties as Predicted by a Simple Molecular Model. J. Phys. Chem. 1995, 99, 12021–12024. [Google Scholar] [CrossRef]
- Cygan, R.T.; Liang, J.-J.; Kalinichev, A.G. Molecular Models of Hydroxide, Oxyhydroxide, and Clay Phases and the Development of a General Force Field. J. Phys. Chem. B 2004, 108, 1255–1266. [Google Scholar] [CrossRef]
- Liu, B.; Wang, C.; Zhang, J.; Xiao, S.; Zhang, Z.; Shen, Y.; Sun, B.; He, J. Displacement Mechanism of Oil in Shale Inorganic Nanopores by Supercritical Carbon Dioxide from Molecular Dynamics Simulations. Energy Fuels 2016, 31, 738–746. [Google Scholar] [CrossRef]
- Delhommelle, J.; Millié, P. Inadequacy of the Lorentz-Berthelot combining rules for accurate predictions of equilibrium properties by molecular simulation. Mol. Phys. 2001, 99, 619–625. [Google Scholar] [CrossRef]
- Plimpton, S. Fast Parallel Algorithms for Short-Range Molecular Dynamics. J. Comput. Phys. 1995, 117, 1–19. [Google Scholar] [CrossRef] [Green Version]
- Purton, J.A.; Crabtree, J.C.; Parker, S.C. DL_MONTE: A general purpose program for parallel Monte Carlo simulation. Mol. Simul. 2013, 39, 1240–1252. [Google Scholar] [CrossRef]
- Moultos, O.A.; Tsimpanogiannis, I.N.; Panagiotopoulos, A.Z.; Economou, I.G. Self-diffusion coefficients of the binary (H2O + CO2) mixture at high temperatures and pressures. J. Chem. Thermodyn. 2016, 93, 424–429. [Google Scholar] [CrossRef]
- Zhao, X.; Jin, H. Correlation for self-diffusion coefficients of H2, CH4, CO, O2 and CO2 in supercritical water from molecular dynamics simulation. Appl. Therm. Eng. 2020, 171, 114941. [Google Scholar] [CrossRef]
Figure 1.
Snapshots of CO2 displacing hexane from the SiO2-OH wall process from the initial moment to 200 ps in the simulation box.
Figure 1.
Snapshots of CO2 displacing hexane from the SiO2-OH wall process from the initial moment to 200 ps in the simulation box.

Figure 2.
Density distributions of (a) hexane and (b) CO2 along the Z axis direction from the initial moment to 100 ps. (c) Radial distribution functions, g(r), of carbon-to-carbon atoms in CO2, C-C, from 50 to 1000 ps. (d) Variations of interaction energies of hexane-wall and CO2-wall with time from initial moment to 2000 ps.

Figure 3.
Variations of snapshots of CO2 displacing hexane from the SiO2-OH wall at the equilibrium state with injection pressures from 6.0 to 12.0 MPa.
Figure 3.
Variations of snapshots of CO2 displacing hexane from the SiO2-OH wall at the equilibrium state with injection pressures from 6.0 to 12.0 MPa.

Figure 4.
Density distributions of (a) hexane and (b) CO2 along Z axis direction at pressures from 6.0 to 12.0 MPa.
Figure 4.
Density distributions of (a) hexane and (b) CO2 along Z axis direction at pressures from 6.0 to 12.0 MPa.

Figure 5.
(a) Variations of the number of hexanes, n, displacing from the wall with time, t, from the initial moment to 100 ps, and (b) the displacing velocity of hexanes, v, at pressures from 6.0 to 12.0 MPa. The displacing velocity was obtained from the linear area in Figure 5a.
Figure 5.
(a) Variations of the number of hexanes, n, displacing from the wall with time, t, from the initial moment to 100 ps, and (b) the displacing velocity of hexanes, v, at pressures from 6.0 to 12.0 MPa. The displacing velocity was obtained from the linear area in Figure 5a.

Figure 6.
Variations of displacing efficiency for hexane, η, with pressures from 6.0 to 12.0 MPa.

Figure 7.
Variations of (a) CO2 velocity, v2, when external forces, Γex1, are applied on hexane, (b) hexane velocity, v1, when the other external forces, Γex2, are applied on CO2, and (c) diagonal Onsager coefficients L12 and L21, with injection pressures from 6.0 to 12.0 MPa. The blue dotted line, y = x, represents the isoline of the horizontal and vertical axes, L12 = L21.

Figure 8.
Variations of (a) velocity, v1, and (b) Onsager coefficient, kBL11, of hexane when external forces, Γex1, are applied on hexane, (c) velocity, v2, and (d) Onsager coefficient, kBL22, of CO2 when the other external forces, Γex2, are applied on CO2, at pressures from 6.0 to 12.0 MPa with 1.5 MPa internals, respectively.

Figure 9.
Variations of interaction energies of hexane-wall and CO2-wall with pressures from 6.0 to 12.0 MPa with 1.5 MPa internals.
Figure 9.
Variations of interaction energies of hexane-wall and CO2-wall with pressures from 6.0 to 12.0 MPa with 1.5 MPa internals.

Figure 10.
(a) Hydroxylation process of silica, SiO2-OH, and (b) Simulation setup. The walls at the upper and lower edges are hydroxylated silica, SiO2-OH, in which the red, yellow, and white spheres represent oxygen, silica, and hydrogen atoms, respectively. The green and bule molecules in the shale slit are hexane (C6H14) and carbon dioxide (CO2) respectively.

Figure 11.
Variations of (a) density and (b) self-diffusion coefficient for CO2 at different temperatures and pressures from 6.0 to 12.0 MPa.
Figure 11.
Variations of (a) density and (b) self-diffusion coefficient for CO2 at different temperatures and pressures from 6.0 to 12.0 MPa.


Table 1.
Bond parameters of C6H14, CO2 and SiO2-OH adopted here.
| Species | Bond Type | Kr (kcal/mol) | r0 (Å) |
|---|---|---|---|
| C6H14 | C-C | 268.0 | 1.529 |
| C-H | 340.0 | 1.09 | |
| CO2 | C=O | 615.322 | 1.149 |
| SiO2-OH | O-H | 554.1349 | 1.0 |
Table 2.
Angle parameters of C6H14, CO2 and SiO2-OH.
| Species | Angle Type | Kθ (kcal/(mol·rad2)) | θ (°) |
|---|---|---|---|
| C6H14 | C-C-C | 58.35 | 112.70 |
| C-C-H | 37.5 | 110.70 | |
| H-C-H | 33.0 | 107.80 | |
| CO2 | O=C=O | 295.411 | 180 |
| SiO2-OH | Si-O-H | 30.0 | 109.47 |
Table 3.
Dihedral angle parameters of OPLS-AA model for C6H14.
| Types | V1 (kcal/mol) | V2 (kcal/mol) | V3 (kcal/mol) | V4 (kcal/mol) |
|---|---|---|---|---|
| C-C-C-C | 1.30 | −0.05 | 0.30 | 0 |
| C-C-C-H | 0 | 0 | 0.30 | 0 |
| H-C-C-H | 0 | 0 | 0.30 | 0 |
Table 4.
Lennard-Jones 12–6 potentials and charges of atoms.
| Species | Atoms | ε (kcal/mol) | σ (Å) | q (e) |
|---|---|---|---|---|
| SiO2-OH | Si | 1.84 × 10⁻⁶ | 3.302 | +2.1 |
| O | 0.1554 | 3.1655 | −1.05 | |
| O_OH | 0.1554 | 3.1655 | −0.95 | |
| H_OH | 0 | 0 | 0.425 | |
| C6H14 | C_CH3 | 0.066 | 3.50 | −0.18 |
| C_CH2 | 0.066 | 3.50 | −0.12 | |
| H_C6H14 | 0.030 | 2.50 | 0.06 | |
| CO2 | C_CO2 | 0.0559 | 2.757 | 0.6512 |
| O_CO2 | 0.1559 | 3.033 | −0.3256 |
Table 5.
Variations of density and number of CO2 molecules at 353.15 K with pressures.
| p (MPa) | ρ (g·cm3) | Number |
|---|---|---|
| 6.0 | 0.14688 | 246 |
| 7.5 | 0.22847 | 394 |
| 9.0 | 0.3745 | 637 |
| 10.5 | 0.5551 | 961 |
| 12.0 | 0.6728 | 1173 |
Publisher’s Note: MDPI stays neutral with regard to jurisdictional claims in published maps and institutional affiliations. |
© 2022 by the authors. Licensee MDPI, Basel, Switzerland. This article is an open access article distributed under the terms and conditions of the Creative Commons Attribution (CC BY) license (https://creativecommons.org/licenses/by/4.0/).
Share and Cite
MDPI and ACS Style
Song, J.; Zhu, Z.; Liu, L. Mechanism of Hexane Displaced by Supercritical Carbon Dioxide: Insights from Molecular Simulations. Molecules 2022, 27, 8340. https://doi.org/10.3390/molecules27238340
AMA Style
Song J, Zhu Z, Liu L. Mechanism of Hexane Displaced by Supercritical Carbon Dioxide: Insights from Molecular Simulations. Molecules. 2022; 27(23):8340. https://doi.org/10.3390/molecules27238340
Chicago/Turabian StyleSong, Jiasheng, Zhuangying Zhu, and Lang Liu. 2022. "Mechanism of Hexane Displaced by Supercritical Carbon Dioxide: Insights from Molecular Simulations" Molecules 27, no. 23: 8340. https://doi.org/10.3390/molecules27238340