Article

Computational Analysis of Triazole-Based Kojic Acid Analogs as Tyrosinase Inhibitors by Molecular Dynamics and Free Energy Calculations

by
Lucas Sousa Martins
1,
Reinaldo W. A. Gonçalves
1,
Joana J. S. Moraes
1,2,
Cláudio Nahum Alves
1,* and
José Rogério A. Silva
1,2,*
1
Laboratório de Planejamento e Desenvolvimento de Fármacos, Instituto de Ciências Exatas e Naturais, Universidade Federal do Pará, Belém 66075-110, Brazil
2
Programa de Pós-Graduação em Química Medicinal e Modelagem Molecular, Instituto de Ciências da Saúde, Universidade Federal do Pará, Belém 66075-110, Brazil
*
Authors to whom correspondence should be addressed.
Molecules 2022, 27(23), 8141; https://doi.org/10.3390/molecules27238141
Submission received: 4 November 2022 / Revised: 16 November 2022 / Accepted: 19 November 2022 / Published: 23 November 2022

Abstract

:
Molecular docking, molecular dynamics (MD) simulations and the linear interaction energy (LIE) method were used here to predict binding modes and free energy for a set of 1,2,3-triazole-based KA analogs as potent inhibitors of Tyrosinase (TYR), a key metalloenzyme of the melanogenesis process. Initially, molecular docking calculations satisfactorily predicted the binding mode of evaluated KA analogs, where the KA part overlays the crystal conformation of the KA inhibitor into the catalytic site of TYR. The MD simulations were followed by the LIE method, which reproduced the experimental binding free energies for KA analogs with an r2 equal to 0.97, suggesting the robustness of our theoretical model. Moreover, the van der Waals contributions performed by some residues such as Phe197, Pro201, Arg209, Met215 and Val218 are responsible for the binding recognition of 1,2,3-triazole-based KA analogs in TYR catalytic site. Finally, our calculations provide suitable validation of the combination of molecular docking, MD, and LIE approaches as a powerful tool in the structure-based drug design of new and potent TYR inhibitors.

Graphical Abstract

1. Introduction

Melanin is a general name for a class of natural pigments derived from tyrosine that is found in many species of living organisms and microorganisms such as plants, animals, bacteria and fungi. It has many key functions including thermoregulation, photoprotection and healing process [1]. In plants, it is related to the browning of vegetables and fruits, which is an important aspect of the agriculture industry [2]. In mammals, melanin is crucial for the protection of skin and eyes against UV light [3]. Due to playing key roles in cell protection, its abnormal production is related to several hyperpigmentation disorders, such as senile lentigines, freckles and melasma [4], which provides evidence for the development of skin-whitening and depigmenting compounds based on melanin inhibition, which is important to the cosmetic industry [5]. Moreover, there is some evidence relating to neuromelanin and Parkinson’s disease [6].
The biosynthetic path of melanin involves several steps including the hydroxylation of L-Tyrosine (L-Tyr) to L-3,4-dihydroxyphenylalanine (L-DOPA), a monophenolase stage (1), followed by the subsequent oxidation of L-DOPA to O-dopaquinone, a diphenolase stage (2) [7] (Figure 1). Both reactions are catalyzed by a type-3 copper metalloenzyme called Tyrosinase (TYR), which contains a binuclear copper active site in which each Cu2+ ion chelates with three histidine (His) amino acid residues [8].
Despite the critical role of TYR in the melanogenesis and browning process, several studies have involved the design, synthesis and biological evaluation of TYR inhibitors [9,10], among which arbutin [11], hydroquinone [12], azelaic acid [13] and kojic acid (KA) [14] can be highlighted. Particularly, KA is used as a positive control for TYR inhibition, but it has shown side effects related to a high-sensitizing potential and considerable toxicity [15,16], which compromise its use in the cosmetical and pharmaceutical industries. Moreover, studies highlight the urgency for the development of new TYR inhibitors [7,10]. Recently, Ashooriha et al. [17] synthesized a set of KA analogs with high anti-TYR activity. They applied a click chemistry reaction and the formation of a 1,2,3-triazole ring to synthesize these new and potent TYR inhibitors [17]. Particularly, the most potent compounds (6o and 6p) show lower cytotoxic activity than KA. Furthermore, the synthesized compounds can be added to the group of products of click chemistry application related to the Nobel Prize in Chemistry 2022.
Here, we reported a powerful computational analysis of 1,2,3-triazole-based KA analogs, synthesized and evaluated by Ashooriha et al. [17], by applying molecular docking, molecular dynamics (MD) simulations and binding free energy calculations. This study shines a light on the TYR inhibition mechanism by providing structural and energetic information that agrees with experimental proposals. Moreover, all applied computational procedures here have been successfully validated by our research group [18,19,20,21].

2. Results and Discussion

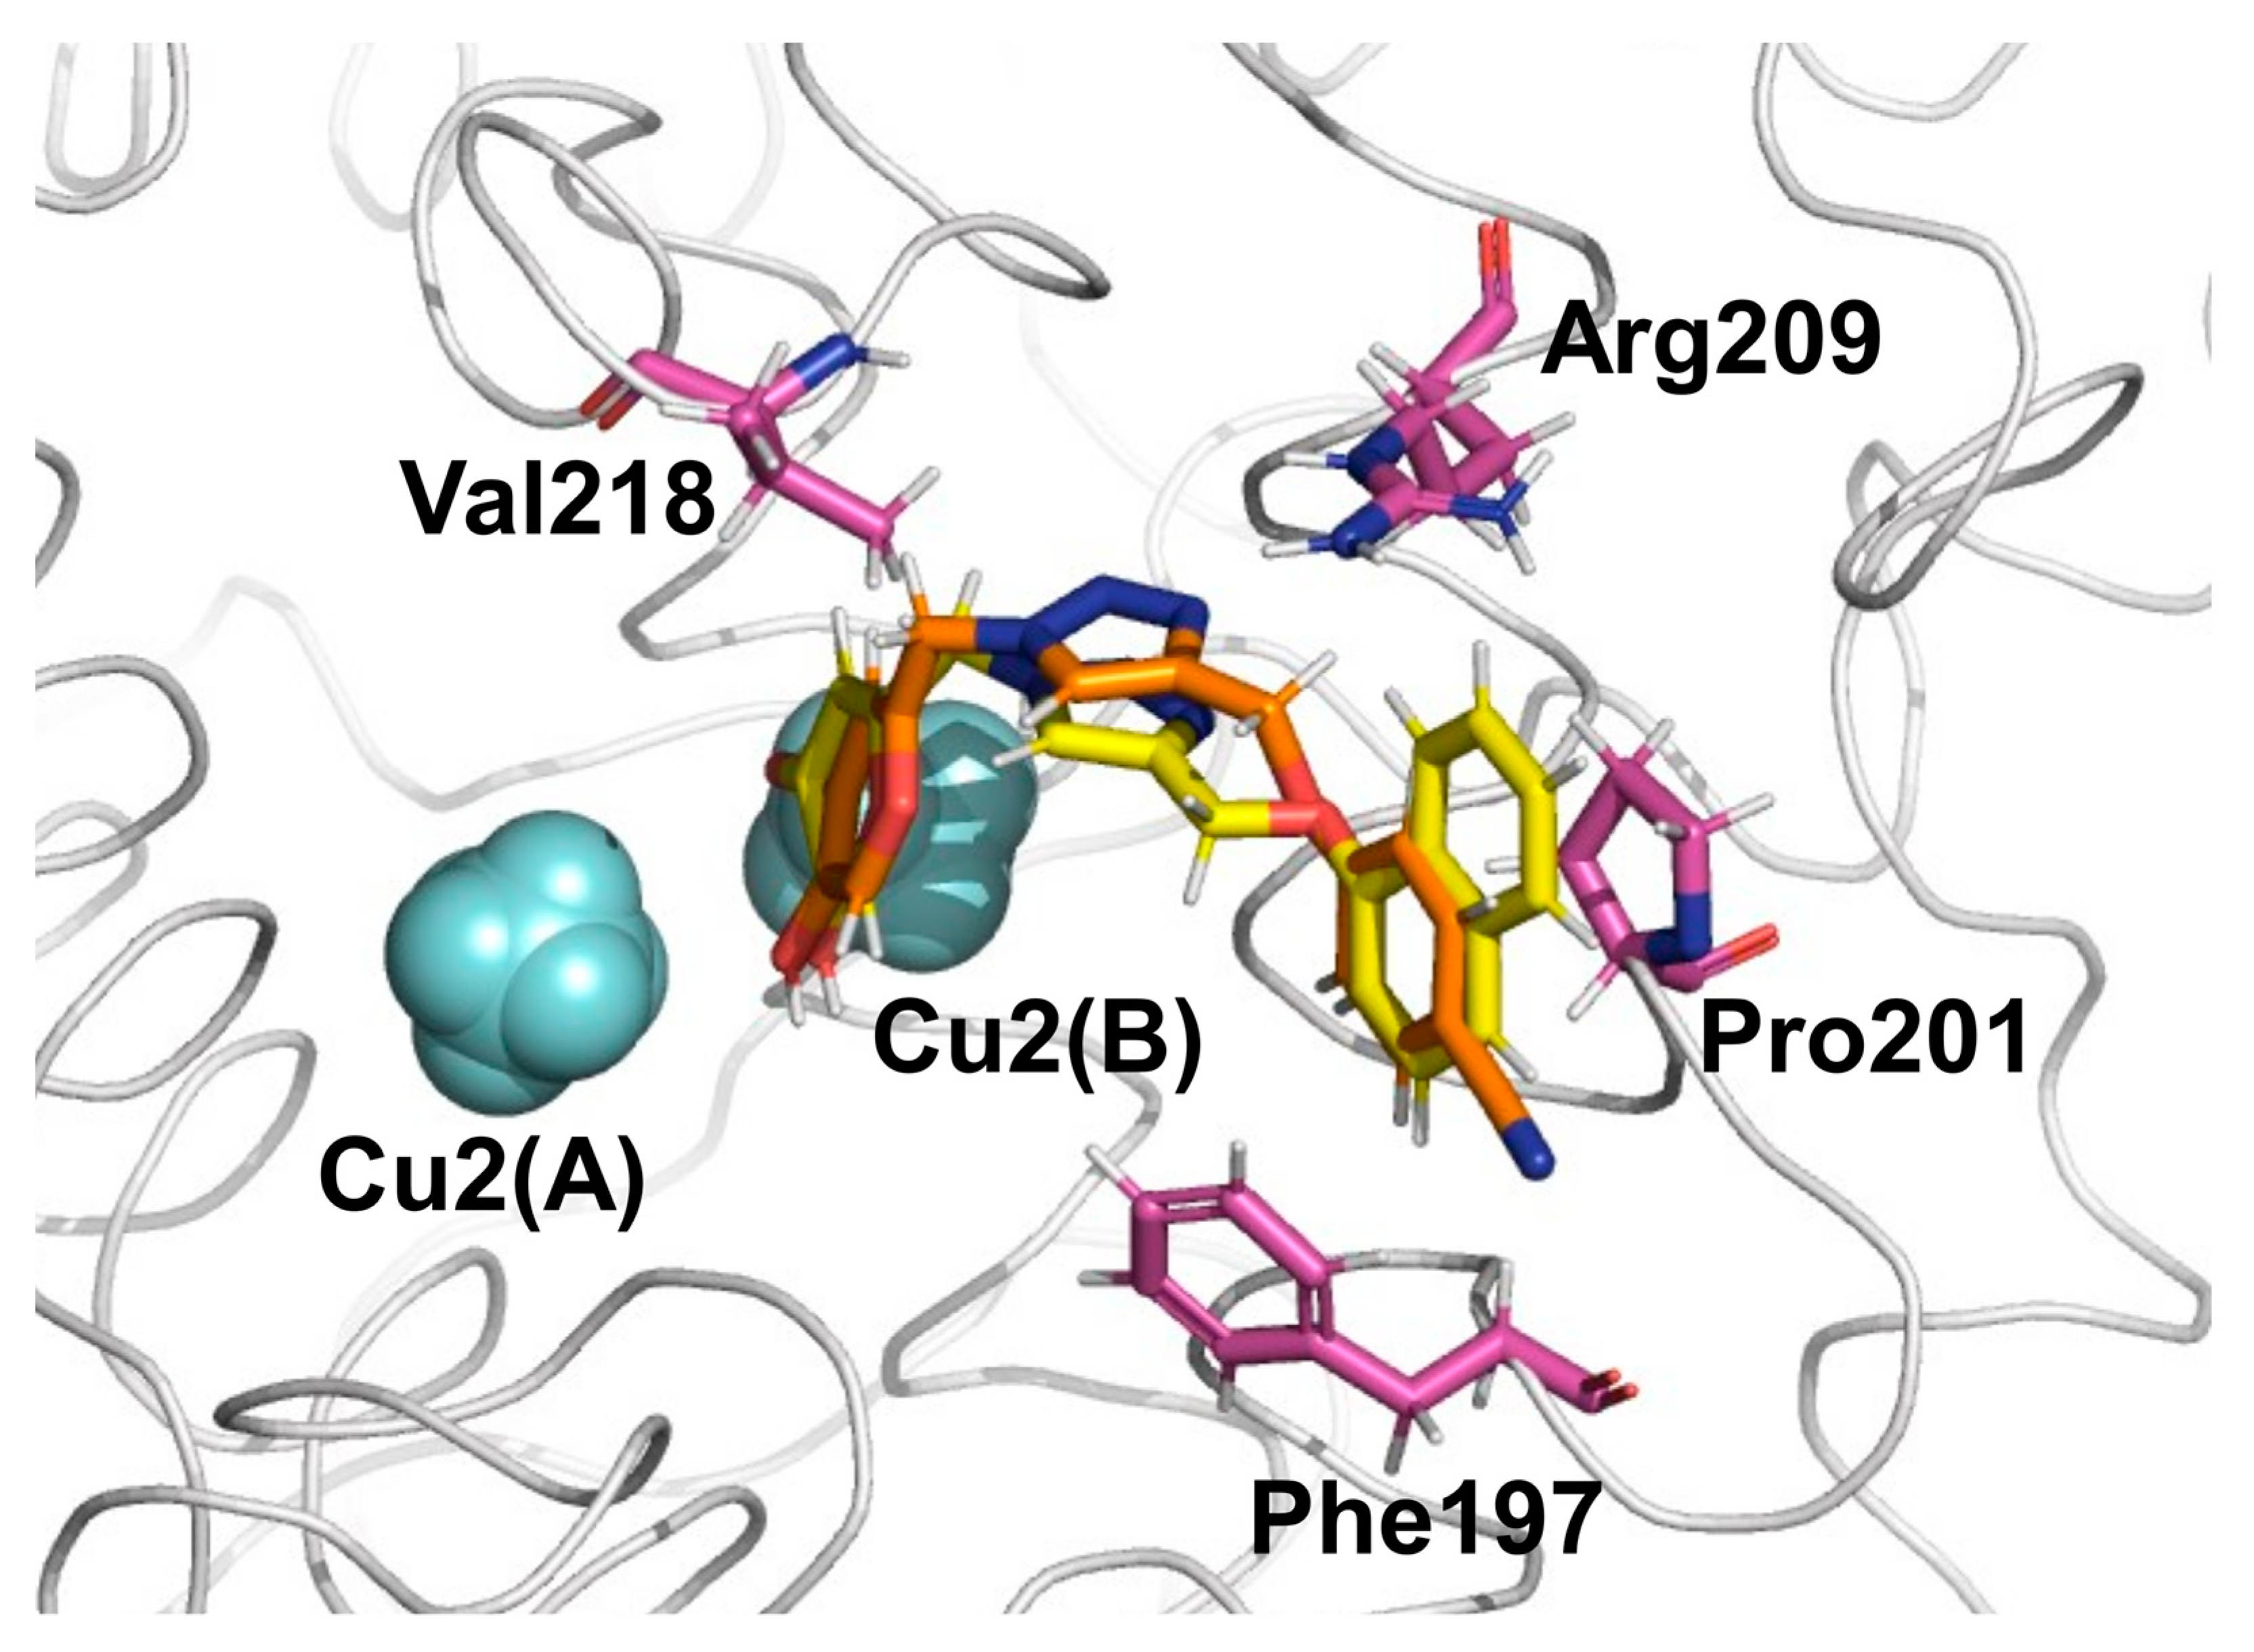
2.1. Molecular Docking and MD Simulations

Initially, it should be highlighted that our molecular docking results using the Virtual Docker (MVD) package and MOLDOCK method [22] have been successfully applied for TYR systems [18,19,20,21]. In Figure 2, the docked conformation of the weakest and strongest potent 1,2,3-triazole-based KA inhibitor (6h and 6o, respectively) show suitable conformations into the TYR catalytic site where the KA ring is close to the crystallographic structure of the KA complex. The main difference between the two structures is the orientation of the 1,2,3-triazole part of the KA analog, which also could not be resolved from the experimental electron density and is exposed to solvent. From the docking calculations, a MOLDOCK scoring function for each KA analog could be extracted and compared to experimental binding data (Table 1). There is no correlation (r2 = −0.23) between MOLDOCK scoring and the experimental data (IC50, µM) (see Figure S1). These results are not a surprise for molecular docking calculations, where docking algorithms in many cases can provide a suitable binding mode but cannot rank different ligands by affinity [23].
In particular, the hydroxyl groups of the KA part of 1,2,3-triazole-based KA inhibitors (6a6p) interact with Cu2+(B) (Figure 2), producing distances of about 3.30 Å. Furthermore, the KA ring of 1,2,3-triazole compounds is involved in a hydrophobic pocket created by Met215, Gly216, Val217, Val218 and Ala224, as found in the KA inhibitor. Among the most important interactions, we can highlight the interaction with a key residue Arg209 through the π–cation stacking interaction with 1,2,3-triazole ring present in all KA analogs, for the natural substrates, this residue is responsible to form hydrogen bonds with the carboxylic group of substrates (L-Tyr and L-DOPA) [24,25].
As successfully shown by previous studies [26,27,28,29,30,31], MD simulations are an excellent technique to improve molecular docking results. Here, as described in the Materials and Methods section, five random replicas of 2 ns each were performed by using the Q program [32] version 6.0 [33] to provide ensembles for an improved binding process of 1,2,3-triazole-based KA into TYR. According to our MD results, all KA analogs are stable in the catalytic site of TYRBm (Table 2), and the structural features of the TYR part are similar to the previous computational studies [19]. The root-mean-square deviation (RMSD) values of protein and ligand atoms are summarized in Table 2. As can be observed, these values range from 0.39 ± 0.04 Å (TYR-6o system) to 0.50 ± 0.04 Å (TYR-6b) for the protein part and from 0.47 ± 0.12 Å (TYR-6j system) to 0.81 ± 0.24 Å (TYR-6f system) for the ligand part. These results suggest a suitable stabilization of all KA analogs into the TYR catalytic site in all simulated complexes. Interestingly, all inhibitors maintained the interaction between the O atom of the carbonyl group of the KA part and Cu2+ ion (Cu2(B)) present in the TYR catalytic site, as observed for natural substrates (L-Tyr and L-DOPA) and the KA inhibitor [14]. Moreover, as previously evaluated [19], the CuDum model [34] applied for the description of Cu2+ ions appropriately described all important structural features. An RMSD plot of the protein and ligands with respect to the first snapshot of each system is provided as Supplementary Materials (Figure S2).

2.2. Binding Free Energy and Per-Residual Analysis

Due to the protein flexibility being not explicitly considered during the docking calculations, the prediction of accurate binding free energies can be difficult, and in this case, MD simulations can overcome it [35]. However, a suitable ensemble obtained from MD simulations should be evaluated to better describe the binding affinity of protein–inhibitor during molecular recognition. Combined with this feature, accurate and efficient methods to compute binding free energy (ΔGbind) are essential in computer-aided drug design [36]. Among these free energy methods, Linear Interaction Energy (LIE) [37] was selected for the prediction of experimental (∆GEXP) binding free energies of KA analogs complexed into TYRBm. This approach has been applied successfully for TYR systems [18,19].
In Table 3, it can be observed all ligand-surrounding energies for KA analogs computed from MD simulations. Here, a total of 10 ns of MD simulations for each TYR system was chosen to compute LIE free energy (ΔGLIE) values. The empirical parameters α and β were chosen directly from the literature [38], see Table S1 for details. Particularly, the optimized value of γ (equal to 17.33) of LIE equation (Equation (1)) was calculated from the linear fitting with ∆GEXP in order to include the Jahn–Teller effect included in the CuDum model for the bound models [34]. Particularly, it was found that excluding 6d, 6g and 6k inhibitors resulted in a significantly better correlation with the ∆GEXP, so in all LIE discussions presented below, these KA analogs were excluded from the analysis, and a similar strategy was used by Carlsson et al. [27] and Vanga et al. [39].
The absolute binding free values for the 1,2,3-triazole-based KA inhibitors in the experimental data set are quite well-reproduced by the LIE approach (r2 = 0.97) (Figure 3). As all KA analogs are more potent TYR than KA inhibitors, our discussion is focused on considering the weakest (6h) and strongest (6o) TYR inhibitors, suggesting key features that explain their binding differences. Particularly, the ∆GLIE value for 6h is about 0.47 Kcal/mol higher than its experimental data (−7.14 Kcal/mol), while the ∆GLIE value for 6o is about 0.42 Kcal/mol lower than its experimental value (−9.91 Kcal/mol). As suggested by Ashooriha et al. [39], the good TYR activity shown by these KA analogs is explained by the presence of a 1,2,3-triazole ring. Therefore, new interactions found in that part of TYR inhibitors can provide insights about their inhibitory action. Therefore, to elucidate the energetic contributions of amino acid residues around the catalytic site of TYR, a residual decomposition analysis was carried out considering both van der Waals (vdW) and electrostatic (ele) contributions from the LIE equation.
The average vdW and ele interaction energies, overall KA analogs, for the TYR amino acid residues that contribute significantly to the ∆GLIE are shown in Figure 4. As observed, in general, the ele contributions from TYR residues do not differ significantly for 6h and 6o systems (Figure 4B). Particularly, the interaction with Cu2+(B) is the most important contribution to the binding of KA analogs. Furthermore, the vdW contributions change significantly from 6h to 6o inhibitors (Figure 4A). The most evident difference can be observed for Phe197, Pro201, Arg209, Met215 and Val218, where the values change about 0.79, −0.54, −0.48, −0.56 and −1.48 Kcal/mol from 6h to 6o inhibitors, respectively (Figure 4). Interestingly, the interaction found between KA analogs and Arg209 occurs through π–cation stacking contact with the amino acid sidechain and 1,2,3-triazole ring of the KA analog (Figure 5). In the TYR–KA system, this residue interacts by an H bond with the carboxylic group of KA [14]. Finally, the 6o inhibitor shows a strong vdW interaction with the Cu2+(B) ion of TYR, about 7.37 Kcal/mol lower than the 6h inhibitor (Figure 4A).

3. Materials and Methods

3.1. System Setup for Molecular Docking and MD Simulations

Initially, the 2D structures of KA analogs studied (Figure 6) were built into MARVINSKETCH (v. 22.18) program [40] and then optimized at the PM6 level [41] using GAUSSIAN09 [42] package.
The 3D structure of TYR from Bacillus megaterium (TYRBm) with KA bound into the enzyme catalytic site was extracted from the Protein Data Bank (PDB code 5I38 [14]) as previously performed. The molecular docking calculations were carried out into Molegro Virtual Docker (MVD) version 5.5 [43], which has been applied successfully for TYR systems [18,19,20,21]. Particularly, for docking procedures, Cu2+ ions were included as van der Waals spheres at the catalytic site of TYRBm. Our group has applied the MVD program successfully to describe the binding mode of TYR inhibitors [18,19,21]. Therefore, the same computational procedures were used for TYR-1,2,3-triazole-based KA systems. The MOLDOCK equations are detailed elsewhere [22].
For MD simulations, the best-ranked conformations of KA analogs were selected as starting points. The OPLS-AA [44] and TIP3P [45] force fields were used as parameters set to solute (TYR amino acids and KA analogs) and solvent subsystems, respectively. The OPLSA-AA parameters for KA analogs were computed by using the MACROMODEL package [46]. Particularly, a set of classical parameters proposed by Liao et al. [34], named the Cu2+ dummy model (CuDum), was used to describe the metal center of TYRBm. The PROPKA approach [47] was used to set pKa values of all ionizable amino acid (AA) residues at neutral pH.
Each TYR-1,2,3-triazole-based KA system was solvated by a 20 Å radius simulation sphere of the TIP3P molecules [45] centered into the center of mass of the respective KA analog. The surface-constrained all-atom solvent (SCAAS) method [48] was used for polarization and radial constraints at the simulation sphere surface. All ionizable AA residues close to the sphere boundary were neutralized to account for dielectric screening [32]. A 10 Å cutoff was applied for computing non-bonded interaction energies, excluding only the atoms of KA analogs. The long-range electrostatic interactions were calculated using the local reaction field (LRF) multiple expansion method [49]. All atoms outside of the 20 Å radius simulation sphere were frozen to reduce computational costs [32]. The SHAKE algorithm [50] was used for solvent hydrogen bonds.
The MD equilibration and production procedures for the bound (enzyme) and free (water) states are detailed in our previous study [19] using the Q6 program [50]. Each equilibrated system was submitted to a total of 10 ns of MD simulations from 5 randomized replicas of 2 ns each, where a time step of 1 fs was used and no positional restraints were applied. Particularly, for the free state, a weak harmonic restraint was used to maintain KA analogs in the respective center of their water simulation sphere.

3.2. Binding Free Energy Calculations: LIE Method

A total of 10 ns of MD simulations from the production stage was used for binding free energy calculations according to the Linear Interaction Energy (LIE) method [37]. It uses the ensembles of the bound and free states of a respective ligand to compute their free energy difference [37]. The binding free energy ( Δ G LIE ) value of each TYRBm system was computed using the LIE equation (Equation (1)):
Δ G L I E = α ( U v d W b o u n d U v d W f r e e ) + β ( U e l e b o u n d U e l e f r e e ) + γ
The α and β parameters are empirically scaling for the non-polar ( U v d W ) and the polar ( U e l e ) terms, which are dependent on the chemical nature of the ligand [38]. These parameters can be obtained from the previous studies (α = 0.181 and β = 0.33−0.50) [38] or by linear fitting using experimental binding free energies ( Δ G E X P ) (Equation (2)). The average, 〈 〉, of van der Waals (“vdW”) and electrostatic (“ele”) interactions of “bound” and “free” states are computed using ensembles from MD production.
Δ G E X P = RT ln I C 50 + c
where the assay-specific constant (c) depends on the substrate concentration and the Michaelis–Menten constant ( K m ) [51]. As this constant value does not affect the relative free energies, it can be implicitly included in the optimized value of γ (Equation (1)).

4. Conclusions

The present study investigated the accuracy of molecular docking and MD simulations in combination with the LIE method on a set of 1,2,3-triazole-based KA analogs, synthesized by click chemistry reactions as potent inhibitors of TYR enzyme. The TYR–inhibitor interactions were analyzed in detail, and it was found that the binding affinities of the selected KA analogs are driven mainly by van der Waals interactions. Particularly, a new π–cation stacking contact occurs between the Arg209 sidechain and 1,2,3-triazole ring of all KA analogs and may be related to their improved TYR activity. Our LIE analysis also agrees very well with experiments on TYR enzyme, providing a useful strategy for obtaining more potent TYR inhibitors and accurate predictions of TYR–inhibitor binding free energies.

Supplementary Materials

The following supporting information can be downloaded at: https://www.mdpi.com/article/10.3390/molecules27238141/s1.

Author Contributions

Conceptualization, C.N.A. and J.R.A.S.; methodology, L.S.M. and J.R.A.S.; software, L.S.M., R.W.A.G. and J.J.S.M.; validation, L.S.M., C.N.A. and J.R.A.S.; formal analysis, L.S.M., R.W.A.G., J.J.S.M. and J.R.A.S.; investigation, L.S.M., R.W.A.G., J.J.S.M. and J.R.A.S.; resources, J.R.A.S.; data curation, L.S.M., R.W.A.G., J.J.S.M. and J.R.A.S.; writing—original draft preparation, C.N.A. and J.R.A.S.; writing—review and editing, J.R.A.S.; visualization, L.S.M. and J.R.A.S.; supervision, C.N.A. and J.R.A.S.; project administration, J.R.A.S.; funding acquisition, J.R.A.S. All authors have read and agreed to the published version of the manuscript.

Funding

This research was funded by the National Council for Scientific and Technological Development. L.S.M. thanks CAPES funding agency (process #88882.445391/2019-01) and J.J.S.M. thanks FAPESPA (PROPESP Call 15/2021) for providing scholarships during the development of this project.

Data Availability Statement

Not applicable.

Acknowledgments

This project was granted access to the computational resources of the South African Centre for High-Performance Computing (https://www.chpc.ac.za/, accessed on 1 July 2022), the Hippo at the University of KwaZulu-Natal (https://astro.ukzn.ac.za/~hippo/, accessed on 1 July 2022) and the High-Performance Computing Center of Federal University of Pará (https://www.ccad.ufpa.br/, accessed on 1 July 2022). The authors thank PROPESP/UFPA for payment of the publication fee.

Conflicts of Interest

The authors declare no conflict of interest.

References

  1. D’Mello, S.; Finlay, G.; Baguley, B.; Askarian-Amiri, M. Signaling Pathways in Melanogenesis. Int. J. Mol. Sci. 2016, 17, 1144. [Google Scholar] [CrossRef] [PubMed] [Green Version]
  2. Moon, K.M.; Kwon, E.-B.; Lee, B.; Kim, C.Y. Recent Trends in Controlling the Enzymatic Browning of Fruit and Vegetable Products. Molecules 2020, 25, 2754. [Google Scholar] [CrossRef] [PubMed]
  3. Brenner, M.; Hearing, V.J. The Protective Role of Melanin Against UV Damage in Human Skin†. Photochem. Photobiol. 2008, 84, 539–549. [Google Scholar] [CrossRef] [PubMed] [Green Version]
  4. Del Bino, S.; Duval, C.; Bernerd, F. Clinical and Biological Characterization of Skin Pigmentation Diversity and Its Consequences on UV Impact. Int. J. Mol. Sci. 2018, 19, 2668. [Google Scholar] [CrossRef] [Green Version]
  5. Pillaiyar, T.; Manickam, M.; Namasivayam, V. Skin whitening agents: Medicinal chemistry perspective of tyrosinase inhibitors. J. Enzyme Inhib. Med. Chem. 2017, 32, 403–425. [Google Scholar] [CrossRef] [Green Version]
  6. Bose, A.; Petsko, G.A.; Eliezer, D. Parkinson’s Disease and Melanoma: Co-Occurrence and Mechanisms. J. Parkinsons. Dis. 2018, 8, 385–398. [Google Scholar] [CrossRef] [Green Version]
  7. Sánchez-Ferrer, Á.; Neptuno Rodríguez-López, J.; García-Cánovas, F.; García-Carmona, F. Tyrosinase: A comprehensive review of its mechanism. Biochim. Biophys. Acta-Protein Struct. Mol. Enzymol. 1995, 1247, 1–11. [Google Scholar] [CrossRef]
  8. Solano, F. On the Metal Cofactor in the Tyrosinase Family. Int. J. Mol. Sci. 2018, 19, 633. [Google Scholar] [CrossRef] [Green Version]
  9. Zolghadri, S.; Bahrami, A.; Hassan Khan, M.T.; Munoz-Munoz, J.; Garcia-Molina, F.; Garcia-Canovas, F.; Saboury, A.A. A comprehensive review on tyrosinase inhibitors. J. Enzyme Inhib. Med. Chem. 2019, 34, 279–309. [Google Scholar] [CrossRef] [Green Version]
  10. Chang, T.-S. An Updated Review of Tyrosinase Inhibitors. Int. J. Mol. Sci. 2009, 10, 2440–2475. [Google Scholar] [CrossRef]
  11. Kligman, A.M. A New Formula for Depigmenting Human Skin. Arch. Dermatol. 1975, 111, 40. [Google Scholar] [CrossRef] [PubMed]
  12. Ramsden, C.A.; Riley, P.A. Mechanistic aspects of the tyrosinase oxidation of hydroquinone. Bioorg. Med. Chem. Lett. 2014, 24, 2463–2464. [Google Scholar] [CrossRef] [PubMed]
  13. Schallreuter, K.U.; Wood, J.W. A possible mechanism of action for azelaic acid in the human epidermis. Arch. Dermatol. Res. 1990, 282, 168–171. [Google Scholar] [CrossRef] [PubMed]
  14. Deri, B.; Kanteev, M.; Goldfeder, M.; Lecina, D.; Guallar, V.; Adir, N.; Fishman, A. The unravelling of the complex pattern of tyrosinase inhibition. Sci. Rep. 2016, 6, 34993. [Google Scholar] [CrossRef] [Green Version]
  15. Chen, W.-C.; Tseng, T.-S.; Hsiao, N.-W.; Lin, Y.-L.; Wen, Z.-H.; Tsai, C.-C.; Lee, Y.-C.; Lin, H.-H.; Tsai, K.-C. Discovery of Highly Potent Tyrosinase Inhibitor, T1, with Significant Anti-Melanogenesis Ability by zebrafish in vivo Assay and Computational Molecular Modeling. Sci. Rep. 2015, 5, 7995. [Google Scholar] [CrossRef] [PubMed] [Green Version]
  16. Hashemi, S.M.; Emami, S. Kojic acid-derived tyrosinase inhibitors: Synthesis and bioactivity. Pharm. Biomed. Res. 2015, 1, 1–17. [Google Scholar] [CrossRef] [Green Version]
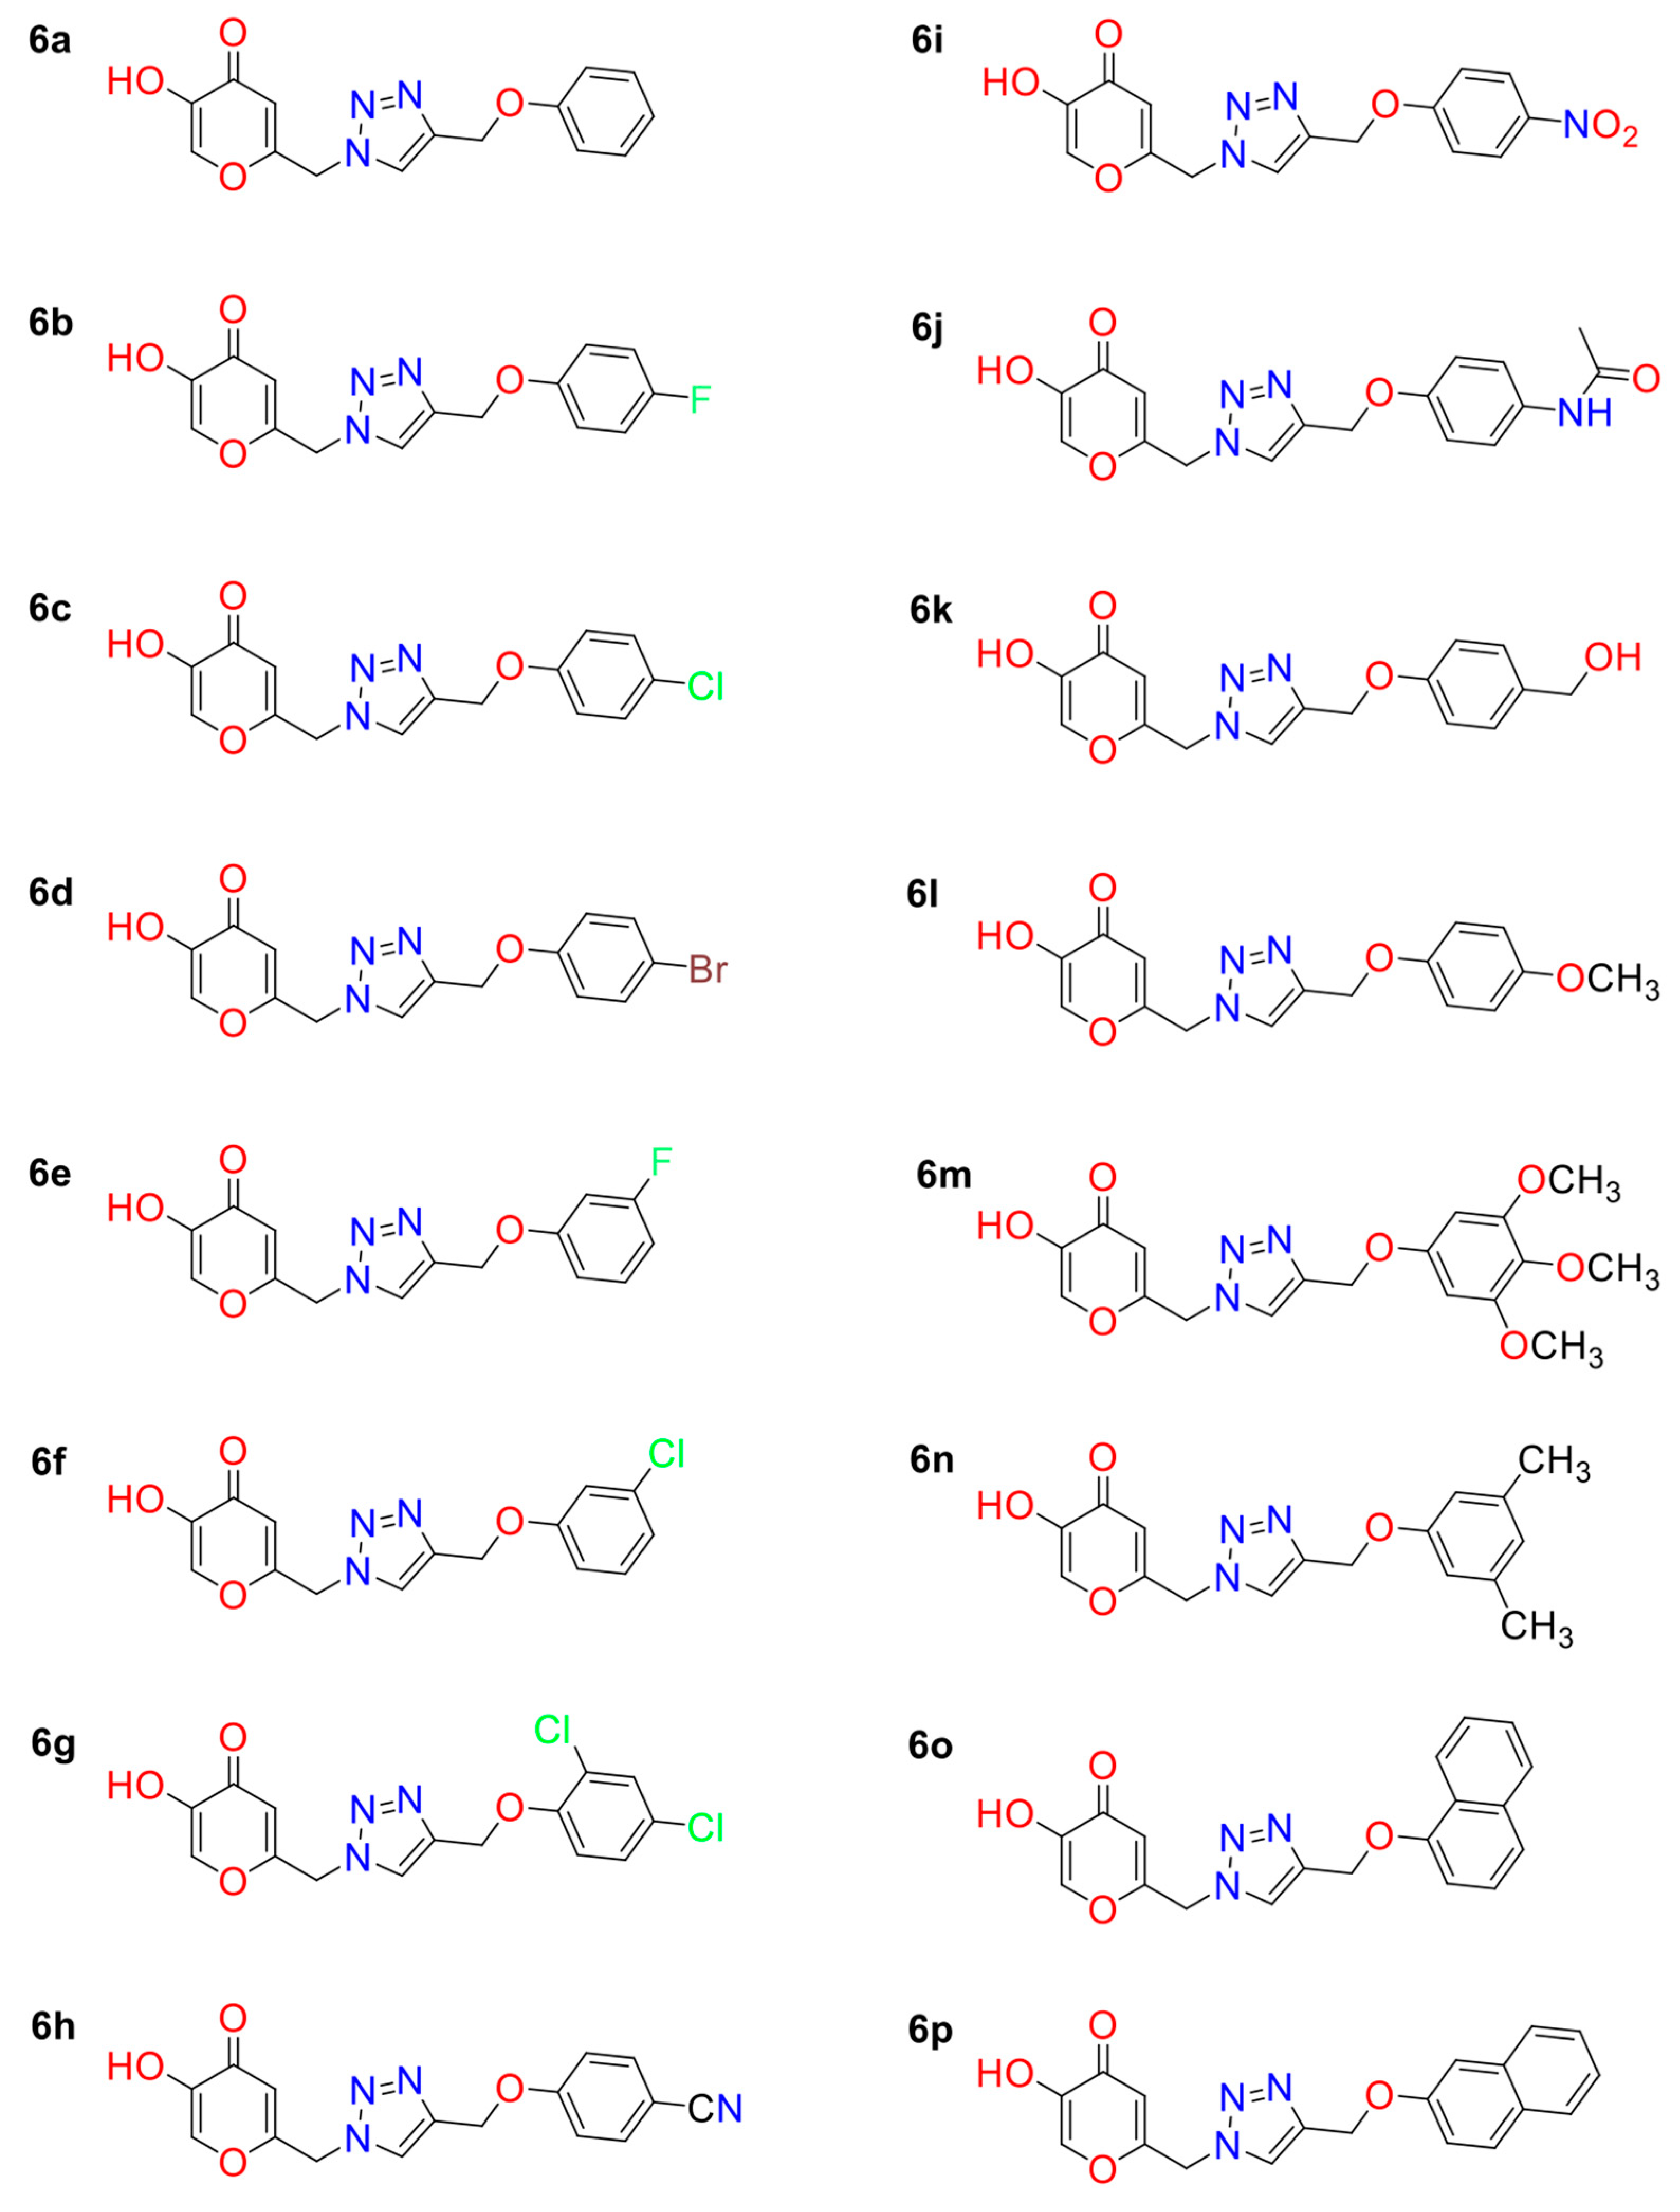
  17. Ashooriha, M.; Khoshneviszadeh, M.; Khoshneviszadeh, M.; Moradi, S.E.; Rafiei, A.; Kardan, M.; Emami, S. 1,2,3-Triazole-based kojic acid analogs as potent tyrosinase inhibitors: Design, synthesis and biological evaluation. Bioorg. Chem. 2019, 82, 414–422. [Google Scholar] [CrossRef]
  18. Lima, C.R.; Silva, J.R.A.; De Tássia Carvalho Cardoso, É.; Silva, E.O.; Lameira, J.; Do Nascimento, J.L.M.; do Socorro Barros Brasil, D.; Alves, C.N. Combined Kinetic Studies and Computational Analysis on Kojic Acid Analogs as Tyrosinase Inhibitors. Molecules 2014, 19, 9591–9605. [Google Scholar] [CrossRef] [Green Version]
  19. Martins, L.S.; Lameira, J.; Kruger, H.G.H.G.; Alves, C.N.; Silva, J.R.A. Evaluating the Performance of a Non-Bonded Cu2+ Model Including Jahn−Teller Effect into the Binding of Tyrosinase Inhibitors. Int. J. Mol. Sci. 2020, 21, 4783. [Google Scholar] [CrossRef]
  20. Brasil, E.M.; Canavieira, L.M.; Cardoso, É.T.C.; Silva, E.O.; Lameira, J.; Nascimento, J.L.M.; Eifler-Lima, V.L.; Macchi, B.M.; Sriram, D.; Bernhardt, P.V.; et al. Inhibition of tyrosinase by 4 H -chromene analogs: Synthesis, kinetic studies, and computational analysis. Chem. Biol. Drug Des. 2017, 90, 804–810. [Google Scholar] [CrossRef]
  21. Canavieira, L.M.; Brasil, E.M.; Silva, T.d.M.e.; Borges, R.d.S.; Silva, J.R.A.; Lameira, J.; Bernhardt, P.V.; Williams, C.M.; Alves, C.N. Experimental and theoretical approaches for the development of 4H-Chromene derivatives as inhibitors of tyrosinase. Mol. Simul. 2021, 47, 762–770. [Google Scholar] [CrossRef]
  22. Thomsen, R.; Christensen, M.H. MolDock: A New Technique for High-Accuracy Molecular Docking. J. Med. Chem. 2006, 49, 3315–3321. [Google Scholar] [CrossRef] [PubMed]
  23. Warren, G.L.; Andrews, C.W.; Capelli, A.-M.; Clarke, B.; LaLonde, J.; Lambert, M.H.; Lindvall, M.; Nevins, N.; Semus, S.F.; Senger, S.; et al. A Critical Assessment of Docking Programs and Scoring Functions. J. Med. Chem. 2006, 49, 5912–5931. [Google Scholar] [CrossRef] [PubMed]
  24. Bijelic, A.; Pretzler, M.; Molitor, C.; Zekiri, F.; Rompel, A. The Structure of a Plant Tyrosinase from Walnut Leaves Reveals the Importance of “Substrate-Guiding Residues” for Enzymatic Specificity. Angew. Chemie Int. Ed. 2015, 54, 14677–14680. [Google Scholar] [CrossRef] [PubMed] [Green Version]
  25. Goldfeder, M.; Kanteev, M.; Isaschar-Ovdat, S.; Adir, N.; Fishman, A. Determination of tyrosinase substrate-binding modes reveals mechanistic differences between type-3 copper proteins. Nat. Commun. 2014, 5, 4505. [Google Scholar] [CrossRef] [PubMed] [Green Version]
  26. Valdés-Tresanco, M.S.; Valdés-Tresanco, M.E.; Rubio-Carrasquilla, M.; Valiente, P.A.; Moreno, E. Tailored Parameterization of the LIE Method for Calculating the Binding Free Energy of Vps34-Inhibitor Complexes. ACS Omega 2021, 6, 29525–29536. [Google Scholar] [CrossRef]
  27. Carlsson, J.; Boukharta, L.; Åqvist, J. Combining Docking, Molecular Dynamics and the Linear Interaction Energy Method to Predict Binding Modes and Affinities for Non-nucleoside Inhibitors to HIV-1 Reverse Transcriptase. J. Med. Chem. 2008, 51, 2648–2656. [Google Scholar] [CrossRef]
  28. Tam, N.M.; Pham, M.Q.; Ha, N.X.; Nam, P.C.; Phung, H.T.T. Computational estimation of potential inhibitors from known drugs against the main protease of SARS-CoV-2. RSC Adv. 2021, 11, 17478–17486. [Google Scholar] [CrossRef]
  29. Hoelz, L.V.B.; Leal, V.F.; Rodrigues, C.R.; Pascutti, P.G.; Albuquerque, M.G.; Muri, E.M.F.; Dias, L.R.S. Molecular dynamics simulations of the free and inhibitor-bound cruzain systems in aqueous solvent: Insights on the inhibition mechanism in acidic pH. J. Biomol. Struct. Dyn. 2016, 34, 1969–1978. [Google Scholar] [CrossRef]
  30. Koulgi, S.; Jani, V.; Uppuladinne, M.V.N.; Sonavane, U.; Joshi, R. Remdesivir-bound and ligand-free simulations reveal the probable mechanism of inhibiting the RNA dependent RNA polymerase of severe acute respiratory syndrome coronavirus 2. RSC Adv. 2020, 10, 26792–26803. [Google Scholar] [CrossRef]
  31. Ferreira, L.G.; Dos Santos, R.N.; Oliva, G.; Andricopulo, A.D. Molecular Docking and Structure-Based Drug Design Strategies. Molecules 2015, 20, 13384–13421. [Google Scholar] [CrossRef] [Green Version]
  32. Marelius, J.; Kolmodin, K.; Feierberg, I.; Åqvist, J. Q: A molecular dynamics program for free energy calculations and empirical valence bond simulations in biomolecular systems. J. Mol. Graph. Model. 1998, 16, 213–225. [Google Scholar] [CrossRef]
  33. Bauer, P.; Barrozo, A.; Purg, M.; Amrein, B.A.; Esguerra, M.; Wilson, P.B.; Major, D.T.; Åqvist, J.; Kamerlin, S.C.L. Q6: A comprehensive toolkit for empirical valence bond and related free energy calculations. SoftwareX 2018, 7, 388–395. [Google Scholar] [CrossRef]
  34. Liao, Q.; Kamerlin, S.C.L.; Strodel, B. Development and Application of a Nonbonded Cu 2+ Model That Includes the Jahn–Teller Effect. J. Phys. Chem. Lett. 2015, 6, 2657–2662. [Google Scholar] [CrossRef] [PubMed]
  35. Amaro, R.E.; Baron, R.; McCammon, J.A. An improved relaxed complex scheme for receptor flexibility in computer-aided drug design. J. Comput. Aided. Mol. Des. 2008, 22, 693–705. [Google Scholar] [CrossRef] [PubMed] [Green Version]
  36. Murcko, M.A. Computational methods to predict binding free energy in ligand-receptor complexes. J. Med. Chem. 1995, 38, 4953–4967. [Google Scholar] [CrossRef] [PubMed]
  37. Åqvist, J.; Medina, C.; Samuelsson, J.E. A new method for predicting binding affinity in computer-aided drug design. Protein Eng. 1994, 7, 385–391. [Google Scholar] [CrossRef]
  38. Hansson, T.; Marelius, J.; Åqvist, J. Ligand binding affinity prediction by linear interaction energy methods. J. Comput. Aided. Mol. Des. 1998, 27–35. [Google Scholar] [CrossRef]
  39. Vanga, S.R.; Sävmarker, J.; Ng, L.; Larhed, M.; Hallberg, M.; Åqvist, J.; Hallberg, A.; Chai, S.Y.; Gutiérrez-De-Terán, H. Structural Basis of Inhibition of Human Insulin-Regulated Aminopeptidase (IRAP) by Aryl Sulfonamides. ACS Omega 2018, 3, 4509–4521. [Google Scholar] [CrossRef] [Green Version]
  40. ChemAxon MarvinSketch. MarvinSketch, Version 22.18. 2022. Available online: https://macdownload.informer.com/marvinsketch/ (accessed on 4 November 2022).
  41. Stewart, J.J.P. Optimization of parameters for semiempirical methods V: Modification of NDDO approximations and application to 70 elements. J. Mol. Model. 2007, 13, 1173–1213. [Google Scholar] [CrossRef]
  42. Frisch, M.J.; Trucks, G.W.; Schlegel, H.B.; Scuseria, G.E.; Robb, M.A.; Cheeseman, J.R.; Scalmani, G.; Barone, V.; Mennucci, B.; Petersson, G.A.; et al. Gaussian 09; Gaussian, Inc.: Wallingford, CT, USA, 2009. [Google Scholar]
  43. Kitchen, D.; Decornez, H.; Furr, J.R.; Bajorath, J. Docking and scoring in virtual screening for drug discovery: Methods and applications. Nat. Rev. Drug. Discov. 2004, 3, 935–949. [Google Scholar] [CrossRef] [PubMed]
  44. Jorgensen, W.; Maxwell, D.; Tirado-rives, J. Development and testing of the OPLS all-atom force field on conformational energetics and properties of organic liquids. J. Am. Chem. Soc. 1996, 118, 11225–11236. [Google Scholar] [CrossRef]
  45. Jorgensen, W.L.; Chandrasekhar, J.; Madura, J.D.; Impey, R.W.; Klein, M.L.; Jorgensen, W.L.; Chandrasekhar, J.; Madura, J.D.; Impey, R.W.; Klein, M.L. Comparison of simple potential functions for simulating liquid water. J. Chem. Phys 1983, 79. [Google Scholar] [CrossRef]
  46. Schrödinger Schrödinger Release 2020-1: MacroModel; Schrödinger, LLC: New York, NY, USA, 2020.
  47. Li, H.; Robertson, A.D.; Jensen, J.H. Very fast empirical prediction and rationalization of protein pKa values. Proteins 2005, 61, 704–721. [Google Scholar] [CrossRef] [PubMed]
  48. King, G.; Warshel, A. A surface constrained all-atom solvent model for effective simulations of polar solutions. J. Chem. Phys. 1989, 91, 3647–3661. [Google Scholar] [CrossRef]
  49. Diaz, L.; Bujons, J.; Delgado, A.; Gutierrez-de-Terán, H.; Aqvist, J. Computational prediction of structure-activity relationships for the binding of aminocyclitols to beta-glucocerebrosidase. J. Chem. Inf. Model 2011, 51, 601–611. [Google Scholar] [CrossRef]
  50. Ryckaert, J.-P.; Ciccotti, G.; Berendsen, H.J. Numerical integration of the cartesian equations of motion of a system with constraints: Molecular dynamics of n-alkanes. J. Comput. Phys. 1977, 23, 327–341. [Google Scholar] [CrossRef] [Green Version]
  51. Yung-Chi, C.; Prusoff, W.H. Relationship between the inhibition constant (KI) and the concentration of inhibitor which causes 50 percent inhibition (I50) of an enzymatic reaction. Biochem. Pharmacol. 1973, 22, 3099–3108. [Google Scholar] [CrossRef]
Figure 1. Reactions catalyzed by the TYR enzyme in melanogenesis.
Molecules 27 08141 g001
Figure 2. Three-dimensional overlapping of KA (green), 6h (orange) and 6o (yellow) into TYRBm catalytic site by molecular docking. Cu2+ ions are shown as brown spheres. H atoms are omitted for clarity. All PDB files are provided as Supplementary Materials.
Molecules 27 08141 g002
Figure 3. Calculated LIE (∆GLIE) vs. experimental (∆GEXP) binding free energies (Kcal/mol). The red dashed line represents the perfect agreement between ∆GLIE and ∆GEXP.
Molecules 27 08141 g003
Figure 4. Residual interaction energies (in Kcal/mol) over 6h (blue) and 6o (orange) inhibitors used in the LIE calculations for the residues that contribute most to the ligand-surrounding (A) van der Waals (vdW) and (B) electrostatic (ele) contributions. The values for all TYR systems are provided as Supplementary Materials (Tables S2 and S3).
Molecules 27 08141 g004
Figure 5. Four TYR residues make the most intense vdW contributions to binding for the inhibitors 6h (orange color for C atoms) and 6o (yellow color for C atoms) inhibitors. Cu2+ ions are shown as light blue spheres.
Molecules 27 08141 g005
Figure 6. Two-dimensional structures of 1,2,3-triazole-based KA analogs.
Molecules 27 08141 g006
Table 1. Molecular docking results (MOLDOCK scoring, Kcal/mol) and experimental activity (IC50, µM) of KA analogs in complex with TYRBm.
KA AnalogMOLDOCK Scoring IC50 *
6a−120.781.33
6b−132.330.88
6c−132.030.69
6d−128.156.80
6e−125.681.07
6f−136.380.99
6g−129.551.12
6h−139.066.29
6i−132.920.52
6j−135.602.64
6k−132.851.32
6l−125.931.24
6m−130.460.87
6n−130.170.74
6o−130.150.06
6p−131.510.30
* Values obtained from Ashooriha et al. [17].
Table 2. RMSD values (in Å) for protein and ligand atoms from TYR systems.
SystemProtein RMSDLigand RMSD
TYR-6a0.44 ± 0.050.47 ± 0.15
TYR-6b0.50 ± 0.040.80 ± 0.20
TYR-6c0.46 ± 0.070.53 ± 0.14
TYR-6d0.40 ± 0.030.51 ± 0.16
TYR-6e0.40 ± 0.050.60 ± 0.20
TYR-6f0.44 ± 0.040.81 ± 0.24
TYR-6g0.45 ± 0.030.79 ± 0.21
TYR-6h0.43 ± 0.040.54 ± 0.13
TYR-6i0.44 ± 0.050.51 ± 0.13
TYR-6j0.43 ± 0.030.47 ± 0.12
TYR-6k0.44 ± 0.040.62 ± 0.16
TYR-6l0.43 ± 0.050.57 ± 0.13
TYR-6m0.49 ± 0.060.55 ± 0.13
TYR-6n0.47 ± 0.040.79 ± 0.19
TYR-6o0.39 ± 0.040.49 ± 0.13
TYR-6p0.46 ± 0.060.50 ± 0.13
Table 3. LIE-calculated (∆GLIE) and experimental (∆GEXP) binding free energies of KA analogs in complex with TYRBm. All values are reported in Kcal/mol.
KA Analog U v d W f r e e U e l e f r e e U v d W b o u n d U e l e b o u n d ∆GLIE∆GEXP
6a−26.21 ± 0.01−26.70 ± 0.49−49.16 ± 0.98−84.09 ± 0.24−8.03 ± 0.45−8.07
6b−26.31 ± 0.06−26.91 ± 0.10−46.90 ± 0.34−85.71 ± 0.63−8.13 ± 0.34−8.31
6c−27.77 ± 0.02−25.57 ± 0.17−49.79 ± 0.41−84.45 ± 0.70−8.41 ± 0.40−8.46
6e−26.24 ± 0.03−26.97 ± 0.31−46.53 ± 0.21−85.27 ± 0.76−7.89 ± 0.44−8.20
6f−27.61 ± 0.02−25.32 ± 0.18−50.79 ± 0.90−82.86 ± 0.89−8.13 ± 0.56−8.24
6h−28.48 ± 0.08−30.39 ± 0.45−51.28 ± 0.29−89.28 ± 0.78−6.20 ± 0.47−7.14
6i−29.42 ± 0.04−29.93 ± 0.02−55.29 ± 0.51−89.10 ± 0.26−9.21 ± 0.20−8.63
6j−30.14 ± 0.08−42.95 ± 0.30−55.83 ± 0.37−99.47 ± 0.97−7.07 ± 0.53−7.66
6l−28.59 ± 0.03−28.16 ± 0.16−50.52 ± 0.68−86.78 ± 1.01−8.30 ± 0.56−8.11
6m−31.90 ± 0.10−33.77 ± 0.61−57.72 ± 0.40−90.52 ± 0.99−8.31 ± 0.68−8.32
6n−28.72 ± 0.09−29.18 ± 0.74−49.41 ± 0.79−88.77 ± 0.90−8.44 ± 0.76−8.42
6o−29.99 ± 0.30−27.33 ± 0.05−61.99 ± 0.37−87.15 ± 0.24−10.56 ± 0.23−9.91
6p−30.01 ± 0.20−27.97 ± 0.43−61.40 ± 0.91−86.21 ± 0.22−9.80 ± 0.44−8.95
Publisher’s Note: MDPI stays neutral with regard to jurisdictional claims in published maps and institutional affiliations.

