
Effects of Hydroxypropyl-Beta-Cyclodextrin on Cultured Brain Endothelial Cells
 , , , , ,
  , , , and
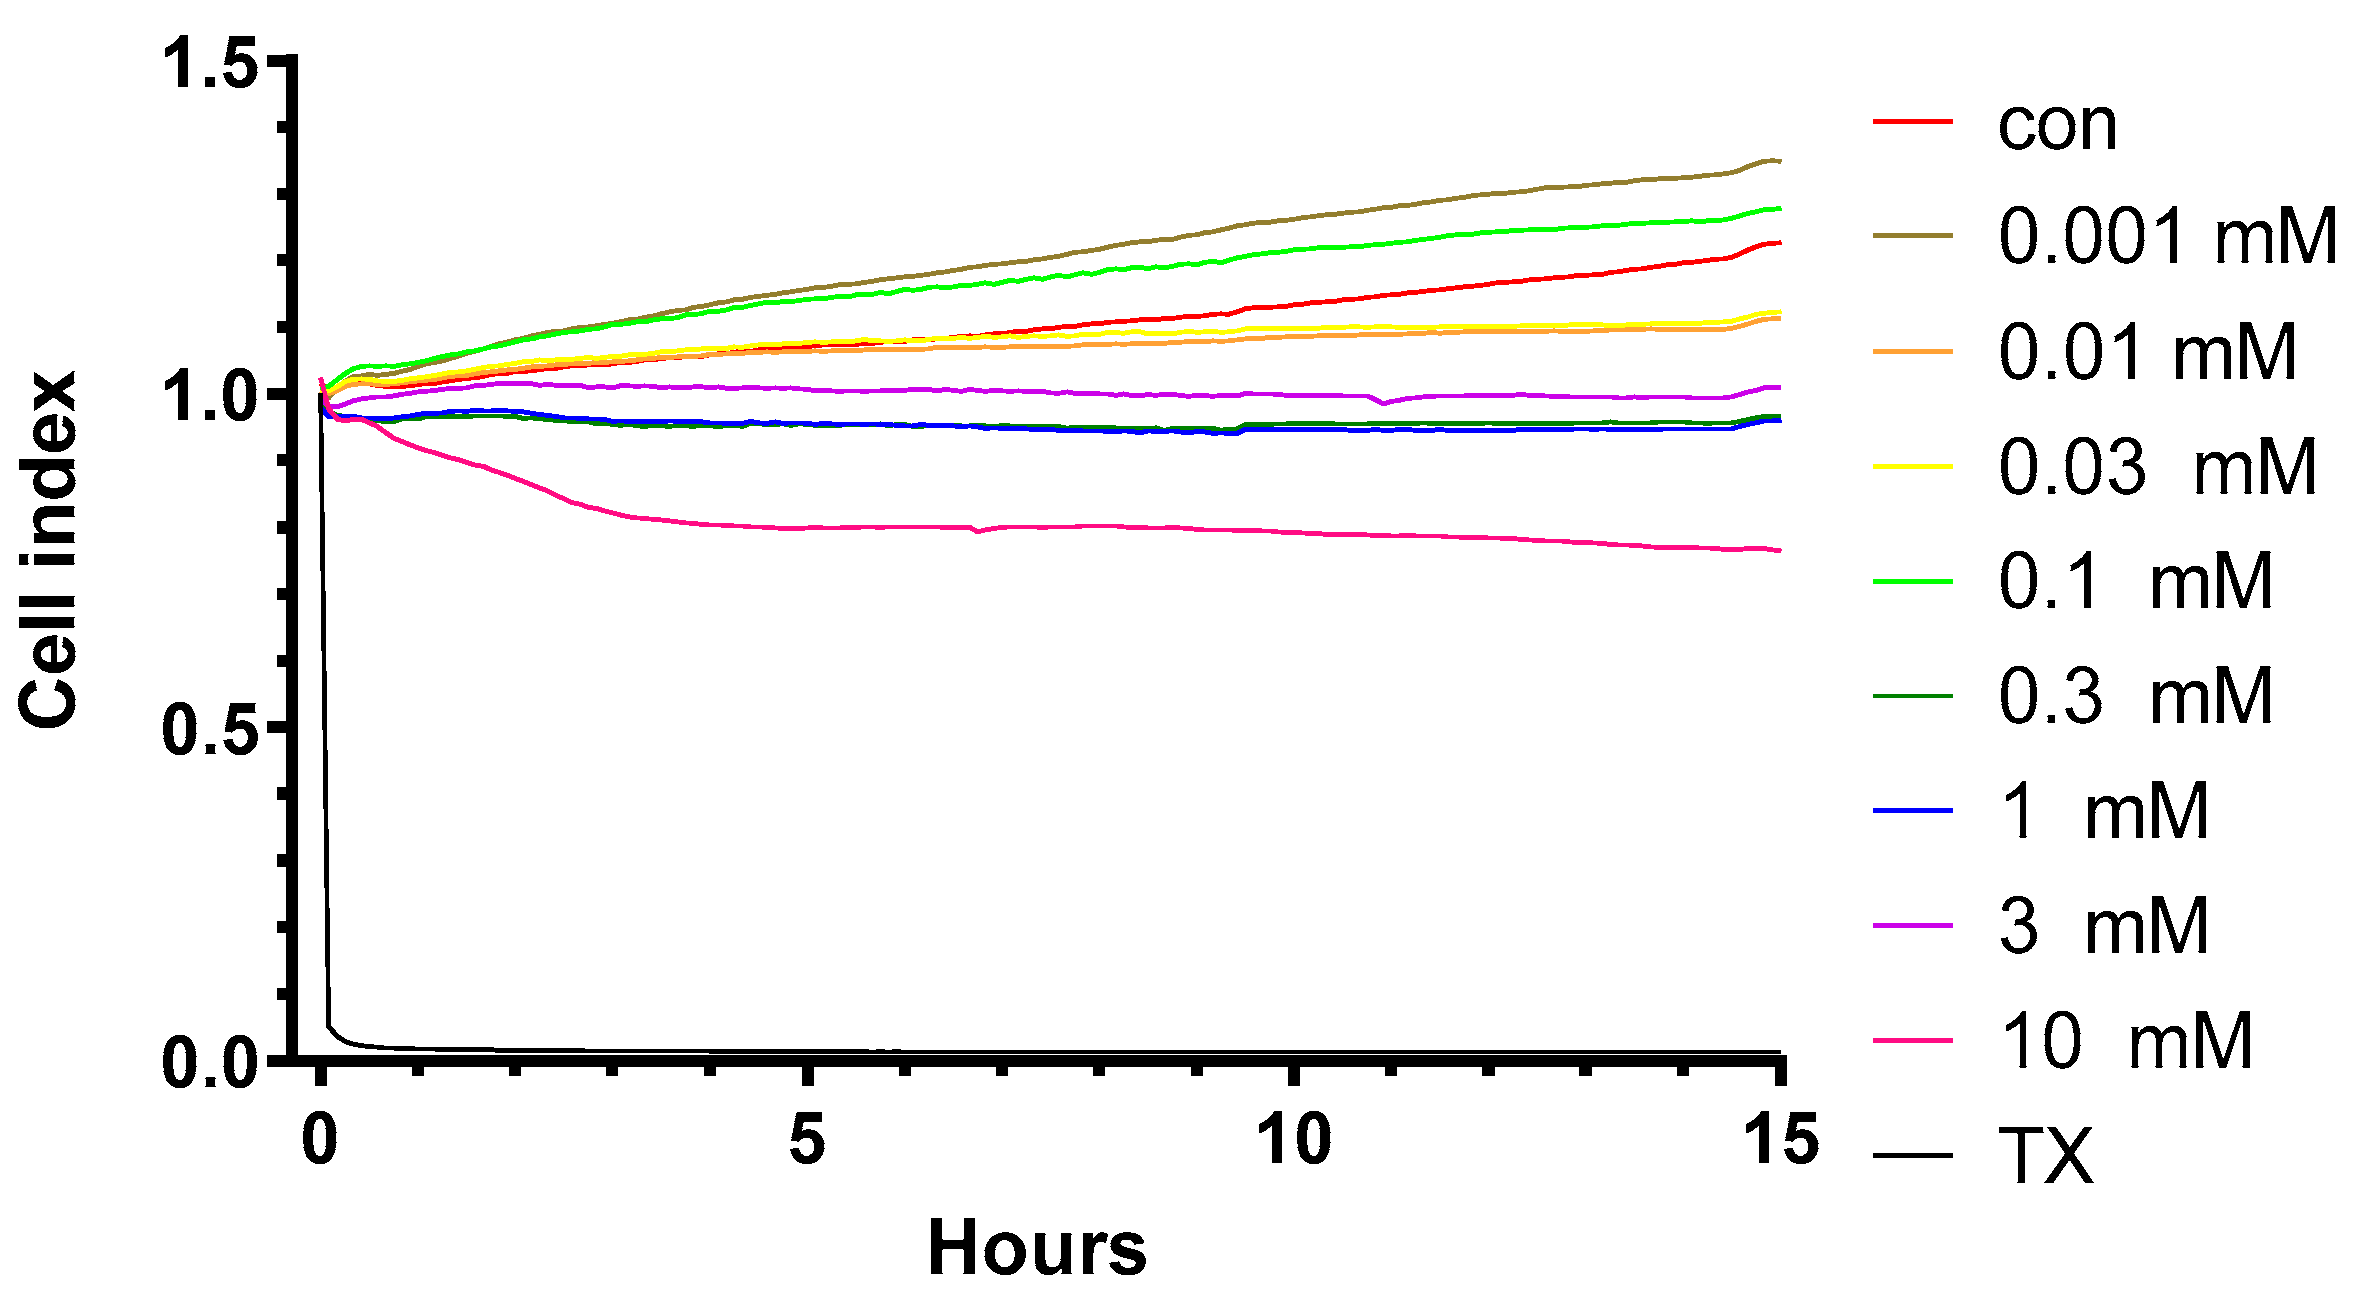
Abstract
:1. Introduction
2. Results
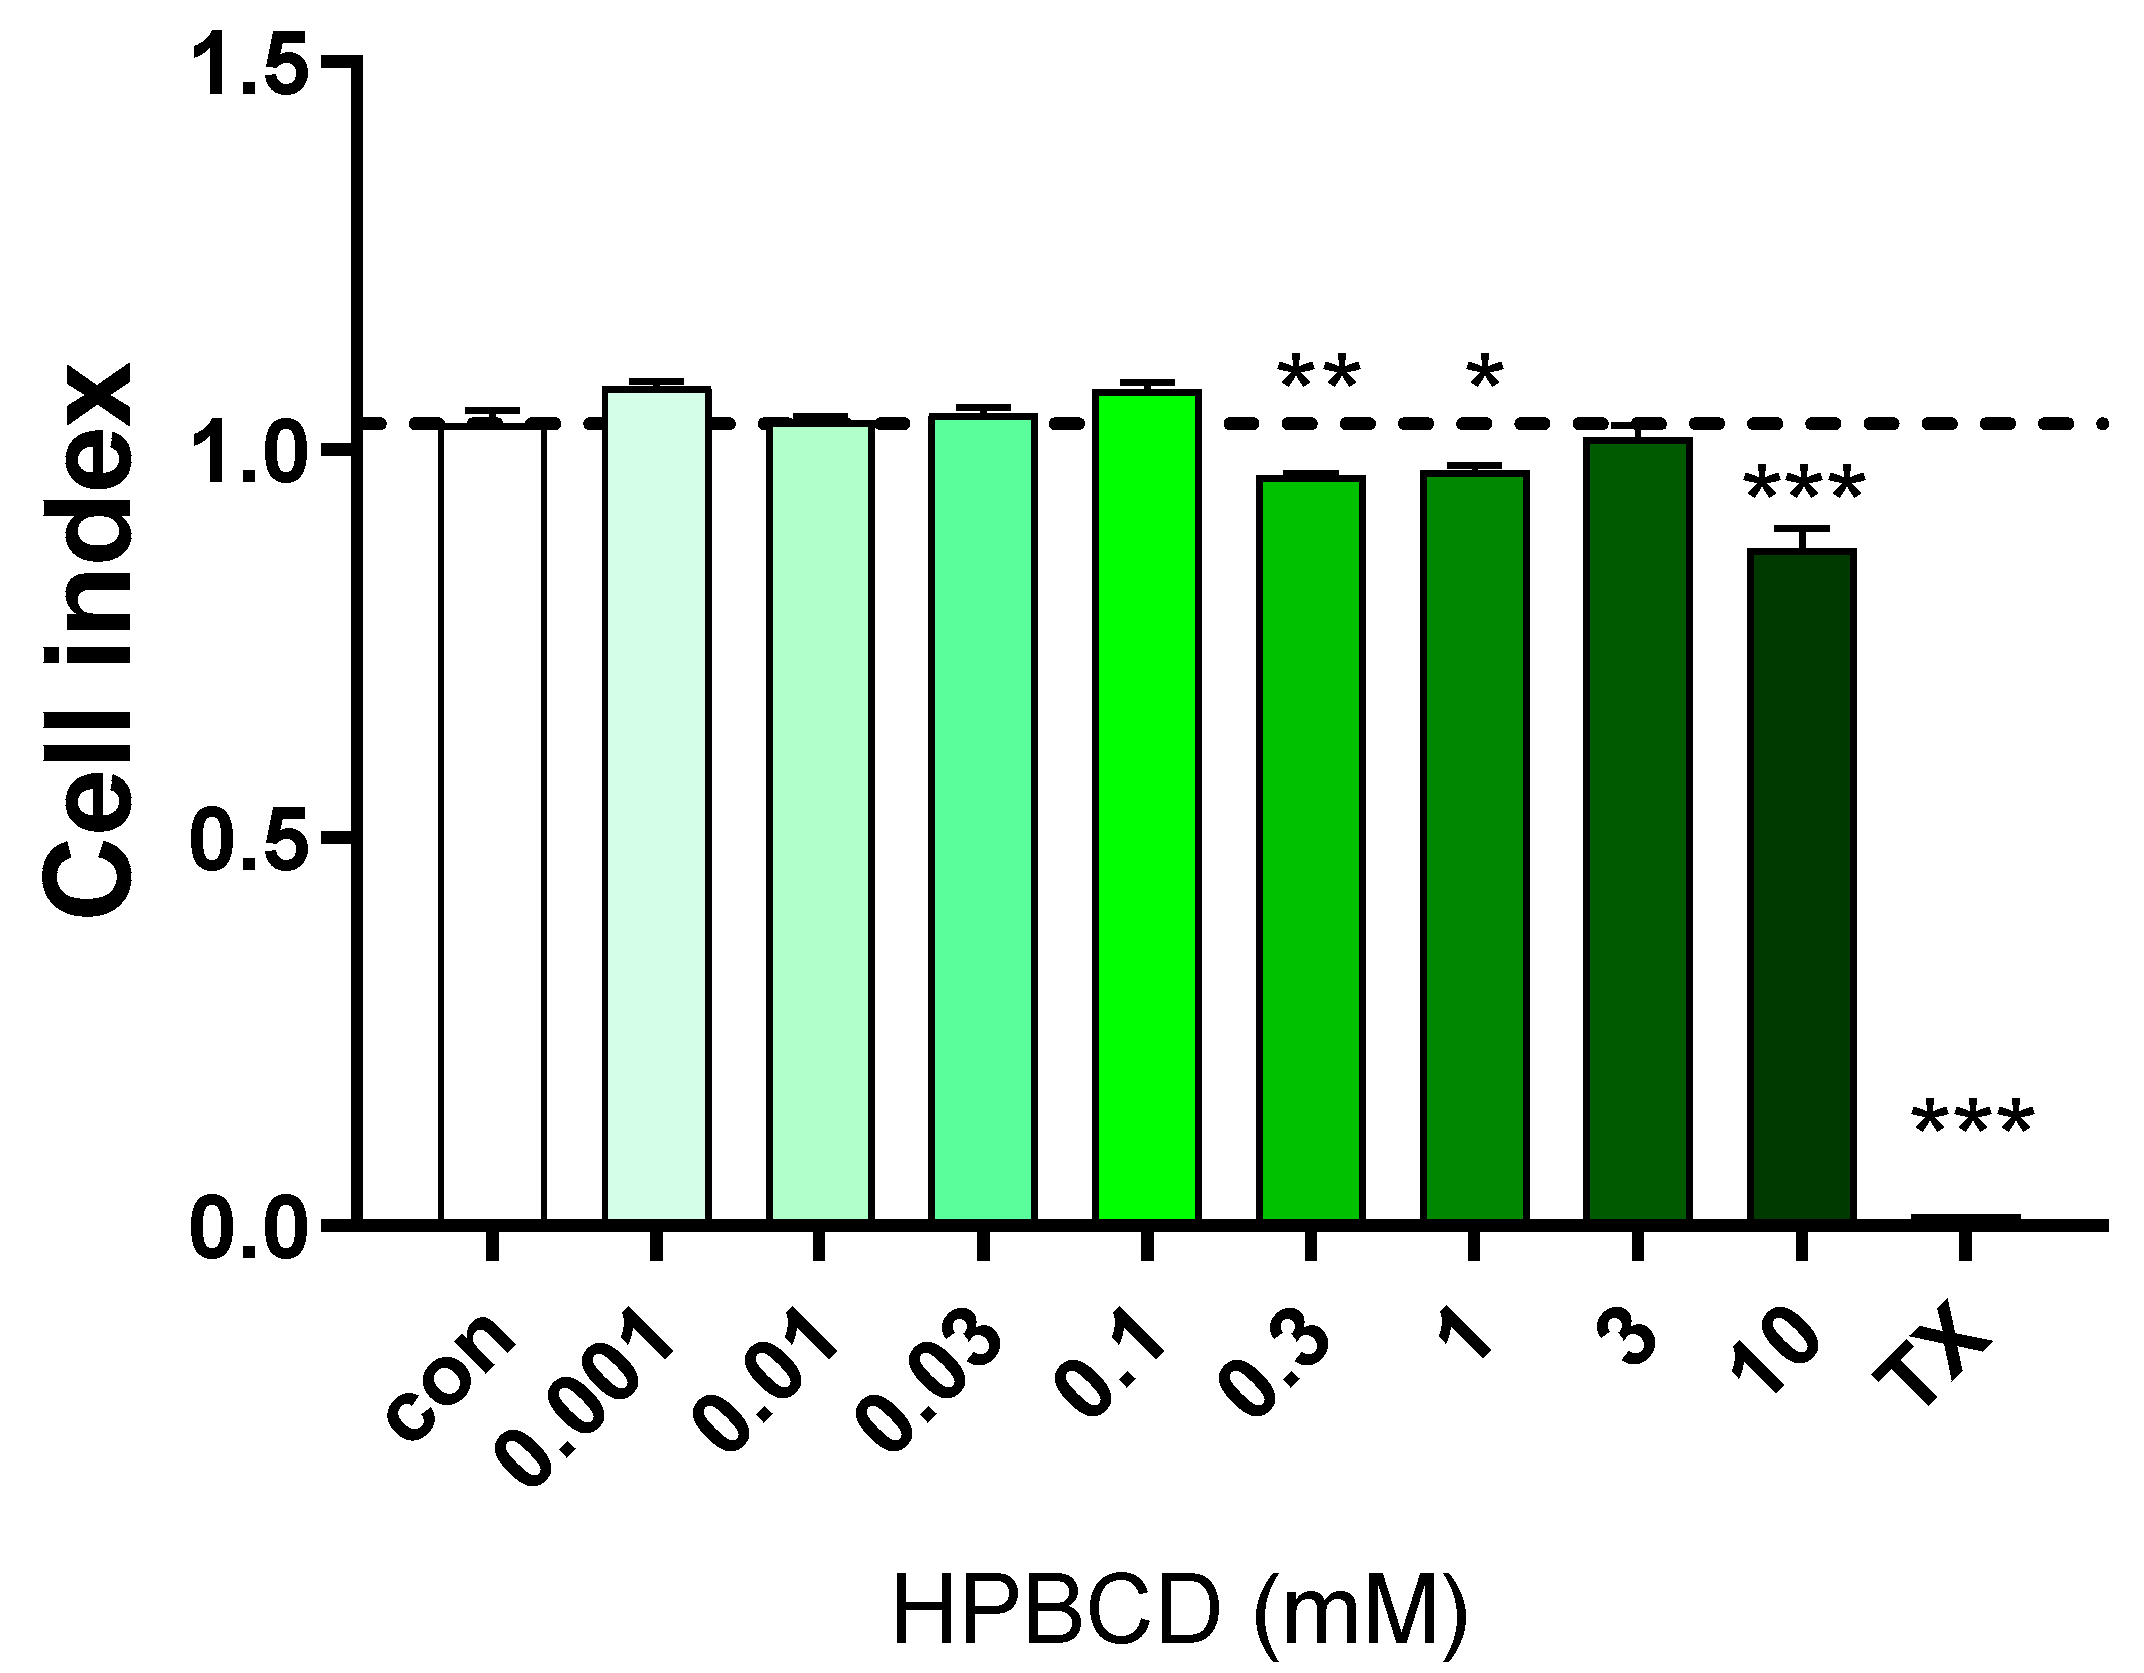
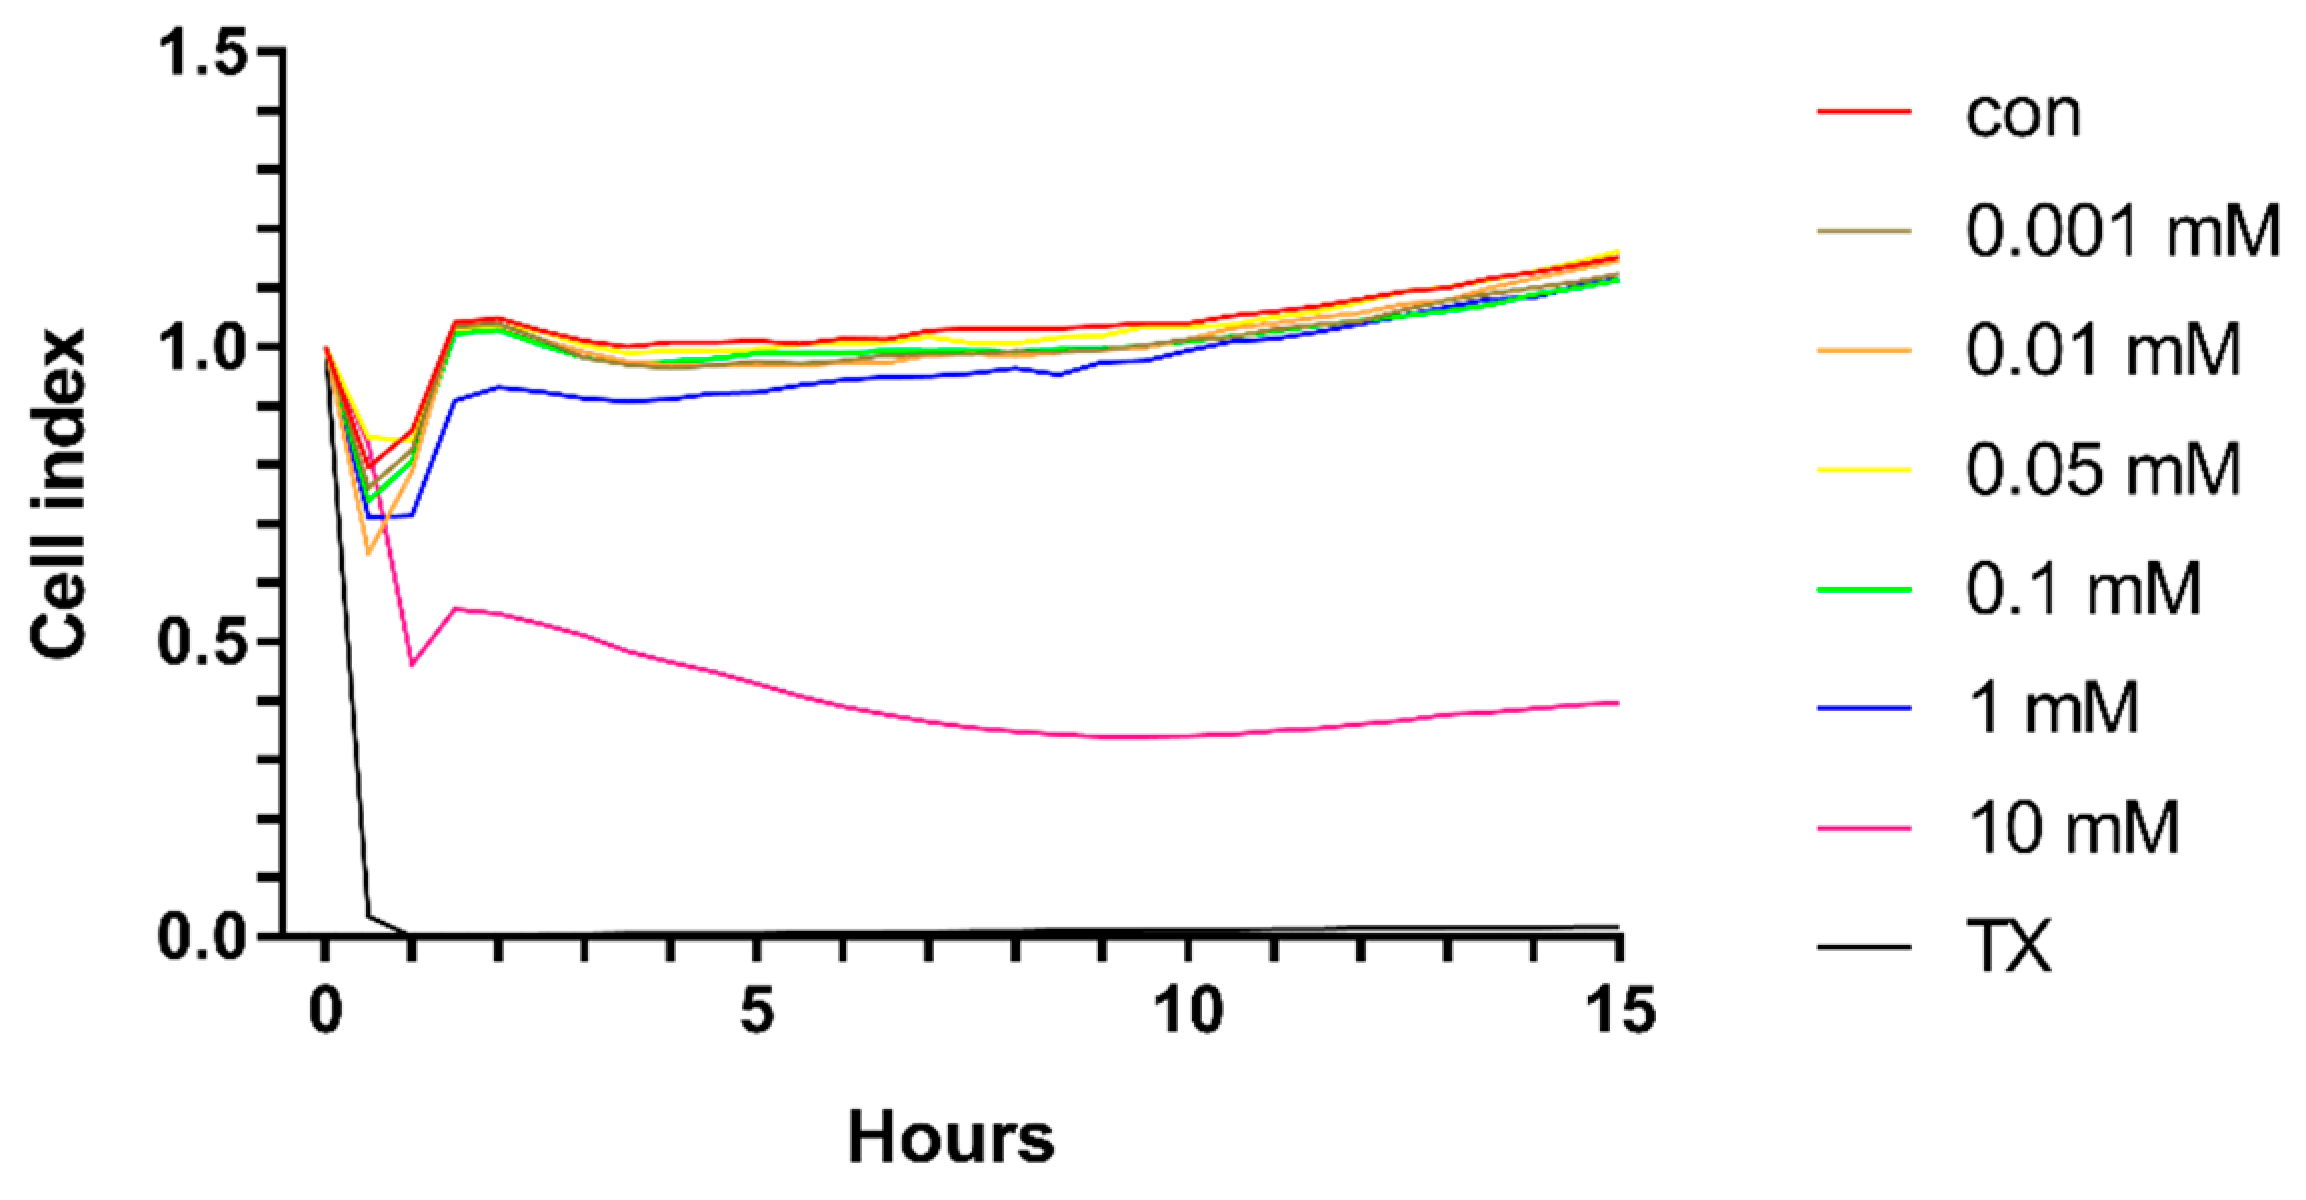
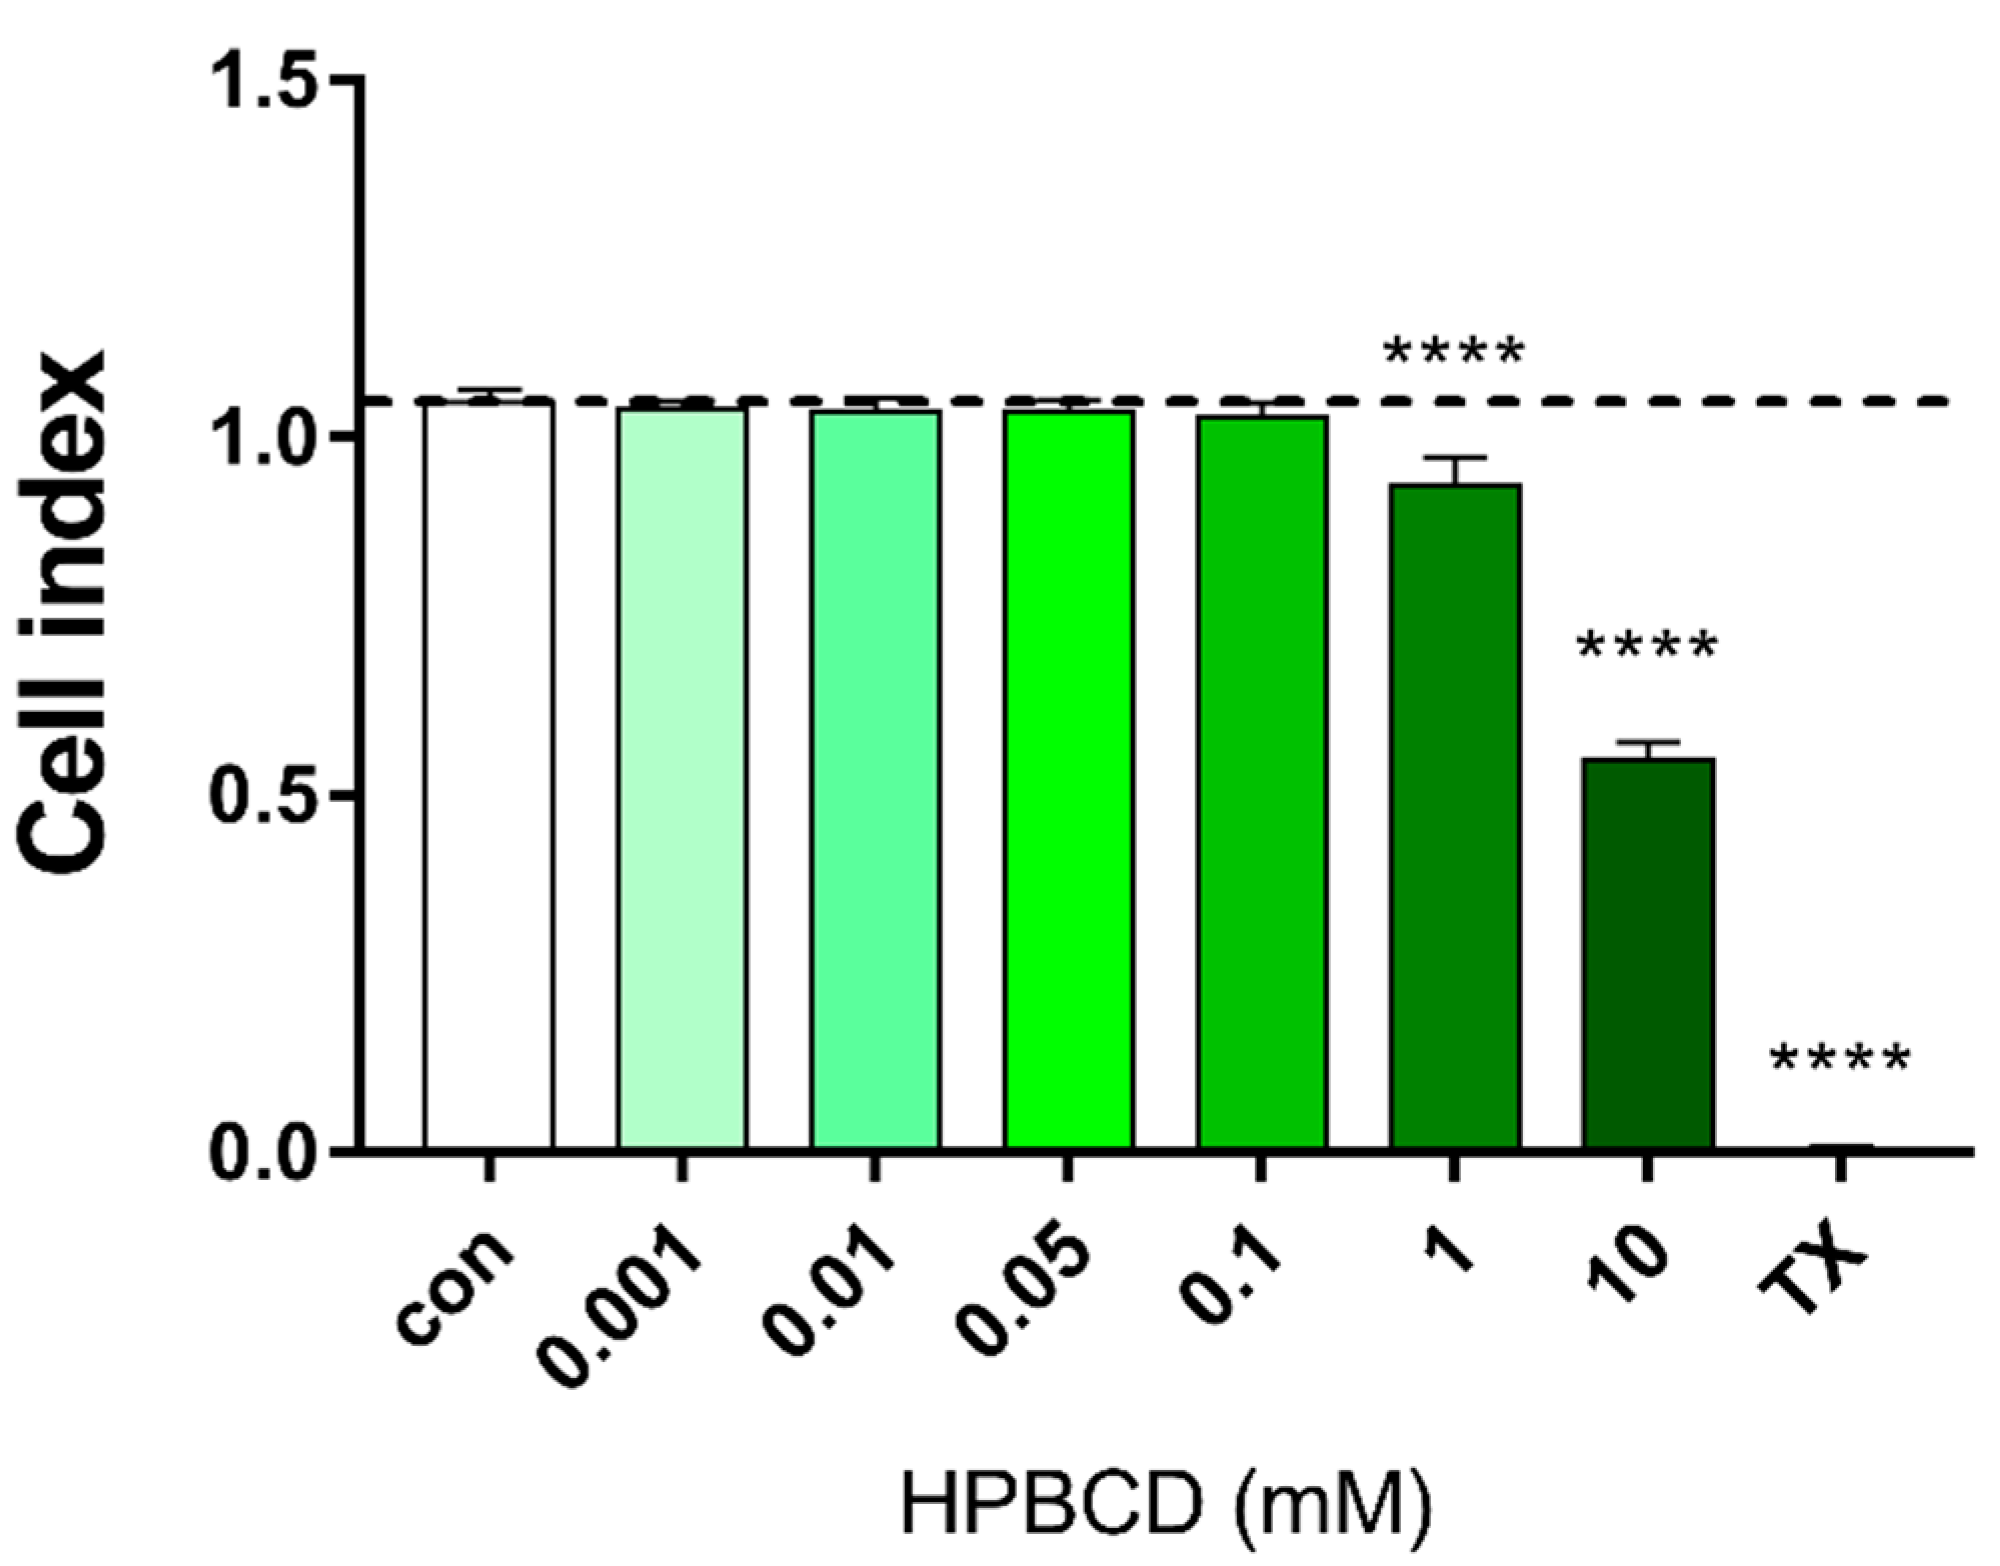
2.1. Effect of HPBCD on Viability of Brain Endothelial Cells
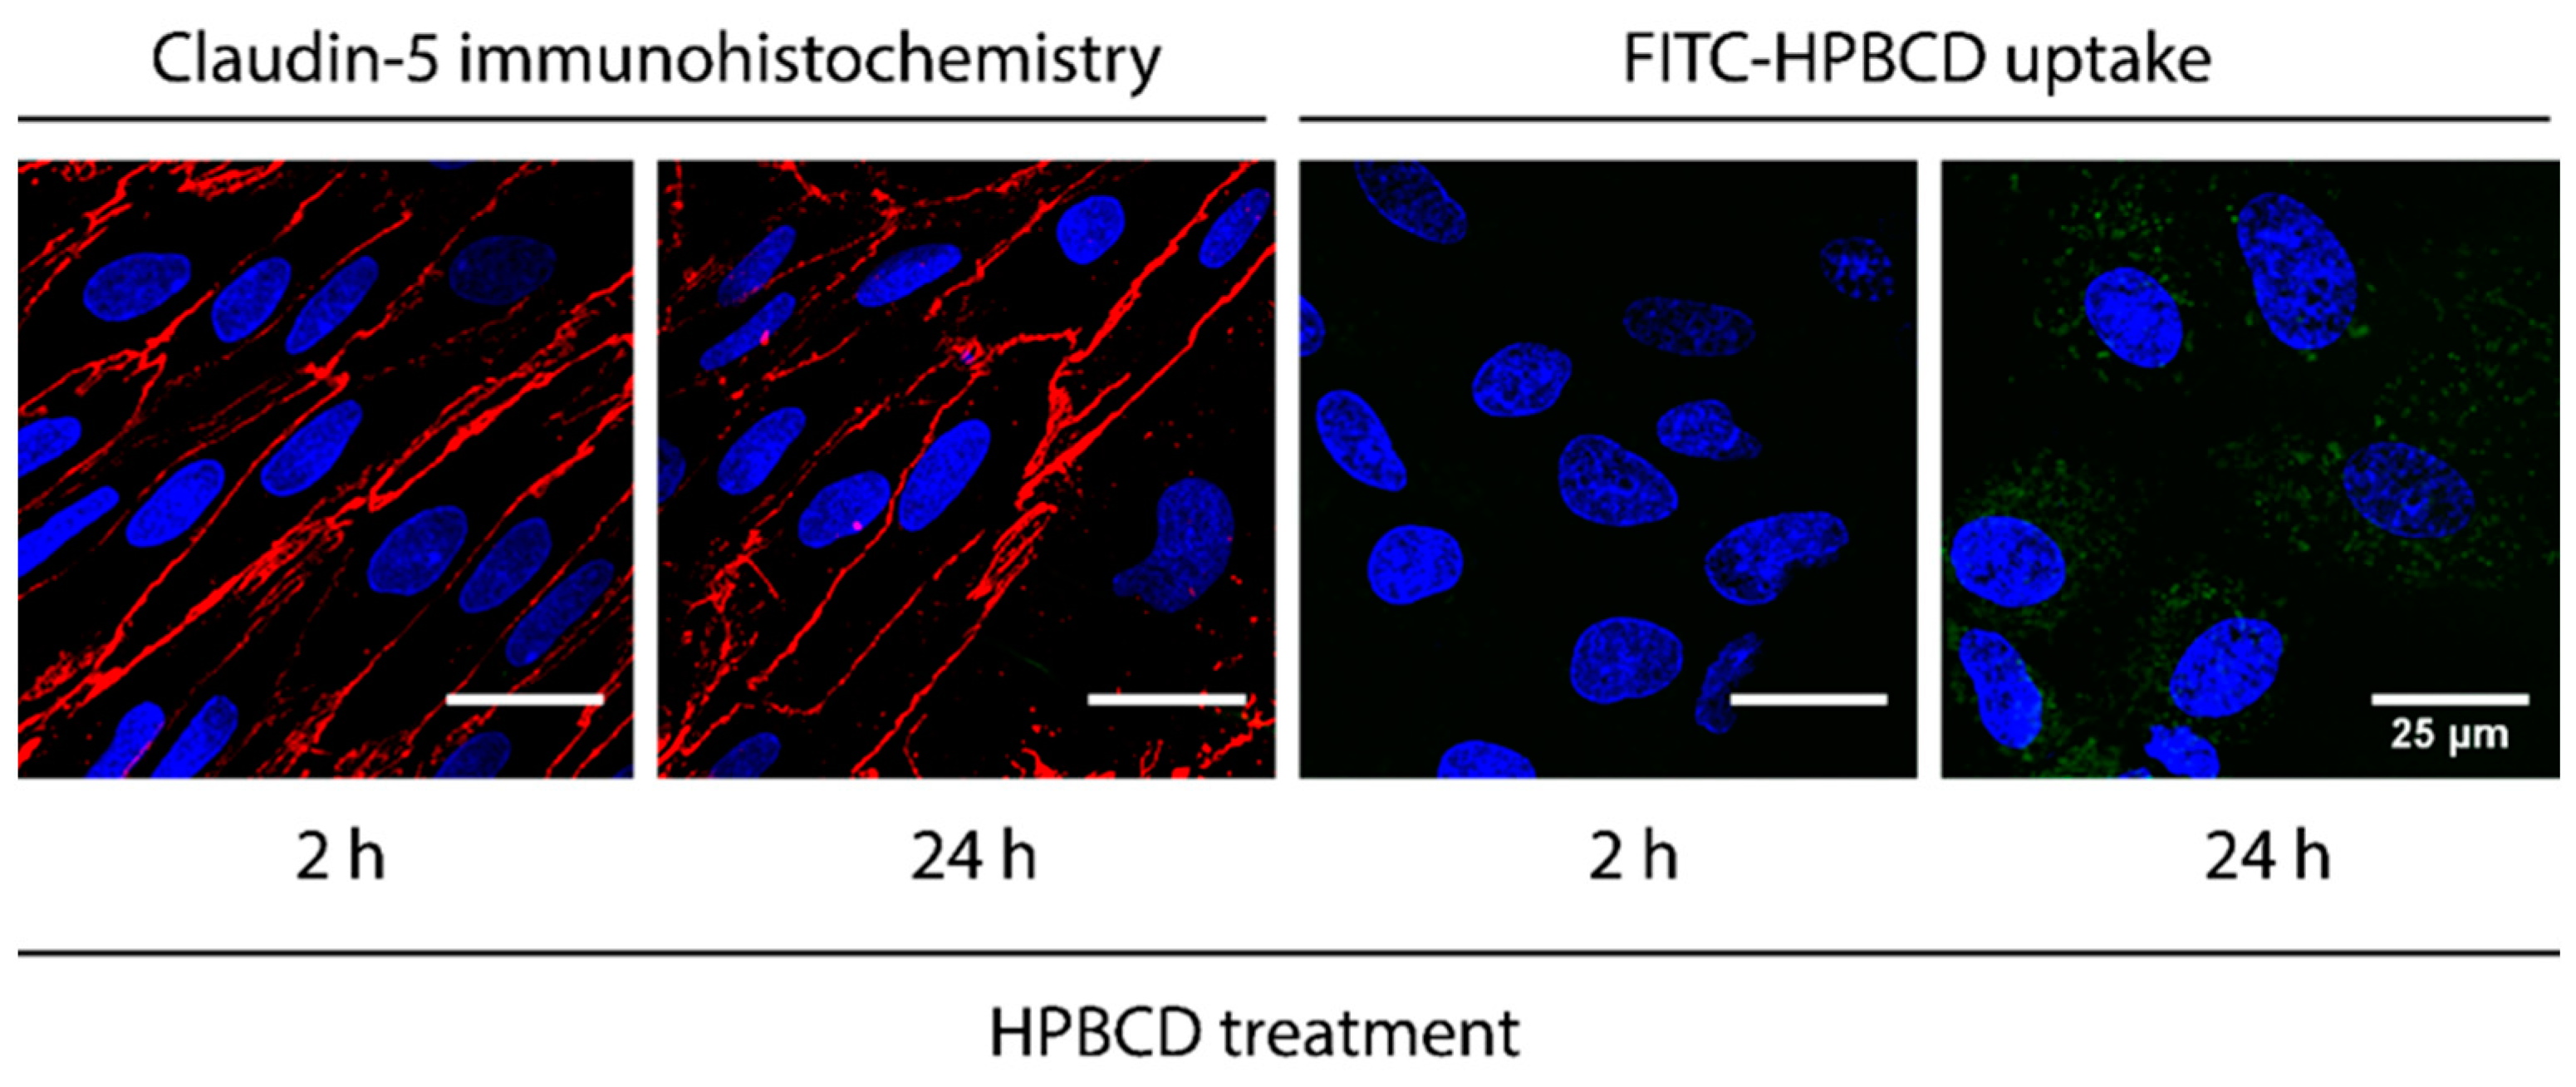
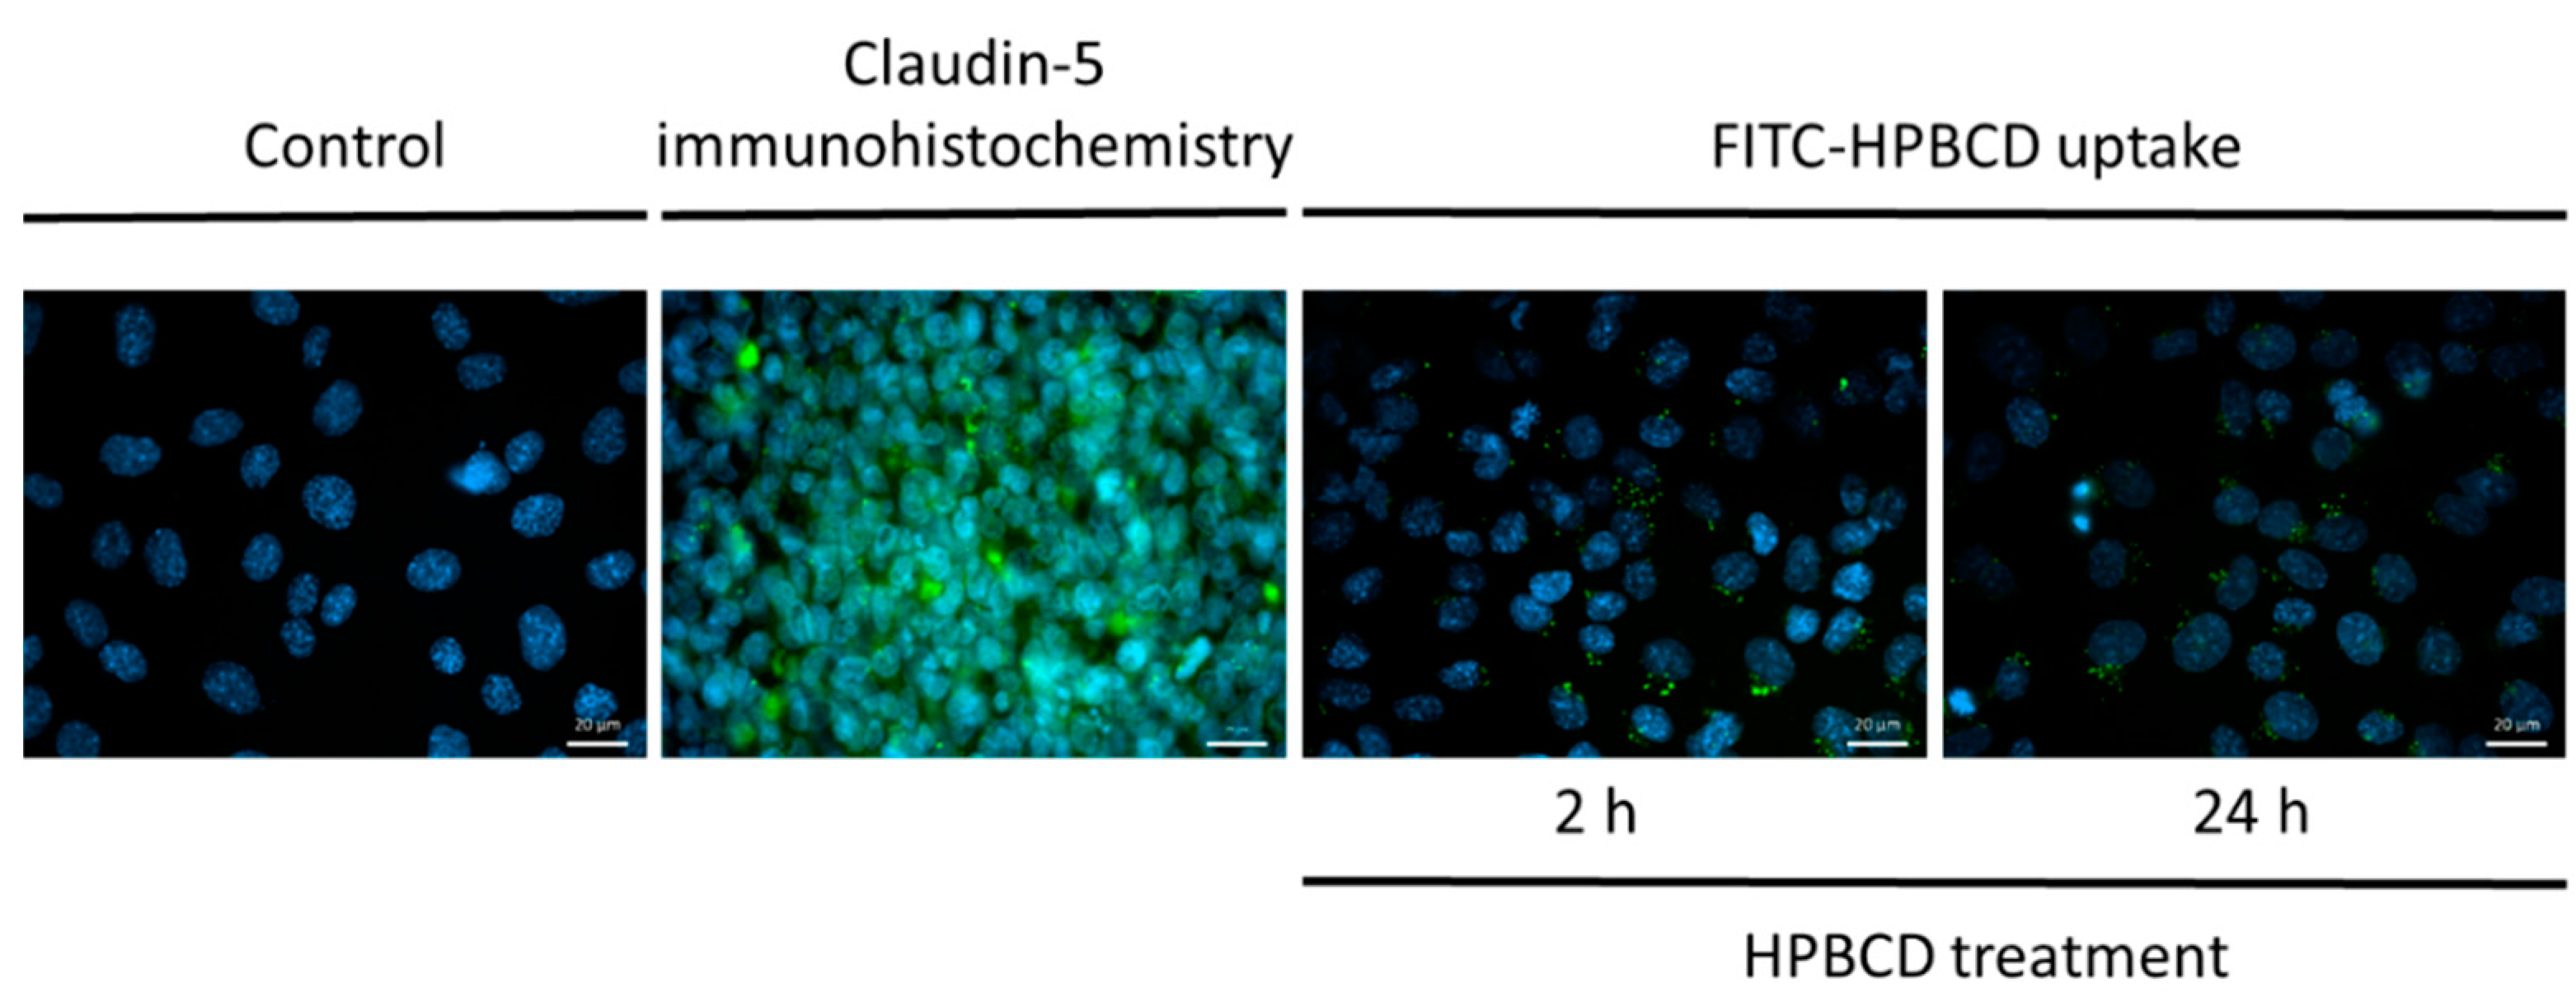
2.2. Uptake of FITC-HPBCD in Brain Endothelial Cells
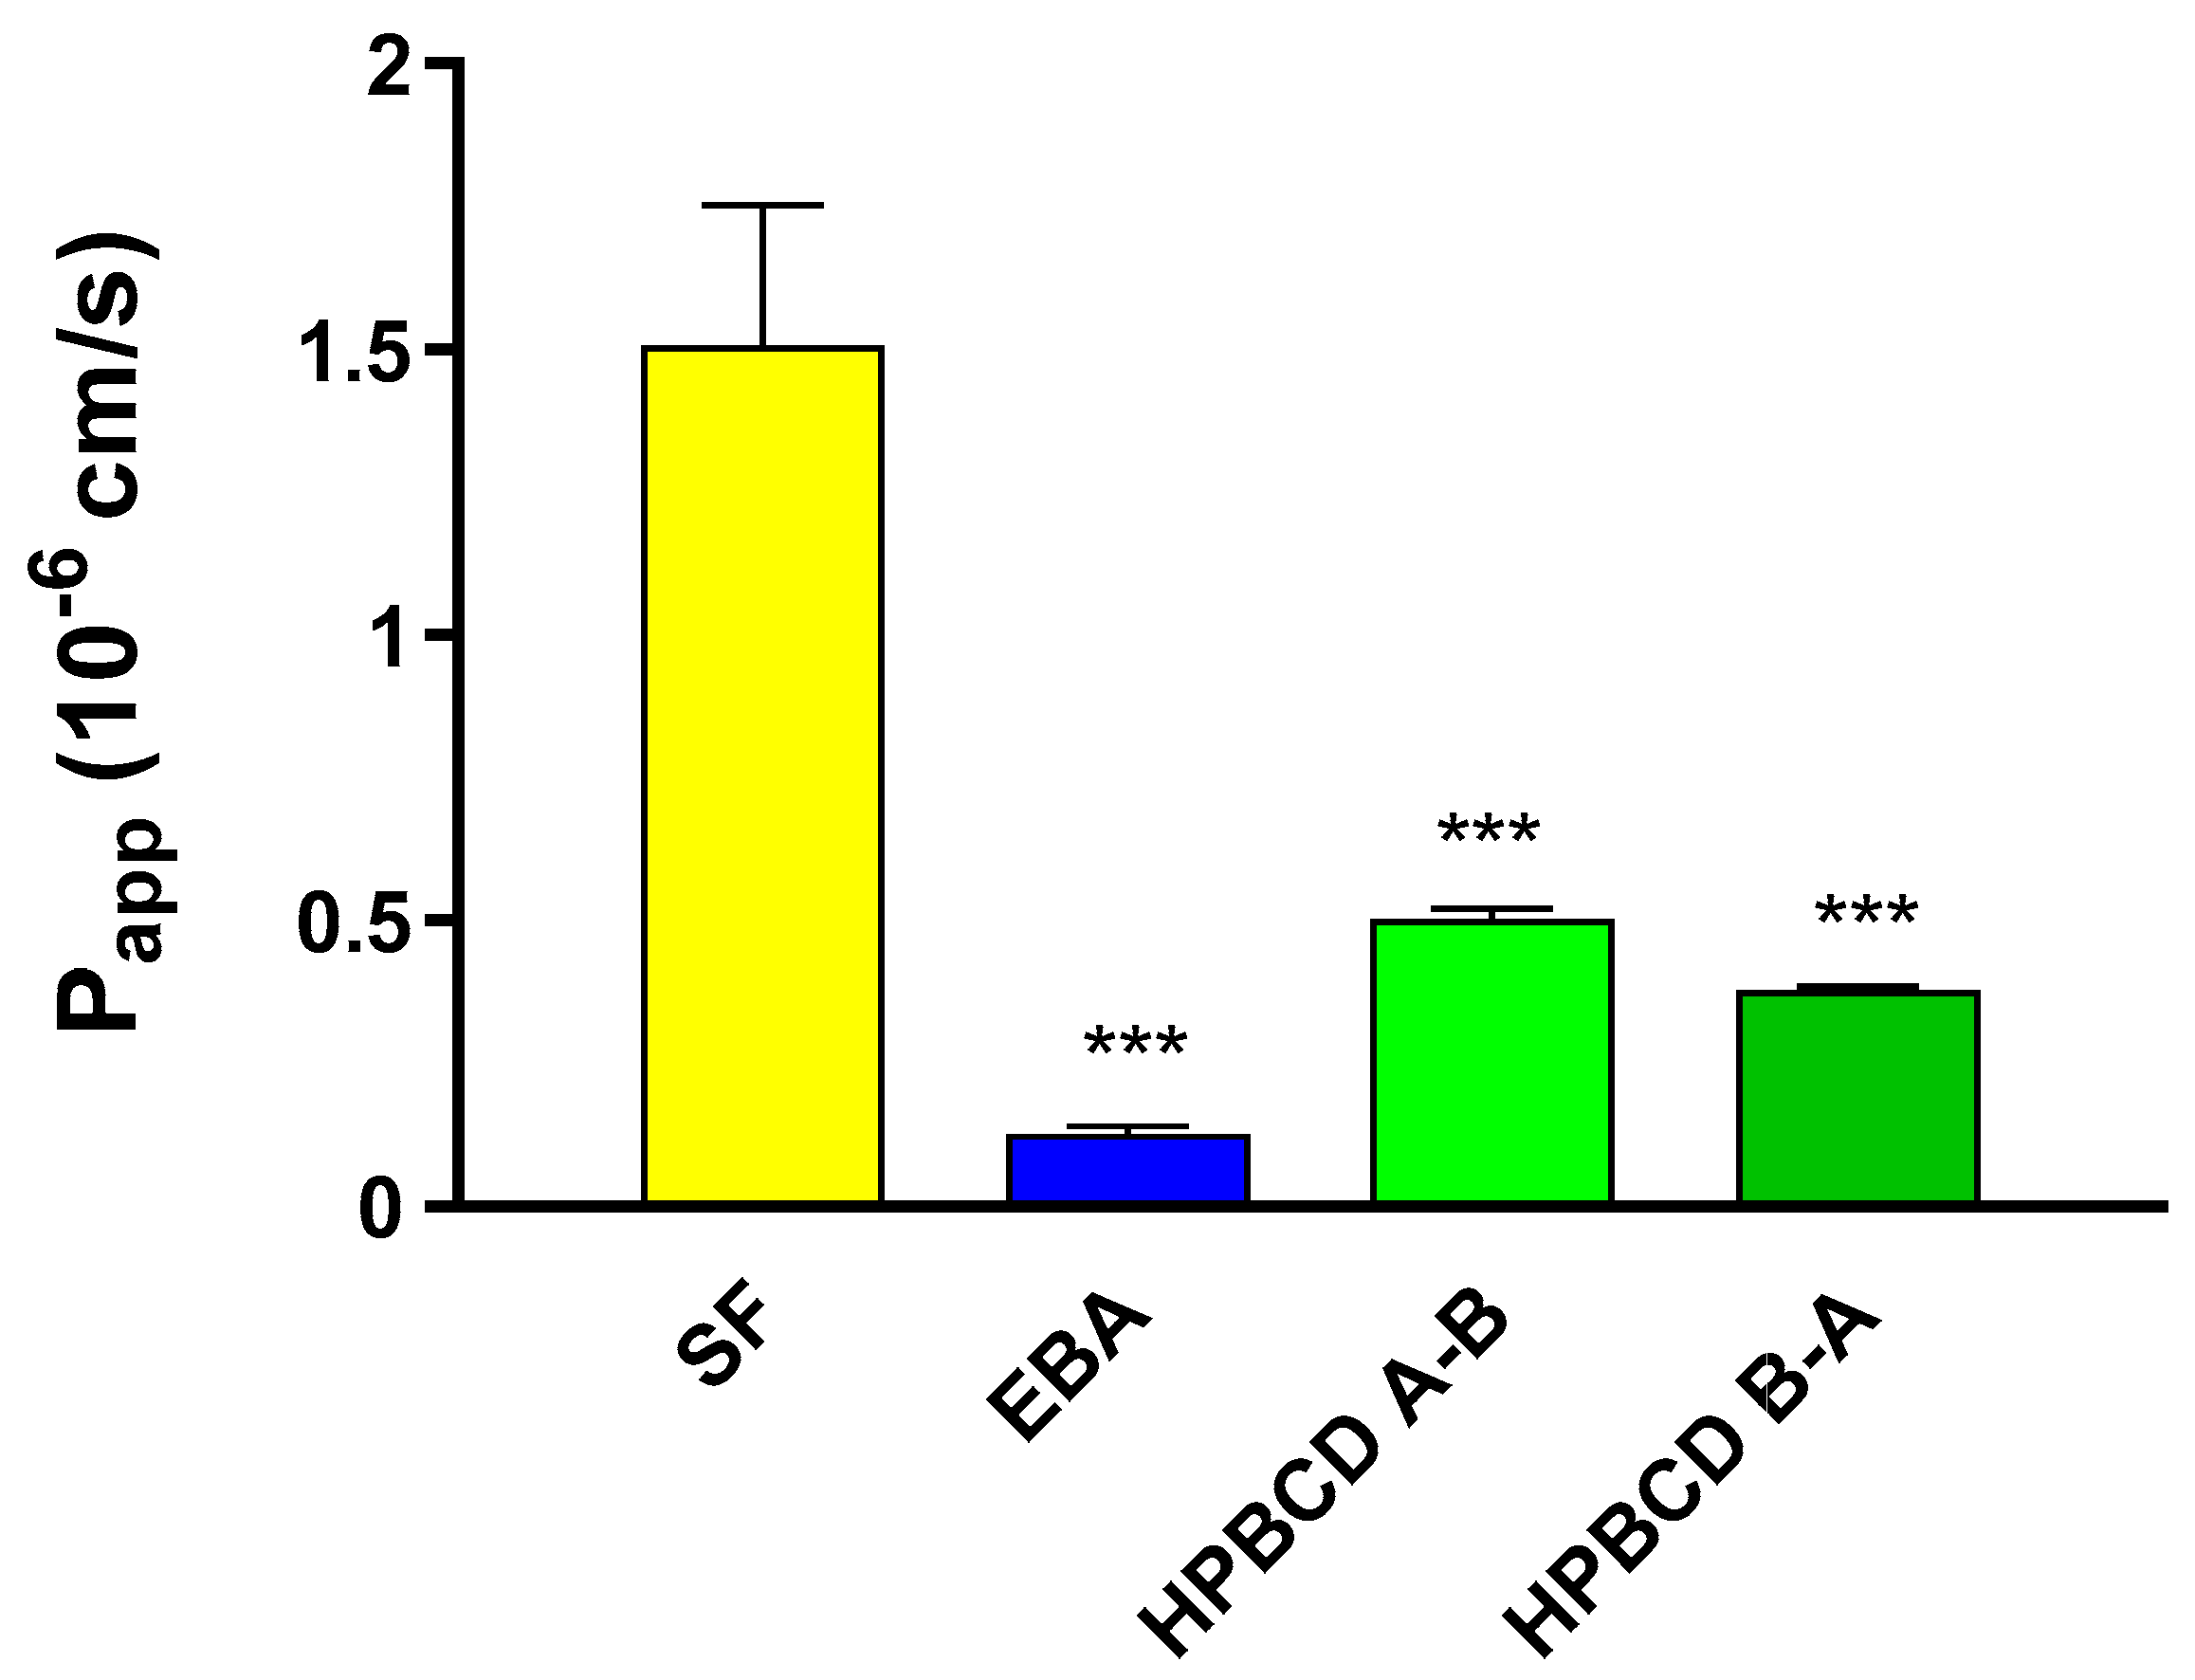
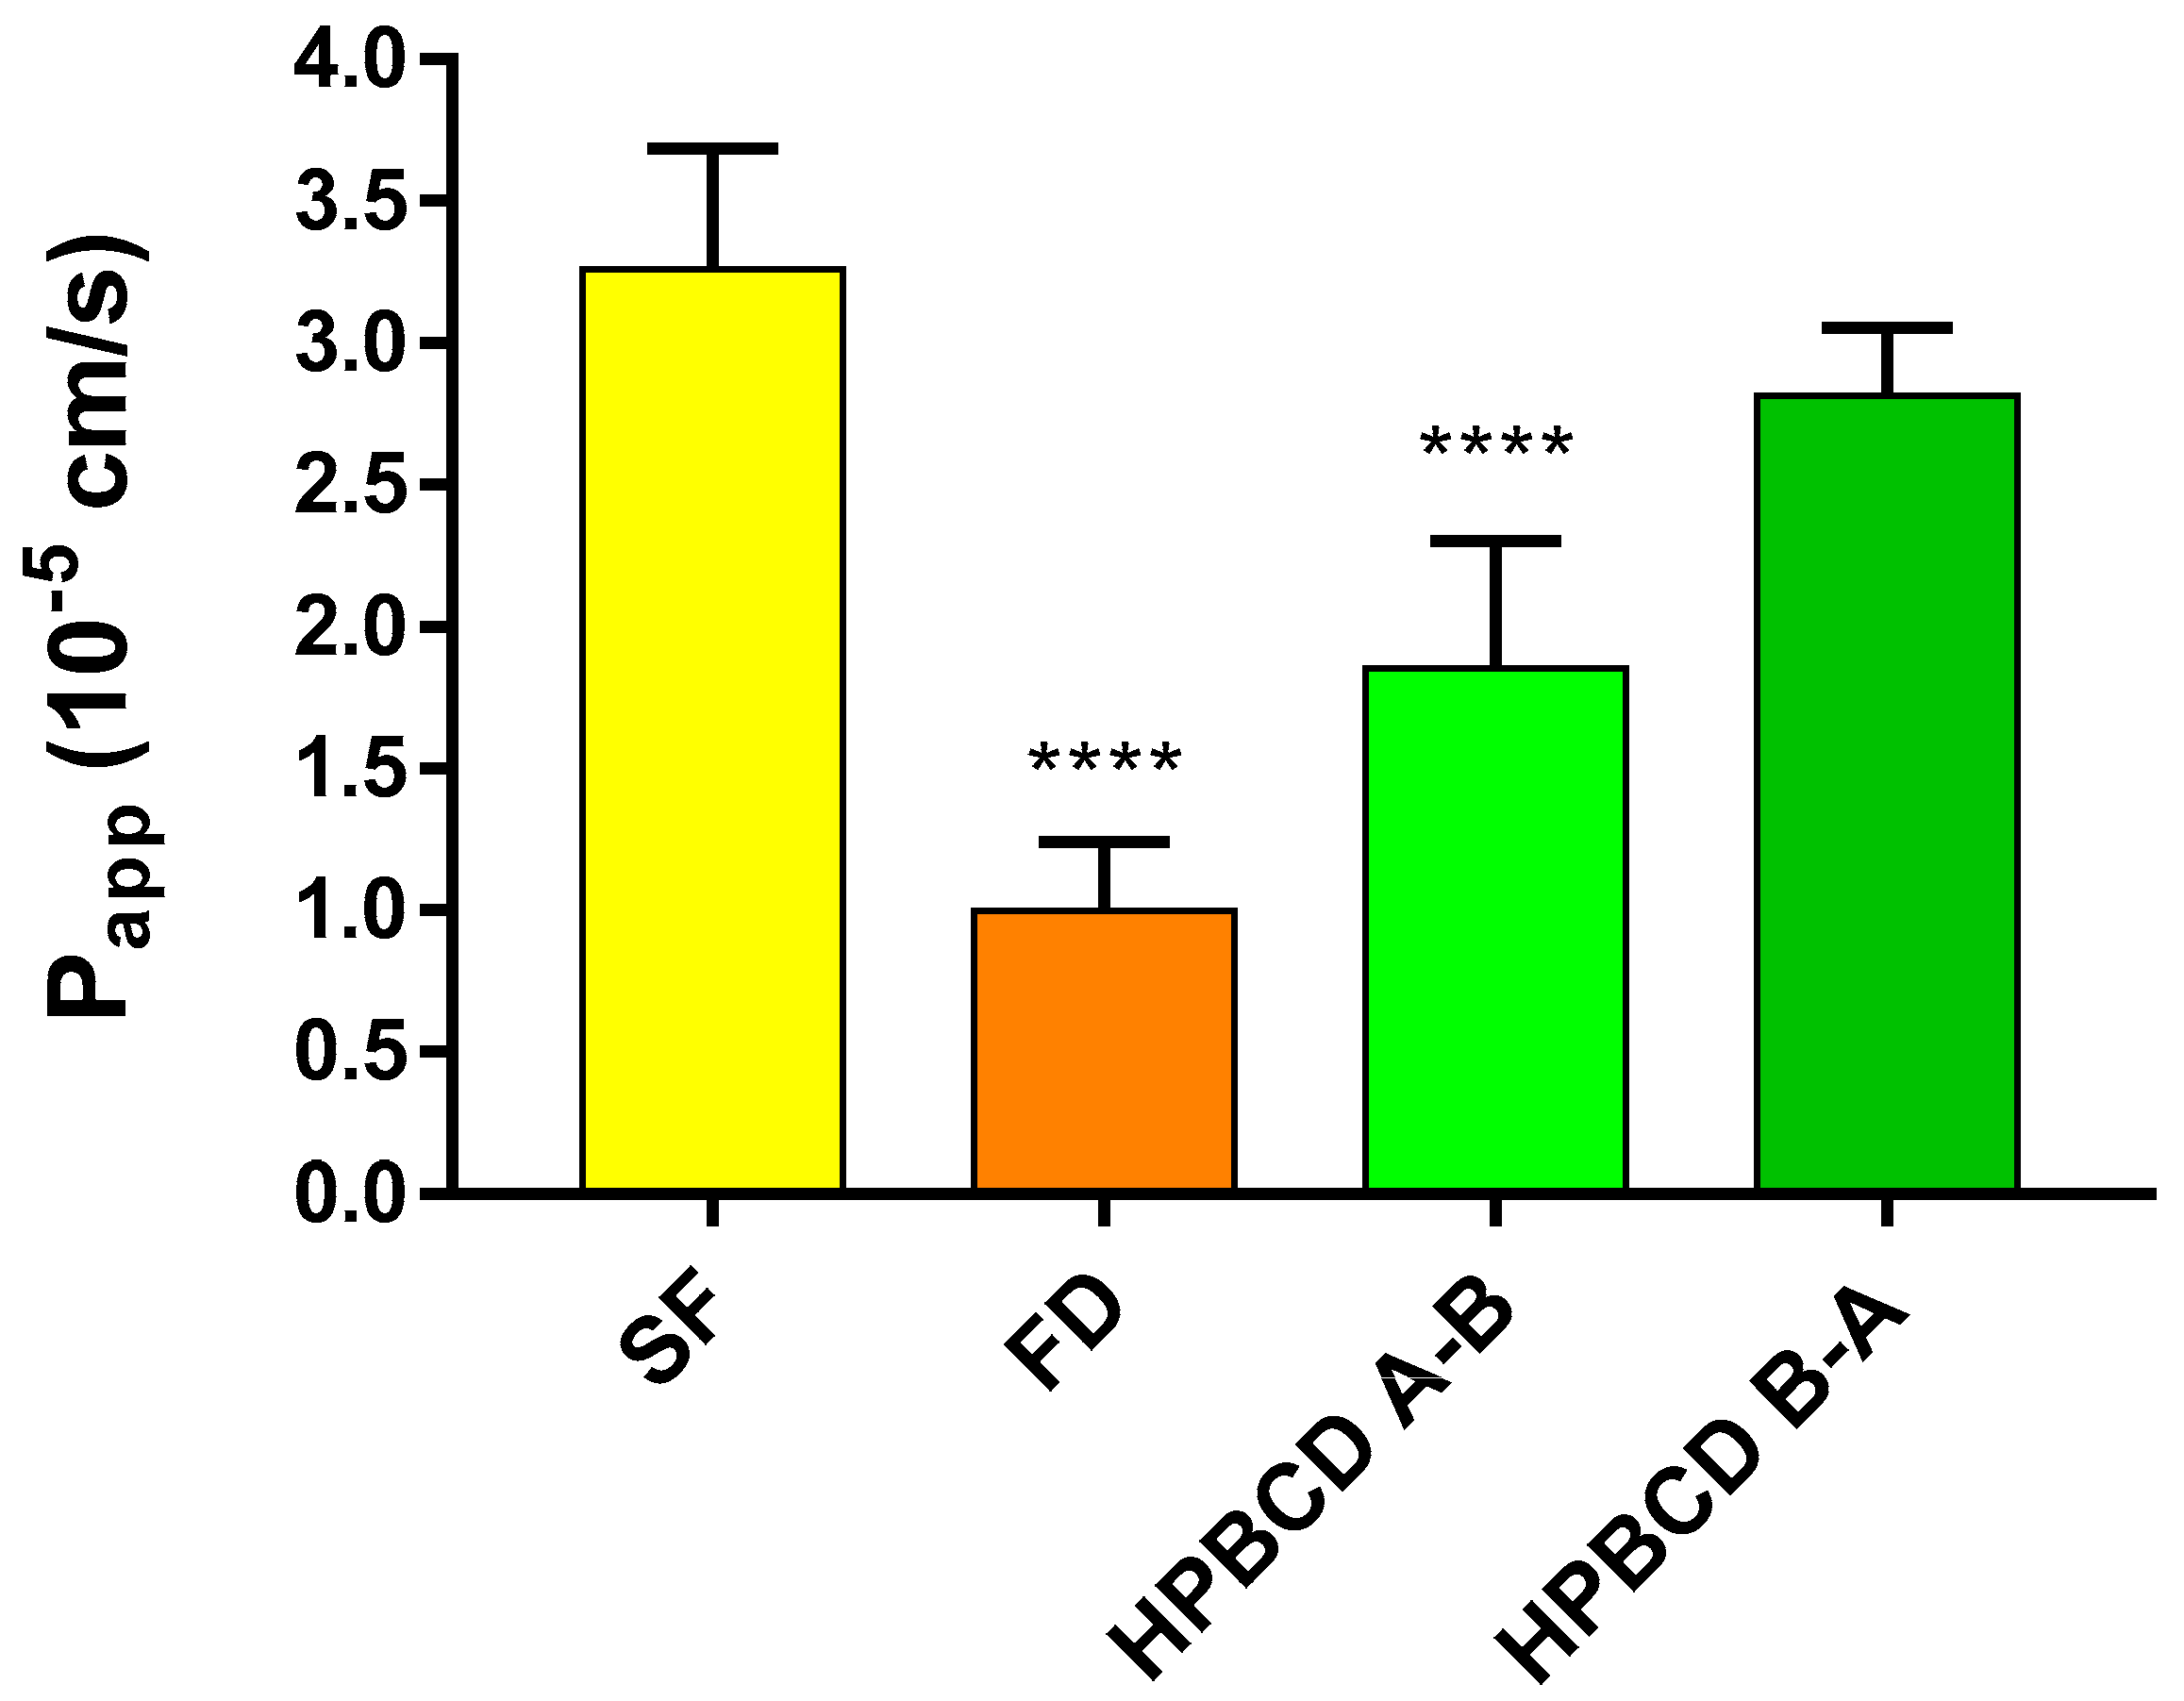
2.3. Permeability of FITC-HPBCD across the Culture Models of the BBB
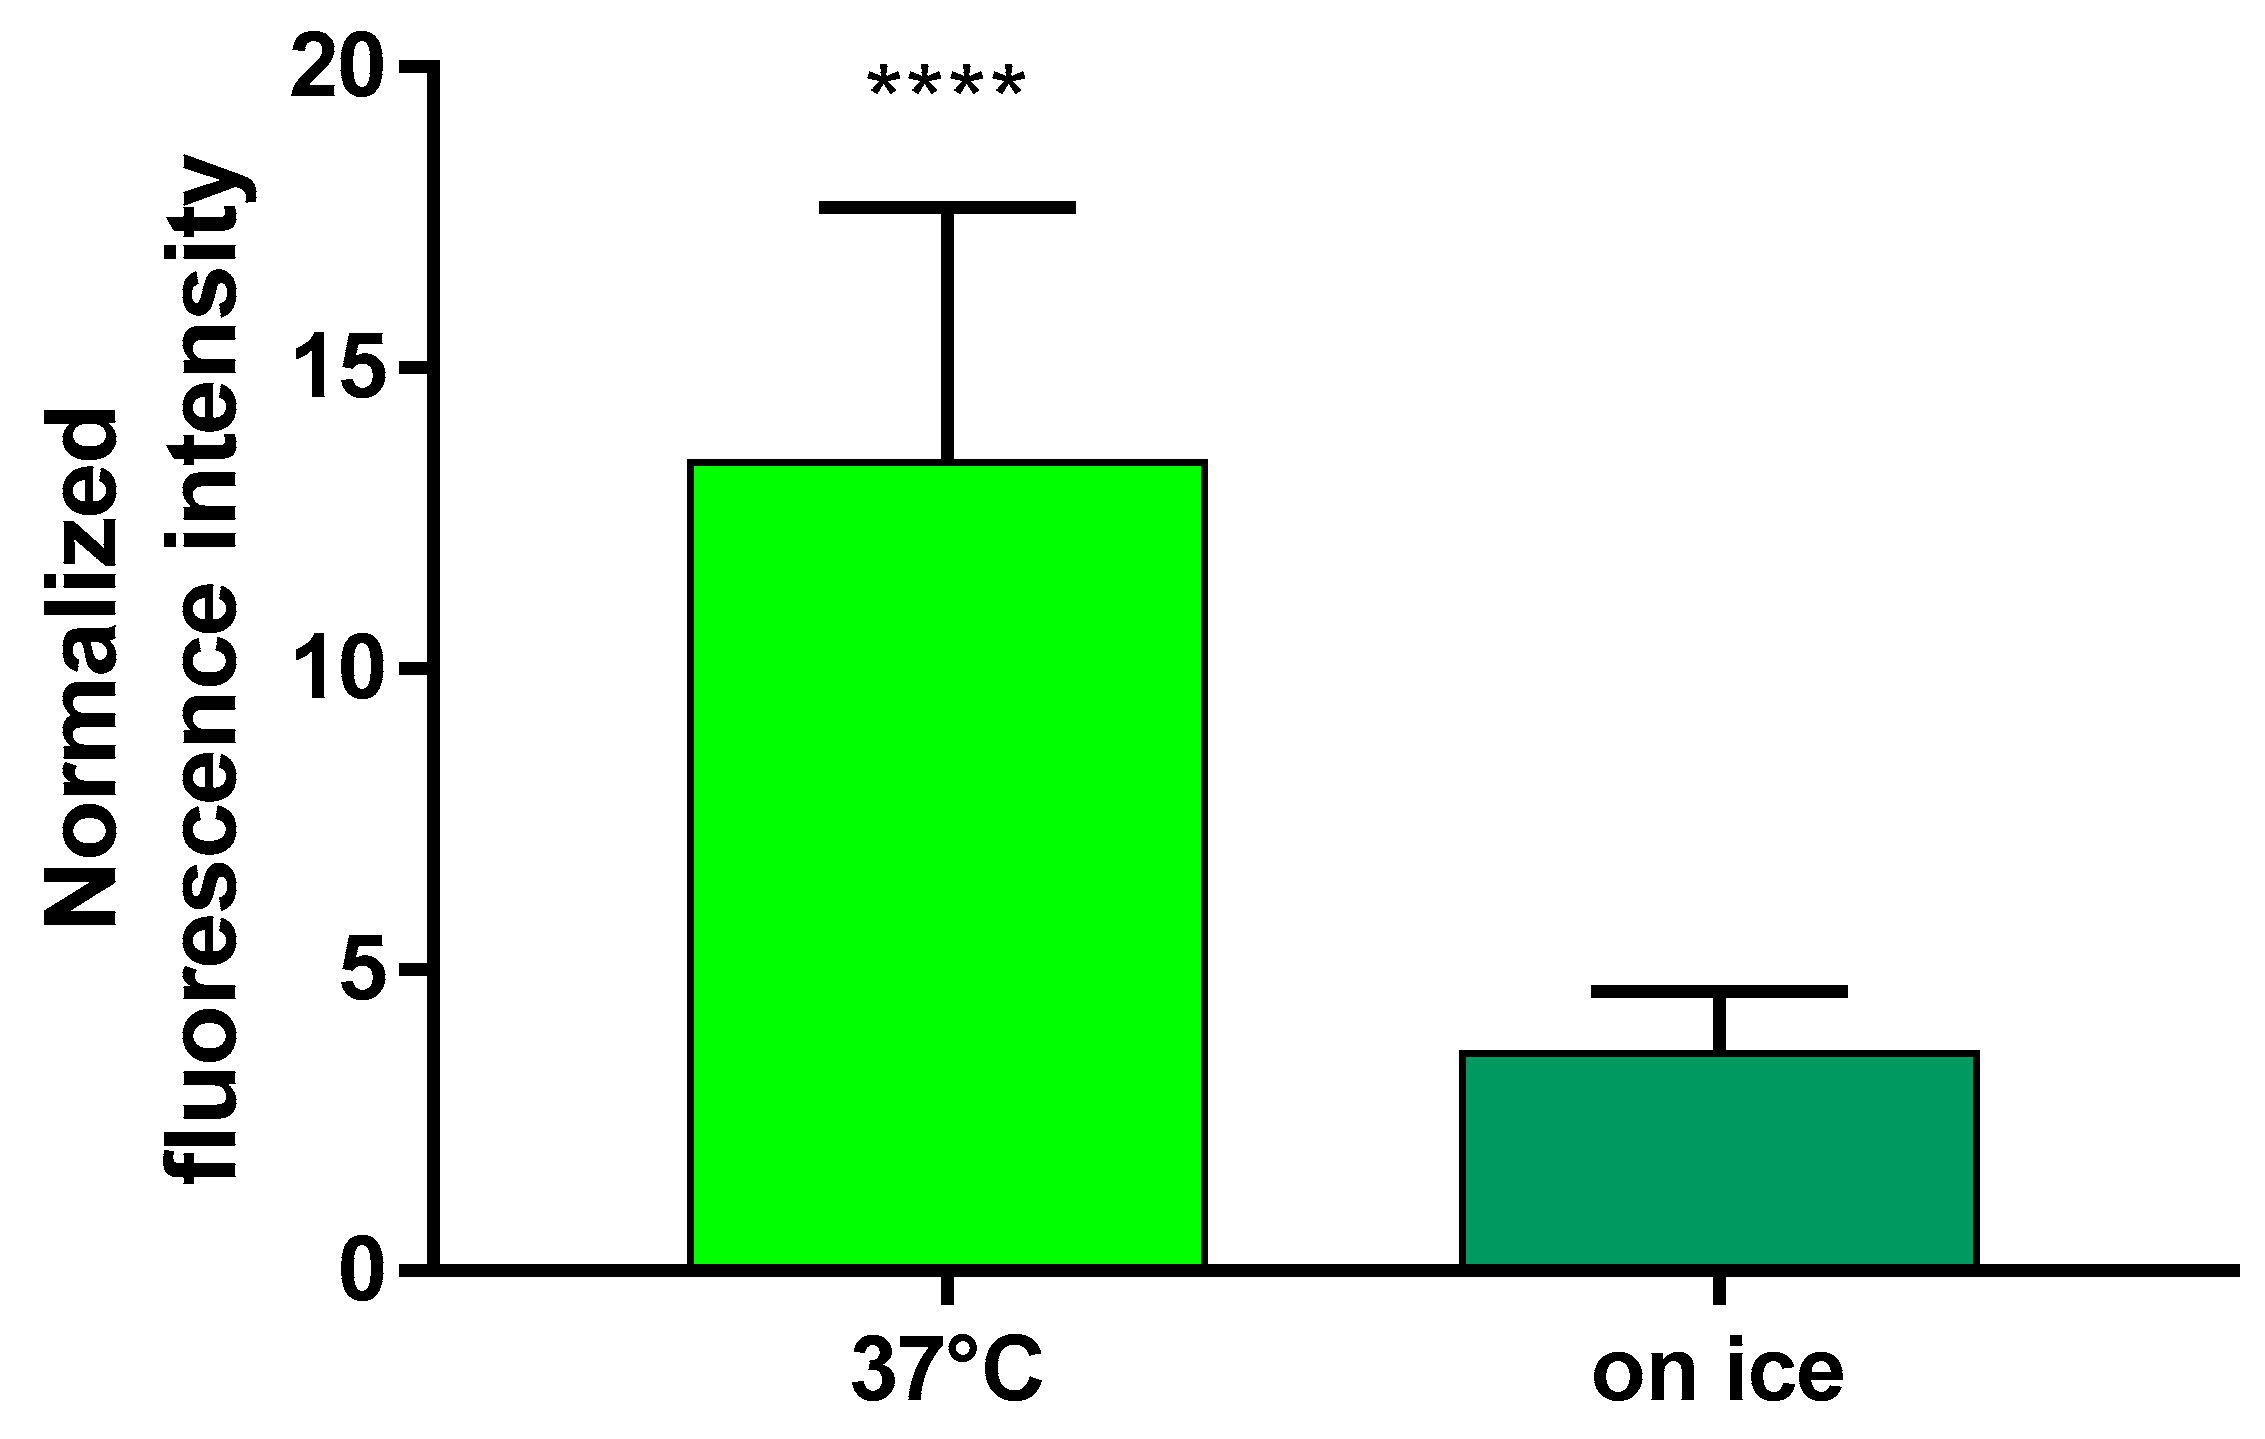
2.4. Uptake of FITC-HPBCD by hCMEC/D3 Cells
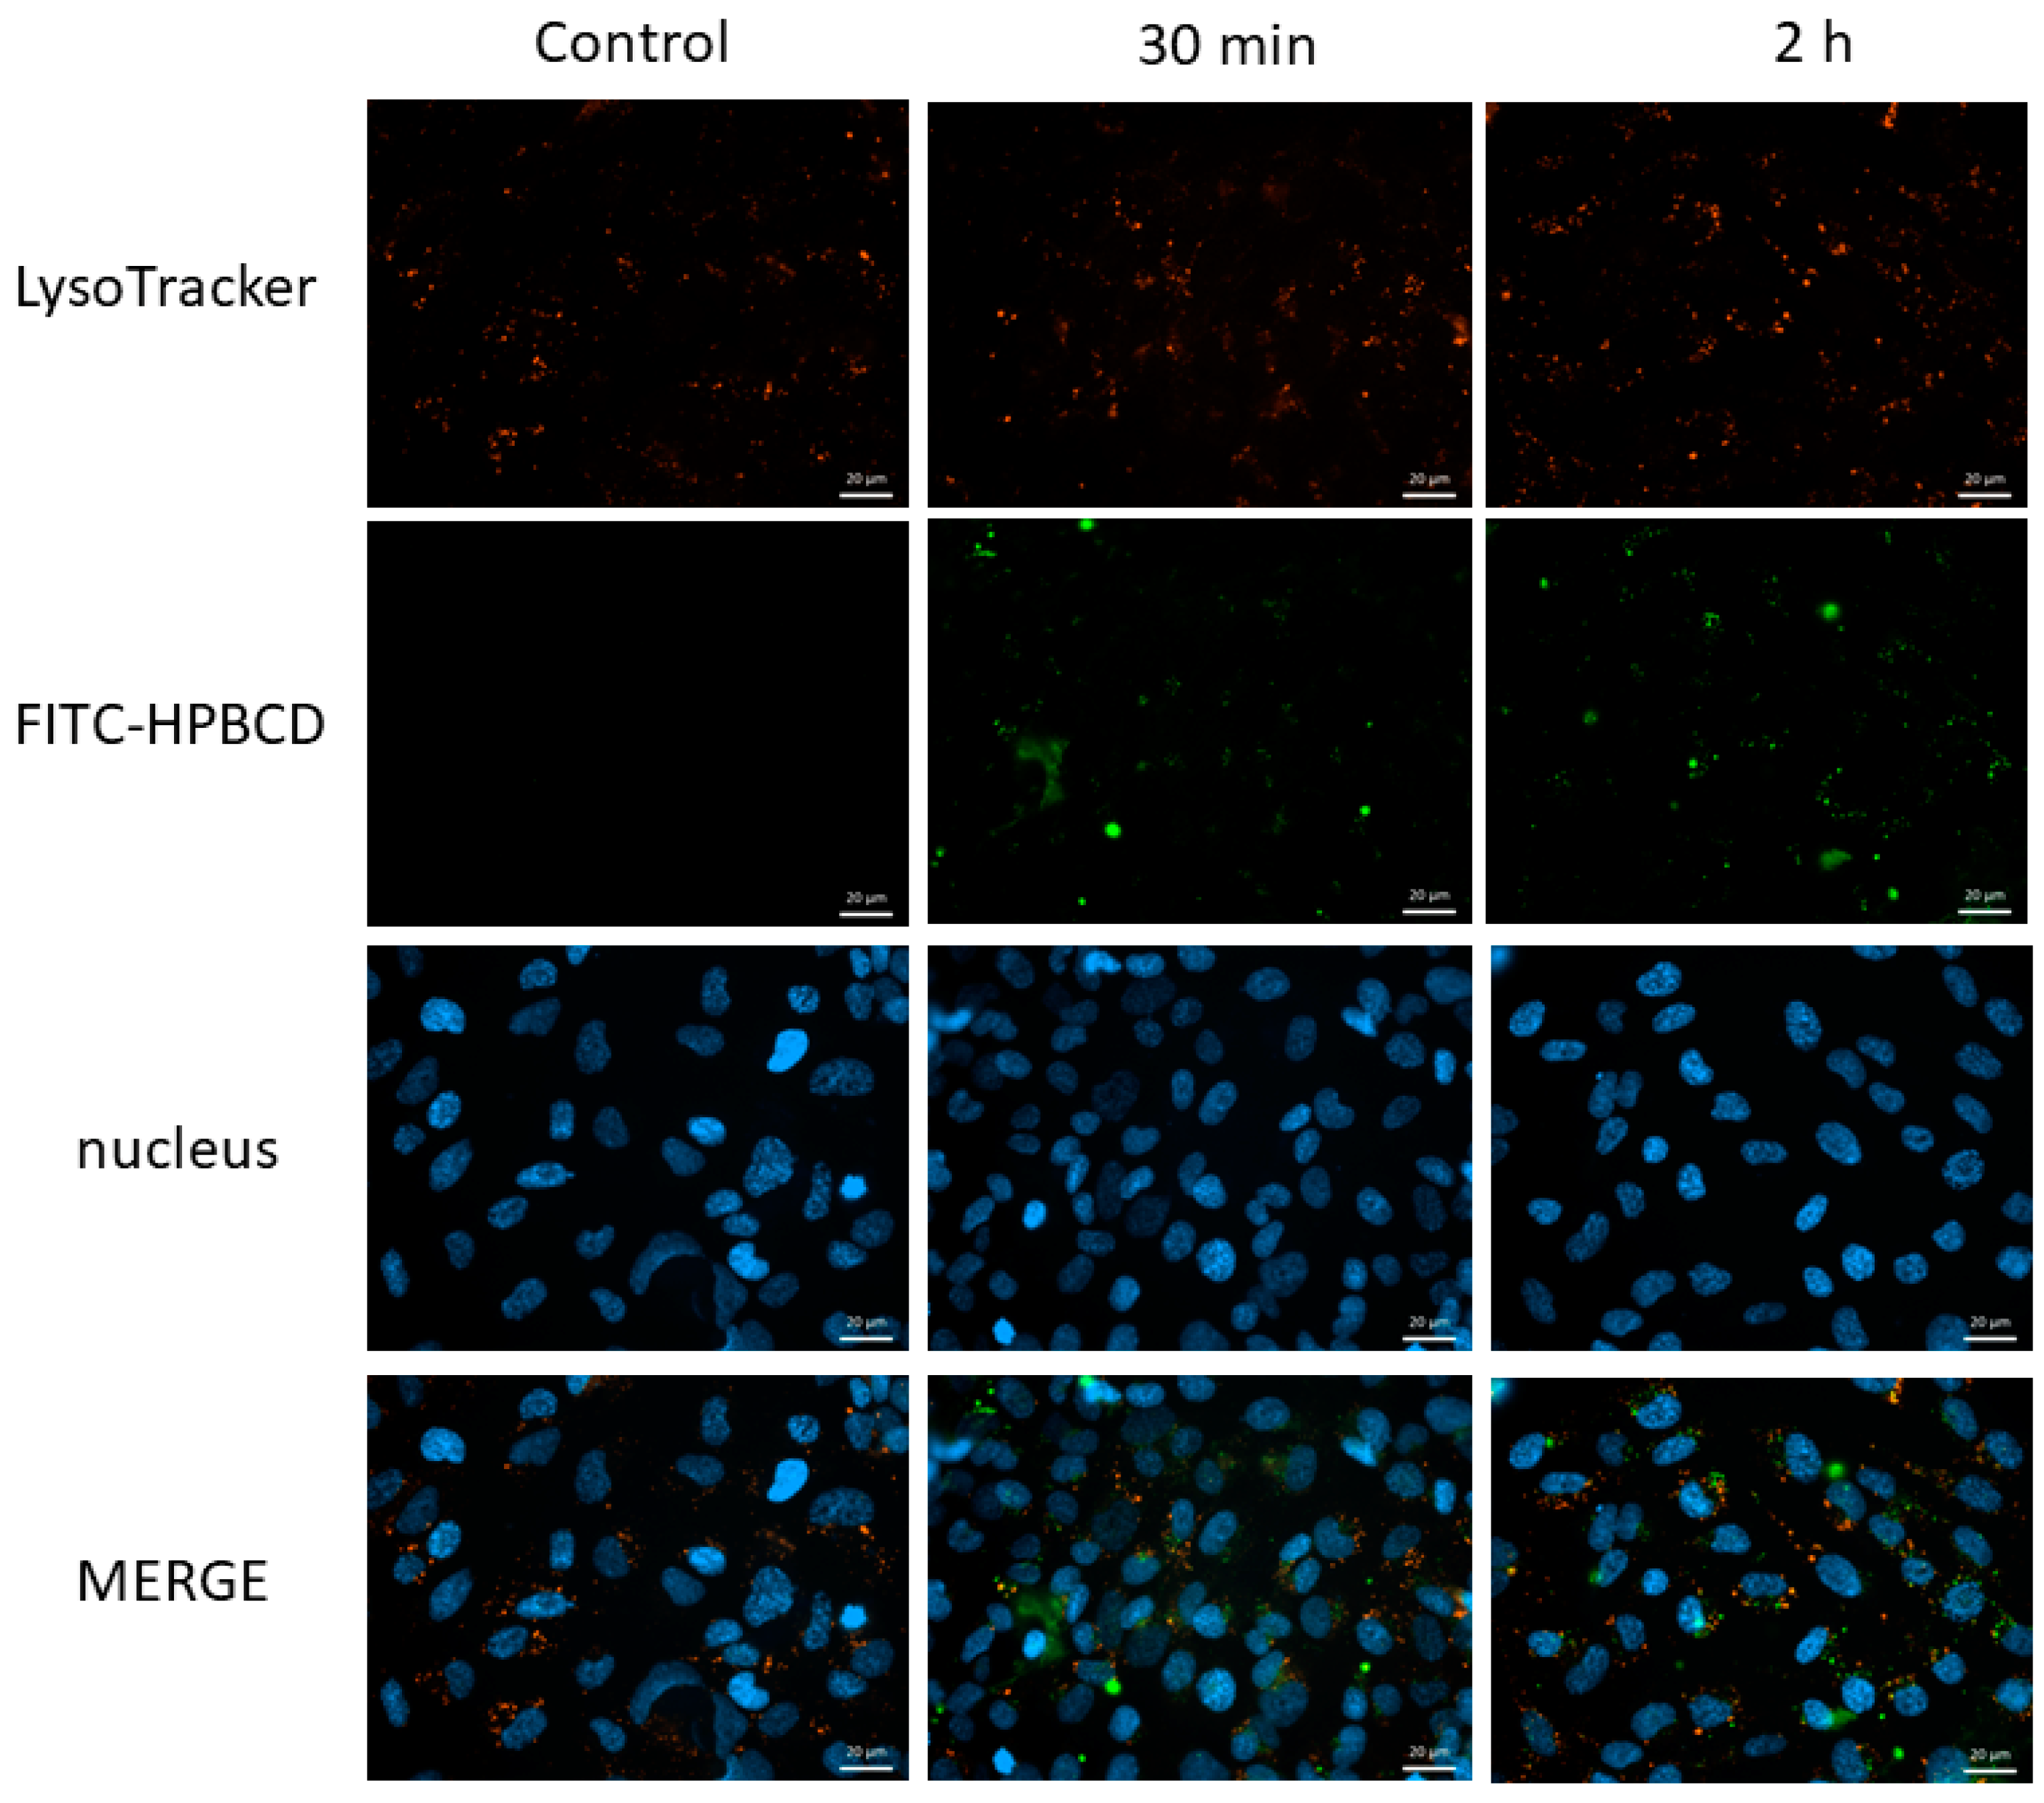
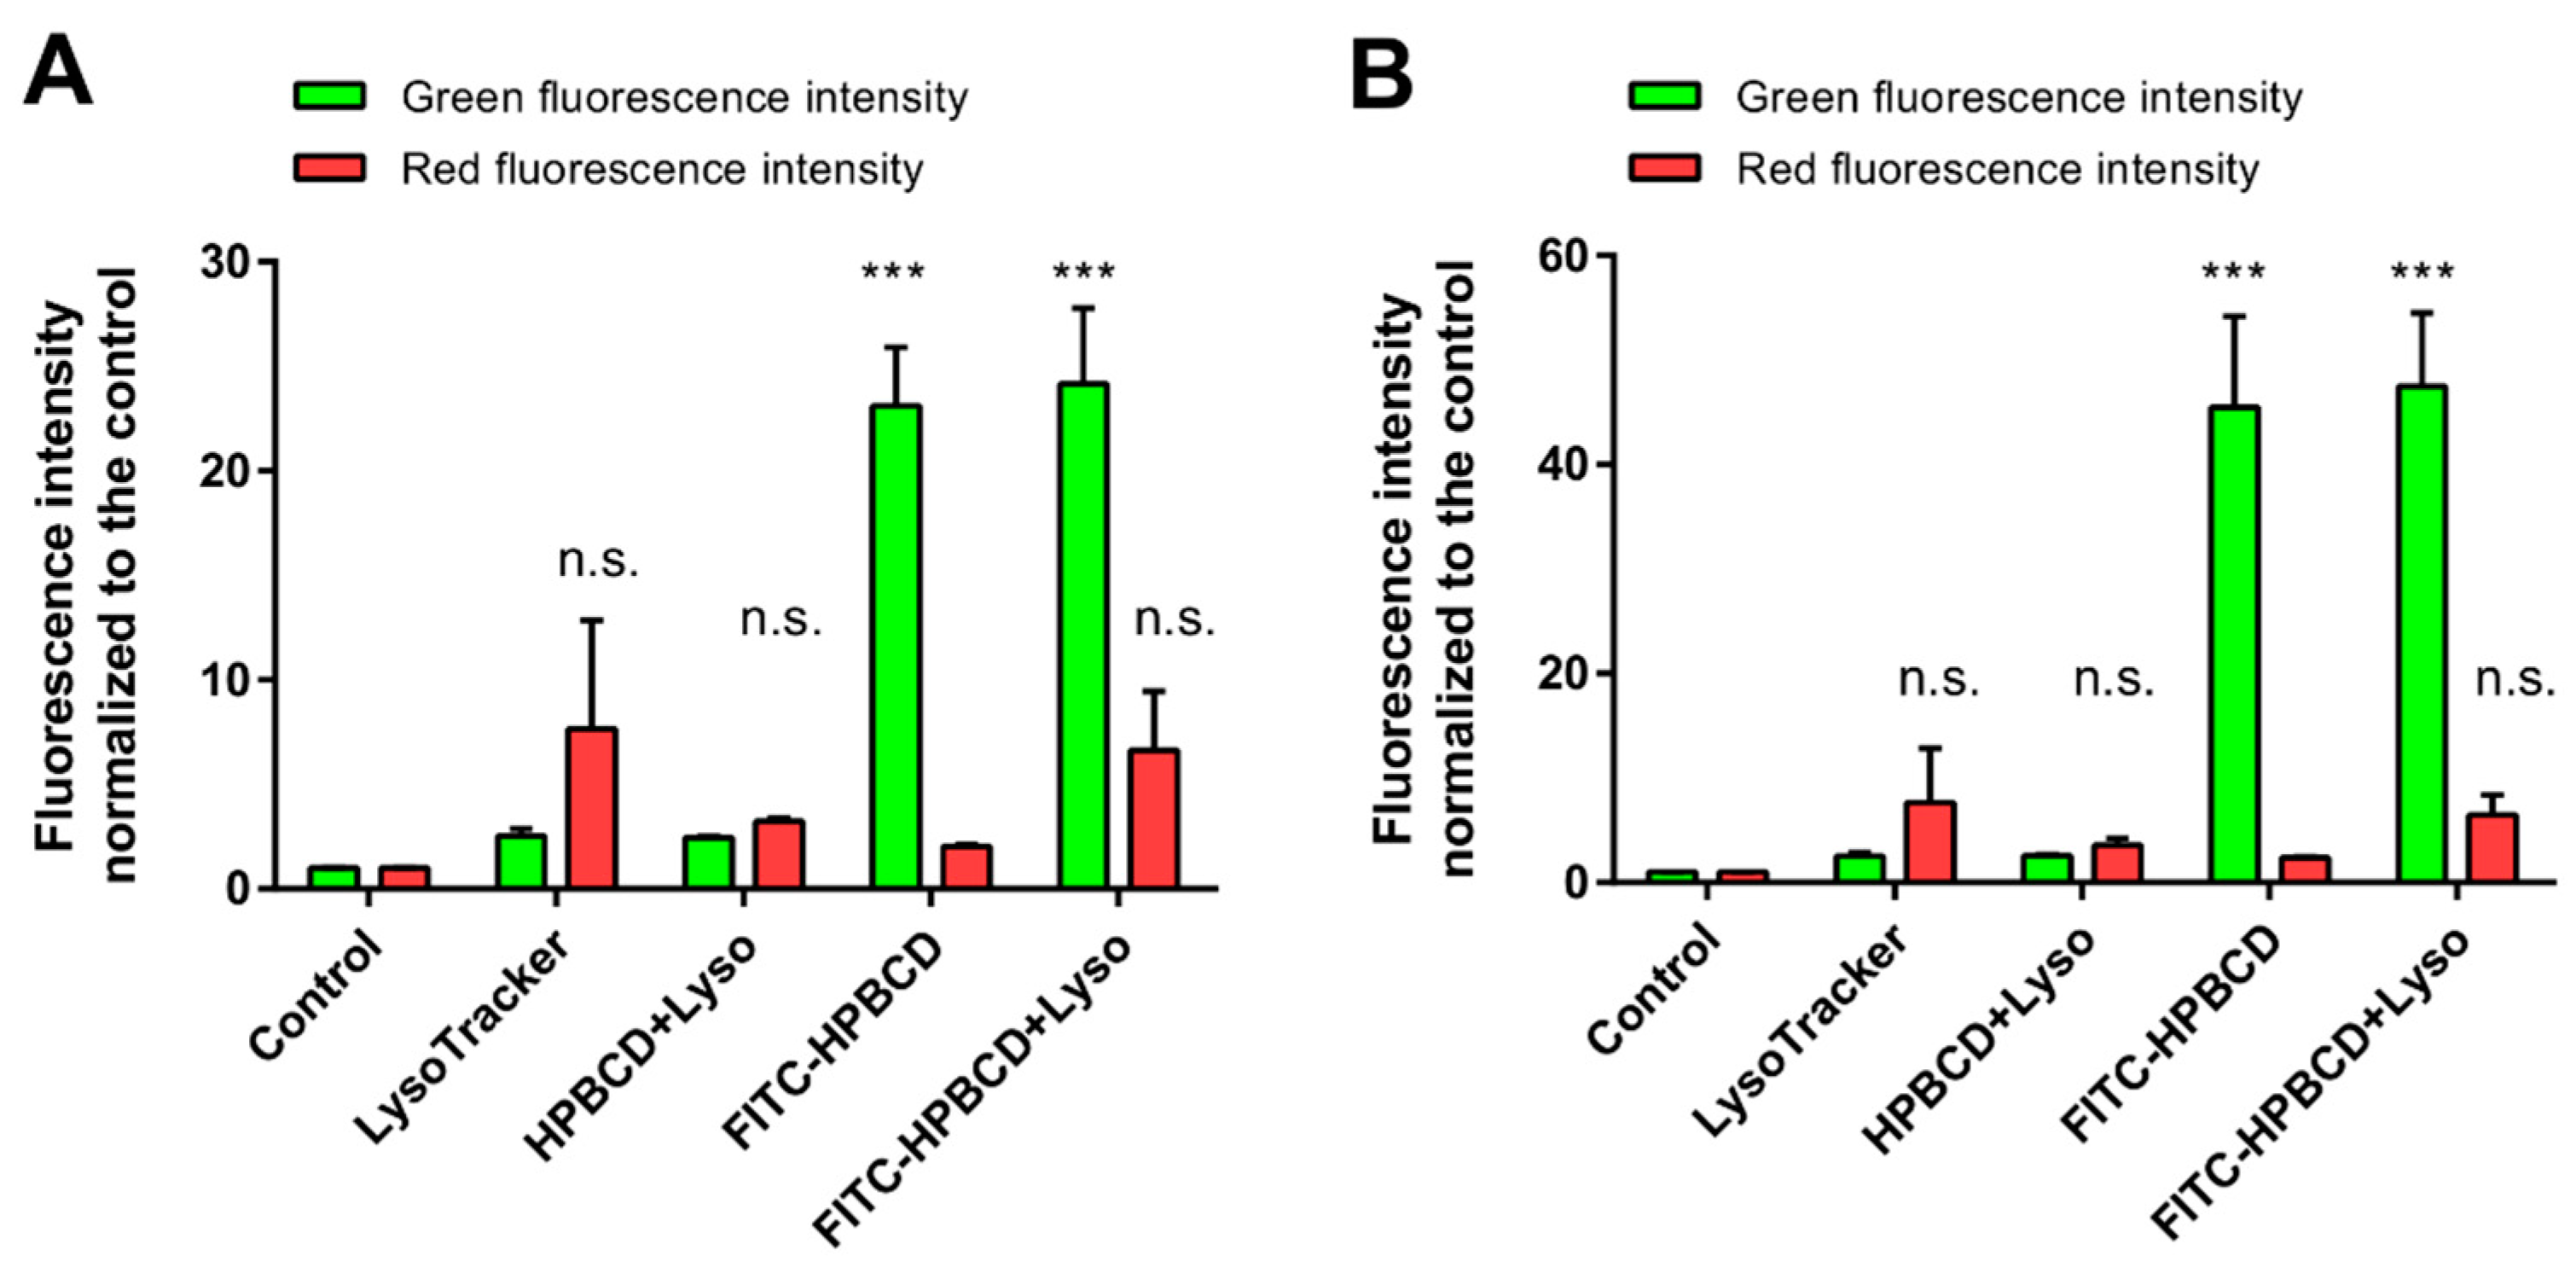
2.5. Investigation of the Lysosomes
2.5.1. Fluorescence Microscopy
2.5.2. Flow Cytometry
3. Discussion
4. Materials and Methods
4.1. Reagents
4.2. Cell Cultures
4.3. Measurement of Cellular Toxicity
4.4. Establishment of the In Vitro Triple Co-Culture Blood–Brain Barrier Model
4.5. Measurement of the Integrity of the Paracellular Barrier
4.6. Visualization of the Uptake of FITC-HPBCD in Brain Endothelial Cells
4.7. Immunostaining of Claudin-5 in Brain Endothelial Cells
4.8. Permeability Measurements
4.9. Uptake of FITC-HPBCD by hCMEC/D3 Cells, a Flow Cytometric Analysis
4.10. Investigation of the Lysosomes
4.10.1. Fluorescence Microscopy
4.10.2. Flow Cytometry
4.11. Statistics
Author Contributions
Funding
Institutional Review Board Statement
Informed Consent Statement
Data Availability Statement
Conflicts of Interest
References
- Vanier, M.; Millat, G. Niemann-Pick disease type C. Clin. Genet. 2003, 64, 269–281. [Google Scholar] [CrossRef] [Green Version]
- Matencio, A.; Navarro-Orcajada, S.; González-Ramón, A.; García-Carmona, F.; López-Nicolás, J.M. Recent advances in the treatment of Niemann pick disease type C: A mini-review. Int. J. Pharm. 2020, 584, 119440. [Google Scholar] [CrossRef]
- Reynolds, M.; Linneman, L.A.; Luna, S.; Warner, B.B.; Turmelle, Y.P.; Kulkarni, S.S.; Jiang, X.; Khanna, G.; Shinawi, M.; Porter, F.D.; et al. A phase 1/2 open label nonrandomized clinical trial of intravenous 2-hydroxypropyl-β-cyclodextrin for acute liver disease in infants with Niemann-Pick C1. Mol. Genet. Metab. Rep. 2021, 28, 100772. [Google Scholar] [CrossRef]
- Davidson, C.D.; Ali, N.F.; Micsenyi, M.C.; Stephney, G.; Renault, S.; Dobrenis, K.; Ory, D.S.; Vanier, M.T.; Walkley, S.U. Chronic Cyclodextrin Treatment of Murine Niemann-Pick C Disease Ameliorates Neuronal Cholesterol and Glycosphingolipid Storage and Disease Progression. PLoS ONE 2009, 4, e6951. [Google Scholar] [CrossRef] [Green Version]
- Gosselet, F.; Loiola, R.A.; Roig, A.; Rosell, A.; Culot, M. Central nervous system delivery of molecules across the blood-brain barrier. Neurochem. Int. 2021, 144, 104952. [Google Scholar] [CrossRef]
- Ory, D.S.; Ottinger, E.A.; Farhat, N.Y.; King, K.A.; Jiang, X.; Weissfeld, L.; Berry-Kravis, E.; Davidson, C.D.; Bianconi, S.; Keener, L.A.; et al. Intrathecal 2-hydroxypropyl-β-cyclodextrin decreases neurological disease progression in Niemann-Pick disease, type C1: A non-randomised, open-label, phase 1-2 trial. Lancet 2017, 390, 1758–1768. [Google Scholar] [CrossRef] [Green Version]
- Donida, B.; Raabe, M.; Tauffner, B.; de Farias, M.A.; Machado, A.Z.; Timm, F.; Kessler, R.G.; Hammerschmidt, T.G.; Reinhardt, L.S.; Brito, V.B.; et al. Nanoparticles containing β-cyclodextrin potentially useful for the treatment of Niemann-Pick C. J. Inherit. Metab. Dis. 2020, 43, 586–601. [Google Scholar] [CrossRef]
- Puglisi, A.; Yagci, Y. Cyclodextrin-Based Macromolecular Systems as Cholesterol-Mopping Therapeutic Agents in Niemann–Pick Disease Type C. Macromol. Rapid Commun. 2019, 40, 1800557. [Google Scholar] [CrossRef]
- Tamura, A.; Nishida, K.; Yui, N. Lysosomal pH-inducible supramolecular dissociation of polyrotaxanes possessing acid-labile N-triphenylmethyl end groups and their therapeutic potential for Niemann-Pick type C disease. Sci. Technol. Adv. Mater. 2016, 17, 361–374. [Google Scholar] [CrossRef] [Green Version]
- Carradori, D.; Chen, H.; Werner, B.; Shah, A.S.; Leonardi, C.; Usuelli, M.; Mezzenga, R.; Platt, F.; Leroux, J.-C. Investigating the Mechanism of Cyclodextrins in the Treatment of Niemann-Pick Disease Type C Using Crosslinked 2-Hydroxypropyl-β-cyclodextrin. Small 2020, 16, 2004735. [Google Scholar] [CrossRef]
- Pontikis, C.C.; Davidson, C.D.; Walkley, S.U.; Platt, F.M.; Begley, D.J. Cyclodextrin alleviates neuronal storage of cholesterol in Niemann-Pick C disease without evidence of detectable blood–brain barrier permeability. J. Inherit. Metab. Dis. 2013, 36, 491–498. [Google Scholar] [CrossRef] [Green Version]
- Banks, W.A.; Engelke, K.; Hansen, K.; Bullock, K.; Calias, P. Modest Blood-brain Barrier Permeability of the Cyclodextrin Kleptose®: Modification by Efflux and Luminal Surface Binding. J. Pharmacol. Exp. Ther. 2019, 371, 121–129. [Google Scholar] [CrossRef]
- Fenyvesi, F.; Réti-Nagy, K.; Bacsó, Z.; Gutay-Tóth, Z.; Malanga, M.; Fenyvesi, É.; Szente, L.; Váradi, J.; Ujhelyi, Z.; Fehér, P.; et al. Fluorescently labeled methyl-beta-cyclodextrin enters intestinal epithelial Caco-2 cells by fluid-phase endocytosis. PLoS ONE 2014, 9, e84856. [Google Scholar] [CrossRef] [Green Version]
- Rosenbaum, A.I.; Zhang, G.; Warren, J.D.; Maxfield, F.R. Endocytosis of beta-cyclodextrins is responsible for cholesterol reduction in Niemann-Pick type C mutant cells. Proc. Natl. Acad. Sci. USA 2010, 107, 5477–5482. [Google Scholar] [CrossRef] [Green Version]
- Rusznyák, Á.; Malanga, M.; Fenyvesi, É.; Szente, L.; Váradi, J.; Bácskay, I.; Vecsernyés, M.; Vasvári, G.; Haimhoffer, Á.; Fehér, P.; et al. Investigation of the Cellular Effects of Beta- Cyclodextrin Derivatives on Caco-2 Intestinal Epithelial Cells. Pharmaceutics 2021, 13, 157. [Google Scholar] [CrossRef]
- Vance, J.E.; Karten, B. Niemann-Pick C disease and mobilization of lysosomal cholesterol by cyclodextrin. J. Lipid Res. 2014, 55, 1609–1621. [Google Scholar] [CrossRef] [Green Version]
- Singhal, A.; Szente, L.; Hildreth, J.E.K.; Song, B. Hydroxypropyl-beta and -gamma cyclodextrins rescue cholesterol accumulation in Niemann–Pick C1 mutant cell via lysosome-associated membrane protein 1. Cell Death Dis. 2018, 9, 1019. [Google Scholar] [CrossRef] [Green Version]
- Singhal, A.; Krystofiak, E.S.; Jerome, W.G.; Song, B. 2-Hydroxypropyl-gamma-cyclodextrin overcomes NPC1 deficiency by enhancing lysosome-ER association and autophagy. Sci. Rep. 2020, 10, 8663. [Google Scholar] [CrossRef]
- Yamada, Y.; Ishitsuka, Y.; Kondo, Y.; Nakahara, S.; Nishiyama, A.; Takeo, T.; Nakagata, N.; Motoyama, K.; Higashi, T.; Arima, H.; et al. Differential mode of cholesterol inclusion with 2-hydroxypropyl-cyclodextrins increases safety margin in treatment of Niemann-Pick disease type C. Br. J. Pharmacol. 2021, 178, 2727–2746. [Google Scholar] [CrossRef]
- Feltes, M.; Gale, S.E.; Moores, S.; Ory, D.S.; Schaffer, J.E. Monitoring the itinerary of lysosomal cholesterol in Niemann-Pick Type C1-deficient cells after cyclodextrin treatment [S]. J. Lipid Res. 2020, 61, 403–412. [Google Scholar] [CrossRef]
- Borner, M.M.; Schneider, E.; Pirnia, F.; Sartor, O.; Trepel, J.B.; Myers, C.E. The detergent Triton X-100 induces a death pattern in human carcinoma cell lines that resembles cytotoxic lymphocyte-induced apoptosis. FEBS Lett. 1994, 353, 129–132. [Google Scholar] [CrossRef] [Green Version]
- Bocsik, A.; Walter, F.R.; Gyebrovszki, A.; Fülöp, L.; Blasig, I.; Dabrowski, S.; Ötvös, F.; Tóth, A.; Rákhely, G.; Veszelka, S.; et al. Reversible Opening of Intercellular Junctions of Intestinal Epithelial and Brain Endothelial Cells With Tight Junction Modulator Peptides. J. Pharm. Sci. 2016, 105, 754–765. [Google Scholar] [CrossRef] [Green Version]
- Nakagawa, S.; Deli, M.A.; Kawaguchi, H.; Shimizudani, T.; Shimono, T.; Kittel, Á.; Tanaka, K.; Niwa, M. A new blood–brain barrier model using primary rat brain endothelial cells, pericytes and astrocytes. Neurochem. Int. 2009, 54, 253–263. [Google Scholar] [CrossRef] [Green Version]
- Walter, F.R.; Veszelka, S.; Pásztói, M.; Péterfi, Z.A.; Tóth, A.; Rákhely, G.; Cervenak, L.; Ábrahám, C.S.; Deli, M.A. Tesmilifene modifies brain endothelial functions and opens the blood-brain/blood-glioma barrier. J. Neurochem. 2015, 134, 1040–1054. [Google Scholar] [CrossRef]
- Vecsernyés, M.; Fenyvesi, F.; Bácskay, I.; Deli, M.A.; Szente, L.; Fenyvesi, É. Cyclodextrins, Blood–Brain Barrier, and Treatment of Neurological Diseases. Arch. Med. Res. 2014, 45, 711–729. [Google Scholar] [CrossRef]
- Shityakov, S.; Salmas, R.E.; Salvador, E.; Roewer, N.; Broscheit, J.; Förster, C. Evaluation of the potential toxicity of unmodified and modified cyclodextrins on murine blood-brain barrier endothelial cells. J. Toxicol. Sci. 2016, 41, 175–184. [Google Scholar] [CrossRef] [Green Version]
- Monnaert, V.; Tilloy, S.; Bricout, H.; Fenart, L.; Cecchelli, R.; Monflier, E. Behavior of α-, β-, and γ-Cyclodextrins and Their Derivatives on an in Vitro Model of Blood-Brain Barrier. J. Pharmacol. Exp. Ther. 2004, 310, 745–751. [Google Scholar] [CrossRef] [Green Version]
- Veszelka, S.; Tóth, A.; Walter, F.R.; Tóth, A.E.; Gróf, I.; Mészáros, M.; Bocsik, A.; Hellinger, É.; Vastag, M.; Rákhely, G.; et al. Comparison of a Rat Primary Cell-Based Blood-Brain Barrier Model With Epithelial and Brain Endothelial Cell Lines: Gene Expression and Drug Transport. Front. Mol. Neurosci. 2018, 11, 166. [Google Scholar] [CrossRef]
- Réti-Nagy, K.; Malanga, M.; Fenyvesi, É.; Szente, L.; Vámosi, G.; Váradi, J.; Bácskay, I.; Fehér, P.; Ujhelyi, Z.; Róka, E.; et al. Endocytosis of fluorescent cyclodextrins by intestinal Caco-2 cells and its role in paclitaxel drug delivery. Int. J. Pharm. 2015, 496, 509–517. [Google Scholar] [CrossRef] [Green Version]
- Váradi, J.; Hermenean, A.; Gesztelyi, R.; Jeney, V.; Balogh, E.; Majoros, L.; Malanga, M.; Fenyvesi, É.; Szente, L.; Bácskay, I.; et al. Pharmacokinetic properties of fluorescently labelled hydroxypropyl-beta-cyclodextrin. Biomolecules 2019, 9, 509. [Google Scholar] [CrossRef]
- Jeong, M.S.; Bae, J.; Jin, H.K. Vascular endothelial growth factor improves the therapeutic effects of cyclodextrin in Niemann-Pick type C mice. Anim. Cells Syst. 2019, 23, 346–354. [Google Scholar] [CrossRef] [PubMed] [Green Version]
- Perrière, N.; Demeuse, P.; Garcia, E.; Regina, A.; Debray, M.; Andreux, J.-P.; Couvreur, P.; Scherrmann, J.-M.; Temsamani, J.; Couraud, P.-O.; et al. Puromycin-based purification of rat brain capillary endothelial cell cultures. Effect on the expression of blood-brain barrier-specific properties. J. Neurochem. 2005, 93, 279–289. [Google Scholar] [CrossRef] [PubMed]
- Veszelka, S.; Tóth, A.E.; Walter, F.R.; Datki, Z.; Mózes, E.; Fülöp, L.; Bozsó, Z.; Hellinger, É.; Vastag, M.; Orsolits, B.; et al. Docosahexaenoic Acid Reduces Amyloid-β Induced Toxicity in Cells of the Neurovascular Unit. J. Alzheimer’s Dis. 2013, 36, 487–501. [Google Scholar] [CrossRef] [PubMed]


Publisher’s Note: MDPI stays neutral with regard to jurisdictional claims in published maps and institutional affiliations. |
© 2022 by the authors. Licensee MDPI, Basel, Switzerland. This article is an open access article distributed under the terms and conditions of the Creative Commons Attribution (CC BY) license (https://creativecommons.org/licenses/by/4.0/).
Share and Cite
Veszelka, S.; Mészáros, M.; Porkoláb, G.; Rusznyák, Á.; Réti-Nagy, K.S.; Deli, M.A.; Vecsernyés, M.; Bácskay, I.; Váradi, J.; Fenyvesi, F. Effects of Hydroxypropyl-Beta-Cyclodextrin on Cultured Brain Endothelial Cells. Molecules 2022, 27, 7738. https://doi.org/10.3390/molecules27227738
Veszelka S, Mészáros M, Porkoláb G, Rusznyák Á, Réti-Nagy KS, Deli MA, Vecsernyés M, Bácskay I, Váradi J, Fenyvesi F. Effects of Hydroxypropyl-Beta-Cyclodextrin on Cultured Brain Endothelial Cells. Molecules. 2022; 27(22):7738. https://doi.org/10.3390/molecules27227738
Chicago/Turabian StyleVeszelka, Szilvia, Mária Mészáros, Gergő Porkoláb, Ágnes Rusznyák, Katalin Szászné Réti-Nagy, Mária A. Deli, Miklós Vecsernyés, Ildikó Bácskay, Judit Váradi, and Ferenc Fenyvesi. 2022. "Effects of Hydroxypropyl-Beta-Cyclodextrin on Cultured Brain Endothelial Cells" Molecules 27, no. 22: 7738. https://doi.org/10.3390/molecules27227738