Article

Chemistry and Bioactivity of Microsorum scolopendria (Polypodiaceae): Antioxidant Effects on an Epithelial Damage Model

by
Cristóbal Balada
1,
Valentina Díaz
1,
Mónica Castro
2,
Macarena Echeverría-Bugueño
3,4,
María José Marchant
1 and
Leda Guzmán
1,*
1
Laboratorio de Biomedicina y Biocatálisis, Instituto de Química, Facultad de Ciencias, Pontificia Universidad Católica de Valparaíso, Avenida Universidad 330, Valparaíso 2340000, Chile
2
Laboratorio de Propagación, Escuela de Agronomía, Facultad de Ciencias Agronómicas y de los Alimentos, Pontificia Universidad Católica de Valparaíso, La Palma S/N, Quillota 2260000, Chile
3
Laboratorio de Patología de Organismos Acuáticos y Biotecnología Acuícola, Facultad de Ciencias de la Vida, Universidad Andrés Bello, Quillota 980, Viña del Mar 2531015, Chile
4
Centro Interdisciplinario para la Investigación Acuícola (INCAR), Universidad Andrés Bello, Quillota 980, Viña del Mar 2531015, Chile
*
Author to whom correspondence should be addressed.
Molecules 2022, 27(17), 5467; https://doi.org/10.3390/molecules27175467
Submission received: 30 July 2022 / Revised: 19 August 2022 / Accepted: 22 August 2022 / Published: 25 August 2022

Abstract

:
Microsorum scolopendia (MS), which grows on the Chilean island of Rapa Nui, is a medicinal fern used to treat several diseases. Despite being widely used, this fern has not been deeply investigated. The aim of this study was to perform a characterization of the polyphenolic and flavonoid identity, radical scavenging, antimicrobial, and anti-inflammatory properties of MS rhizome and leaf extracts (RAE and HAE). The compound identity was analyzed through the reversed-phase high-performance liquid chromatography (RP-HPLC) method coupled with mass spectrometry. The radical scavenging and anti-inflammatory activities were evaluated for DPPH, ORAC, ROS formation, and COX inhibition activity assay. The antimicrobial properties were evaluated using an infection model on Human Dermal Fibroblast adult (HDFa) cell lines incubated with Staphylococcus aureus and Staphylococcus epidermidis. The most abundant compounds were phenolic acids between 46% to 57% in rhizome and leaf extracts, respectively; followed by flavonoids such as protocatechic acid 4-O-glucoside, cirsimaritin, and isoxanthohumol, among others. MS extract inhibited and disaggregated the biofilm bacterial formed and showed an anti-inflammatory selective property against COX-2 enzyme. RAE generated a 64% reduction of ROS formation in the presence of S. aureus and 87.35% less ROS in the presence of S. epidermidis on HDFa cells. MS has great therapeutic potential and possesses several biological properties that should be evaluated.

1. Introduction

Microsorum scolopendria (MS) is a fern that grows on the Chilean island of Rapa Nui and is known to the indigenous people as “Matu’a Pua’a.” MS is native to Polynesian islands, including Fiji, Tahiti, Hawaii, Rapa Nui, and Madagascar [1], where it is used to treat asthma, inflammatory diseases, and cancer [2]. MS is known under different names, among them Phymatosorus scolopendria, Polypodium scolopendria, and Microsorum parksii [3,4], Polypodium scolopendria, and Microsorum parksii [3,4]. As a member of the Polypodiaceae family, MS has a creeping rhizome 5–7 mm in diameter and leathery-textured leaves with visible veins [5]. Many of the properties attributed to ferns (and plants in general) have been associated with high contents of polyphenols in plant tissues [6,7,8]. More than eight thousand phenolic compounds have been reported in various plant species [9,10]. Polyphenols are widely used in the pharmaceutical, cosmetic, and food industries [11], mainly due to their properties as antioxidants, antimicrobial agents, and inhibitors of pro-inflammatory mediators [12]. There is some diversity in the structure of polyphenols, which has led to their subdivision into families centered on phenolic acids, stilbenes, and flavonoids.
MS has not been extensively investigated through phytochemical analyses or characterization of its medicinal properties, despite being widely used by the indigenous people of Rapa Nui. A MEDLINE search using the terms “Polypodium scolopendria or Microsorum scolopendria” yielded only three articles in 21 years (between 2000 and 2021). Thus, MS has been very under-researched so far, only some studies have explored its ecdysteroid content [3]. Due to its importance in traditional Rapa Nui medicine, where it is used to treat a wide variety of ailments, the number of specimens is declining. In fact, the conservation status of MS is now classified as “vulnerable” in Chile. It is important to investigate whether it is safe to consume fern material as part of folk medicine, given that certain compounds can be toxic if ingested in large quantities. Thus, the purpose of this study was to perform a functional characterization of Rapa Nui MS rhizome and leaf extracts with respect to their polyphenolic and flavonoid identity, radical scavenging, antimicrobial, and anti-inflammatory properties. To this end, the reversed-phase high-performance liquid chromatography (RP-HPLC) method coupled with mass spectrometry was used [13]. The radical scavenging capacity of the MS extracts was determined by the DPPH (1,1-diphenyl-2-picrylhydrazyl) radical scavenging method and the oxygen radical absorbance capacity (ORAC) method. The antimicrobial activity against Staphylococcus aureus and Staphylococcus epidermidis was evaluated in an infection model using the Human Dermal Fibroblast adult (HDFa) cell line. The two bacteria are frequently associated with infections in implants, peripheral venous catheters, and skin [14,15].
Bacterial infections, pathologies caused by UV exposure, and cancer share a common inflammatory process, triggered by the activation and downregulation of several signaling pathways, in which reactive oxygen species (ROS) induce certain cellular disorders. Signal transduction in conditions involving ROS-mediated metabolic activity, inflammatory activity, and metabolic dysfunction is, therefore, an important therapeutic focus for the control of various diseases [16]. In addition, we demonstrated that these extracts have anti-inflammatory, radical scavenging capacity, and sun protection properties.

2. Results

2.1. Characterization of the Principal Chemical Components in MS Extracts

2.1.1. Determination of Secondary Metabolites

The results presented in Table 1 show the mass (mg) of the dry extract obtained from each sample evaluated per g of sample. The leaf extracts treated with ethyl acetate were found to have higher yields in mg/g.
For both types of extracts, polyphenol content was determined using gallic acid (GAE) as an internal standard [17]. Total flavonoid content was determined using kaempferol (KE) as an internal standard, because of the higher sensitivity of flavanols to this technique [18]. The results were expressed as mg GAE/g dry sample for all polyphenols analyzed and mg KE/g dry sample for flavonoids, as shown in Table 2.
The results show that RAE, which corresponds to the rhizome extract, contains more total polyphenols and total flavonoids than HAE.

2.1.2. RP-HPLC-MS/MS of MS Extracts

Reversed-phase high-performance liquid chromatography (RP-HPLC) in combination with a mass spectrometer, a method commonly used for characterization or separation, was employed to identify phenolic, flavonoid, and other compounds. The instruments allow for extract evaluation to be performed in positive and negative modes. The percentages of polyphenol families present in the extracts were determined using molecular weights of over 1200 samples from the Phenol-Explorer database (Material and Methods), as shown in Figure 1. For both rhizome and leaf extracts, the predominant family was found to be phenolic acids, followed by flavonoids.
Table 3 ranks the compounds with the highest relative abundance in the two MS extracts. In the case of the RAE extract, the compound with the highest relative abundance was pyrogallol, a furanocoumarin, with a reading of 9.32%. This molecule is found primarily in the rhizomes of various plants [19,20]. It was followed by the flavanone isoxantohumol with a relative abundance of 9.09%. Thus, the family with the highest relative abundance was flavonoids, which were found to be the main polyphenols in this extract.
In the leaf extract (HAE), the compound with the highest relative abundance was p-coumaroyl tartaric acid, a derivative of hydroxycinnamic acid, with a relative abundance of 28%. The relative abundance of daidzein in the HAE extract was 10.85%, with daidzin 7-O-glucosidehe being the only daidzein derivative detected.

2.2. Radical Scavenging Capacity of MS Extracts

Radical Scavenging Capacity Measurement and Sun Protection Factor (SPF) Evaluation

The radical scavenging capacity of both extracts was evaluated using the DPPH radical molecular inhibition method and the Oxygen Radical Absorbance Capacity (ORAC) method, both commonly used to measure the radical scavenging capacity of substances.
Table 4 shows the results of DPPH and ORAC radical scavenging capacity measurements in MS extracts. GAE and vitamin C were used as positive controls in the DPPH inhibition assays and TROLOX in the ORAC assay.
Natural compounds such as phenols and flavonoids have generated recent interest as potential sunscreen ingredients with radical scavenging capacity because of their absorption in the UV-B region. To correlate radical scavenging capacity with UV protection factor, we evaluated the SPF potential of the extracts using a common in vitro spectroscopic method that measures wavelengths between 280 nm and 400 nm [21]. In this study, SPF was obtained for the extracts dissolved in ethanol by running from 292.5 to 320 nm at 5 nm intervals [21]. The obtained measurements of the SPF factor are shown in Table 5 and reported as SPF detected. The equivalent SPF values and SPF levels according to ISO 24443 are also shown. RAE was found to have a moderate SPF level, and HAE, a moderately high SPF level.

2.3. Antimicrobial Assays

Minimum Inhibitory Concentration

In order to determine the capacity of both extracts to inhibit the growth of S. aureus and S. epidermidis, the minimum inhibitory concentration test was performed.
The RAE and HAE extracts tested on microorganisms showed no microbial sensitivity to either of the two extracts at the concentrations evaluated in this study, as shown in Table 6.
Although neither extract had inhibitory effects on microbial growth, they were able to interfere with bacterial biofilm formation. The 48-h incubation of microorganisms with RAE and HAE MS extracts at concentrations ranging from 0 to 512 μg/mL showed a dose-dependent inhibitory effect of the extracts on biofilm formation. This effect was more pronounced in the RAE extract against S. epidermidis; however, both extracts showed inhibitory effects against both bacteria. In biofilm disruption assays, higher concentrations of RAE and HAE were found to have a more pronounced effect against S. epidermidis than S. aureus, as shown in Figure 2B,C.

2.4. Inhibition of COX Enzymes

The COX-1 enzyme is constitutively expressed and is considered to be a maintenance protein responsible for the physiological functioning of the cell. COX-2, on the other hand, is an inducible enzyme, and its expression is activated when tissue damage or inflammatory conditions occur. Inhibition of COX-1 results in side effects such as platelet aggregation inhibition and melanoma formation [22], while inhibition of COX-2 has therapeutic effects on inflammation-induced pain [23]. Because of the importance of these enzymes for the human organism, the inhibitory effects of the extracts on both enzymes were evaluated. Table 7 shows the IC50 values for the effect of MS extracts on the COX enzymes. The results indicate that both extracts selectively inhibit (selectivity index) the COX-2 and COX-1 enzymes, but RAE has higher selectivity index than HAE. The positive controls used were SC560 for COX-1 and Celecoxib for COX-2 [24].

2.5. Cell Line and Treatments

2.5.1. HDFa Cell Line Cytotoxicity Assay

The cytotoxicity of both extracts was evaluated on the HDFa cell line using the MTS assay measuring the formazan formation, allowing for the determination of the mitochondrial functionality of the treated cells. The results showed that the extracts used in this study (1 to 100 μg/mL) had no detrimental effect on dermal cells (Figure 3).

2.5.2. Evaluation of Cytotoxicity to HDFa in Infections Caused by S. aureus and S. epidermidis

HDFa cells were infected at an MOI of 5; the concentrations used are shown in Figure 4. The release of the LDH enzyme was used as a marker of damage to the cell membrane [25]. Figure 4A shows that when cells were incubated with S. aureus, LDH release increased by almost 60% at 6 h post infection, indicating cell death. However, this effect was markedly diminished when cells were incubated simultaneously with MS extracts and the bacteria.
Less LDH release was observed in assays in which S. epidermidis and MS extracts were simultaneously in contact with cells.

2.5.3. Formation of Reactive Oxygen Species in the HDFa Cell Line

Reactive oxygen species (ROS) are a key marker of inflammation pathway and macromolecular damage. To evaluate the effect of the MS extracts on cell membrane damage and inflammation, ROS formation was measured generating damage using an MOI of 5 S. aureus or S. epidermidis using the H2DCFDA-DCF probe. To this end, the HDFa cell line was incubated with MS for 3 h (Figure 5A). It was determined that the extracts tended to slightly reduce normal ROS levels. When HDFa cells were simultaneity exposed to S. aureus and MS extracts for 3 h of incubation, a significant reduction in intracellular ROS formation was observed compared to ROS generated in the presence of S. aureus without the extracts (Figure 5B). Cells treated with 63 µg/mL RAE generated 76.88% ROS. However, when HDFa cells were preincubated with the extracts for 3 h and then infected with S. aureus or S. epidermidis and incubated for an additional 3 h, the extracts also reduced ROS formation. The best result was obtained with 100 µg/mL RAE extract compared to 63 µg/mL RAE extract, with the HAE extract at the same concentrations (Figure 5B).

3. Discussion

There is a wealth of information on the medicinal properties of various plants, including radical scavenging capacity, anti-inflammatory, and antimicrobial effects, which are useful in the treatment of many diseases. These properties are associated with phytochemicals such as polyphenols, flavonoids, and triterpenes. However, there are very few reports on the properties of MS. In this paper, we studied two MS extracts (rhizome and leaf) and found that the RAE and HAE extracts had different contents of secondary metabolites. For example, the RAE extract had a very high content of polyphenols and flavonoids per gram of dry sample. Plants are known to contain high concentrations of polyphenols as a defense mechanism against pathogens [26].
It has been reported in the literature that ethyl acetate extracts are rich in phenolic components [27,28,29,30,31]. We found that more than 50% of the phenolic content of the RAE and HAE extracts consisted of flavonoids. Similar results have been described by other authors [30,32].
The amounts of phenols and flavonoids have been previously reported in MS from Tamil Nadu in India [33], but there are no studies on MS from Rapa Nui. The main methods used for the quantification and characterization of extracts from plants are the spectrophotometric and chromatographic methods. In this study, the identification of phenols, flavonoids, and other compounds was performed by the RP-HPLC-MS/MS method, while concentrations were analyzed by the spectrophotometric method. 
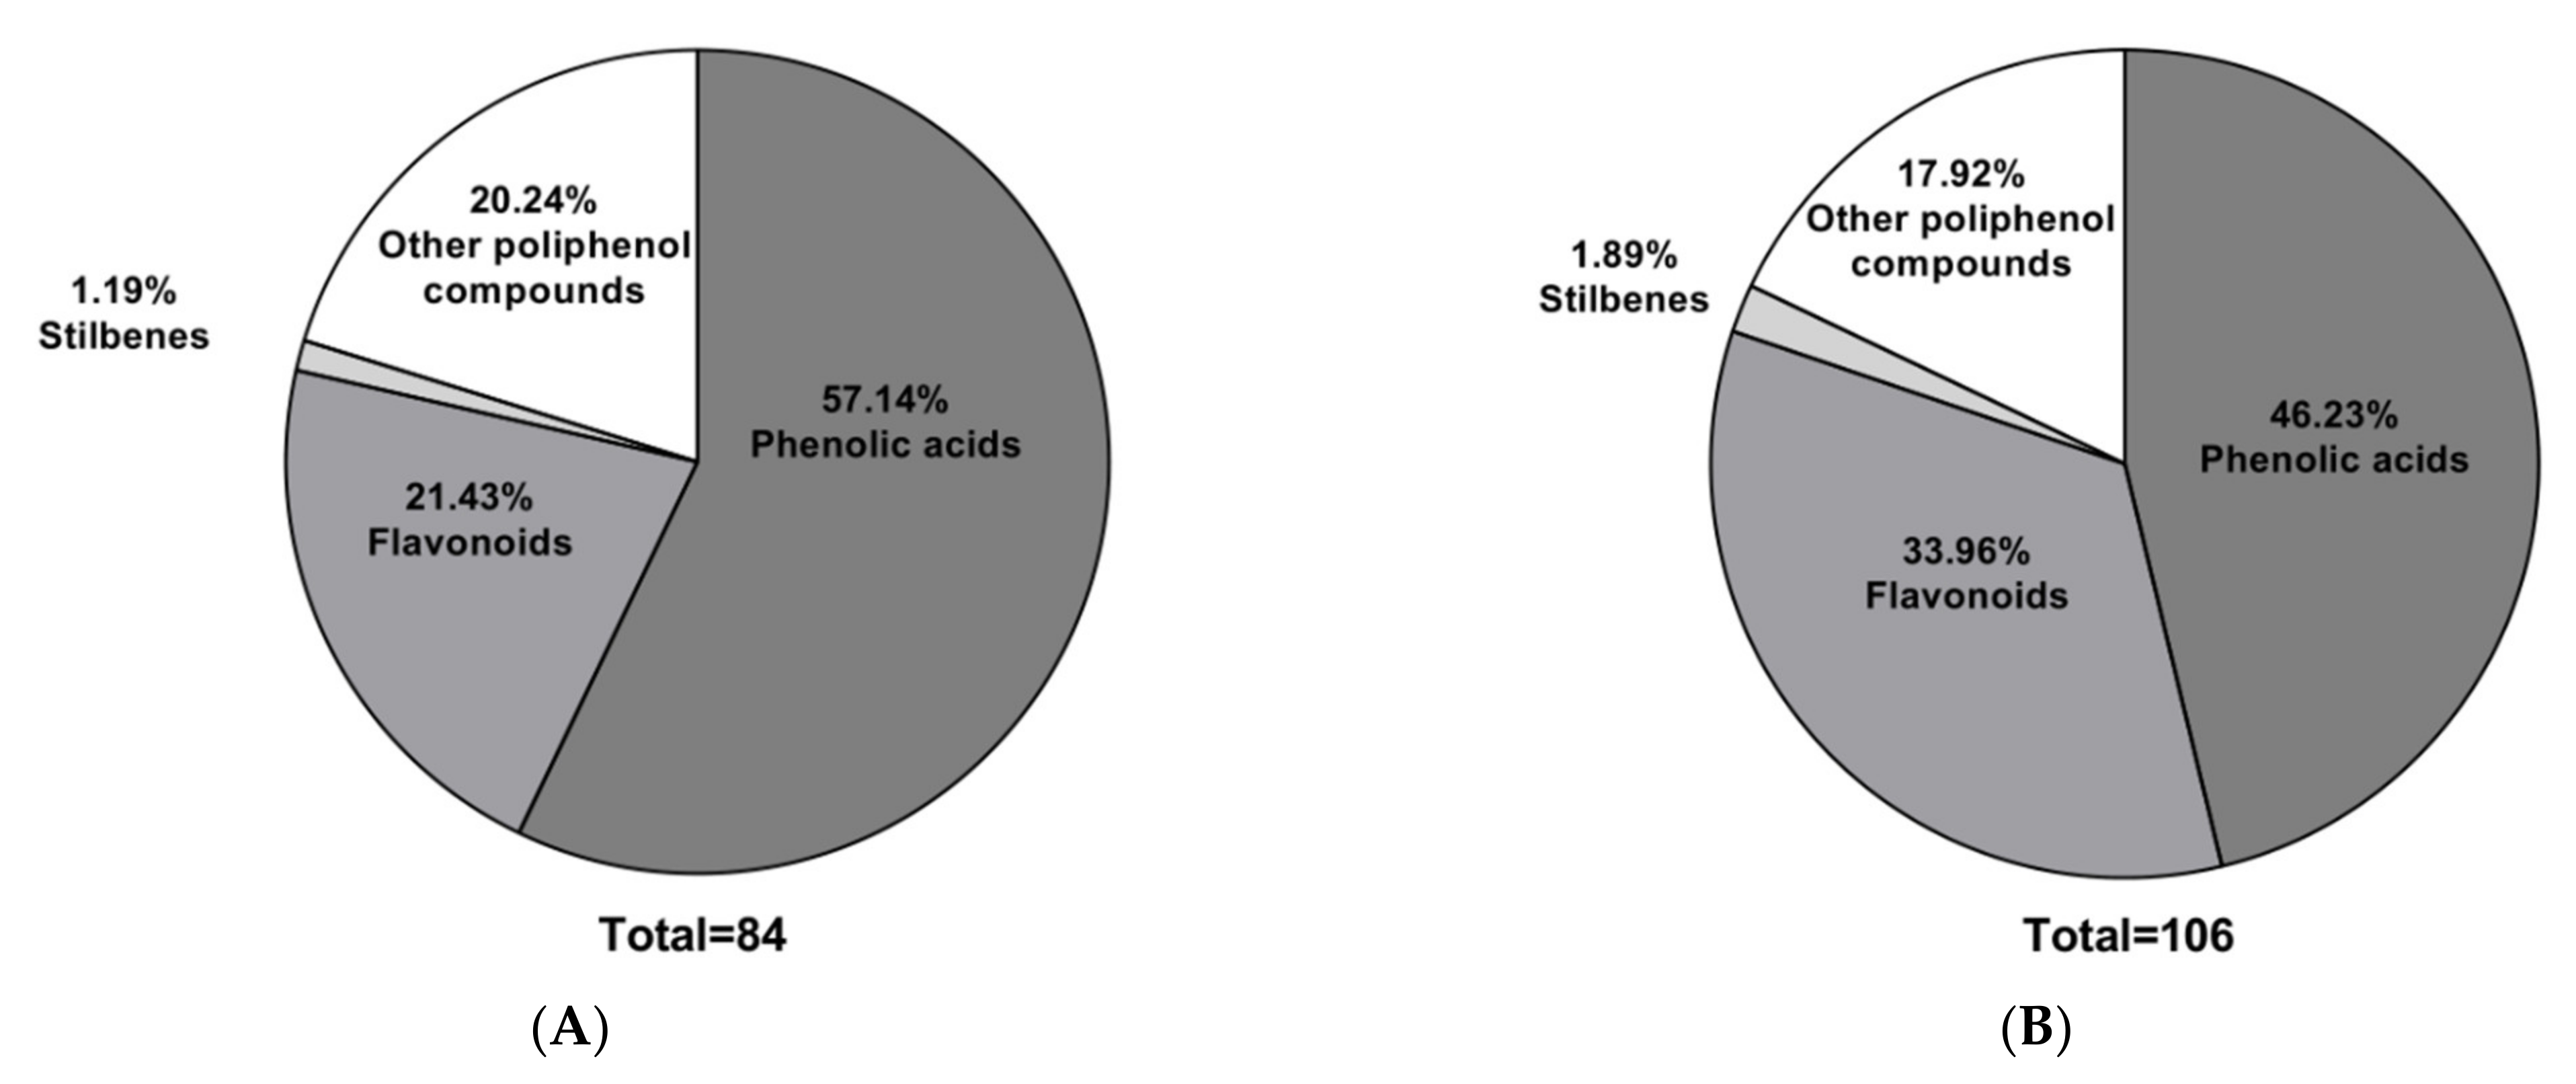
Figure 1 shows that phenolic acids were the predominant class, accounting for over 45% in both extracts. These compounds correspond mainly to the derivatives of hydroxybenzoic and hydroxycinnamic acids, as has been observed in several ferns (Tables S1 and S2) [34,35]. The second class is flavonoids and other types of polyphenols, with an emphasis on coumarin derivatives, as previously reported for MS extracts from Mahanoro, Madagascar [1]. Similar results have been reported for the edible fern Diplazium esculentum from India [36], whose leaves contain about 40% flavonoids. In addition, a variety of hydroxycinnamic acids were found mostly in the leaf samples of the fern Stenochlaena palustris from Malaysia [37].
The flavonoids found in this study correspond to both flavonoids and their glycosides, presumably luteolin, kaempferol, isorhamnetin, and their derivatives. The average molecular mass of flavonoids is 345 g/mol, shifting toward 280 g/mol (Tables S3 and S4). Flavonoids with a basic structure have molecular weight of 222.24 g/mol, similar to phenolic acids, and the majority of the flavonoids found were glycosylated. Members of the stilbene group (Tables S5 and S6), resveratrol (negative mode in the HAE extract and positive mode in the RAE extract), and pterostilbene (positive mode in HAE) were also detected. Stilbenes are produced in a variety of plant species, including Vitis vinifera, red berries, and peanuts [38,39]. Studies have demonstrated the important role of resveratrol in human health.
We found that 44% of the phenolic acids detected belonged to the hydroxycinnamic acid subclass and 44% to the hydroxybenzoic acid subclass. The average weight of the phenolic acid found was 277 g/mol, shifting toward 200 g/mol. The molecular weights of phenolic acids ranged from 120 to 220 g/mol, and the phenolic acids found in this study were predominantly glycosylated. Glycosylated molecules tend to be more bioavailable upon ingestion due to their altered bioavailability properties, membrane disintegration, bioactivity, and metabolic stability [40].
The other types of polyphenols were mostly coumarin derivatives, e.g., sculetin and isopimpinellin. This class of polyphenols has a broader range of molecular masses, ranging from low molecular weight molecules such as pyrogallol (126.11 g/mol) to more complex molecules such as 5-heneicosenylresorcinol (402.7 g/mol).
The extract with the best radical scavenging capacity in the DPPH inhibition assay was RAE, with an inhibition rate of 82.96%. The observed values are consistent with the results described by Ding [41], who analyzed 31 fern extracts from Asia and found that the IC50 ranged between 5.9 µg/mL and 133.2 µg/mL, with an average of 39.47 ± 35.92 µg/mL. Our results showed that the IC50 values of the RAE and HAE extracts in the DPPH inhibition assay were 12.05 µg/mL and 20.34 µg/mL, respectively, which is close to the values reported by Ding [41]. In the ORAC test, the highest radical scavenging capacity was demonstrated by the RAE extract, with an ORAC value of 1.63 (Table 4).
There is evidence to suggest that MS extracts have a cytoprotective effect against UV-B ray damage to human epithelial cells [42]. Thus, MS may have both an epithelial protective effect at the cellular level and an effect as a sunscreen filter at the dermal level. Indeed, HAE extracts were observed to have an SPF of 20 (medium-high level) and RAE an SPF of 15 (medium level). Therefore, it is quite exciting to consider the possibility that some MS compounds may find their way into cosmetic products.
Based on the “Performance standards for antimicrobial susceptibility tests” [43] of the “Clinical and Laboratory Standards Institute” (CLSI), S. aureus can be resistant to MS extracts and susceptible to kanamycin and chloramphenicol; S. epidermidis is resistant to MS and kanamycin extracts and moderately susceptible to chloramphenicol (Table 6). Even though the extracts did not show strong antimicrobial activity, they were effective in inhibiting and disrupting biofilms formed by the bacteria S. aureus and S. epidermidis (Figure 2). Bacteria of the genus Staphylococcus are recognized as the most frequent causes of infections involving biofilm formation. Skin infections in humans are frequently colonized by commensal bacteria such as S. aureus. These bacteria cause epithelial dysbiosis and increase biofilm formation [44].
Assays with 512 µg/mL pyrogallol show an MIC value against S. aureus [43] without compromising the integrity of the MO membrane [45,46], an effect also observed with resveratrol [47]. Chin [48] reported that daidzein and daidzin have lower MIC values than pyrogallol against S. aureus, with daidzein being more effective than daidzin. Daidzeinhad an MIC concentration of 64 µg/mL and the daidzin of 128 µg/mL [48]. These results suggest that the total polyphenol concentration in the samples is not relevant for the antimicrobial activity, indicating that the activity may have decreased due to the presence of other molecules in the extracts. The results also show that S. epidermidis is more sensitive to MS extracts than S. aureus, due to the presence of other components in the extracts, such as cirsimaritin [49] and resveratrol [50]. Our own results were similar, as both extracts had an effect on S. epidermidis but not on S. aureus.
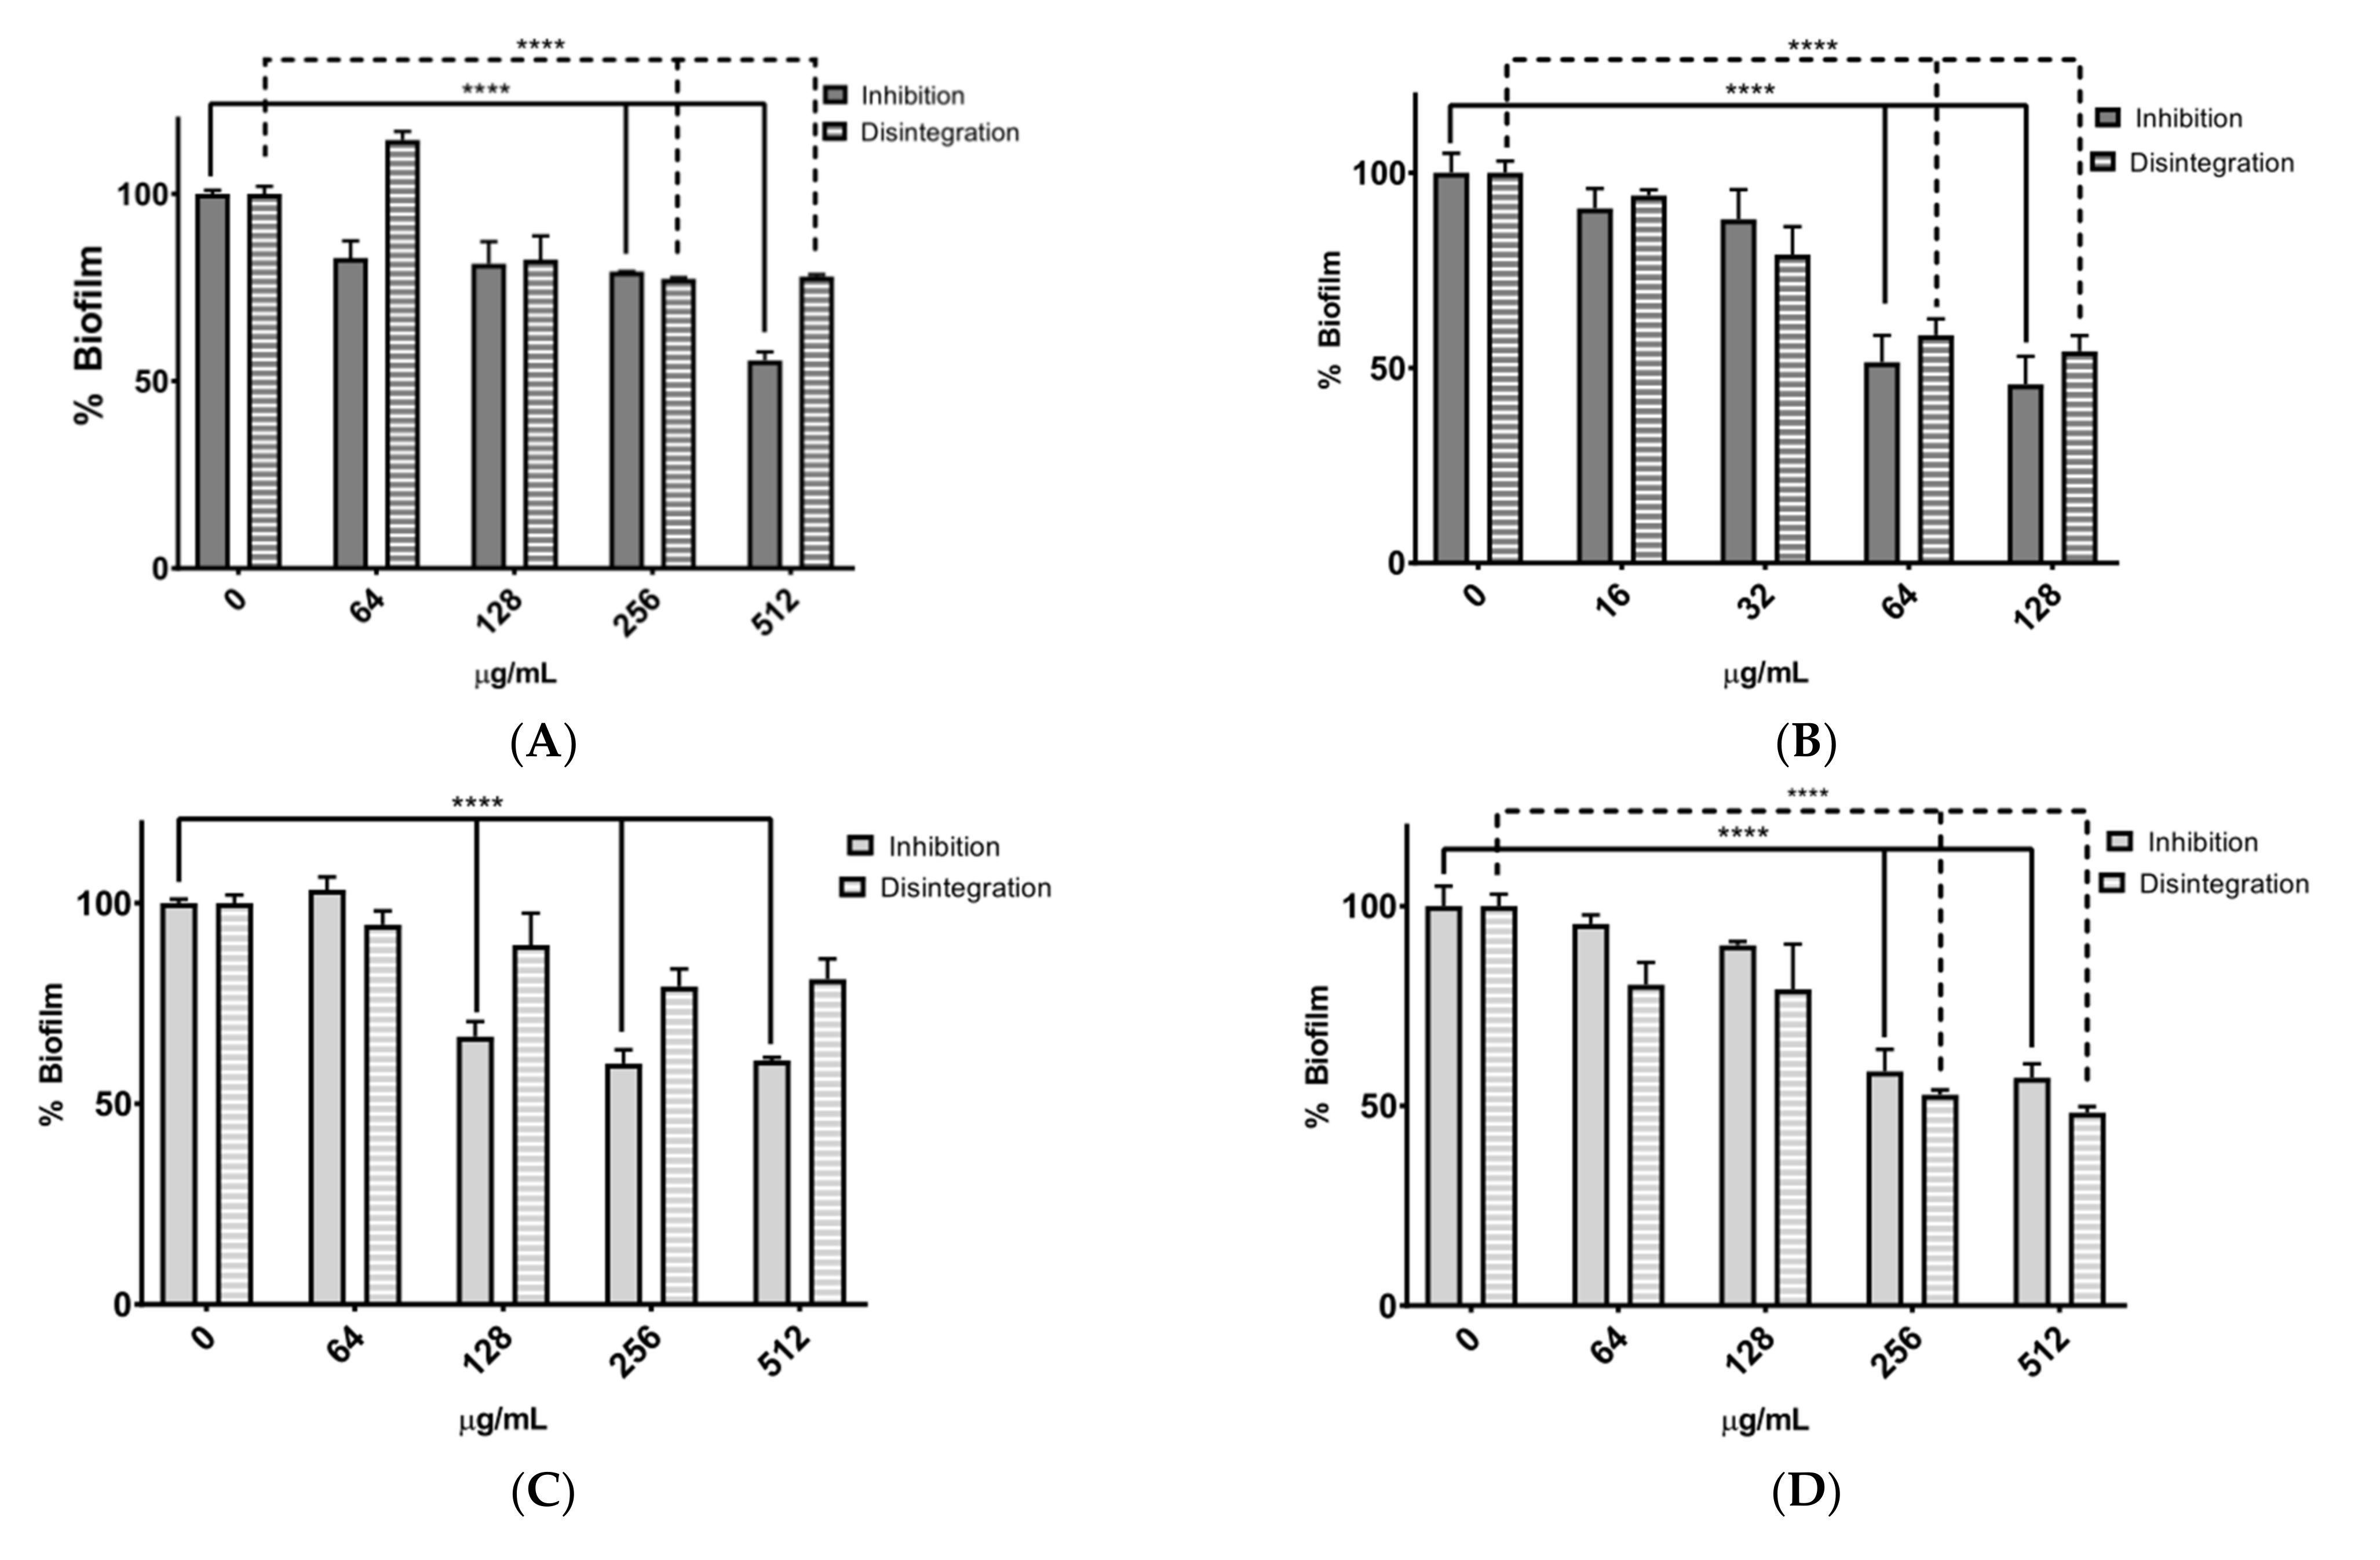
The assays performed to evaluate biofilm inhibition and disruption depended on the MIC concentration of each extract tested on the bacteria. In this study, MIC values and three serial dilutions were used for the assay. If the extract did not exhibit an MIC value, a concentration of 512 µg/mL of the extract was used. Figure 2A,B show graphs of bacterial biofilm inhibition and disruption by the RAE extract against S. aureus and S. epidermidis. In this case, the RAE extract showed significant inhibition of biofilm formation (close to 50% in the assay with 512 µg/mL) against S. aureus. These results may be attributed to the relative abundance of polyphenols such as isoxanthohumol, resveratrol, and kaempferide [51,52]. These types of compounds have been shown to have the ability to inhibit biofilm formation by downregulating the expression of genes such as rsbU and spa, which are genes responsible for bacterial adhesion, communication, and bacterial protection [53,54,55]. The extract that showed more significant inhibition of biofilm formation was RAE at 128 µg/mL against S. epidermidis.
Both extracts analyzed showed a dose-dependent effect in biofilm disruption. The results suggest that in assays against S. aureus, these extracts may inhibit bacterial biofilm formation by: (i) increasing susceptibility to antibiotics; (ii) creating instability in the bacterium. Therefore, in the future, it might be interesting to evaluate the effect of extracts on different concentrations of antibiotics in biofilm studies and to assess the possibility of reducing the antibiotic concentrations currently used to treat infections caused by these bacteria, as well as to consider the possibility of synergistic effects of the two compounds.
The inhibition assay showed a greater reduction in the percentage of biofilm. Biofilm formation consists of four steps: i.—bacteria attach to a surface; ii.—microcolonies are formed; iii.—biofilm maturation; and finally, iv.—bacteria spread to colonize other surfaces [53]. In the biofilm inhibition test, the bacteria are in steps i and ii, while in the biofilm disintegration test, the bacteria are in step iii. In this step, the barriers that constitute a defense mechanism are already present, requiring a more complex process of elimination. Assays with S. epidermidis (Figure 2B,D) confirmed that the rhizome extract inhibited biofilm formation more efficiently than the leaf extract. The HAE extract was effective in disrupting biofilms rather than inhibiting their formation. This extract is known to contain resveratrol, and it has been reported that this compound inhibits bacterial quorum sensing and disrupts bacterial biofilms of the genus Staphylococcus [54].
The different responses of the two bacteria to the evaluated extracts can be mainly attributed to multidrug resistance and the presence of virulence genes in both pathogens. S. epidermidis exhibits multidrug resistance [55,56,57], whereas S. aureus has major resistance mechanisms, making it a highly virulent bacterium tolerant to various antibiotics due to increased activation of these genes [58].
The MS extracts had no effect on S. aureus viability, but they had an effect on the formation and disruption of bacterial biofilm. It has been reported that phenolic compounds do not play a predominant role in the viability of many bacteria, but they may play a role in reducing virulence, deactivating quorum sensing, and reducing the production of α- family proteins. It has been observed that the main inhibitors that can inactivate the metabolism of bacteria [59], their adhesion to surfaces [52,60] and inhibit biofilm formation, are phenolic compounds [61,62].
The results of the inhibition of COX enzymes were complemented by the DPPH radical scavenging assays and ORAC assays, because both extracts not only have the ability to act on radical molecules, but also to inhibit their production. Although not all extracts exhibited a low IC50 for COX-2 enzyme (the results were compared with the Celecoxib drug used as positive control), they also did not show a selectivity index of less than 1. The HAE extract exhibited an IC50 of 3.52 µg/mL for COX-2 enzyme and a selectivity index of 6.84. This extract was the second-best in terms of radical scavenging ability. The RAE extract showed a IC50 of 3.14 for COX-2 and a selectivity index of 9.96. In addition, it had the highest radical scavenging capacity in the DPPH and ORAC assays (Table 4). These results are consistent with the low percentages of ROS production observed when the HDFa cell line was exposed to both bacteria. Therefore, both extracts had a protective effect on the cell line (Figure 4).
Molecules such as resveratrol, present in MS extracts, inhibit not only COX-2 expression, but also its activity [63]. Diadzein, which selectively inhibits COX-1 and COX-2 enzyme expression [64], is a compound mainly present in HAE extracts and provides excellent selectivity (Table 7). Flavonoids such as kaempferol, luteolin, and apigenin have the ability to selectively inhibit COX-1 and COX-2 [36,65]. Extracts with a higher concentration of flavonoids were found to exhibit greater selectivity against COX enzymes (Table 7).
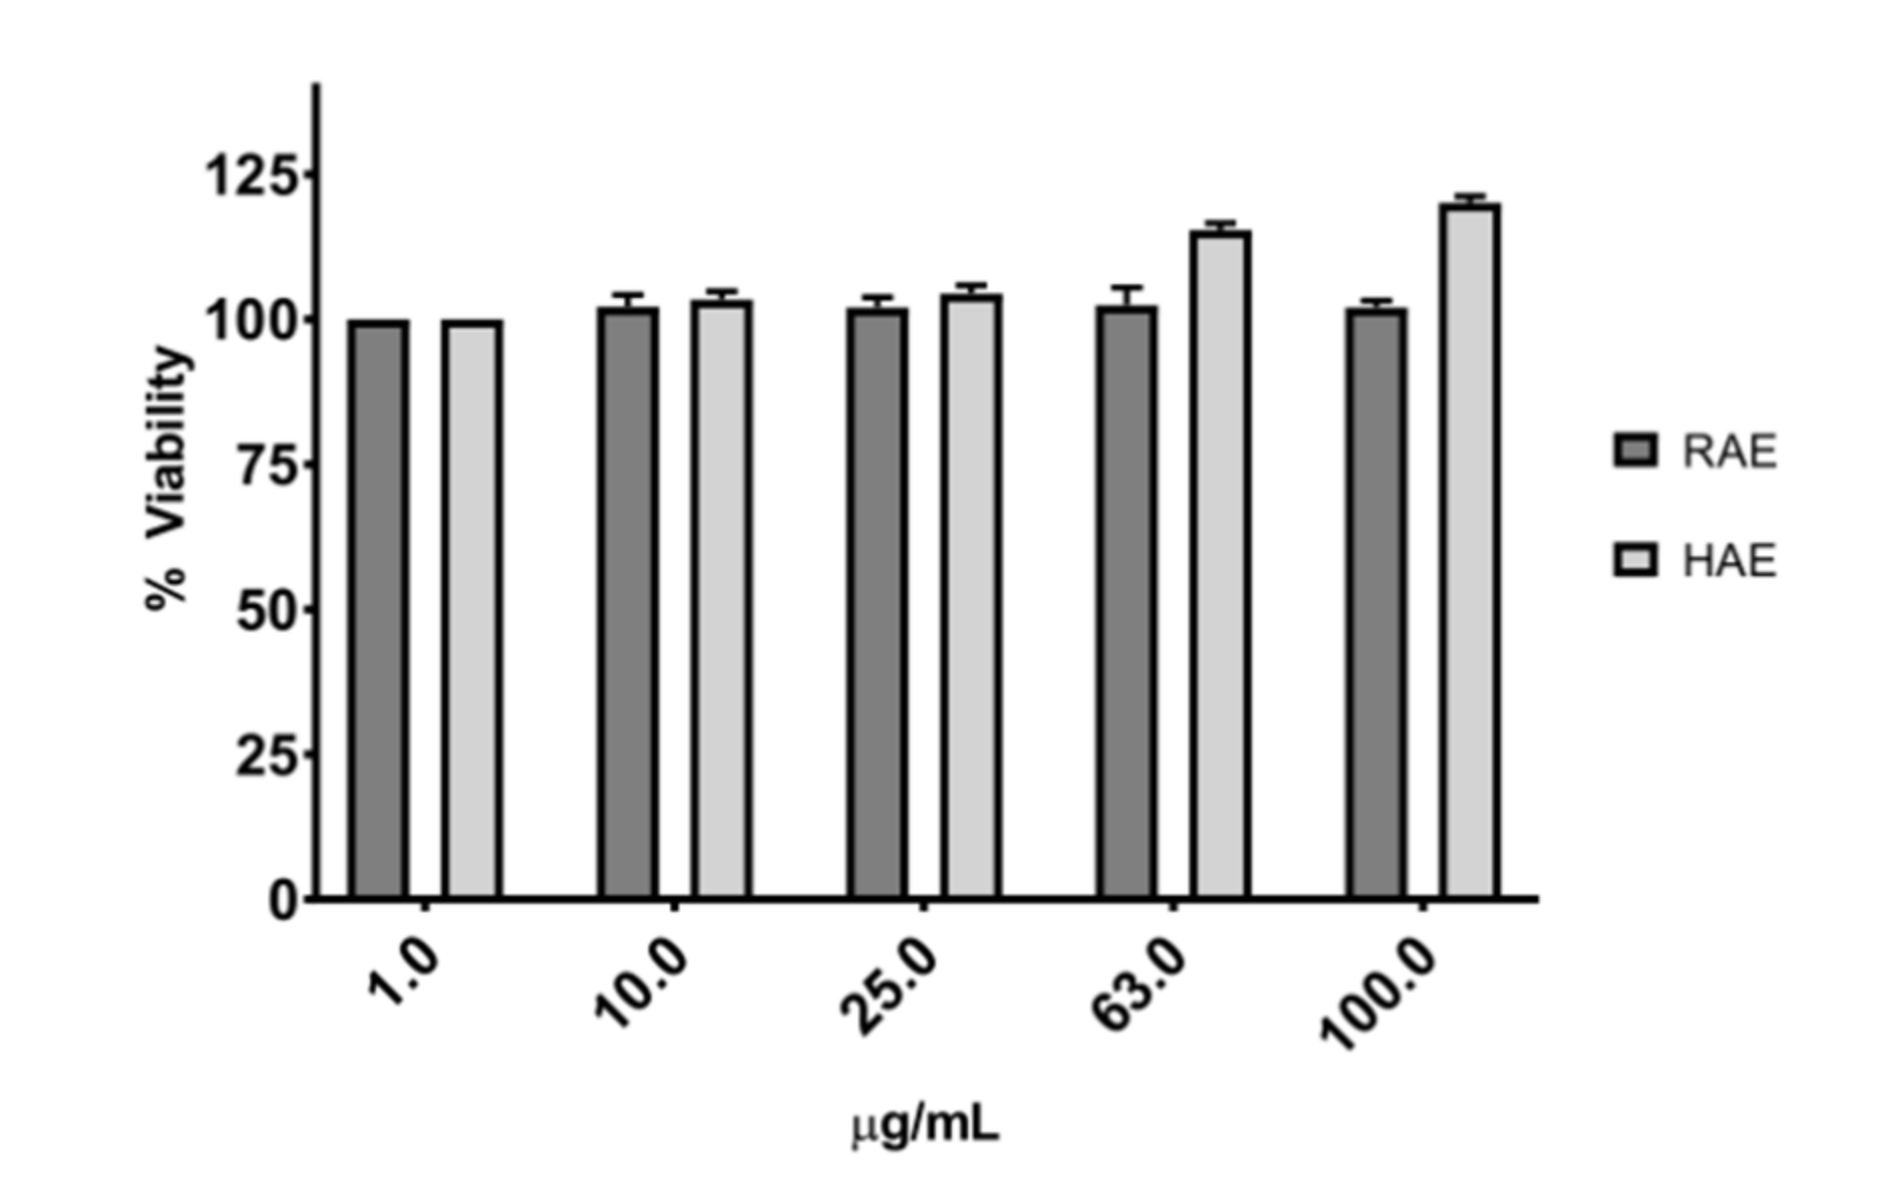
None of the extracts evaluated had any detrimental effect on cell viability, as shown in Figure 3. Studies performed with MS ethanolic extracts from Tahiti showed that they do not induce cytotoxicity on epithelial cell lines in the range of 1 to 250 µg/mL [42]. Phenolic compounds of the flavonoid family, such as cirsimaritin [66] and kaempferol [67] have been reported to increase cell viability. These compounds are present in the MS extracts studied.
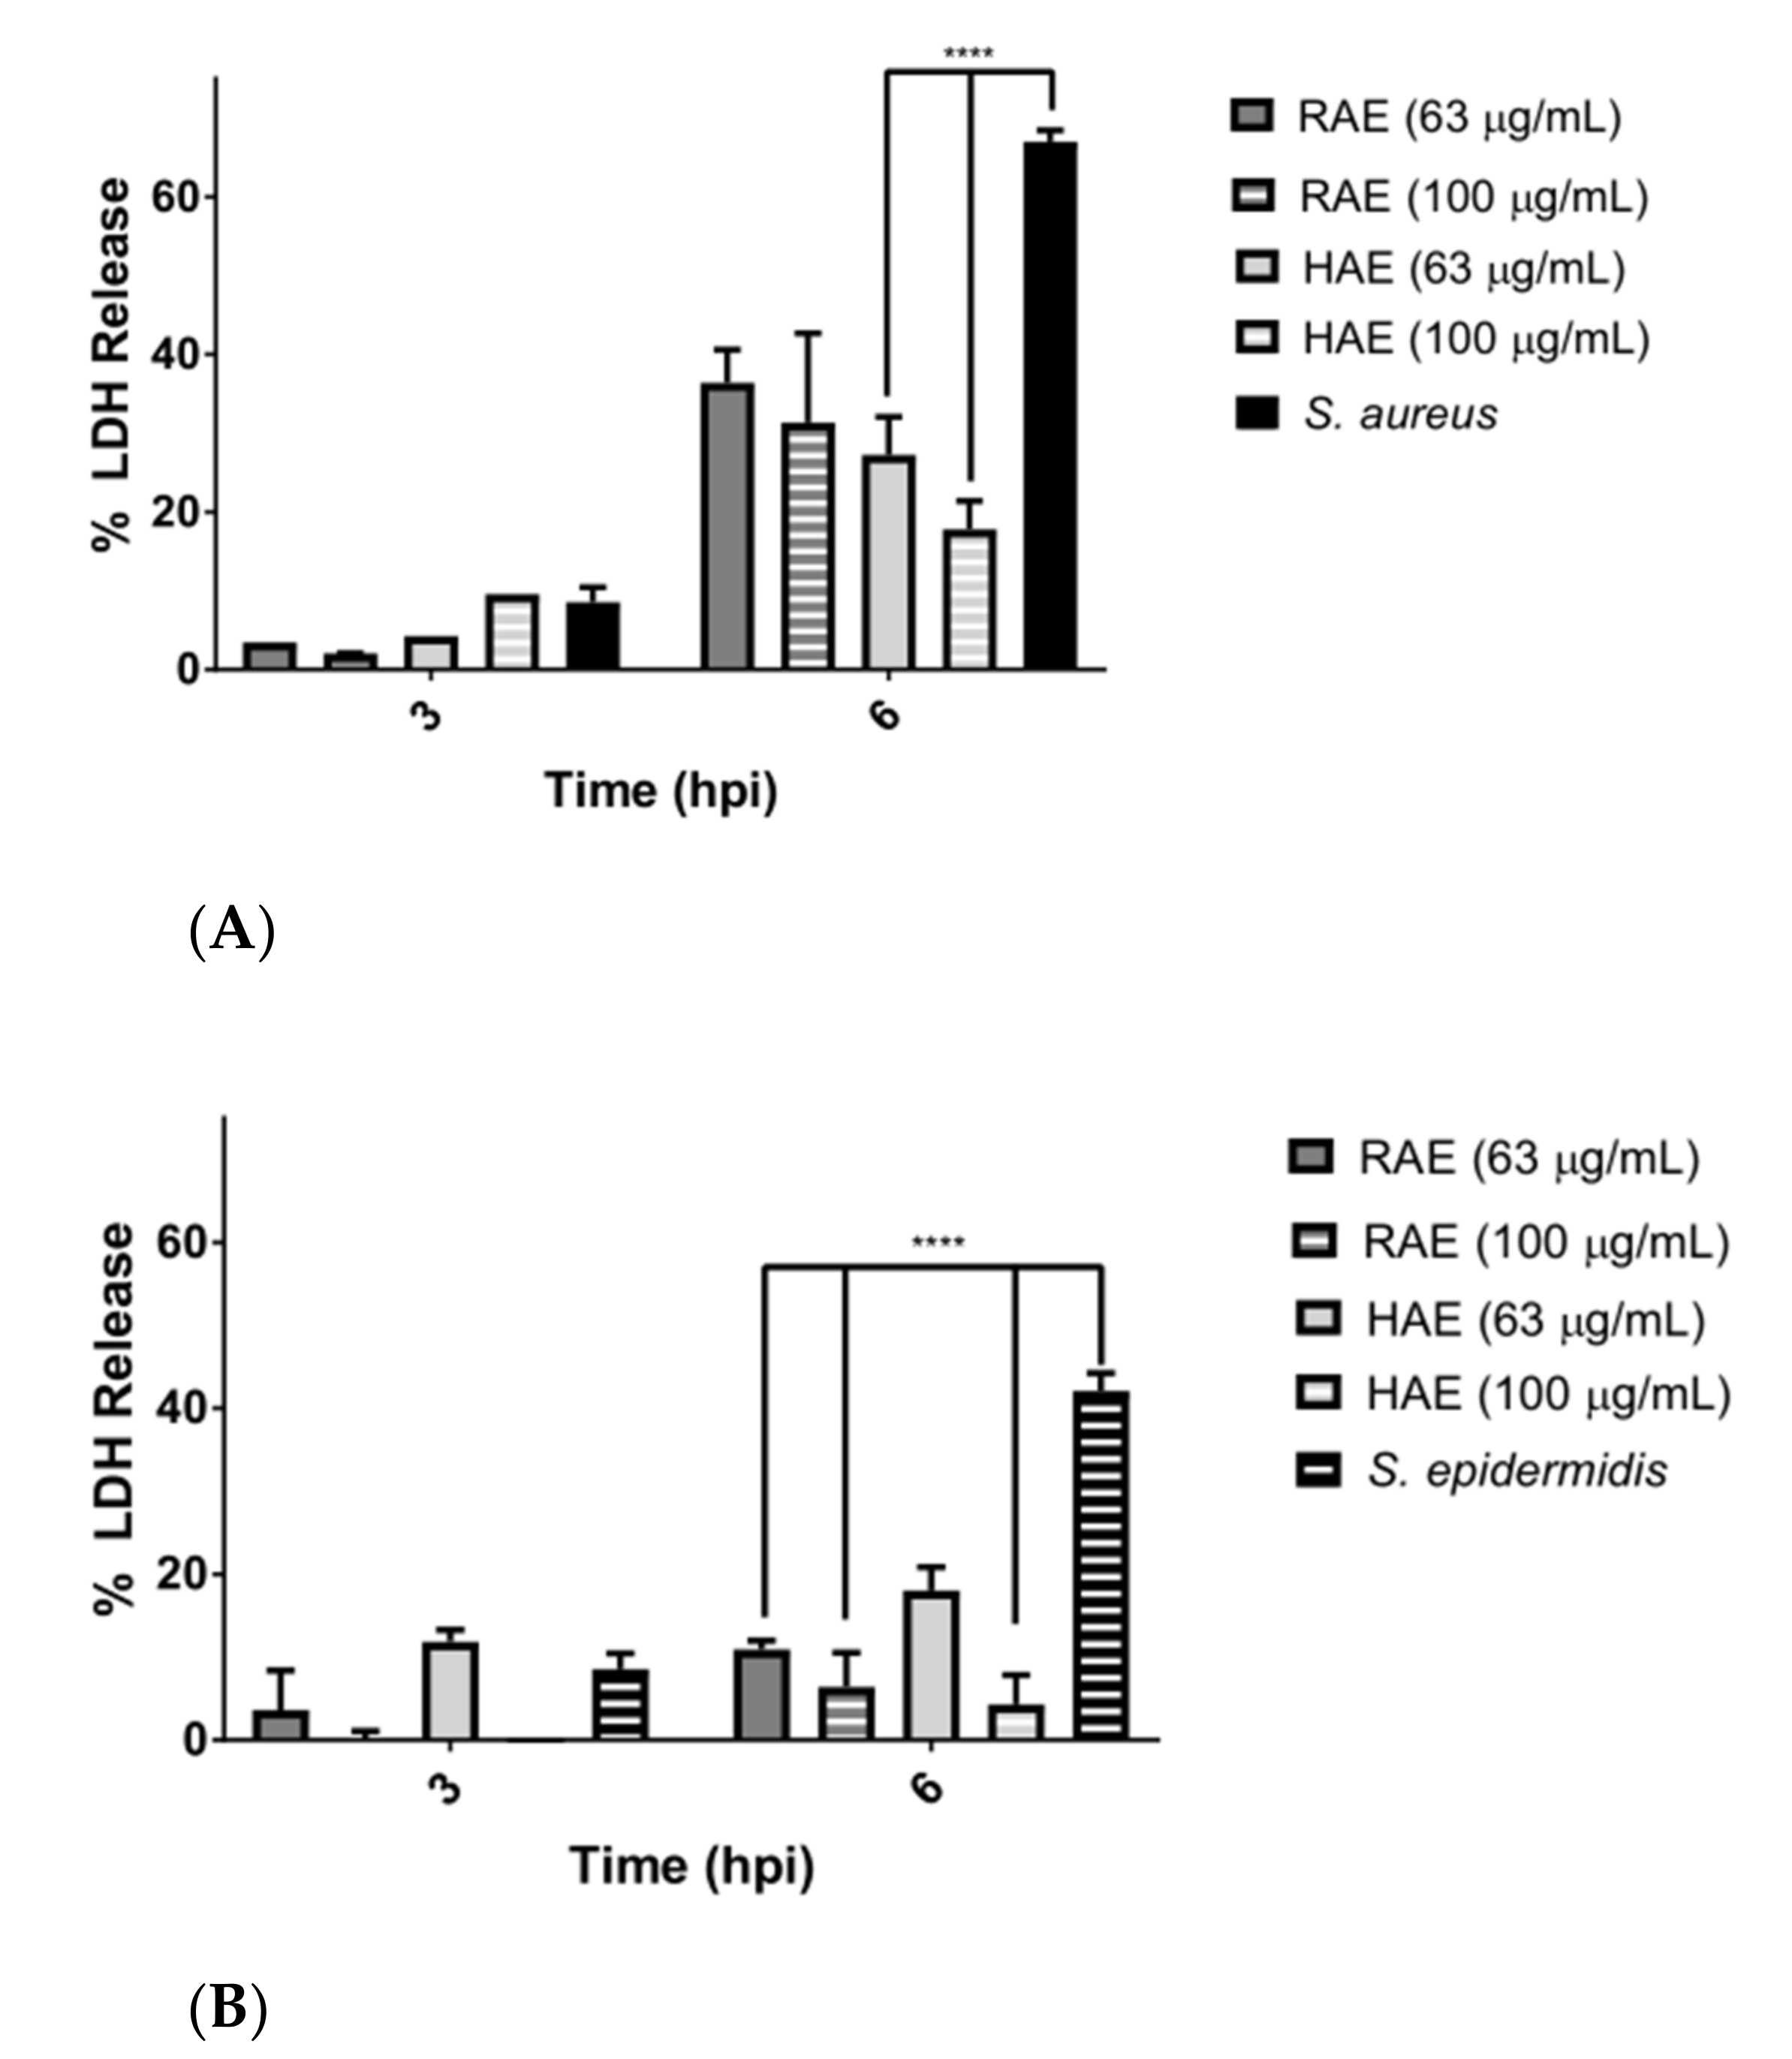
The results of the infection assays indicate the possibility that the molecules present in the extracts affect the proliferation of S. epidermidis and create a molecular cascade that helps to fight the infection, either by reducing biofilm formation, biofilm adherence to the cell, and the production of virulent proteins from this pathogen [68], or by increasing the viability of HDFa cells, as shown in Figure 3. A large difference was observed in the LDH release among the cells infected with the bacteria, but without the presence of the extracts (Figure 4A,B). These results confirmed the protective effect of the extracts on cells damaged by pathogens.
Previous reports showed that daidzein inhibits the expression of caspases 3 and 9 in viral infections in vitro [69], while pyrogallol inhibits bacterial infections in vivo [70]. In addition, a decreased release of LDH and a decreased expression of IL-1β were observed in bacterial infections, suggesting that these compounds prevent an increase in the oxidative stress produced by infections [71].
The differences between S. aureus and S. epidermidis in the rate of LDH release may be due to the fact that S. aureus interacts more aggressively with the host cell and releases exoenzymes into the intracellular medium (SpIF proteases were detected), thus disrupting the metabolism of the eukaryotic cell [58]. Meanwhile, S. epidermidis is characterized by accompanying S. aureus as an opportunistic pathogen, generating a bacterial biofilm more rapidly, and being a reservoir of multidrug-resistance genes [72,73].
The reduction in the percentage of ROS may be a product of infection inhibition or the extracts may have exerted an intracellular effect, reduced the production of ROS or decreasing their concentration. S. aureus produces Dps proteins, which are responsible for resistance to the nitric oxide and hydrogen peroxide produced by the infected cell [74,75], and are a mechanism of DNA protection. The subsequent reduction in ROS forces the infected cells to produce higher concentrations of ROS to defend themselves against pathogens.
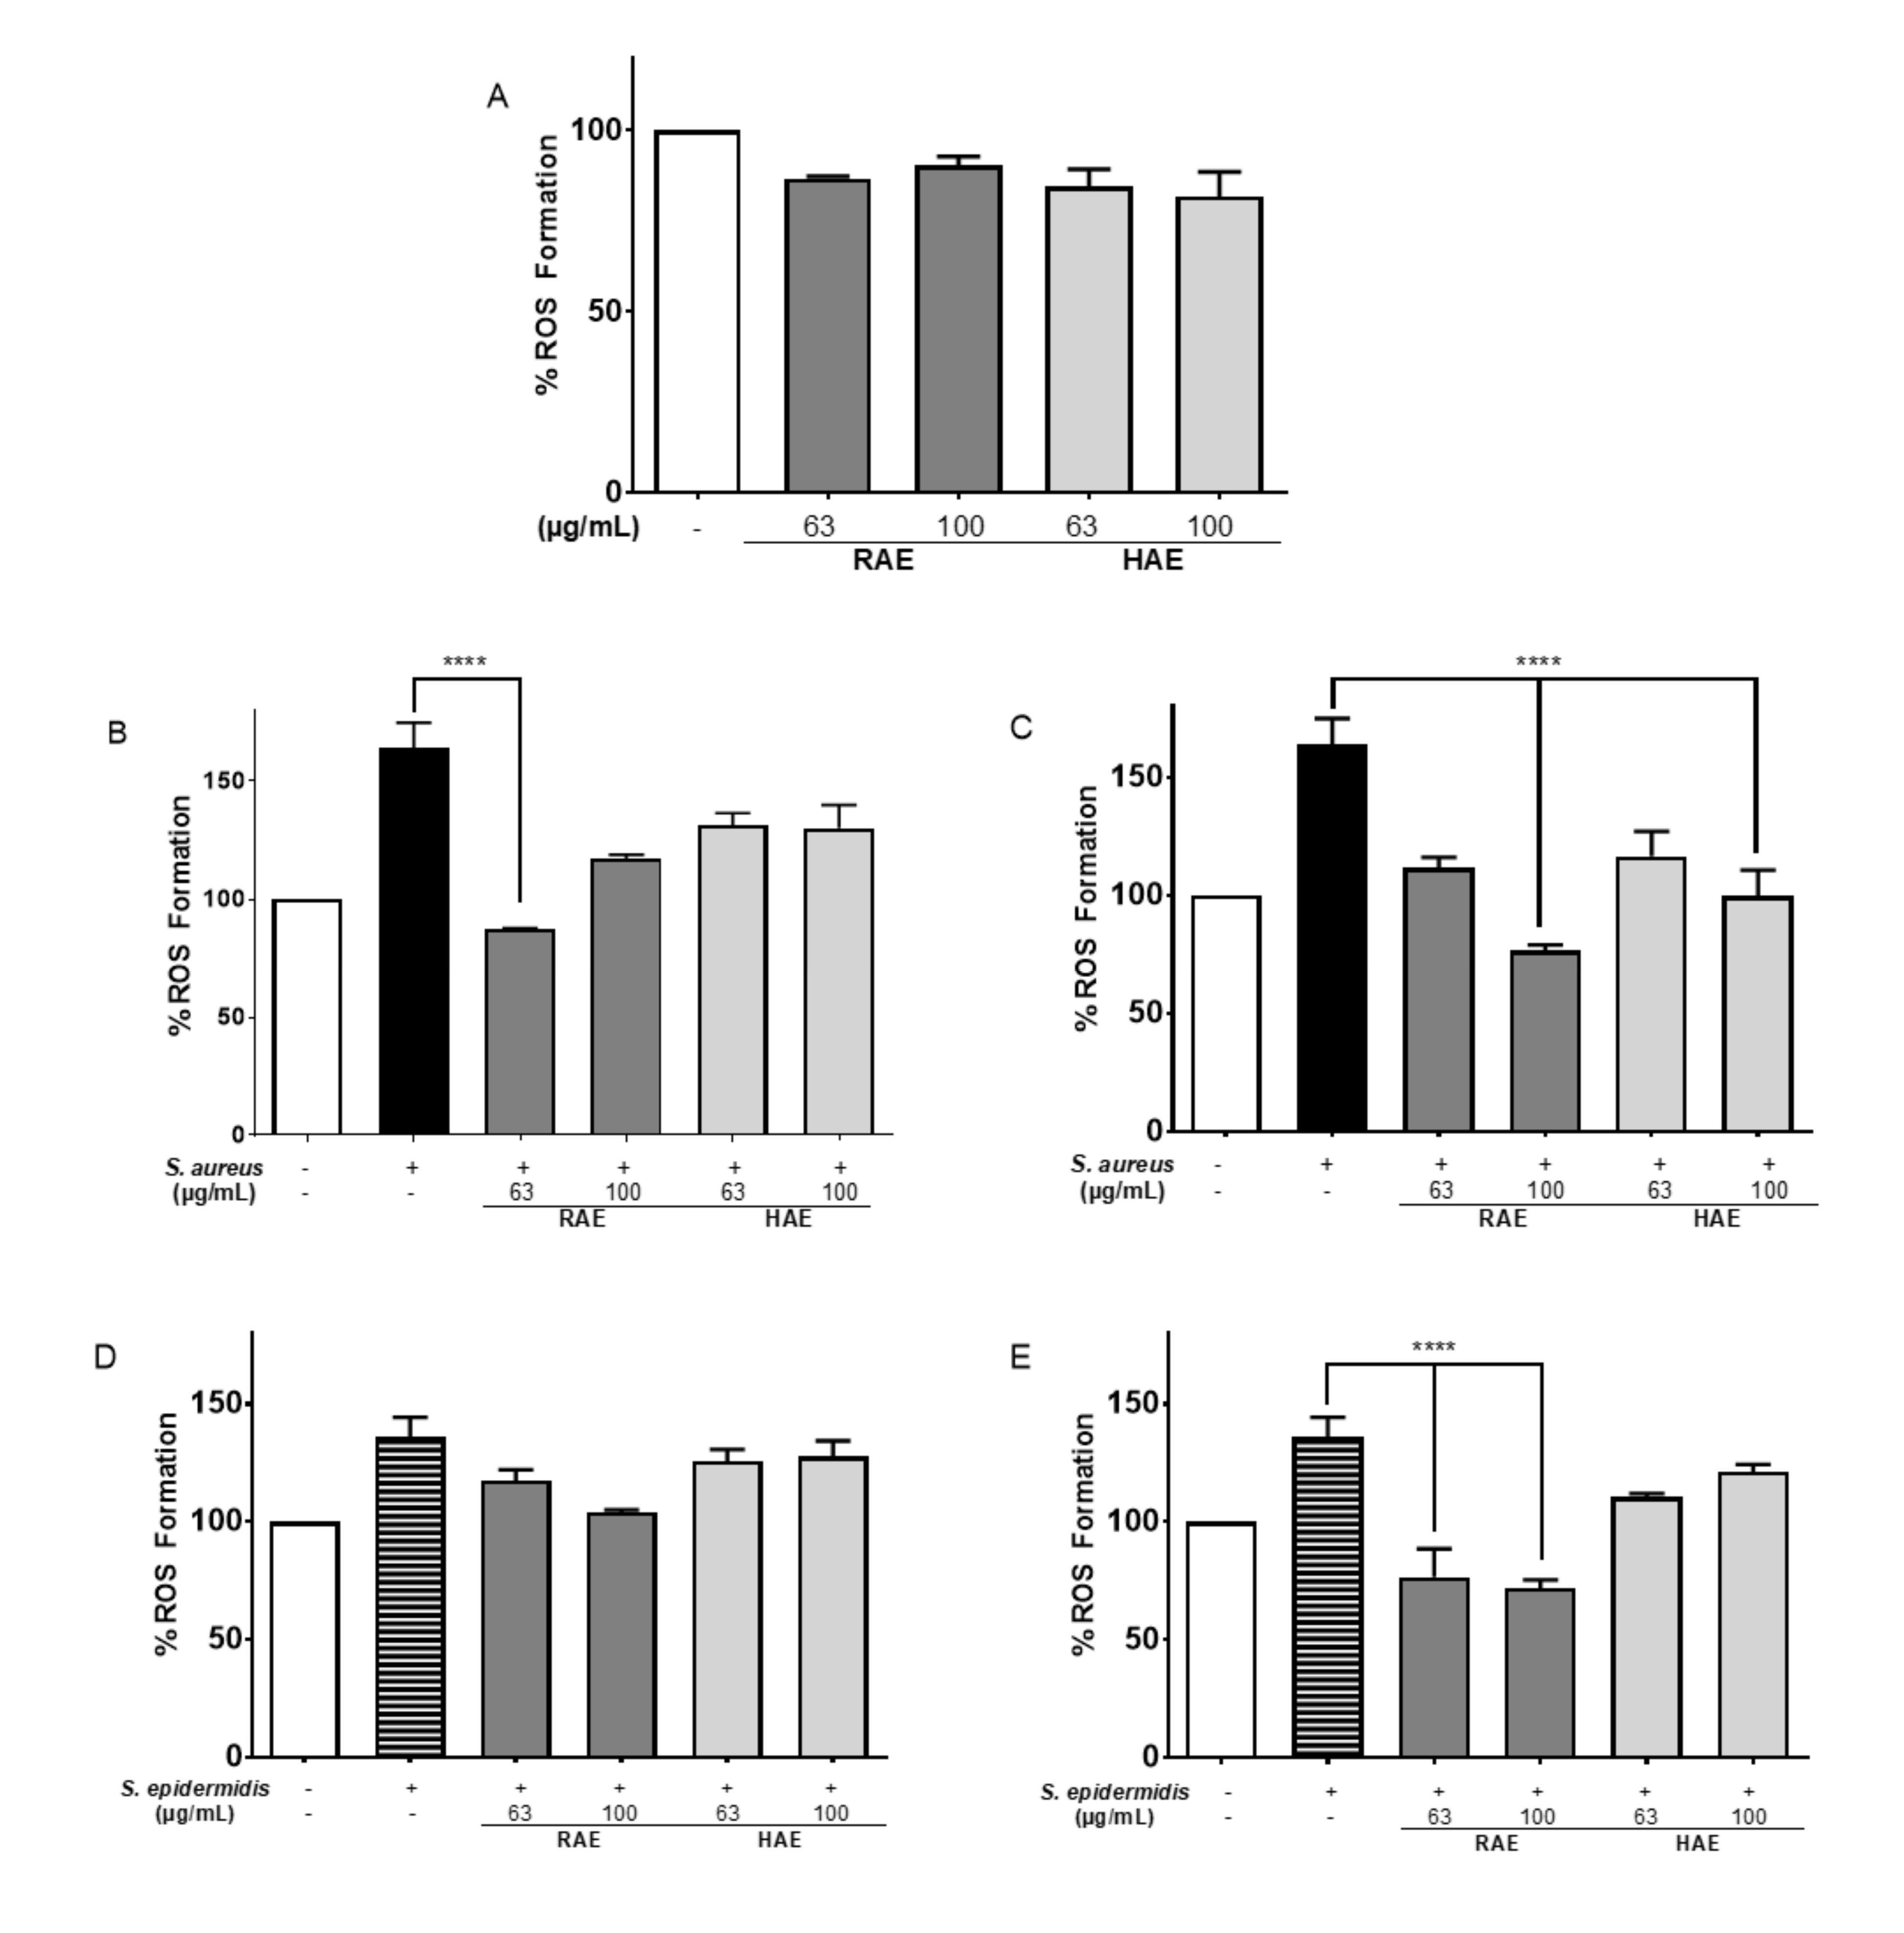
As shown in Figure 5E, preincubation of cells with MS extracts produced a protective effect on the cells, possibly helping to avoid infection by S. epidermidis. The RAE extract (87.35% less ROS in a concentration of 100 µg/mL) had the lowest rate of ROS formation in the presence of bacteria. These results suggest either a higher expression of antioxidant proteins, such as the enzymes glutathione peroxidase and superoxide dismutase [76], or a suppression of pro-oxidative proteins, such as COX-2.
The ability of a wide variety of flavonoids and stilbenes to inhibit pro-oxidative pathways and suppress the COX-2 enzyme has been previously reported [77]. MS extracts have also been reported to protect against oxidative stress by activating molecular cascades involved in signal transduction, stress, and extracellular matrix synthesis and repair [42]. It has been reported in our laboratory and in the literature that polyphenols in MS extracts reduce the concentration of ROS produced by oxidative stress, as is the case with resveratrol [78] and pyrogallol [79]. Daidzein and diadzin can reduce ROS concentrations and LDH release in response to oxidative damage, raising the activity of the enzyme superoxide dismutase and lowering the expression of COX-2 and NF-κβ [64,80,81,82]. Thus, when HDFa cells were pre-incubating with 100 µg/mL RAE and then infected with S. aureus, a 64% reduction in ROS formation was observed relative to infected controls (Figure 5B,C).
Coumarin derivatives such as protocatechuic acid, psoralen, and catechol in MS extracts have been reported to inhibit NF-κβ, reduce ROS, and improve cell survival [12,71].

4. Materials and Methods

4.1. Plant Materials, Cells, and Reagents

Plant species were brought from the CONAF conservation reserve on Rapa Nui. Upon receipt in the Laboratory of Biomedicine and Biocatalysis of the Pontifica Universidad Católica de Valparaíso, rhizomes and leaves were weighed, washed in sterile water, chopped, and stored at −80 °C. Adult Human Dermal Fibroblasts (HDFa) were obtained from Thermo Fisher Scientific (Thermo, Waltham, MA, USA). Bacterial strains S. aureus (ATCC 25955) and S. epidermidis (ATCC 35984) were purchased from Microbiologics® (Microbiologics, MN, USA). The LDH Cytotoxicity Assay Kit was purchased from Thermo Scientific (Thermo, Waltham, MA, USA). Gallic acid, TROLOX, AAPH, n-Hexane, ethyl acetate and DPPH were purchased form Sigma-Aldrich (St. Louis, MO, USA). Culture medium 106, LSGS supplement, antibiotics penicillin and streptomycin, Trypticase Soy Agar (TSA), and Trypticase Soy Broth (TSB) were purchased from Oxoid, Thermo Fisher Scientific (Thermo, Waltham, MA, USA). All other reagents used in this study were purchased from Merck Co. (Kenilworth, NJ, USA).

4.2. Cell Growth Conditions

The HDFa cells were cultured in 106 medium supplemented with LSGS, penicillin (50 U/mL), and streptomycin (50 mg/mL). Cells were stored at 37 °C in a humid atmosphere with 5% CO2 for use in subsequent experiments. Bacterial strains S. aureus and S. epidermidis were routinely grown in TSA and TSB media at 37 °C for 12 to 24 h. The strains were preserved at −80 °C in 15% glycerol.

4.3. Determination of MS Phytoextracts Metabolite Composition and Radical Scavenging Capacity

4.3.1. Extract Preparation

A sample of 20 g leaves or rhizomes was washed with distilled water. The leaves and rhizomes were then dried, chopped, and frozen at −80 °C. After freezing, both leaves and rhizomes were triturated separately, and the plant parts were ground and treated with hexane (500 mL) under magnetic stirring for 72 h at 35 °C. The extracts were then filtered through filter paper (Whatman No. 1); hexane was removed by incubation at 40 °C. Next, both extracts were rotary evaporated (Heildolph, Schwabach, Germany) at 40 °C under reduced pressure, ethyl acetate was added, and the mixture was stirred at 35 °C for 72 h. Finally, the solution was filtered and the solvents were removed with a rotary evaporator (Heildolph, Schwabach, Germany). The dried samples were weighed, dissolved in ethanol at a concentration of 1000 µg/mL, and stored at −20 °C until use. Polyphenol extracts from rhizomes and leaves were prepared using ethyl acetate. The designation of the rhizome extract was abbreviated as RAE and that of the leaf extract as HAE.

4.3.2. Determination of Total Phenolic Compounds

Folin–Ciocalteu reagent was used to quantify the total polyphenol content in the leaves and rhizomes. For this purpose, ethanolic extracts were prepared from leaves and rhizomes as described by [83]. Briefly, 100 µL of the leaf and rhizome extracts (RAE, RH, HAE and HH) were diluted 1:10 with water and 125 µL of Folin–Ciocalteu 1 N reagent was added and shaken vigorously. Then, 625 µL of 20% Na2CO3 was added and the samples were shaken again for two h. Finally, absorbance was measured at 760 nm on an HPUV 8453 spectrophotometer (Agilent, Santa Clara, CA, USA). Absorbance values were interpolated using a gallic acid standard curve (0–10 mg/L), and total phenolic content was expressed as mg gallic acid equivalents (GAE) per gram of dried extract. Experiments were performed in triplicate.

4.3.3. Determination of Total Flavonoid Compounds

Determination of total flavonoids was performed using the methodology of Liu [84] with modifications. Briefly, 30 µL sodium nitrite (10% w/v), 60 µL aluminum chloride hexahydrate (20% w/v), 200 µL NaOH (1 M), and 400 µL distilled water were added to 100 µL of the sample. Absorbance was recorded after 5 min at 415 nm. The results were interpolated on a Kaempferol calibration curve. The results were expressed in mg of kaempferol (KE) per gram of dry extract. The experiment was conducted in triplicate.

4.3.4. Radical Scavenging Capacity Determined by the DPPH Assay

The radical scavenging activity of the extracts was evaluated by the DPPH (1,1-diphenyl-2-picrylhydrazyl) assay [85]. Briefly, 1 mL of 0.1 mM DPPH radical solution in ethanol was mixed with 50 µL of leaf, rhizome extracts, gallic acid or vitamin C in a concentrations of 20 µg/mL. DPPH is reduced by antioxidants, causing a color change from purple to yellow. The color change was measured by absorbance (Abs) at 518 nm after 20 min of reaction using an Epoch ELISA reader (ELx800, BioTek, Winooski, VT, USA). The DPPH inhibition percentage was calculated using the following equation:
% radical   scavenging   activity = abs   control abs   sample abs   control   × 100
where, Abs control is the absorbance of DPPH in the absence of a sample and Abs sample is the absorbance of DPPH in the presence of a sample or standard. The radical scavenging capacity of the extracts using DPPH was expressed as mg GAE equivalents per gram of sample dry weight (expressed as the concentration of the sample required to reduce the DPPH absorbance by 50% = IC50). The IC50 values were calculated by linear regression of the plots. These experiments were performed in triplicate.

4.3.5. Radical Scavenging Capacity by the ORAC-FL Assay

The ORAC value was measured according to the method described in [86] with modifications [87]. The reaction was performed in sodium phosphate buffer (75 mM, pH 7.4) using black-walled 96-well plates in a final volume of 200 µL. Twenty µL of each extract or TROLOX (20 µg/mL) and fluorescein solutions (120 µL; 70 nM, final concentration) were placed in each well of the microplate. The mixture was preincubated for 15 min at 37 °C. The AAPH solution (60 µL; 12 mM final concentration) was added rapidly and the microplate was immediately read using a fluorescence reader (Synergy HT multi-detection microplate reader; Bio-Tek Instruments, Inc., Winooski, VT, USA). Fluorescence was recorded every minute for 80 min from normalized curves and the area under the fluorescence decay curve (AUC) was calculated as follows:
AUC = 1 + i = 1 i = 80 f i f 0
where, f0 is the initial fluorescence reading at 0 min and fi is the fluorescence reading at time i. The AUC of a sample was calculated by subtracting the AUC of the blank space. Regression equations between net AUC and antioxidant concentration were calculated for all the samples. The ORAC-FL values were expressed as Trolox equivalents using the standard curve calculated for each assay. The experiments were performed in triplicate.

4.3.6. The RP-HPLC-MS/MS Analysis of the MS Extracts

The RP-HPLC-MS/MS analysis was performed using the HPLC 1100 equipment (Agilent, Santa Clara, CA, USA) and a TRAP 3200 Q TRAP hybrid triple quadrupole/linear ion mass spectrophotometer. A gradient of solvents A (0.1% formic acid) and B (100% methanol) was used, with a flow rate of 0.5 mL/min. Solution B was graduated from 5 to 50% over 30 min, followed by an increase to 75% of B over 25 min. The measurement range was between m/z 100 and 1000 and was detected in positive and negative mode. Data were analyzed using the Thermo Xcalibur SP1.48 program (version 2.2, Thermo Fischer Scientific, Waltham, MA, USA), using molecular weights from http://phenol-explorer.eu/ (version 3.6) (accessed on 20 June 2021).

4.3.7. Determination of Sun Factor Protection (SPF) by Ultraviolet Spectroscopy of the MS Extracts

To evaluate SPF, samples were diluted with ethanol to 1 mg/mL and filtered. The absorbance spectra of the samples in solution were obtained in the range of 290 to 320 nm, every 5 nm, with a spectrophotometer HPUV 8453 (Agilent, Santa Clara, CA, USA), using a 1 cm quartz cuvette and ethanol as a blank, and each determination was made in triplicate. The SPF determination was calculated using Mansur’s equation [88]:
SPF = CF   × 290 320 EE λ ×   I   λ ×   Abs   λ
where, EE: Erythemal effect spectrum. I: Solar intensity spectrum. Abs: Absorbance of the sample. CF: Correction factor.

4.4. Antimicrobial Assays

4.4.1. Determination of Minimum Inhibitory Concentrations (MIC)

MIC80 was evaluated for both microorganisms in the presence and absence of the MS extracts. To this end, a McFarland value of 0.5 was seeded on Müller Hinton Broth medium in a 96-well curved bottom plate, with a range of 0.060 µg/mL to 512 µg/mL of the MS extracts. The microorganisms were allowed to grow under agitation at 150 rpm and a temperature of 37 °C. Growth inhibition was recorded after 24 h at 600 nm on an EPOCH spectrophotometer.

4.4.2. Biofilm Formation Inhibition Assay

The biofilm inhibition assay was performed as described in [89] with some modifications. A McFarland value of 0.5 was seeded in Müller Hinton Broth medium in a 96-well plate. Bacteria were treated with the MIC80 concentration corresponding to the extract and three serial dilutions from the MIC. The microorganisms were left under agitation at 150 rpm and at 37 °C for 48 h. Subsequently, the medium was extracted and washed twice with 150 µL PBS, and the plate was dried at 60 °C for one h, stained with 175 µL 0.4% crystal violet in ethanol (molecular biology grade) for 15 min, washed with 180 µL PBS, and dried at 60 °C for 20 min. Then, 200 µL 0.03% acetic acid was added and absorbance was measured at 570 nm on an EPOCH device. The biofilm percentage was calculated from the untreated wells. The test was performed in triplicate at three different times.

4.4.3. Biofilm Disintegration Test

The experiment was performed as described in [89] with some modifications. A McFarland value of 0.5 was seeded in Müller Hinton Broth medium in a 96-well plate. The microorganisms were left under agitation at a stirring speed of 150 rpm and 37 °C for 24 h. Subsequently, they were treated with the concentration of MIC corresponding to the extract and three serial dilutions from MIC80, and allowed to grow for a further 48 h. The medium was removed, the bacteria were washed with 150 µL PBS twice, and the plate was allowed to dry at 60 °C for one. Then it was stained with 175 µL 0.4% crystal violet in ethanol for 15 min, washed with 180 µL PBS, and allowed to dry at 60 °C for 20 min. Subsequently, 200 µL 0.03% acetic acid was added and absorbance was measured at 570 nm in an EPOCH device. The percentage of biofilm formation was calculated from the untreated wells. The test was performed in triplicate at three different times.

4.5. Inhibition of COX Enzymes

To evaluate the inhibition of the COX enzymes, the BioVisión® “COX-1 Inhibitor Screening Kit (Fluorometric)” and “COX-2 Inhibitor Screening Kit (Fluorometric)” were used according to the manufacturer’s instructions. The inhibition of prostaglandin G2 formation (a product formed from arachidonic acid) by the action of COX enzymes was evaluated. Measurements were made over time by incubating with 3 µg/mL MS extracts and the drug SC560 (commercial inhibitor) and measuring the fluorescence (λexc/λem: 535/587 nm) in a multiplate reader Skanit® Appliskan (Thermo Fischer Scientific, Waltham, MA, USA) at 25 °C for 10 min. The percentage of inhibition was calculated using the following formula:
%   Inhibition = slope   Enzyme   control slope   inhibitor   compunds slope   enzyme   control × 100

4.6. Cell Line and Treatments

4.6.1. HDFa Cell Line Cytotoxicity Assay

The cytotoxic activity was evaluated [90] using the immortalized cell line HDFa. For this purpose, 3 × 10³ cells were seeded in 96-well plates and incubated with the MS extracts for 24 h in 106 culture medium at 37 °C and 5% CO2. After incubation, cell viability was determined using the MTS Cell Viability Assay. It was measured by spectrophotometry at 490 nm.

4.6.2. Cytotoxicity Evaluation of the MS Extracts on the HDFa Cell Line in Staphylococcus aureus and Staphylococcus epidermidis Infection

The cytotoxic effect of the MS extracts on the HDFa cell line infected by S. aureus and S. epidermidis was evaluated (independently). For this purpose, 271,500 cells/well were seeded in a 48-well plate and incubated for 24 h in 106 culture media, at 37 °C with 5% CO2. Bacteria were added with an MOI of 5, i.e., each seeded cell was infected with 5 bacteria. Cell viability was evaluated after the release of lactate dehydrogenase (LDH) using the LDH Cytotoxicity Detection Kit (Takara Bio USA, Inc., San Jose, CA, USA, a specialized detection kit for eukaryotic cells. Aliquots of the medium were taken at 3 and 6 h of incubation with the microorganisms and the following formula was used to determine the percentage of cell viability:
%   Citotoxicity = treated   cells   untreated   celles damage   contrl untreated   cells   × 100

4.6.3. Evaluation of the Formation of Reactive Oxygen Species

To determine the percentage of ROS formation, 5 × 10³ cells/well were preincubated with culture medium for 24 h. Different concentrations of the MS extracts to be analyzed were added to each well and incubated for 3 h. Then, infection with S. aureus and S. epidermidis was performed (independently) for 3 h. In addition, the compounds and bacteria were incubated on the HDFa cells for 3 h. After this time, the medium was changed to KHB and the H2DCFDA-DCF probe was added at a concentration of 25 µM and incubated for 30 min at 37 °C. The formation of ROS was measured by evaluating the fluorescence intensity of the oxidation product of the probe, which fluoresces at λexc/λem: 490/525. These kinetics were evaluated in a multiplate reader Skanit® Appliskan (Thermo Fischer Scientific, Waltham, MA, USA) at 37 °C for half an h while protected from light.

4.7. Statistical Analysis

Data were expressed as mean ± standard deviation. Differences between experimental groups were analyzed using Student’s t and ANOVA (followed by Tukey’s posttest), according to the experimental protocol. Differences were considered significant at p < 0.001. For data analysis, the statistical software SPPS (Version 17; SPSS Inc., Chicago, IL, USA) and Graphpad Prism (version 7.04 GraphPad Software, La Jolla, CA, USA) were used.

5. Conclusions

Microsorum scolopendria exhibited high concentrations of polyphenols, especially in the rhizomes, consisting primarily of flavonoids. A wide variety of polyphenols was found in the MS extracts, with protocatechic acid 4-O-glucoside, cirsimaritin, isoxanthohumol, daidzein, pyrogallol, and resveratrol exhibiting the highest relative abundances. The polyphenols may be interesting from a pharmacological perspective because of their high radical scavenging activity and ability to modulate intracellular metabolic pathways.
The RAE extract exhibited higher radical scavenging activity in the DPPH and ORAC assays. The RAE and HAE extracts showed impressive SPF levels, with the HAE extract proving to be the best with a moderately high SPF level due its resveratrol, ferulic acid, and catechol content, among other compounds with structures that can absorb UV rays.
The evaluation of COX enzyme inhibition showed that both MS extracts were selective. The RAE extract showed a higher selectivity index, with 9.96 higher inhibition against COX-2 than COX-1.
Although the extracts showed no effect on bacterial viability according to MIC, they did show an effect on the inhibition of biofilm formation for S. epidermidis and S. aureus. In this respect, RAE showed the best results, as it was able to suppress biofilm formation by over 50%. Finally, the extracts reduced the damage produced by S. aureus and S epidermidis in an infection assay on the HDFa cell line analyzed for the LDH release. The best protective effect was found with the RAE extract, which was evaluated by measuring the production of ROS induced by microorganisms. This result demonstrated that MS has multiple biological properties and therapeutic potential. We suggest that in the future, purified MS extract should be analyzed on a model with damaged cells, and the mechanism of action on ROS production and COX-2 regulation should be evaluated in vitro and in silico to find cellular targets and therapeutic agents.

Supplementary Materials

The following are available online at https://www.mdpi.com/article/10.3390/molecules27175467/s1, Table S1. Phenolic acids found in MS by RP-HPLC-MS/MS in negative mode. Table S2. Phenolic acids found in MS by RP-HPLC-MS/MS in positive mode. Table S3. Flavonoids found in MS by RP-HPLC-MS/MS in negative mode. Table S4. Flavonoids found in MS by RP-HPLC-MS/MS in positive mode. Table S5. Stilbenes found in MS by RP-HPLC-MS/MS in negative mode. Table S6. Stilbenes found in MS by RP-HPLC-MS/MS in positive mode. Table S7. Other polyphenol compounds found in MS by RP-HPLC-MS/MS in negative mode. Table S8. Other polyphenol compounds found in MS by RP-HPLC-MS/MS in positive mode.

Author Contributions

Conceptualization, C.B. and L.G.; methodology C.B, M.C. and L.G; investigation, C.B., V.D., M.E.-B. and M.J.M.; resources, M.C., C.B. and L.G.; writing—original draft preparation, C.B. and L.G.; writing—review and editing, C.B., L.G. and M.C.; funding acquisition, M.C., L.G. and C.B. All authors have read and agreed to the published version of the manuscript.

Funding

This research was funded by ANID-FONDEF IT18I0015 “Massive propagation for the sustainable development of medicinal species in Rapa Nui”; Student grant ANID 21190657 and the Dirección de Investigación de la Vicerrectoría de Investigación y Estudios Avanzados, Pontificia Universidad Católica de Valparaíso, Chile DIE 039.411/2021.

Institutional Review Board Statement

Not applicable.

Informed Consent Statement

Not applicable.

Data Availability Statement

Not applicable.

Acknowledgments

We are grateful to Germplasm Bank of Mataveri Otai of CONAF in Rapa Nui for providing samples of MS and thanks for the information obtained in Royal Botanic Gardens Kew Seed Information Database (SID), 2020.

Conflicts of Interest

The authors declare no conflict of interest.

References

  1. Ramanitrahasimbola, D.; Rakotondramanana, D.A.; Rasoanaivo, P.; Randriantsoa, A.; Ratsimamanga, S.; Palazzino, G.; Galeffi, C.; Nicoletti, M. Bronchodilator Activity of Phymatodes scolopendria (Burm.) Ching and Its Bioactive Constituent. J. Ethnopharmacol. 2005, 102, 400–407. [Google Scholar] [CrossRef] [PubMed]
  2. Fernández, H.; Kumar, A.; Revilla, M.A. From spore to sporophyte: How to proceed in vitro. In Working with Ferns: Issues and Applications; Springer: New York, NY, USA, 2011; pp. 97–110. [Google Scholar] [CrossRef]
  3. Snogan, E.; Vahirua-Lechat, I.; Ho, R.; Bertho, G.; Girault, J.P.; Ortiga, S.; Maria, A.; Lafont, R. Ecdysteroids from the Medicinal Fern Microsorum scolopendria (Burm. f.). Phytochem. Anal. 2007, 18, 441–450. [Google Scholar] [CrossRef] [PubMed]
  4. Meyer, J.Y. A Note on the Taxonomy, Ecology, Distribution and Conservation Status of the Ferns (Pteridophytes) of Rapa Nui (Easter Island). Rapa Nui J. 2013, 27, 71–83. [Google Scholar]
  5. Malan, D.F.; Neuba, D.F.R.; Kouakou, K.L. Medicinal Plants and Traditional Healing Practices in Ehotile People, around the Aby Lagoon (Eastern Littoral of Côte d’Ivoire). J. Ethnobiol. Ethnomed. 2015, 11, 21. [Google Scholar] [CrossRef]
  6. Chai, T.; Elamparuthi, S.; Yong, A.; Quah, Y.; Ong, H. Antibacterial, Anti-Glucosidase, and Antioxidant Activities of Selected Highland Ferns of Malaysia. Bot. Stud. 2013, 54, 55. [Google Scholar] [CrossRef]
  7. Ponnusamy, Y.; Chear, N.J.Y.; Ramanathan, S.; Lai, C.S. Polyphenols Rich Fraction of Dicranopteris Linearis Promotes Fibroblast Cell Migration and Proliferation in Vitro. J. Ethnopharmacol. 2015, 168, 305–314. [Google Scholar] [CrossRef]
  8. Soare, L.C.; Ferdeş, M.; Stefanov, S.; Denkova, Z.; Nicolova, R.; Denev, P.; Bejan, C.; Pǎunescu, A. Antioxidant Activity, Polyphenols Content and Antimicrobial Activity of Several Native Pteridophytes of Romania. Not. Bot. Horti Agrobot. Cluj-Napoca 2012, 40, 53–57. [Google Scholar] [CrossRef]
  9. Fernández de Córdova, M.L.; Medina, A.R. Analytical Methods for Determination of Polyphenols in Beer. In Processing and Impact on Antioxidants in Beverages; Elsevier: Jaén, Spain, 2014; pp. 289–299. ISBN 9780124047389. [Google Scholar]
  10. Papuc, C.; Goran, G.V.; Predescu, C.N.; Nicorescu, V.; Stefan, G. Plant Polyphenols as Antioxidant and Antibacterial Agents for Shelf-Life Extension of Meat and Meat Products: Classification, Structures, Sources, and Action Mechanisms. Compr. Rev. Food Sci. Food Saf. 2017, 16, 1243–1268. [Google Scholar] [CrossRef]
  11. Jofré, I.; Pezoa, C.; Cuevas, M.; Scheuermann, E.; Freires, I.A.; Rosalen, P.L.; de Alencar, S.M.; Romero, F. Antioxidant and Vasodilator Activity of Ugni Molinae Turcz. (Murtilla) and Its Modulatory Mechanism in Hypotensive Response. Oxidative Med. Cell. Longev. 2016, 2016, 1155. [Google Scholar] [CrossRef]
  12. Choi, J.Y.; Desta, K.T.; Saralamma, V.V.G.; Lee, S.J.; Lee, S.J.; Kim, S.M.; Paramanantham, A.; Lee, H.J.; Kim, Y.H.; Shin, H.C.; et al. LC–MS/MS Characterization, Anti-Inflammatory Effects and Antioxidant Activities of Polyphenols from Different Tissues of Korean Petasites Japonicus (Meowi). Biomed. Chromatogr. 2017, 31, e4003. [Google Scholar] [CrossRef]
  13. Kumar, R. Application of HPLC and ESI-MS Techniques in the Analysis of Phenolic Acids and Flavonoids from Green Leafy Vegetables (GLVs). J. Pharm. Anal. 2017, 7, 349–364. [Google Scholar] [CrossRef] [PubMed]
  14. Oliveira, W.F.; Silva, P.M.S.; Silva, R.C.S.; Silva, G.M.M.; Machado, G.; Coelho, L.C.B.B.; Correia, M.T.S. Staphylococcus aureus and Staphylococcus epidermidis Infections on Implants. J. Hosp. Infect. 2018, 98, 111–117. [Google Scholar] [CrossRef] [PubMed]
  15. Mittal, M.; Siddiqui, M.R.; Tran, K.; Reddy, S.P.; Malik, A.B. Reactive Oxygen Species in Inflammation and Tissue Injury. Antioxid. Redox Signal. 2014, 20, 1126–1167. [Google Scholar] [CrossRef] [PubMed]
  16. Forrester, S.J.; Kikuchi, D.S.; Hernandes, M.S.; Xu, Q.; Griendling, K.K. Reactive Oxygen Species in Metabolic and Inflammatory Signaling. Circ. Res. 2018, 122, 877–902. [Google Scholar] [CrossRef] [PubMed]
  17. Adebiyi, O.E.; Olayemi, F.O.; Ning-Hua, T.; Guang-Zhi, Z. In Vitro Antioxidant Activity, Total Phenolic and Flavonoid Contents of Ethanol Extract of Stem and Leaf of Grewia Carpinifolia. Beni-Suef Univ. J. Basic Appl. Sci. 2017, 6, 10–14. [Google Scholar] [CrossRef]
  18. Chang, C.C.; Yang, M.H.; Wen, H.M.; Chern, J.C. Estimation of Total Flavonoid Content in Propolis by Two Complementary Colometric Methods. J. Food Drug Anal. 2002, 10, 178–182. [Google Scholar] [CrossRef]
  19. Zafar, R.; Ullah, H.; Zahoor, M.; Sadiq, A. Isolation of Bioactive Compounds from Bergenia ciliata (Haw.) Sternb Rhizome and Their Antioxidant and Anticholinesterase Activities. BMC Complement. Altern. Med. 2019, 19, 296. [Google Scholar] [CrossRef]
  20. Curini, M.; Cravotto, G.; Epifano, F.; Giannone, G. Chemistry and Biological Activity of Natural and Synthetic Prenyloxycoumarins. Curr. Med. Chem. 2006, 13, 199–222. [Google Scholar] [CrossRef]
  21. Diffey, B.L.; Robson, J. A New Substrate to Measure Sunscreen Protection Factors throughout the Ultraviolet Spectrum. j. Soc. Cosmet. Chem. 1989, 40, 127–133. [Google Scholar]
  22. G. Perrone, M.; Scilimati, A.; Simone, L.; Vitale, P. Selective COX-1 Inhibition: A Therapeutic Target to Be Reconsidered. Curr. Med. Chem. 2010, 17, 3769–3805. [Google Scholar] [CrossRef]
  23. Gautam, R.; Srivastava, A.; Jachak, S.M.; Saklani, A. Anti-Inflammatory, Cyclooxygenase (COX)-2, COX-1 Inhibitory and Antioxidant Effects of Dysophylla Stellata Benth. Fitoterapia 2010, 81, 45–49. [Google Scholar] [CrossRef] [PubMed]
  24. Kundu, N.; Fulton, A.M. Selective Cyclooxygenase (COX)-1 or COX-2 Inhibitors Control Metastatic Disease in a Murine Model of Breast Cancer. Cancer Res. 2002, 62, 2343–2346. [Google Scholar] [PubMed]
  25. Maes, M.; Vanhaecke, T.; Cogliati, B.; Crespo, S.; Willebrods, J.; Rogiers, V.; Vinken, M. Measurement of Apoptotic and Necrotic Cell Death in Primary Hepatocyte Cultures. Protoc. In Vitro Hepatocyte Res. 2015, 1250, 349–361. [Google Scholar] [CrossRef]
  26. Patel, T.K.; Williamson, J.D. Mannitol in Plants, Fungi, and Plant–Fungal Interactions. Trends Plant. Sci. 2016, 21, 486–497. [Google Scholar] [CrossRef] [PubMed]
  27. Alinezhad, H.; Baharfar, R.; Zare, M.; Azimi, R.; Nabavi, S.F.; Nabavi, S.M. Biological Activities of Ethyl Acetate Extract of Different Parts of Hyssopus Angustifolius. Pharm. Biol. 2012, 50, 1062–1066. [Google Scholar] [CrossRef] [PubMed]
  28. Gini, T.G.; Jeya Jothi, G. Column Chromatography and HPLC Analysis of Phenolic Compounds in the Fractions of Salvinia Molesta Mitchell. Egypt. J. Basic Appl. Sci. 2018, 5, 197–203. [Google Scholar] [CrossRef]
  29. Lamichhane, R.; Pandeya, P.R.; Lee, K.H.; Kim, S.G.; Kandel, D.R.; Jung, H.J. Angiopteris Helferiana, a Fern with Great Potential Medicinal Value: Antiadipogenic, Anti-Inflammatory, and Anti-Diabetic Activity. Pharmacogn. Mag. 2019, 15, 423–432. [Google Scholar] [CrossRef]
  30. Qayyum, A.; Sarfraz, R.A.; Ashraf, A.; Adil, S. Phenolic Composition and Biological (Anti Diabetic and Antioxidant) Activities of Different Solvent Extracts of an Endemic Plant (Heliotropium Strigosum). J. Chil. Chem. Soc. 2016, 61, 2828–2831. [Google Scholar] [CrossRef]
  31. Sultana, B.; Anwar, F.; Ashraf, M. Effect of Extraction Solvent/Technique on the Antioxidant Activity of Selected Medicinal Plant Extracts. Molecules 2009, 14, 2167–2180. [Google Scholar] [CrossRef]
  32. Sagar, N.A.; Pareek, S.; Gonzalez-Aguilar, G.A. Quantification of Flavonoids, Total Phenols and Antioxidant Properties of Onion Skin: A Comparative Study of Fifteen Indian Cultivars. J. Food Sci. Technol. 2020, 57, 2423–2432. [Google Scholar] [CrossRef]
  33. Sujatha, S.; Sara, S.C.; Gayathiri, M.; Roselin, I.R.; Ruby, R.G.D. Analysis of bioactive compounds present in methanolic extract of Phymatosorus scolopendria (burm. f.) pic. serm. through gas chromato-graphy and mass spectroscopy. Int. J. Pharmacol. Sci. Res. 2020, 11, 3294–3299. [Google Scholar] [CrossRef]
  34. Cao, H.; Chai, T.T.; Wang, X.; Morais-Braga, M.F.B.; Yang, J.H.; Wong, F.C.; Wang, R.; Yao, H.; Cao, J.; Cornara, L.; et al. Phytochemicals from Fern Species: Potential for Medicine Applications. Phytochem. Rev. 2017, 16, 379–440. [Google Scholar] [CrossRef] [PubMed]
  35. Pallag, A.; Jurca, T.; Pasca, B.; Sirbu, V.; Honiges, A.; Costuleanu, M. Analysis of Phenolic Compounds Composition by HPLC and Assessment of Antioxidant Capacity in Equisetum Ar Vense L. Extracts. Rev. Chim. 2016, 67, 1623–1627. [Google Scholar]
  36. Dash, R.; Uddin, M.M.; Hosen, S.M.Z.; Rahim, Z.B.; Dinar, A.; Kabir, M.; Sultan, R.A.; Islam, A.; Hossain, M.K. Molecular Docking Analysis of Known Flavonoids as Duel COX-2 Inhibitors in the Context of Cancer. Bioinformation 2015, 11, 543–549. [Google Scholar] [CrossRef]
  37. Chai, T.T.; Panirchellvum, E.; Ong, H.C.; Wong, F.C. Phenolic Contents and Antioxidant Properties of Stenochlaena Palustris, an Edible Medicinal Fern. Bot. Stud. 2012, 53, 439–446. [Google Scholar]
  38. Reinisalo, M.; Kårlund, A.; Koskela, A.; Kaarniranta, K.; Karjalainen, R.O. Polyphenol Stilbenes: Molecular Mechanisms of Defence against Oxidative Stress and Aging-Related Diseases. Oxidative Med. Cell. Longev. 2015, 2015, 340520. [Google Scholar] [CrossRef]
  39. Koushki, M.; Amiri-Dashatan, N.; Ahmadi, N.; Abbaszadeh, H.A.; Rezaei-Tavirani, M. Resveratrol: A Miraculous Natural Compound for Diseases Treatment. Food Sci. Nutr. 2018, 6, 2473–2490. [Google Scholar] [CrossRef] [PubMed]
  40. Wadzinski, T.J.; Steinauer, A.; Hie, L.; Pelletier, G.; Schepartz, A.; Miller, S.J.; Box, P.O.; Haven, N. Rapid Phenolic O-Glycosylation of Small Molecules and Complex Unprotected Peptides in Aqueous Solvent. Nat. Chem. 2018, 10, 644–652. [Google Scholar] [CrossRef]
  41. Ding, Z.T.; Fang, Y.S.; Tai, Z.G.; Yang, M.H.; Xu, Y.Q.; Li, F.; Cao, Q.E. Phenolic Content and Radical Scavenging Capacity of 31 Species of Ferns. Fitoterapia 2008, 79, 581–583. [Google Scholar] [CrossRef]
  42. Ho, R.; Teai, T.; Meybeck, A.; Raharivelomanana, P. UV-Protective Effects of Phytoecdysteroids from Microsorum Grossum Extracts on Human Dermal Fibroblasts. Nat. Prod. Commun. 2015, 10, 33–36. [Google Scholar] [CrossRef]
  43. CLSI; Patel, J.; Weinstein, M.; Eliopoulus, G.; Jenkins, S.; Lewis, J.; Limbargo, B.; Mathers, A.; Mazzulli, T.; Patel, R.; et al. (Eds.) Performance Standards for Antimicrobial Susceptibility Testing, 27th ed.; Clinical and Laboratory Standards Institute: Wayne, PA, USA, 2017; ISBN 1562388045. [Google Scholar]
  44. Brandwein, M.; Steinberg, D.; Meshner, S. Microbial Biofilms and the Human Skin Microbiome. NPJ Biofilms Microbiomes 2016, 2, 1–6. [Google Scholar] [CrossRef] [PubMed]
  45. dos Santos, J.F.S.; Macêdo, N.S.; de Sousa Júnior, D.L.; dos Santos, C.R.B.; Tintino, S.R.; da Hora, G.C.A.; Lima, M.C.P.; Coutinho, H.D.M.; da Cunha, F.A.B. Indirect Inhibitory Activity of Pyrogallol against the Tet(K) Efflux Pump by a Membrane Effect: In Vitro and in Silico Approach. Process. Biochem. 2021, 107, 138–144. [Google Scholar] [CrossRef]
  46. Kharouf, N.; Mancino, D.; Zghal, J.; Helle, S.; Jmal, H.; Lenertz, M.; Viart, N.; Bahlouli, N.; Meyer, F.; Haikel, Y.; et al. Dual Role of Tannic Acid and Pyrogallol Incorporated in Plaster of Paris: Morphology Modification and Release for Antimicrobial Properties. Mater. Sci. Eng. C. 2021, 127, 112209. [Google Scholar] [CrossRef]
  47. Nøhr-Meldgaard, K.; Ovsepian, A.; Ingmer, H.; Vestergaard, M. Resveratrol Enhances the Efficacy of Aminoglycosides against Staphylococcus aureus. Int. J. Antimicrob. Agents 2018, 52, 390–396. [Google Scholar] [CrossRef]
  48. Chin, Y.P.; Tsui, K.C.; Chen, M.C.; Wang, C.Y.; Yang, C.Y.; Lin, Y.L. Bactericidal Activity of Soymilk Fermentation Broth by in Vitro and Animal Models. J. Med. Food 2012, 15, 520–526. [Google Scholar] [CrossRef] [PubMed]
  49. Miski, M.; Ulubelen, A.; Johansson, C.; Mabry, T.J. Antibacterial Activity Studies of Flavonoids from Salvia Palaestina. J. Nat. Prod. 1983, 46, 874–875. [Google Scholar] [CrossRef] [PubMed]
  50. Kašparová, P.; Vaňková, E.; Brázdová, L.; Lokočová, K.; Maťátková, O.; Masák, J. Antibiofilm Agent Pterostilbene Is Able to Enhance Antibiotics Action against Staphylococcus epidermidis. Microb. Pathog. 2021, 152, 104632. [Google Scholar] [CrossRef]
  51. Bocquet, L.; Sahpaz, S.; Bonneau, N.; Beaufay, C.; Mahieux, S.; Samaillie, J.; Roumy, V.; Jacquin, J.; Bordage, S.; Hennebelle, T.; et al. Phenolic Compounds from Humulus lupulus as Natural Antimicrobial Products: New Weapons in the Fight against Methicillin Resistant Staphylococcus aureus, Leishmania mexicana and Trypanosoma brucei Strains. Molecules 2019, 24, 1024. [Google Scholar] [CrossRef]
  52. Rozalski, M.; Micota, B.; Sadowska, B.; Stochmal, A.; Jedrejek, D.; Wieckowska-Szakiel, M.; Rozalska, B. Antiadherent and Antibiofilm Activity of Humulus lupulus L. Derived Products: New Pharmacological Properties. BioMed Res. Int. 2013, 2013, 101089. [Google Scholar] [CrossRef]
  53. Crouzet, M.; le Senechal, C.; Brözel, V.S.; Costaglioli, P.; Barthe, C.; Bonneu, M.; Garbay, B.; Vilain, S. Exploring Early Steps in Biofilm Formation: Set-up of an Experimental System for Molecular Studies. BMC Microbiol. 2014, 14, 253. [Google Scholar] [CrossRef]
  54. Abedini, E.; Khodadadi, E.; Zeinalzadeh, E.; Moaddab, S.R.; Asgharzadeh, M.; Mehramouz, B.; Dao, S.; Samadi Kafil, H. A Comprehensive Study on the Antimicrobial Properties of Resveratrol as an Alternative Therapy. Evid.-Based Complement. Altern. Med. 2021, 2021, 1155. [Google Scholar] [CrossRef] [PubMed]
  55. Castro-Orozco, R.; Villafañe-Ferrer, L.; Rocha-Jiménez, J.; Alvis-Guzmán, N. Resistencia antimicrobiana en Staphylococcus aureus Y Staphylococcus epidermidis: Tendencia temporal (2010–2016) y fenotipos de multirresistencia, cartagena (colombia). Biosalud 2018, 17, 25–36. [Google Scholar] [CrossRef]
  56. Chabi, R.; Momtaz, H. Virulence Factors and Antibiotic Resistance Properties of the Staphylococcus epidermidis Strains Isolated from Hospital Infections in Ahvaz, Iran. Trop. Med. Health 2019, 47, 56. [Google Scholar] [CrossRef] [Green Version]
  57. Jena, S.; Panda, S.; Nayak, K.C.; Singh, D.V. Identification of Major Sequence Types among Multidrug-Resistant Staphylococcus epidermidis Strains Isolated from Infected Eyes and Healthy Conjunctiva. Front. Microbiol. 2017, 8, 1430. [Google Scholar] [CrossRef] [PubMed]
  58. Vandecandelaere, I.; van Nieuwerburgh, F.; Deforce, D.; Coenye, T. Metabolic Activity, Urease Production, Antibiotic Resistance and Virulence in Dual Species Biofilms of Staphylococcus epidermidis and Staphylococcus aureus. PLoS ONE 2017, 12, e0172700. [Google Scholar] [CrossRef] [PubMed]
  59. Gutiérrez-Barranquero, J.A.; Reen, F.J.; McCarthy, R.R.; O’Gara, F. Deciphering the Role of Coumarin as a Novel Quorum Sensing Inhibitor Suppressing Virulence Phenotypes in Bacterial Pathogens. Appl. Microbiol. Biotechnol. 2015, 99, 3303–3316. [Google Scholar] [CrossRef]
  60. Monte, J.; Abreu, A.C.; Borges, A.; Simões, L.C.; Simões, M. Antimicrobial Activity of Selected Phytochemicals against Escherichia Coli and Staphylococcus aureus and Their Biofilms. Pathogens 2014, 3, 473–498. [Google Scholar] [CrossRef]
  61. Manner, S.; Skogman, M.; Goeres, D.; Vuorela, P.; Fallarero, A. Systematic Exploration of Natural and Synthetic Flavonoids for the Inhibition of Staphylococcus aureus Biofilms. Int. J. Mol. Sci. 2013, 14, 19434–19451. [Google Scholar] [CrossRef]
  62. Zhang, D.; Nie, S.; Xie, M.; Hu, J. Antioxidant and Antibacterial Capabilities of Phenolic Compounds and Organic Acids from Camellia Oleifera Cake. Food Sci. Biotechnol. 2020, 29, 17–25. [Google Scholar] [CrossRef]
  63. Zykova, T.A.; Zhu, F.; Zhai, X.; Ma, W.; Ermakova, S.P.; Won, K.; Bode, A.M.; Dong, Z. Resveratrol Directly Targets COX-2 to Inhibit Carcinogenesis. Mol. Carcinog. 2009, 47, 797–805. [Google Scholar] [CrossRef]
  64. Hermenegildo, C.; Oviedo, P.J.; García-Pérez, M.A.; Tarín, J.J.; Cano, A. Effects of Phytoestrogens Genistein and Daidzein on Prostacyclin Production by Human Endothelial Cells. J. Pharmacol. Exp. Ther. 2005, 315, 722–728. [Google Scholar] [CrossRef] [PubMed]
  65. Ribeiro, D.; Freitas, M.; Tomé, S.M.; Silva, A.M.S.; Laufer, S.; Lima, J.L.F.C.; Fernandes, E. Flavonoids Inhibit COX-1 and COX-2 Enzymes and Cytokine/Chemokine Production in Human Whole Blood. Inflammation 2015, 38, 858–870. [Google Scholar] [CrossRef] [PubMed]
  66. Lee, D.; Kim, K.H.; Lee, J.; Hwang, G.S.; Lee, H.L.; Hahm, D.H.; Huh, C.K.; Lee, S.C.; Lee, S.; Kang, K.S. Protective Effect of Cirsimaritin against Streptozotocin-Induced Apoptosis in Pancreatic Beta Cells. J. Pharm. Pharmacol. 2017, 69, 875–883. [Google Scholar] [CrossRef] [PubMed]
  67. Niering, P.; Michels, G.; Wätjen, W.; Ohler, S.; Steffan, B.; Chovolou, Y.; Kampkötter, A.; Proksch, P.; Kahl, R. Protective and Detrimental Effects of Kaempferol in Rat H4IIE Cells: Implication of Oxidative Stress and Apoptosis. Toxicol. Appl. Pharmacol. 2005, 209, 114–122. [Google Scholar] [CrossRef] [PubMed]
  68. Brescó, M.S.; Harris, L.G.; Thompson, K.; Stanic, B.; Morgenstern, M.; O’Mahony, L.; Richards, R.G.; Moriarty, T.F. Pathogenic Mechanisms and Host Interactions in Staphylococcus epidermidis Device-Related Infection. Front. Microbiol. 2017, 8, 1401. [Google Scholar] [CrossRef]
  69. Adams, S.M.; Aksenova, M.V.; Aksenov, M.Y.; Mactutus, C.F.; Booze, R.M. Soy Isoflavones Genistein and Daidzein Exert Anti-Apoptotic Actions via a Selective ER-Mediated Mechanism in Neurons Following HIV-1 Tat1-86 Exposure. PLoS ONE 2012, 7, e37540. [Google Scholar] [CrossRef]
  70. Birhanu, B.T.; Lee, E.B.; Lee, S.J.; Park, S.C. Targeting Salmonella Typhimurium Invasion and Intracellular Survival Using Pyrogallol. Front. Microbiol. 2021, 12, 631426. [Google Scholar] [CrossRef]
  71. Li, L.; Wang, X.C.; Gong, P.T.; Zhang, N.; Zhang, X.; Li, S.; Li, X.; Liu, S.X.; Zhang, X.X.; Li, W.; et al. ROS-Mediated NLRP3 Inflammasome Activation Participates in the Response against Neospora Caninum Infection. Parasites Vectors 2020, 13, 449. [Google Scholar] [CrossRef]
  72. Bloemendaal, A.L.A.; Brouwer, E.C.; Fluit, A.C. Methicillin Resistance Transfer from Staphylocccus Epidermidis to Methicillin-Susceptible Staphylococcus aureus in a Patient during Antibiotic Therapy. PLoS ONE 2010, 5, e11841. [Google Scholar] [CrossRef]
  73. Otto, M. Staphylococcus epidermidis—The “Accidental” Pathogen. Nat. Rev. Microbiol. 2009, 7, 555–567. [Google Scholar] [CrossRef]
  74. Chiancone, E.; Ceci, P. The Multifaceted Capacity of Dps Proteins to Combat Bacterial Stress Conditions: Detoxification of Iron and Hydrogen Peroxide and DNA Binding. Biochim. Biophys. Acta Gen. Subj. 2010, 1800, 798–805. [Google Scholar] [CrossRef] [PubMed]
  75. Martinez, A.; Kolter, R. Protection of DNA during Oxidative Stress by the Nonspecific DNA–Binding Protein Dps. J. Bacteriol. 1997, 179, 5188–5194. [Google Scholar] [CrossRef] [PubMed]
  76. Sapsrithong, T.; Kaewprem, W.; Tongumpai, S.; Nusuetrong, P.; Meksuriyen, D. Cissus Quadrangularis Ethanol Extract Upregulates Superoxide Dismutase, Glutathione Peroxidase and Endothelial Nitric Oxide Synthase Expression in Hydrogen Peroxide-Injured Human ECV304 Cells. J. Ethnopharmacol. 2012, 143, 664–672. [Google Scholar] [CrossRef]
  77. Baek, S.J.; Wilson, L.C.; Eling, T.E. Resveratrol Enhances the Expression of Non-Steroidal Anti-Inflammatory Drug-Activated Gene (NAG-1) by Increasing the Expression of P53. Carcinogenesis 2002, 23, 425–434. [Google Scholar] [CrossRef] [PubMed]
  78. Guzmán, L.; Balada, C.; Flores, G.; Álvarez, R.; Knox, M.; Vinet, R.; Martínez, J.L. T-Resveratrol Protects against Acute High Glucose Damage in Endothelial Cells. Plant. Foods Hum. Nutr. 2018, 73, 235–240. [Google Scholar] [CrossRef]
  79. Lim, J.Y.; Kim, C.M.; Rhee, J.H.; Kim, Y.R. Effects of Pyrogallol on Growth and Cytotoxicity of Wild-Type and KatG Mutant Strains of Vibrio vulnificus. PLoS ONE 2016, 11, e0167699. [Google Scholar] [CrossRef]
  80. Iovine, B.; Iannella, M.L.; Gasparri, F.; Giannini, V.; Monfrecola, G.; Bevilacqua, M.A. A Comparative Analysis of the Photo-Protective Effects of Soy Isoflavones in Their Aglycone and Glucoside Forms. Int. J. Mol. Sci. 2012, 13, 16444–16456. [Google Scholar] [CrossRef]
  81. Liu, Y.F.; Bai, Y.Q.; Qi, M. Daidzein Attenuates Abdominal Aortic Aneurysm through NF-ΚB, P38MAPK and TGF-Β1 Pathways. Mol. Med. Rep. 2016, 14, 955–962. [Google Scholar] [CrossRef]
  82. Tang, X.; Xiao, A.; Mei, S.; Tang, P.; Ren, L.; Liu, L. Pueraria Lobata Root Constituents as Xanthine Oxidase Inhibitors and Protective Agents against Oxidative Stress Induced in GES-1 Cells. J. Braz. Chem. Soc. 2020, 31, 2071–2081. [Google Scholar] [CrossRef]
  83. Ricco, R.A.; Agudelo, I.J.; Wagner, M.L. Métodos Empleados en el Análisis de Los Polifenoles en un Laboratorio de Baja Complejidad. Lilloa 2015, 52, 161–174. [Google Scholar] [CrossRef]
  84. Liu, H.; Song, Y.; Zhang, X. Determination of Total Flavonoids in Leek by AlCl3 Colorimetric Assay. Chem. Eng. Trans. 2017, 59, 775–780. [Google Scholar] [CrossRef]
  85. Brand-Williams, W.; Cuvelier, M.E.; Berset, C. Use of a Free Radical Method to Evaluate Antioxidant Activity. LWT Food Sci. Technol. 1995, 28, 25–30. [Google Scholar] [CrossRef]
  86. Ou, B.; Hampsch-Woodill, M.; Prior, R.L. Development and Validation of an Improved Oxygen Radical Absorbance Capacity Assay Using Fluorescein as the Fluorescent Probe. J. Agric. Food. Chem. 2001, 49, 4619–4626. [Google Scholar] [CrossRef] [PubMed]
  87. Dávalos, A.; Gómez-Cordovés, B.B. Extending Applicability of the Oxygen Radical Absorbance Capacity (ORAC−Fluorescein) Assay. J. Agric. Food Chem. 2004, 52, 48–54. [Google Scholar] [CrossRef]
  88. Fonseca, A.; Rafaela, N. Determination of Sun Protection Factor by UV-Vis Spectrophotometry. Health Care Curr. Rev. 2013, 1, 1000108. [Google Scholar] [CrossRef]
  89. Shang, D.; Liu, Y.; Jiang, F.; Ji, F.; Wang, H.; Han, X. Synergistic Antibacterial Activity of Designed Trp-Containing Antibacterial Peptides in Combination with Antibiotics Against Multidrug-Resistant Staphylococcus epidermidis. Front. Microbiol. 2019, 10, 2719. [Google Scholar] [CrossRef] [Green Version]
  90. Riss, T.L.; Moravec, R.A.; Niles, A.L.; Duellman, S.; Benink, H.A.; Worzella, T.J.; Minor, L. Cell Viability Assays. In Assay Guidance Manual; Riss, T., Minor, L., Eds.; Eli Lilly & Company and the National Center for Advancing Translational Sciences: Bethesda Rockville, MA, USA, 2016; pp. 1–31. [Google Scholar]
Figure 1. Relative distribution n of polyphenol families in MS extracts from (A) RAE, (B) HAE (unit: %).
Molecules 27 05467 g001
Figure 2. Biofilm formation inhibition and disruption assay for S. aureus and S. epidermidis. (A) RAE treatment against S. aureus. (B) RAE treatment against S. epidermidis (C) HAE treatment against S. aureus. (D) HAE treatment against S. epidermidis. **** indicates p ≤ 0.0001 between no treatment control and the treated bacteria.
Molecules 27 05467 g002
Figure 3. Viability of HDFa cells exposed to MS extracts at concentrations of 1 µg/mL to 100 µg/mL for 24 h. These results prompted us to use the RAE and HAE extracts at concentrations between 63 and 100 µg/mL for infection assays on HDFa cells.
Molecules 27 05467 g003
Figure 4. Lactate Dehydrogenase release. (A) HDFa cells exposed to an MOI of 5 S. aureus and different concentrations of the RAE and HAE extracts at 6 h post infection. (B) HDFa cells exposed to an MOI of 5 S. epidermidis and different concentrations of the RAE and HAE extracts at 6 h post infection. **** indicates p ≤ 0.0001 between the respective control of untreated cells and the treated cells.
Molecules 27 05467 g004
Figure 5. Percentage of reactive oxygen species. (A) HDFa cells exposed to MS extracts for 3 h. (B) Simultaneous exposure for 3 h to S. aureus and different concentrations of MS extracts. (C) Pretreatment for 3 h with different concentrations of MS extracts, and subsequent incubation for 3 h with S. aureus. (D) HDFa cells exposed for 3 h to S. epidermidis and different concentrations of MS extracts. (E) HDF cells pretreated for 3 h with different concentrations of MS extracts and subsequently incubated for 3 h with S. epidermidis. **** indicates p ≤ 0.0001 between the respective control of untreated cells and the treated cells.
Molecules 27 05467 g005
Table 1. Weight of extracts from MS samples.
Scheme% YieldWeight of Extract Obtained (mg/g)
RAE1.191.53
HAE20.772.71
Table 2. Total polyphenols and flavonoids in MS extracts.
SampleTotal Polyphenols (mg GAE/g Dry Sample)Total Flavonoids (mg KE/g Dry Sample)
RAE57.13 ± 0.8129.01 ± 0.65
HAE14.77 ± 0.5210.58 ± 0.56
Table 3. Relative abundances of compounds in MS extracts.
Relative Abundance (%)
CompoundFamily ModeRAEHAE
Protocatechuic acid 4-O-glucosidePhenolic acid+1.782.19
p-Coumaroyl tartaric acidNA28
Feruloyl tartaric acidNA12.8
Kaempferol 3-O-glucuronideFlavonoid+NA1.41
Cirsimaritin8.45NA
Kaempferide0.47NA
Isoxanthohumol9.09NA
DaidzeinNA10.85
Daidzin0.372.19
ResveratrolStilbene+0.131.23
PyrogallolOthers+9.321.81
Catechol+3.162.82
1,4-Naphthoquinone+0.34NA
NA: Not among the most abundant in the extract.
Table 4. Radical scavenging capacity of MS extracts by DPPH and ORAC assays.
SampleDPPH (% Inhibition)ORAC
RAE82.96 ± 0.531.63 ± 0.02
HAE49.16 ± 1.181.54 ± 0.14
Gallic acid79.24 ± 0.26 1.03 ± 0.14
Vitamin C70.45 ± 1.340.52 ± 0.04
TROLOX-1
A concentration of 20 µg/mL of RAE, HAE, Gallic acid, Vitamin C and TROLOX was used to perform the DPPH and ORAC assays.
Table 5. SPF measured in MS extracts.
SampleSPF DetectedSPF EquivalentSPF Level
RAE17.99 ± 0.0215Moderate
HAE21.91 ± 0.3820Moderately high
Table 6. Minimum 80% inhibitory concentrations of MS extracts in S. aureus and S. epidermidis.
S. aureusS. epidermidis
SampleMIC80 (µg/mL)CategoryMIC80 (µg/mL)Category
RAE512<Resistant128Resistant
HAE512<Resistant512Resistant
Kanamycin2Susceptible512<Resistant
Chloramphenicol 4Susceptible16Intermediate susceptibility
Table 7. IC50 and selectivity indices of MS extracts on COX enzymes.
IC50 (µg/mL)
SampleCOX-1COX-2Selectivity Index
RAE31.28 ± 0.393.14 ± 0.029.96
HAE24.08 ± 1.413.52 ± 0.016.84
SC5606.54 × 10−3 ± 9.02 × 10⁻⁵--
Celecoxib-1.81 ± 0.02-
Publisher’s Note: MDPI stays neutral with regard to jurisdictional claims in published maps and institutional affiliations.

