
Folate-Targeted Curcumin-Loaded Niosomes for Site-Specific Delivery in Breast Cancer Treatment: In Silico and In Vitro Study


 ,
,  , , , ,
Abstract
:
1. Introduction
2. Material and Methods
2.1. In Silico Study
2.1.1. Recognition of Target’s Properties
2.1.2. Validation of Bcl2, Bax, and p53
2.1.3. ADME Prediction
2.1.4. Ligand Preparation and Molecular Docking
2.1.5. Molecular Dynamics Simulation
2.2. In Vitro Study and Niosome Synthesis and Characterization
2.2.1. Materials
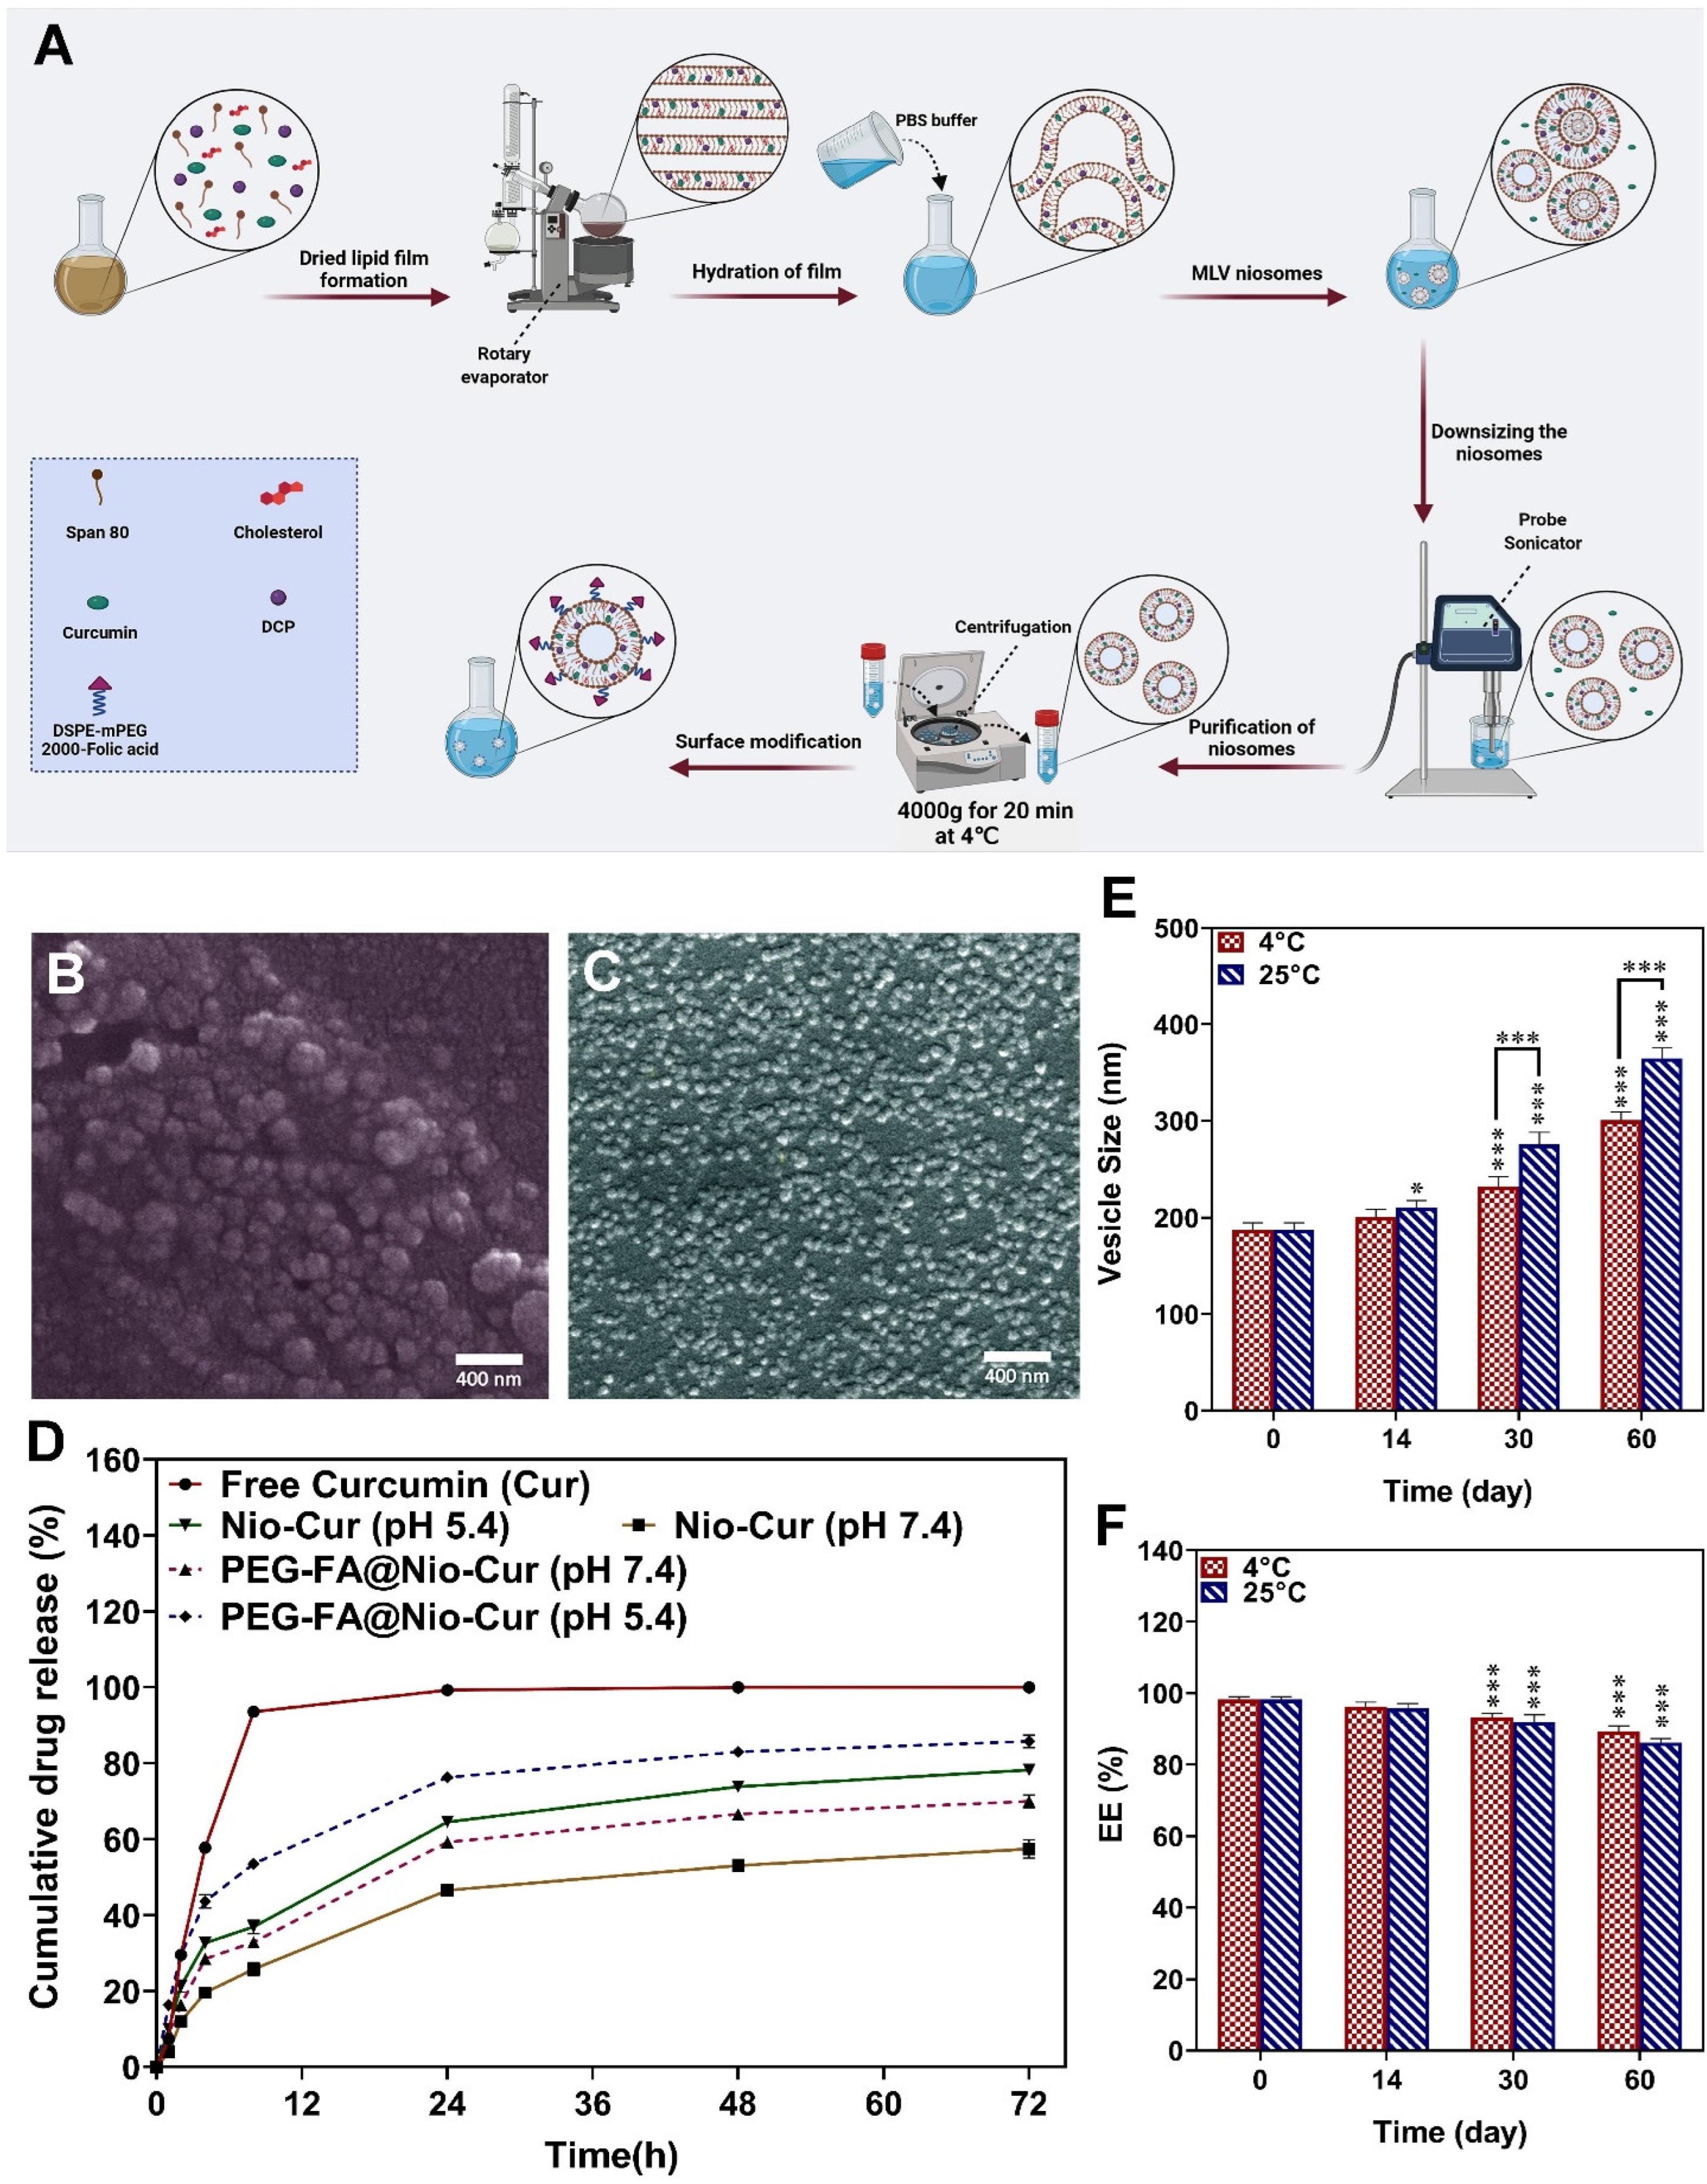
2.2.2. Synthesis of Niosomal Formulations
2.2.3. Surface Functionalization of the Optimized Niosomal Formulation
2.2.4. Physical Characterization of Niosomal Formulations
2.2.5. Entrapment Efficacy
2.2.6. In Vitro Drug Release
2.2.7. Stability
2.2.8. Culture of MCF7 and 4T1 Cell Lines
2.2.9. Cell Proliferation
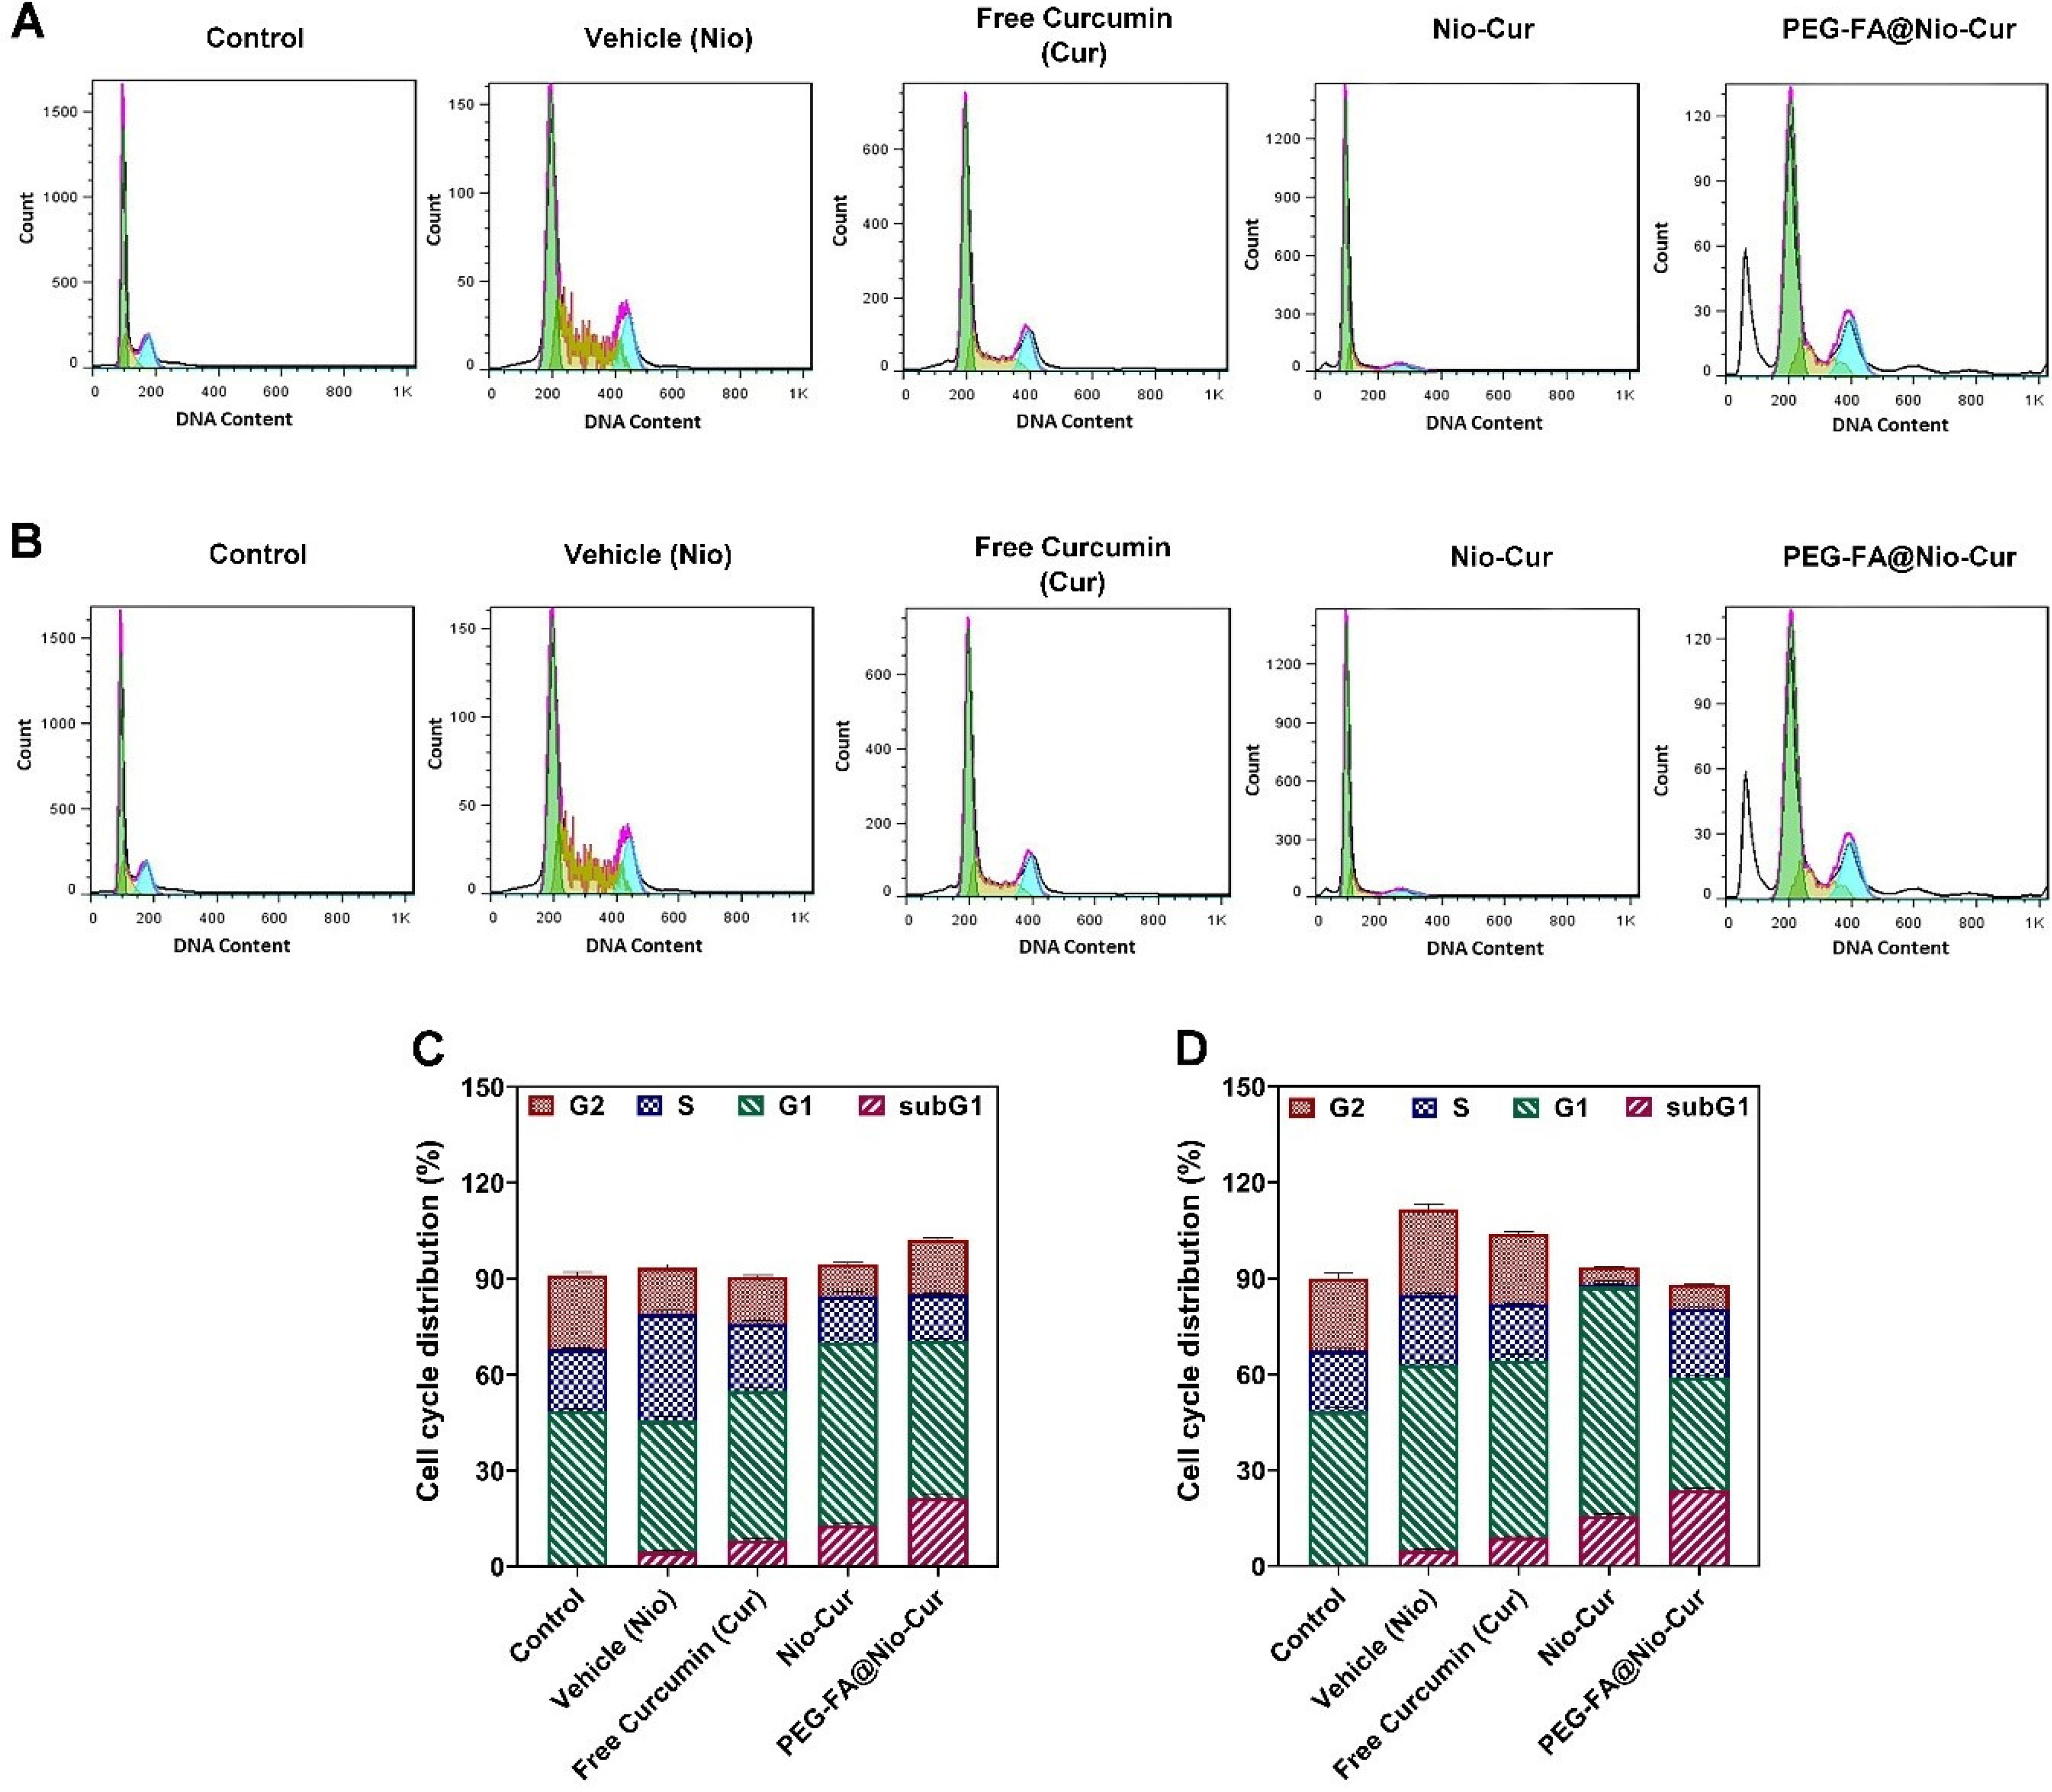
2.2.10. Apoptosis
2.2.11. Cell Cycle
2.2.12. Reactive Oxygen Species
2.2.13. Quantitative Real-Time Polymerase Chain Reaction (qRT-PCR)
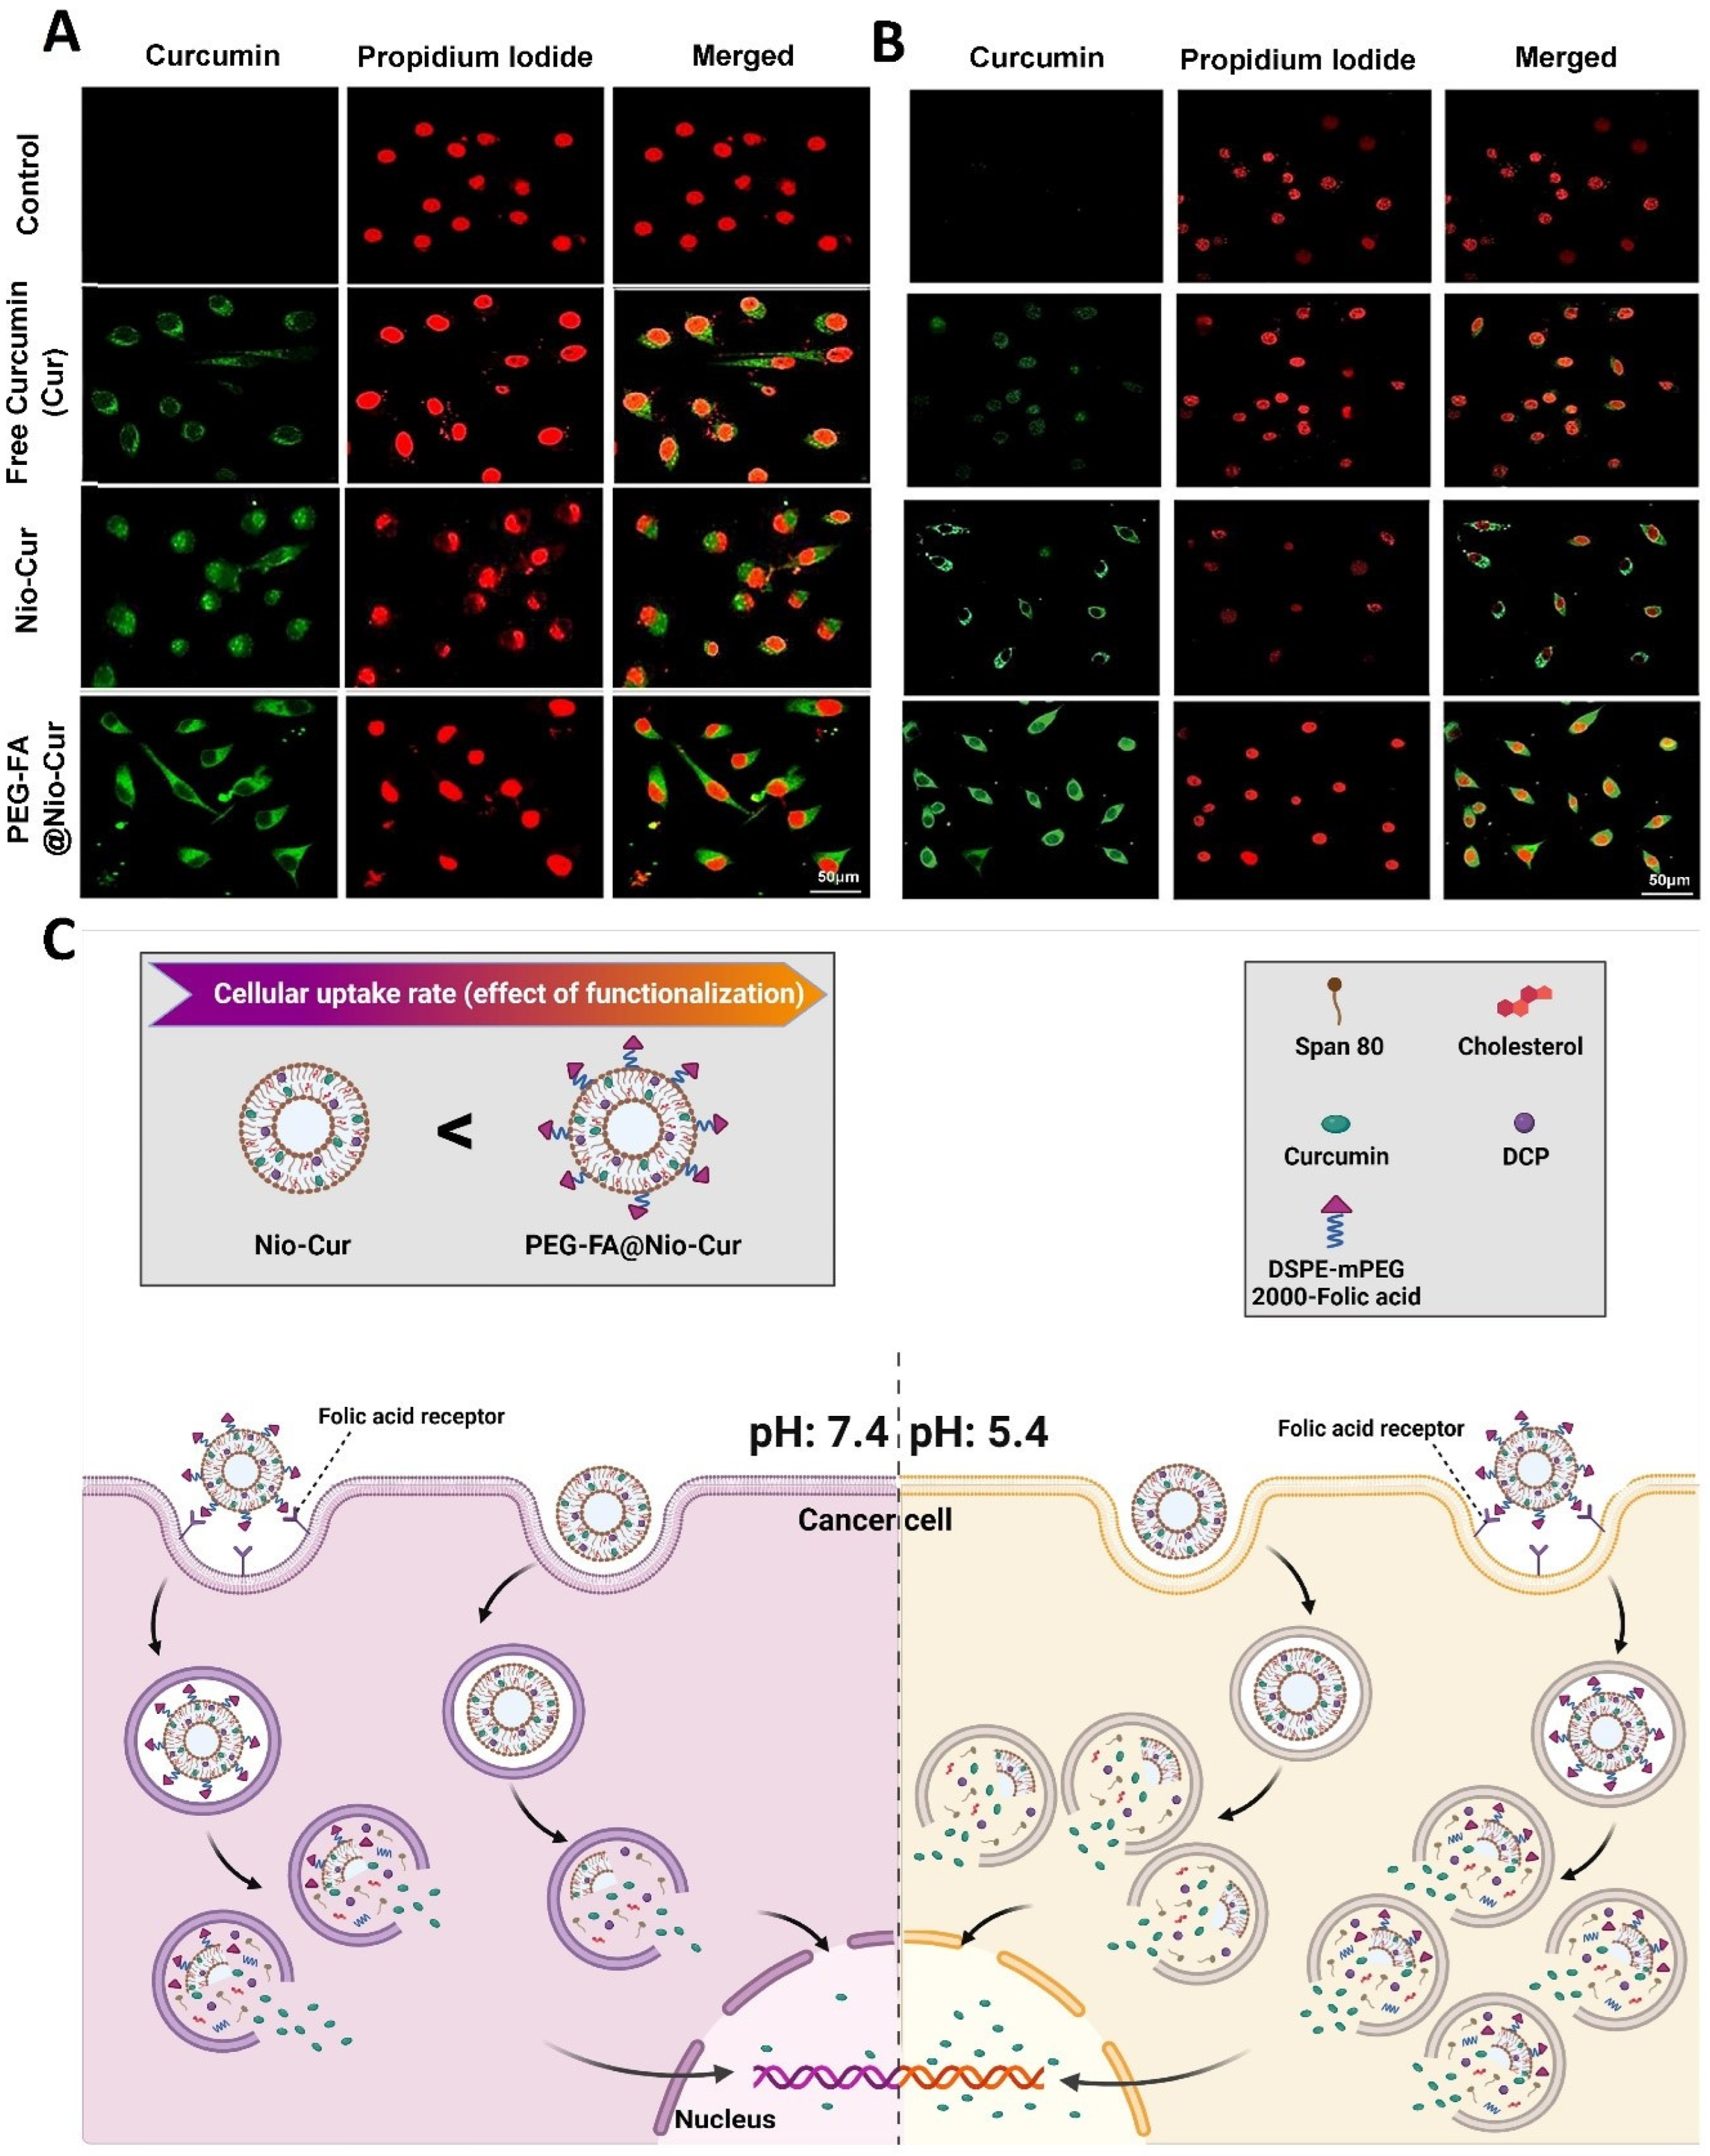
2.2.14. Cellular Uptake of Formulations
2.2.15. DAPI Staining
2.3. Statistical Analysis
3. Results
3.1. In Silico Study
3.1.1. Recognition of Target Properties
3.1.2. Validation of Bax, Bcl2, and p53 Proteins
3.1.3. ADME Prediction
3.1.4. Molecular Docking
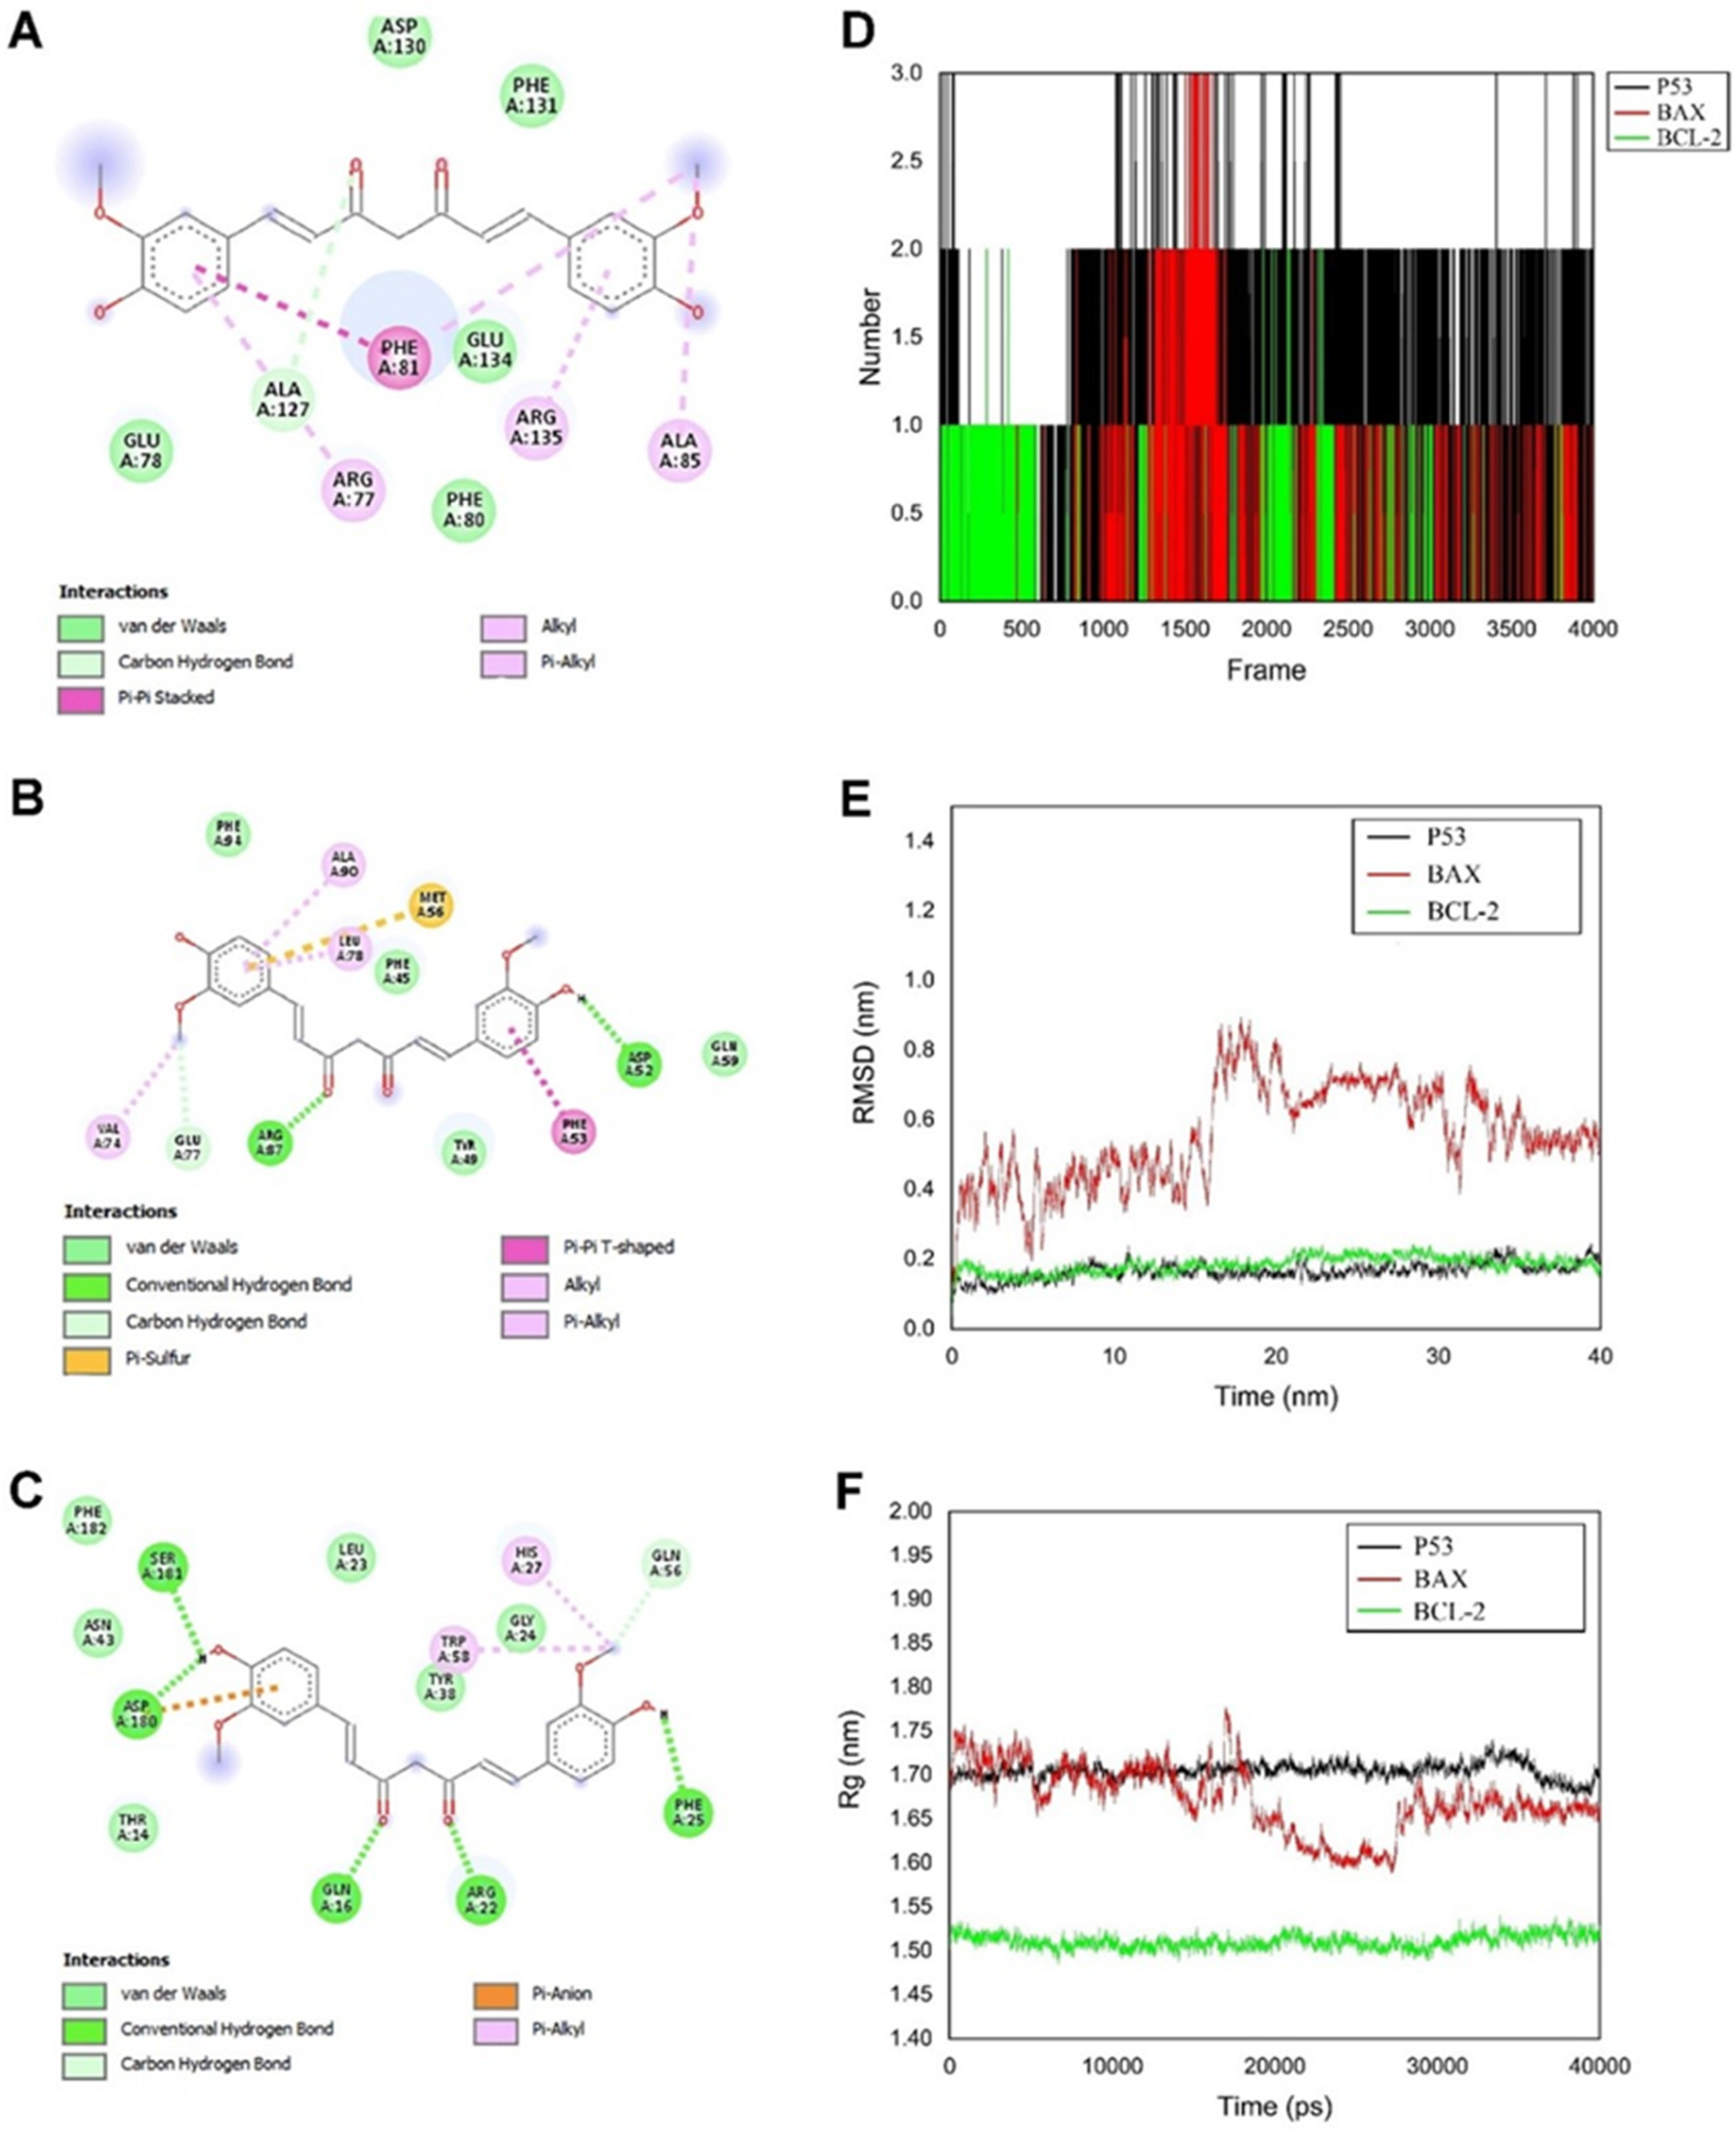
3.1.5. Hydrogen Bonds
3.1.6. Root Mean Square Deviation of Atomic Positions (RMSD)
3.1.7. Radius of Gyration
3.2. Fabrication and Characterization
3.2.1. Particle Size
3.2.2. Entrapment Efficiency
3.2.3. Size Distribution, Zeta Potential, and Morphology of the Nanoformulations
3.2.4. Drug Release and Modeling Kinetic
3.2.5. Stability
3.2.6. Cell Proliferation
3.2.7. Apoptosis
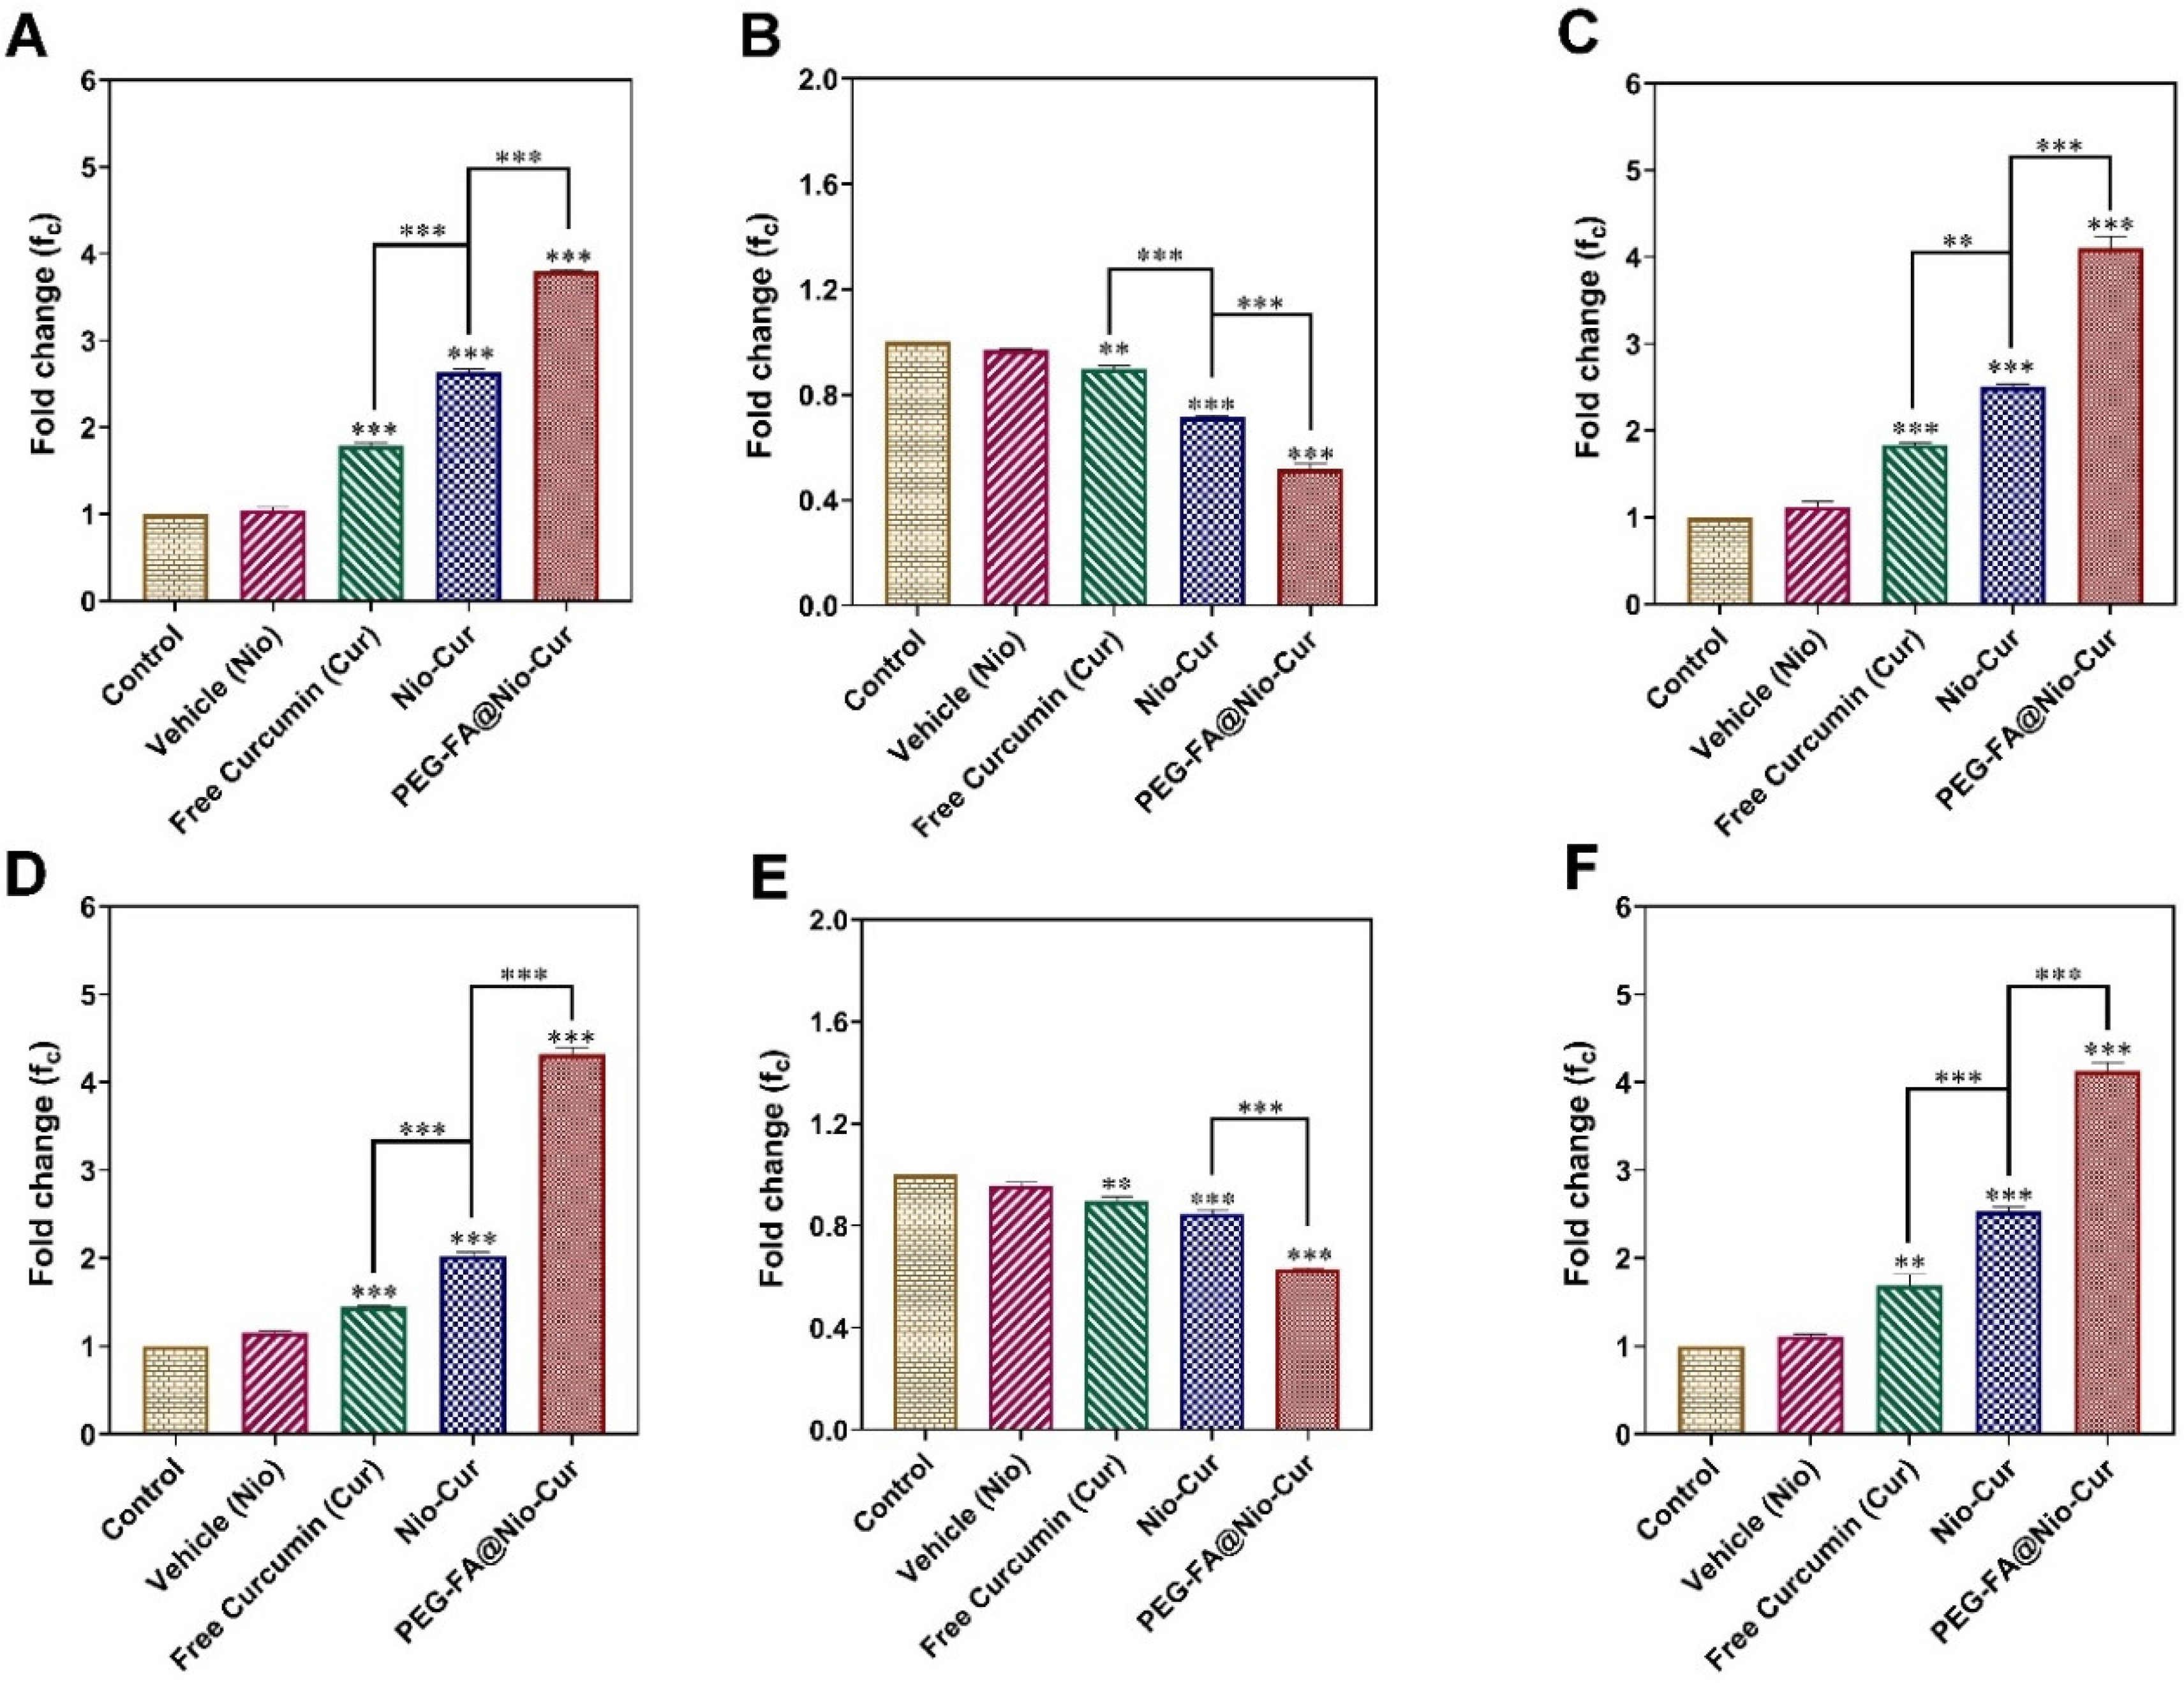
3.2.8. Cell Cycle
3.2.9. Quantitative Real-Time Polymerase Chain Reaction (qRT-PCR)
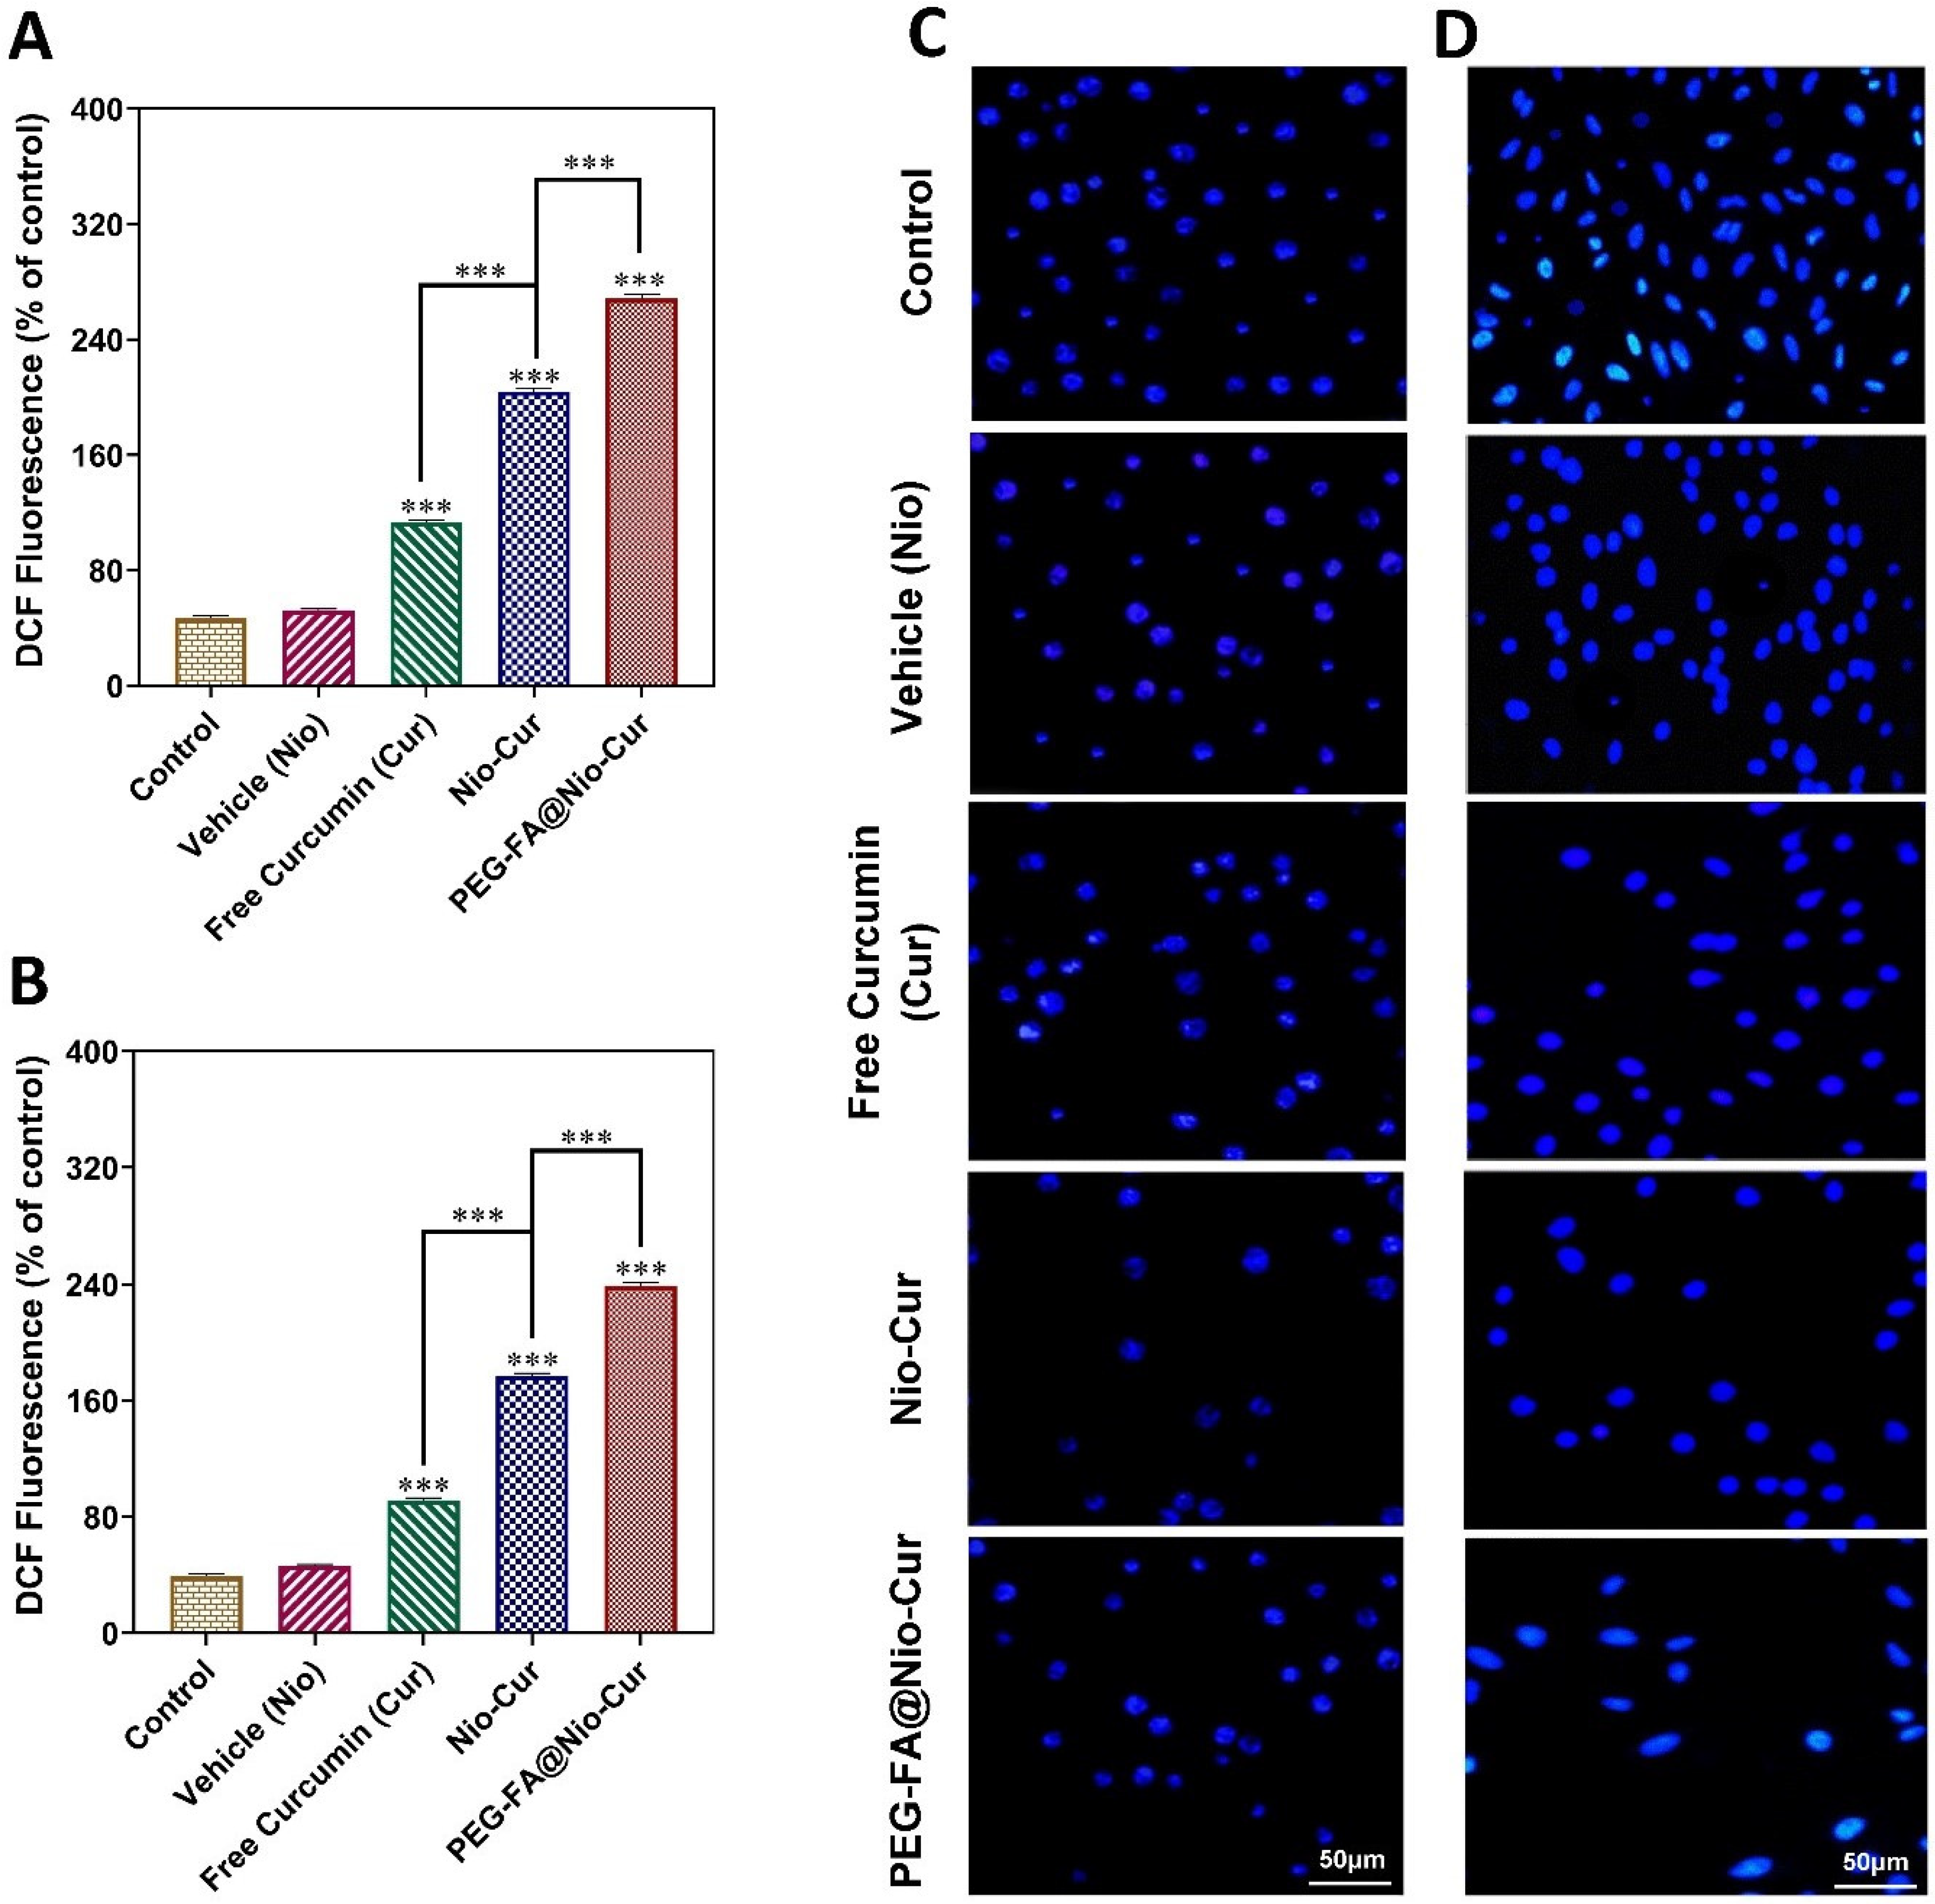
3.2.10. Reactive Oxygen Species
3.2.11. Cellular Uptake and DAPI Staining
4. Discussion
5. Conclusions
Supplementary Materials
Author Contributions
Funding
Institutional Review Board Statement
Informed Consent Statement
Data Availability Statement
Conflicts of Interest
Sample Availability
Abbreviations
| Cur | curcumin |
| FA | folic acid |
| PDI | polydispersity index |
| EE | encapsulation efficiency |
| P-gp | P-glycoprotein |
| PPB | plasma protein binding |
| BBB | blood–brain barrier |
| VD | volume distribution |
| CYP | cytochrome P450 |
| PDB | Protein Data Bank |
| RMSD | root mean square deviation |
| Rg | radius of gyration |
| ROS | reactive oxygen species |
| DCF | dichlorodihydroflourescin |
References
- Sarhadi, M.; Aryan, L.; Zarei, M. The Estrogen Receptor and Breast Cancer: A Complete Review. CPRPASE Trans. Appl. Sci. 2020, 6, 309–314. [Google Scholar]
- Siegel, R.L.; Miller, K.D.; Fuchs, H.E.; Jemal, A. Cancer Statistics, 2021. CA Cancer J. Clin. 2021, 71, 7–33. [Google Scholar] [CrossRef]
- Molani, S.; Madadi, M.; Williams, D.J.M. Investigating the Effectiveness of Breast Cancer Supplemental Screening Considering Radiologists’ Bias. MedRxiv 2020. [Google Scholar] [CrossRef]
- Molani, S.; Madadi, M.; Wilkes, W.J.O. A partially observable Markov chain framework to estimate overdiagnosis risk in breast cancer screening: Incorporating uncertainty in patients adherence behaviors. Omega 2019, 89, 40–53. [Google Scholar] [CrossRef]
- Garcia-Martinez, L.; Zhang, Y.; Nakata, Y.; Chan, H.L.; Morey, L. Epigenetic mechanisms in breast cancer therapy and resistance. Nat. Commun. 2021, 12, 1786. [Google Scholar] [CrossRef] [PubMed]
- Li, M.; Guo, T.; Lin, J.; Huang, X.; Ke, Q.; Wu, Y.; Fang, C.; Hu, C. Curcumin inhibits the invasion and metastasis of triple negative breast cancer via Hedgehog/Gli1 signaling pathway. J. Ethnopharmacol. 2022, 283, 114689. [Google Scholar] [CrossRef] [PubMed]
- Ashrafizadeh, M.; Zarrabi, A.; Hushmandi, K.; Zarrin, V.; Moghadam, E.R.; Hashemi, F.; Makvandi, P.; Samarghandian, S.; Khan, H.; Hashemi, F. Toward regulatory effects of curcumin on transforming growth factor-beta across different diseases: A review. Front. Pharmacol. 2020, 11, 1785. [Google Scholar] [CrossRef]
- Yeganeh, F.E.; Yeganeh, A.E.; Yousefi, M.; Farasati Far, B.; Akbarzadeh, I.; Bokov, D.O.; Raahemifar, K.; Soltani, M. Formulation and Characterization of Poly (Ethylene Glycol)-Coated Core-Shell Methionine Magnetic Nanoparticles as a Carrier for Naproxen Delivery: Growth Inhibition of Cancer Cells. Cancers 2022, 14, 1797. [Google Scholar] [CrossRef]
- Sahrayi, H.; Hosseini, E.; Karimifard, S.; Khayam, N.; Meybodi, S.M.; Amiri, S.; Bourbour, M.; Farasati Far, B.; Akbarzadeh, I.; Bhia, M.; et al. Co-Delivery of Letrozole and Cyclophosphamide via Folic Acid-Decorated Nanoniosomes for Breast Cancer Therapy: Synergic Effect, Augmentation of Cytotoxicity, and Apoptosis Gene Expression. Pharmaceuticals 2021, 15, 6. [Google Scholar] [CrossRef]
- Farasati Far, B.; Aghajani Shahrivar, A.; Omar Othman, H.; Shafiee Ardestani, M.; Pazoki-Toroudi, H. Bioinformatics study of the potential of JAK/STAT pathway inhibition as a new treatment strategy to control cytokine release syndrome in COVID-19. Res. Rev. Biotechnol. Biosci. 2021, 8, 170–192. [Google Scholar] [CrossRef]
- Ghosh, S.; Dutta, S.; Sarkar, A.; Kundu, M.; Sil, P.C. Targeted delivery of curcumin in breast cancer cells via hyaluronic acid modified mesoporous silica nanoparticle to enhance anticancer efficiency. Colloids Surf. B Biointerfaces 2021, 197, 111404. [Google Scholar] [CrossRef] [PubMed]
- García-Manrique, P.; Machado, N.D.; Fernández, M.A.; Blanco-López, M.C.; Matos, M.; Gutiérrez, G.J.C. Effect of drug molecular weight on niosomes size and encapsulation efficiency. Colloids Surf. B Biointerfaces 2020, 186, 110711. [Google Scholar] [CrossRef] [PubMed]
- Takzare, A.; Ghafoor, D.D.; Siddiqi, A.F.; Ravali, S.; Shalbaf, M.; Bakhtiar, M. Trachyspermum copticum essential oil incorporated niosome for cancer treatment. J. Drug Deliv. Sci. Technol. 2019, 52, 818–824. [Google Scholar]
- Ghafelehbashi, R.; Akbarzadeh, I.; Yaraki, M.T.; Lajevardi, A.; Fatemizadeh, M.; Saremi, L.H. Preparation, physicochemical properties, in vitro evaluation and release behavior of cephalexin-loaded niosomes. Int. J. Pharm. 2019, 569, 118580. [Google Scholar] [CrossRef] [PubMed]
- Mehta, S.K.; Jindal, N.; Kaur, G.J.C. Quantitative investigation, stability and in vitro release studies of anti-TB drugs in Triton niosomes. Colloids Surf. B Biointerfaces 2011, 87, 173–179. [Google Scholar] [CrossRef] [PubMed]
- Marianecci, C.; Di Marzio, L.; Del Favero, E.; Cantù, L.; Brocca, P.; Rondelli, V.; Rinaldi, F.; Dini, L.; Serra, A.; Decuzzi, P.J.L. Niosomes as drug nanovectors: Multiscale pH-dependent structural response. Langmuir 2016, 32, 1241–1249. [Google Scholar] [CrossRef]
- Akbarzadeh, I.; Yaraki, M.T.; Bourbour, M.; Noorbazargan, H.; Lajevardi, A.; Shilsar, S.M.S.; Heidari, F.; Mousavian, S.M. Optimized doxycycline-loaded niosomal formulation for treatment of infection-associated prostate cancer: An in-vitro investigation. J. Drug Deliv. Sci. Technol. 2020, 57, 101715. [Google Scholar] [CrossRef]
- Davarpanah, F.; Khalili Yazdi, A.; Barani, M.; Mirzaei, M.; Torkzadeh-Mahani, M. Magnetic delivery of antitumor carboplatin by using PEGylated-Niosomes. Daru J. Fac. Pharm. Tehran Univ. Med. Sci. 2018, 26, 57–64. [Google Scholar] [CrossRef]
- Farasati Far, B.; Asadi, S.; Naimi-Jamal, M.R.; Abdelbasset, W.K.; Aghajani Shahrivar, A. Insights into the interaction of azinphos-methyl with bovine serum albumin: Experimental and molecular docking studies. J. Biomol. Struct. Dyn. 2021, 1–11. [Google Scholar] [CrossRef]
- Angelopoulou, A.; Kolokithas-Ntoukas, A.; Fytas, C.; Avgoustakis, K. Folic acid-functionalized, condensed magnetic nanoparticles for targeted delivery of doxorubicin to tumor cancer cells overexpressing the folate receptor. ACS Omega 2019, 4, 22214–22227. [Google Scholar] [CrossRef]
- Garg, V.K.; Avashthi, H.; Tiwari, A.; Jain, P.A.; Ramkete, P.W.; Kayastha, A.M.; Singh, V.K. MFPPI–multi FASTA ProtParam interface. Bioinformation 2016, 12, 74. [Google Scholar] [CrossRef] [PubMed]
- Patra, P.; Ghosh, P.; Patra, B.C.; Bhattacharya, M. Biocomputational analysis and in silico characterization of an angiogenic protein (RNase5) in zebrafish (Danio rerio). Int. J. Pept. Res. Ther. 2020, 26, 1687–1697. [Google Scholar] [CrossRef]
- Wiederstein, M.; Sippl, M.J. ProSA-web: Interactive web service for the recognition of errors in three-dimensional structures of proteins. Nucleic Acids Res. 2007, 35, W407–W410. [Google Scholar] [CrossRef] [PubMed] [Green Version]
- Lovell, S.C.; Davis, I.W.; Arendall III, W.B.; De Bakker, P.I.; Word, J.M.; Prisant, M.G.; Richardson, J.S.; Richardson, D.C. Structure validation by Cα geometry: ϕ, ψ and Cβ deviation. Proteins Struct. Funct. Bioinform. 2003, 50, 437–450. [Google Scholar] [CrossRef] [PubMed]
- Colovos, C.; Yeates, T.O. Verification of protein structures: Patterns of nonbonded atomic interactions. Protein Sci. 1993, 2, 1511–1519. [Google Scholar] [CrossRef] [Green Version]
- Bowie, J.U.; Luthy, R.; Eisenberg, D. A method to identify protein sequences that fold into a known three-dimensional structure. Science 1991, 253, 164–170. [Google Scholar] [CrossRef] [Green Version]
- Lüthy, R.; Bowie, J.U.; Eisenberg, D. Assessment of protein models with three-dimensional profiles. Nature 1992, 356, 83–85. [Google Scholar] [CrossRef]
- Bhosale, R.R.; Gangadharappa, H.V.; Gowda, D.V.; Osmani, R.A.M.A.; Vaghela, R.; Kulkarni, P.K.; Sairam, K.V.; Gurupadayya, B. Current perspectives on novel drug carrier systems and therapies for management of pancreatic cancer: An updated inclusive review. Crit. Rev.™ Ther. Drug Carr. Syst. 2018, 35, 195–292. [Google Scholar] [CrossRef]
- Su, C.; Liu, Y.; Li, R.; Wu, W.; Fawcett, J.P.; Gu, J. Absorption, distribution, metabolism and excretion of the biomaterials used in Nanocarrier drug delivery systems. Adv. Drug Deliv. Rev. 2019, 143, 97–114. [Google Scholar] [CrossRef]
- Lipinski, C.A.; Lombardo, F.; Dominy, B.W.; Feeney, P.J. Experimental and computational approaches to estimate solubility and permeability in drug discovery and development settings. Adv. Drug Deliv. Rev. 1997, 23, 3–25. [Google Scholar] [CrossRef]
- Verma, S.K.; Thareja, S. Structure based comprehensive modelling, spatial fingerprints mapping and ADME screening of curcumin analogues as novel ALR2 inhibitors. PLoS ONE 2017, 12, e0175318. [Google Scholar] [CrossRef] [PubMed]
- Kartasasmita, R.E.; Tjahjono, D.H. Virtual screening of curcumin analogues as DYRK2 inhibitor: Pharmacophore analysis, molecular docking and dynamics, and ADME prediction. F1000Research 2021, 10, 394. [Google Scholar]
- Kalia, M.; Singh, P.K.; Yadav, V.K.; Yadav, B.S.; Sharma, D.; Narvi, S.S.; Mani, A.; Agarwal, V. Structure based virtual screening for identification of potential quorum sensing inhibitors against LasR master regulator in Pseudomonas aeruginosa. Microbial Pathog. 2017, 107, 136–143. [Google Scholar] [CrossRef] [PubMed]
- Mosaddeghi, P.; Eslami, M.; Farahmandnejad, M.; Akhavein, M.; Ranjbarfarrokhi, R.; Khorraminejad-Shirazi, M.; Shahabinezhad, F.; Taghipour, M.; Dorvash, M.; Sakhteman, A. A systems pharmacology approach to identify the autophagy-inducing effects of Traditional Persian medicinal plants. Sci. Rep. 2021, 11, 336. [Google Scholar] [CrossRef] [PubMed]
- Morris, G.M.; Huey, R.; Lindstrom, W.; Sanner, M.F.; Belew, R.K.; Goodsell, D.S.; Olson, A.J. AutoDock4 and AutoDockTools4: Automated docking with selective receptor flexibility. J. Comput. Chem. 2009, 30, 2785–2791. [Google Scholar] [CrossRef] [Green Version]
- Trott, O.; Olson, A.J. AutoDock Vina: Improving the speed and accuracy of docking with a new scoring function, efficient optimization, and multithreading. J. Comput. Chem. 2010, 31, 455–461. [Google Scholar] [CrossRef] [PubMed] [Green Version]
- Sakkiah, S.; Thangapandian, S.; John, S.; Lee, K.W. Pharmacophore based virtual screening, molecular docking studies to design potent heat shock protein 90 inhibitors. Eur. J. Med. Chem. 2011, 46, 2937–2947. [Google Scholar] [CrossRef]
- Wang, Q.; He, J.; Wu, D.; Wang, J.; Yan, J.; Li, H. Interaction of α-cyperone with human serum albumin: Determination of the binding site by using Discovery Studio and via spectroscopic methods. J. Lumin. 2015, 164, 81–85. [Google Scholar] [CrossRef]
- Holland, D.M. Nano-scale Computational Fluid Dynamics with Molecular Dynamics Pre-Simulations. Ph.D. Thesis, University of Warwick, Warwick, UK, 2015. [Google Scholar]
- Zoete, V.; Cuendet, M.A.; Grosdidier, A.; Michielin, O. SwissParam: A fast force field generation tool for small organic molecules. J. Comput. Chem. 2011, 32, 2359–2368. [Google Scholar] [CrossRef] [PubMed]
- Bussi, G.; Donadio, D.; Parrinello, M. Canonical sampling through velocity rescaling. J. Chem. Phys. 2007, 126, 014101. [Google Scholar] [CrossRef] [Green Version]
- Parrinello, M.; Rahman, A. Polymorphic transitions in single crystals: A new molecular dynamics method. J. Appl. Phys. 1981, 52, 7182–7190. [Google Scholar] [CrossRef]
- Essmann, U.; Perera, L.; Berkowitz, M.L.; Darden, T.; Lee, H.; Pedersen, L.G. A smooth particle mesh Ewald method. J. Chem. Phys. 1995, 103, 8577–8593. [Google Scholar] [CrossRef] [Green Version]
- Hess, B.; Bekker, H.; Berendsen, H.J.; Fraaije, J.G. LINCS: A linear constraint solver for molecular simulations. J. Comput. Chem. 1997, 18, 1463–1472. [Google Scholar] [CrossRef]
- Moghtaderi, M.; Mirzaie, A.; Zabet, N.; Moammeri, A.; Mansoori-Kermani, A.; Akbarzadeh, I.; Eshrati Yeganeh, F.; Chitgarzadeh, A.; Bagheri Kashtali, A.; Ren, Q.J.N. Enhanced Antibacterial Activity of Echinacea angustifolia Extract against Multidrug-Resistant Klebsiella pneumoniae through Niosome Encapsulation. Nanomaterials 2021, 11, 1573. [Google Scholar] [CrossRef] [PubMed]
- Hosseini, S.M.H.; Naimi-Jamal, M.R.; Hassani, M. Preparation and Characterization of Mebeverine Hydrochloride Niosomes as Controlled Release Drug Delivery System. Chem. Methodol. 2022, 6, 591–603. [Google Scholar]
- Muzzalupo, R.; Trombino, S.; Iemma, F.; Puoci, F.; La Mesa, C.; Picci, N. Preparation and characterization of bolaform surfactant vesicles. Colloids Surf. B Biointerfaces 2005, 46, 78–83. [Google Scholar] [CrossRef]
- Sohrabi, S.; Haeri, A.; Mahboubi, A.; Mortazavi, A.; Dadashzadeh, S. Chitosan gel-embedded moxifloxacin niosomes: An efficient antimicrobial hybrid system for burn infection. Int. J. Biol. Macromol. 2016, 85, 625–633. [Google Scholar] [CrossRef]
- Rochani, A.K.; Balasubramanian, S.; Girija, A.R.; Raveendran, S.; Borah, A.; Nagaoka, Y.; Nakajima, Y.; Maekawa, T.; Kumar, D.S. Dual mode of cancer cell destruction for pancreatic cancer therapy using Hsp90 inhibitor loaded polymeric nano magnetic formulation. Int. J. Pharm. 2016, 511, 648–658. [Google Scholar] [CrossRef]
- Akbari, J.; Saeedi, M.; Enayatifard, R.; Morteza-Semnani, K.; Hashemi, S.M.H.; Babaei, A.; Rahimnia, S.M.; Rostamkalaei, S.S.; Nokhodchi, A. Curcumin Niosomes (curcusomes) as an alternative to conventional vehicles: A potential for efficient dermal delivery. J. Drug Deliv. Sci. Technol. 2020, 60, 102035. [Google Scholar] [CrossRef]
- Dash, S.; Murthy, P.N.; Nath, L.; Chowdhury, P. Kinetic modeling on drug release from controlled drug delivery systems. Acta Pol. Pharm. 2010, 67, 217–223. [Google Scholar]
- Alemi, A.; Reza, J.Z.; Haghiralsadat, F.; Jaliani, H.Z.; Karamallah, M.H.; Hosseini, S.A.; Karamallah, S.H. Paclitaxel and curcumin coadministration in novel cationic PEGylated niosomal formulations exhibit enhanced synergistic antitumor efficacy. J. Nanobiotechnol. 2018, 16, 28. [Google Scholar] [CrossRef] [PubMed]
- Kamboj, S.; Saini, V.; Bala, S. Formulation and characterization of drug loaded nonionic surfactant vesicles (niosomes) for oral bioavailability enhancement. Sci. World J. 2014, 2014, 959741. [Google Scholar] [CrossRef] [PubMed] [Green Version]
- Shaker, D.S.; Shaker, M.A.; Hanafy, M.S. Cellular uptake, cytotoxicity and in-vivo evaluation of Tamoxifen citrate loaded niosomes. Int. J. Pharm. 2015, 493, 285–294. [Google Scholar] [CrossRef] [PubMed]
- Higuchi, T. Mechanism of sustained-action medication. Theoretical analysis of rate of release of solid drugs dispersed in solid matrices. J. Pharm. Sci. 1963, 52, 1145–1149. [Google Scholar] [CrossRef]
- Korsmeyer, R.W.; Gurny, R.; Doelker, E.; Buri, P.; Peppas, N.A. Mechanisms of solute release from porous hydrophilic polymers. Int. J. Pharm. 1983, 15, 25–35. [Google Scholar] [CrossRef]
- Bettini, R.; Catellani, P.; Santi, P.; Massimo, G.; Peppas, N.; Colombo, P. Translocation of drug particles in HPMC matrix gel layer: Effect of drug solubility and influence on release rate. J. Control. Release 2001, 70, 383–391. [Google Scholar] [CrossRef]
- Noorbazargan, H.; Mashayekhi, A.; Khayam, N.; Naghizadeh, M.; Mirzaie, A. Anti-Cancer, Anti-Invasiveness & Anti-Metastasis of Green Engineered Bioorganic-Capped Silver Nanoparticles Fabricated from Juniperus chinensis Extract and Comparison to Cisplatin in Lung Cancer Cells (A549): In Vitro Assessment of Cellular and Molecular Pathways. 2020. Available online: https://www.researchgate.net/publication/346159051_Anti-cancer_Anti-invasiveness_Anti-metastasis_of_Green_Engineered_Bioorganic-Capped_Silver_Nanoparticles_Fabricated_from_Juniperus_chinensis_Extract_and_Comparison_to_Cisplatin_in_Lung_Cancer_Cells_A5/fulltext/5fbd0fe192851c933f5356df/Anti-cancer-Anti-invasiveness-Anti-metastasis-of-Green-Engineered-Bioorganic-Capped-Silver-Nanoparticles-Fabricated-from-Juniperus-chinensis-Extract-and-Comparison-to-Cisplatin-in-Lung-Cancer-Cells.pdf (accessed on 25 May 2022). [CrossRef]
- Rani, S.; Pooja, K. Elucidation of structural and functional characteristics of collagenase from Pseudomonas aeruginosa. Process Biochem. 2018, 64, 116–123. [Google Scholar] [CrossRef]
- Suhaibun, S.R.; Elengoe, A.; Poddar, R. Technology Advance in Drug Design Using Computational Biology Tool. Malays. J. Med. Health Sci. 2020, 16, 2636–9346. [Google Scholar]
- Chen, C.-Y.; Huang, H.-J.; Tsai, F.-J.; Chen, C.Y.-C. Drug design for Influenza A virus subtype H1N1. J. Taiwan Inst. Chem. Eng. 2010, 41, 8–15. [Google Scholar] [CrossRef]
- Li, A.P. Screening for human ADME/Tox drug properties in drug discovery. Drug Discov. Today 2001, 6, 357–366. [Google Scholar] [CrossRef]
- Chen, L.; Li, Y.; Zhao, Q.; Peng, H.; Hou, T. ADME evaluation in drug discovery. 10. Predictions of P-glycoprotein inhibitors using recursive partitioning and naive Bayesian classification techniques. Mol. Pharm. 2011, 8, 889–900. [Google Scholar] [CrossRef] [PubMed]
- Korzekwa, K.; Nagar, S. Drug distribution Part 2. Predicting volume of distribution from plasma protein binding and membrane partitioning. Pharm. Res. 2017, 34, 544–551. [Google Scholar] [CrossRef] [PubMed] [Green Version]
- Ghafourian, T.; Amin, Z. QSAR models for the prediction of plasma protein binding. BioImpacts BI 2013, 3, 21. [Google Scholar] [PubMed]
- Noureddin, S.A.; El-Shishtawy, R.M.; Al-Footy, K.O. Curcumin analogues and their hybrid molecules as multifunctional drugs. Eur. J. Med. Chem. 2019, 182, 111631. [Google Scholar] [CrossRef] [PubMed]
- Belkacemi, A.; Doggui, S.; Dao, L.; Ramassamy, C. Challenges associated with curcumin therapy in Alzheimer disease. Expert Rev. Mol. Med. 2011, 13, e34. [Google Scholar] [CrossRef] [PubMed]
- Lombardo, F.; Bentzien, J.; Berellini, G.; Muegge, I. In silico models of human pk parameters. prediction of volume of distribution using an extensive data set and a reduced number of parameters. J. Pharm. Sci. 2021, 110, 500–509. [Google Scholar] [CrossRef]
- Beck, T.C.; Beck, K.R.; Morningstar, J.; Benjamin, M.M.; Norris, R.A. Descriptors of Cytochrome Inhibitors and Useful Machine Learning Based Methods for the Design of Safer Drugs. Pharmaceuticals 2021, 14, 472. [Google Scholar] [CrossRef]
- Teschke, R.; Danan, G. Idiosyncratic Drug Induced Liver Injury, Cytochrome P450, Metabolic Risk Factors and Lipophilicity: Highlights and Controversies. Int. J. Mol. Sci. 2021, 22, 3441. [Google Scholar] [CrossRef]
- Davahli, M.R.; Karwowski, W.; Taiar, R. A system dynamics simulation applied to healthcare: A systematic review. Int. J. Environ. Res. Public Health 2020, 17, 5741. [Google Scholar] [CrossRef]
- Lee, W.-H.; Loo, C.-Y.; Young, P.M.; Traini, D.; Mason, R.S.; Rohanizadeh, R. Recent advances in curcumin nanoformulation for cancer therapy. Expert Opin. Drug Deliv. 2014, 11, 1183–1201. [Google Scholar] [CrossRef]
- Villoutreix, B.O.; Taboureau, O. Computational investigations of hERG channel blockers: New insights and current predictive models. Adv. Drug Deliv. Rev. 2015, 86, 72–82. [Google Scholar] [CrossRef] [PubMed]
- Humphrey, W.; Dalke, A.; Schulten, K. VMD: Visual molecular dynamics. J. Mol. Graph. 1996, 14, 33–38. [Google Scholar] [CrossRef]
- Safavi, A.; Ghodousi, E.S.; Ghavamizadeh, M.; Sabaghan, M.; Azadbakht, O.; Babaei, H.; Nazeri, Z.; Darabi, M.K.; Zarezade, V. Computational investigation of novel farnesyltransferase inhibitors using 3D-QSAR pharmacophore modeling, virtual screening, molecular docking and molecular dynamics simulation studies: A new insight into cancer treatment. J. Mol. Struct. 2021, 1241, 130667. [Google Scholar] [CrossRef]
- Bao, Y.; Zhou, L.; Dai, D.; Zhu, X.; Hu, Y.; Qiu, Y. Discover potential inhibitors for PFKFB3 using 3D-QSAR, virtual screening, molecular docking and molecular dynamics simulation. J. Recept. Signal Transduct. 2018, 38, 413–431. [Google Scholar] [CrossRef]
- Ryter, S.W.; Kim, H.P.; Hoetzel, A.; Park, J.W.; Nakahira, K.; Wang, X.; Choi, A.M. Mechanisms of cell death in oxidative stress. Antioxid. Redox Signal. 2007, 9, 49–89. [Google Scholar] [CrossRef]
- Fernández, M.; Javaid, F.; Chudasama, V. Advances in targeting the folate receptor in the treatment/imaging of cancers. Chem. Sci. 2018, 9, 790–810. [Google Scholar] [CrossRef] [PubMed] [Green Version]
- Yoshioka, T.; Sternberg, B.; Florence, A.T. Preparation and properties of vesicles (niosomes) of sorbitan monoesters (Span 20, 40, 60 and 80) and a sorbitan triester (Span 85). Int. J. Pharm. 1994, 105, 1–6. [Google Scholar] [CrossRef]
- Khazaeli, P.; Pardakhty, A.; Shoorabi, H. Caffeine-loaded niosomes: Characterization and in vitro release studies. Drug Deliv. 2007, 14, 447–452. [Google Scholar] [CrossRef]
- Varshosaz, J.; Pardakhty, A.; Hajhashemi, V.-I.; Najafabadi, A.R. Development and physical characterization of sorbitan monoester niosomes for insulin oral delivery. Drug Deliv. 2003, 10, 251–262. [Google Scholar] [CrossRef]
- Lee, S.-C.; Lee, K.-E.; Kim, J.-J.; Lim, S.-H. The effect of cholesterol in the liposome bilayer on the stabilization of incorporated retinol. J. Liposome Res. 2005, 15, 157–166. [Google Scholar] [CrossRef]
- Moazeni, E.; Gilani, K.; Sotoudegan, F.; Pardakhty, A.; Najafabadi, A.R.; Ghalandari, R.; Fazeli, M.R.; Jamalifar, H. Formulation and in vitro evaluation of ciprofloxacin containing niosomes for pulmonary delivery. J. Microencapsul. 2010, 27, 618–627. [Google Scholar] [CrossRef] [PubMed]
- Kumar, G.P.; Rajeshwarrao, P. Nonionic surfactant vesicular systems for effective drug delivery—An overview. Acta Pharm. Sin. B 2011, 1, 208–219. [Google Scholar] [CrossRef] [Green Version]
- Biswal, S.; Murthy, P.; Sahu, J.; Sahoo, P.; Amir, F. Vesicles of non-ionic surfactants (niosomes) and drug delivery potential. Int. J. Pharm. Sci. Nanotechnol. 2008, 1, 1–8. [Google Scholar] [CrossRef]
- Moribe, K.; Maruyama, K.; Iwatsuru, M. Encapsulation characteristics of nystatin in liposomes: Effects of cholesterol and polyethylene glycol derivatives. Int. J. Pharm. 1999, 188, 193–202. [Google Scholar] [CrossRef]
- Al-Mahallawi, A.M.; Khowessah, O.M.; Shoukri, R.A. Nano-transfersomal ciprofloxacin loaded vesicles for non-invasive trans-tympanic ototopical delivery: In-vitro optimization, ex-vivo permeation studies, and in-vivo assessment. Int. J. Pharm. 2014, 472, 304–314. [Google Scholar] [CrossRef] [PubMed]
- Naderinezhad, S.; Amoabediny, G.; Haghiralsadat, F. Co-delivery of hydrophilic and hydrophobic anticancer drugs using biocompatible pH-sensitive lipid-based nano-carriers for multidrug-resistant cancers. RSC Adv. 2017, 7, 30008–30019. [Google Scholar] [CrossRef] [Green Version]
- Shehata, T.; Kimura, T.; Higaki, K.; Ogawara, K.-I. In-vivo disposition characteristics of PEG niosome and its interaction with serum proteins. Int. J. Pharm. 2016, 512, 322–328. [Google Scholar] [CrossRef]
- Cosco, D.; Paolino, D.; Muzzalupo, R.; Celia, C.; Citraro, R.; Caponio, D.; Picci, N.; Fresta, M. Novel PEG-coated niosomes based on bola-surfactant as drug carriers for 5-fluorouracil. Biomed. Microdevices 2009, 11, 1115–1125. [Google Scholar] [CrossRef]
- Hao, Y.; Zhao, F.; Li, N.; Yang, Y. Studies on a high encapsulation of colchicine by a niosome system. Int. J. Pharm. 2002, 24, 73–80. [Google Scholar] [CrossRef]
- Varga, L. Studies on hyaluronic acid prepared from the vitreous body. J. Biol. Chem. 1955, 217, 651–658. [Google Scholar] [CrossRef]
- Joo, J.H.; Jetten, A.M. Molecular mechanisms involved in farnesol-induced apoptosis. Cancer Lett. 2010, 287, 123–135. [Google Scholar] [CrossRef] [PubMed] [Green Version]
- Sadri, S.; Tomar, N.; Yang, C.; Audi, S.H.; Cowley, A.W.; Dash, R.K. Mechanistic computational modeling of the kinetics and regulation of NADPH oxidase 2 assembly and activation facilitating superoxide production. Free Radic. Res. 2020, 54, 695–721. [Google Scholar] [CrossRef] [PubMed]
- Zeng, W.; Li, Q.; Wan, T.; Liu, C.; Pan, W.; Wu, Z.; Zhang, G.; Pan, J.; Qin, M.; Lin, Y. Hyaluronic acid-coated niosomes facilitate tacrolimus ocular delivery: Mucoadhesion, precorneal retention, aqueous humor pharmacokinetics, and transcorneal permeability. Colloids Surf. B Biointerfaces 2016, 141, 28–35. [Google Scholar] [CrossRef]
- Tomar, N.; Sadri, S.; Cowley, A.W., Jr.; Yang, C.; Quryshi, N.; Pannala, V.R.; Audi, S.H.; Dash, R.K.J.F.R.B. A thermodynamically-constrained mathematical model for the kinetics and regulation of NADPH oxidase 2 complex-mediated electron transfer and superoxide production. Free Radic. Biol. Med. 2019, 134, 581–597. [Google Scholar] [CrossRef] [PubMed]
- Pfeifer, C.R.; Vashisth, M.; Xia, Y.; Discher, D.E. Nuclear failure, DNA damage, and cell cycle disruption after migration through small pores: A brief review. Essays Biochem. 2019, 63, 569–577. [Google Scholar] [PubMed]
- Gordon, E.M.; Ravicz, J.R.; Liu, S.; Chawla, S.P.; Hall, F.L. Cell cycle checkpoint control: The cyclin G1/Mdm2/p53 axis emerges as a strategic target for broad-spectrum cancer gene therapy—A review of molecular mechanisms for oncologists. Mol. Clin. Oncol. 2018, 9, 115–134. [Google Scholar] [CrossRef] [PubMed] [Green Version]
- Wood, W.G.; Igbavboa, U.; Muller, W.E.; Eckert, G.P. Statins, Bcl-2, and apoptosis: Cell death or cell protection? Mol. Neurobiol. 2013, 48, 308–314. [Google Scholar] [CrossRef] [Green Version]
- Yoon, O.; Roh, J. Downregulation of KLF4 and the Bcl-2/Bax ratio in advanced epithelial ovarian cancer. Oncol. Lett. 2012, 4, 1033–1036. [Google Scholar] [CrossRef] [Green Version]
- Hemann, M.; Lowe, S. The p53-bcl-2 connection. Cell Death Differ. 2006, 13, 1256. [Google Scholar] [CrossRef]
- Vaseva, A.V.; Moll, U.M. The mitochondrial p53 pathway. Biochim. Biophys. Acta (BBA) Bioenerg. 2009, 1787, 414–420. [Google Scholar] [CrossRef] [Green Version]
- Vousden, K.H.; Lu, X. Live or let die: The cell’s response to p53. Nat. Rev. Cancer 2002, 2, 594–604. [Google Scholar] [CrossRef] [PubMed] [Green Version]


Publisher’s Note: MDPI stays neutral with regard to jurisdictional claims in published maps and institutional affiliations. |
© 2022 by the authors. Licensee MDPI, Basel, Switzerland. This article is an open access article distributed under the terms and conditions of the Creative Commons Attribution (CC BY) license (https://creativecommons.org/licenses/by/4.0/).
Share and Cite
Honarvari, B.; Karimifard, S.; Akhtari, N.; Mehrarya, M.; Moghaddam, Z.S.; Ansari, M.J.; Jalil, A.T.; Matencio, A.; Trotta, F.; Yeganeh, F.E.; et al. Folate-Targeted Curcumin-Loaded Niosomes for Site-Specific Delivery in Breast Cancer Treatment: In Silico and In Vitro Study. Molecules 2022, 27, 4634. https://doi.org/10.3390/molecules27144634
Honarvari B, Karimifard S, Akhtari N, Mehrarya M, Moghaddam ZS, Ansari MJ, Jalil AT, Matencio A, Trotta F, Yeganeh FE, et al. Folate-Targeted Curcumin-Loaded Niosomes for Site-Specific Delivery in Breast Cancer Treatment: In Silico and In Vitro Study. Molecules. 2022; 27(14):4634. https://doi.org/10.3390/molecules27144634
Chicago/Turabian StyleHonarvari, Banafsheh, Sara Karimifard, Niyayesh Akhtari, Mehrnoush Mehrarya, Zahra Salehi Moghaddam, Mohammad Javed Ansari, Abduladheem Turki Jalil, Adrián Matencio, Francesco Trotta, Faten Eshrati Yeganeh, and et al. 2022. "Folate-Targeted Curcumin-Loaded Niosomes for Site-Specific Delivery in Breast Cancer Treatment: In Silico and In Vitro Study" Molecules 27, no. 14: 4634. https://doi.org/10.3390/molecules27144634