
Identification of Gene Biomarkers for Tigilanol Tiglate Content in Fontainea picrosperma
by
 , ,
, ,
Shahida A Mitu
1,2, 
Praphaporn Stewart
2,
Trong D Tran
1,2,
Paul W Reddell
3,
Scott F Cummins
1,2 and
Steven M. Ogbourne
1,2,* 1
Centre for Bioinnovation, University of the Sunshine Coast, Maroochydore DC, QLD 4558, Australia
2
School of Science, Technology and Engineering, University of the Sunshine Coast, Maroochydore DC, QLD 4558, Australia
3
EcoBiotics Ltd., Yungaburra, QLD 4884, Australia
*
Author to whom correspondence should be addressed.
Molecules 2022, 27(13), 3980; https://doi.org/10.3390/molecules27133980
Submission received: 5 May 2022
/
Revised: 16 June 2022
/
Accepted: 18 June 2022
/
Published: 21 June 2022
(This article belongs to the Topic Antioxidant Activity in Plants, Plant-Derived Bioactive Compounds and Foods)
Abstract
:Tigilanol tiglate (EBC-46) is a small-molecule natural product under development for the treatment of cancers in humans and companion animals. The drug is currently produced by purification from the Australian rainforest tree Fontainea picrosperma (Euphorbiaceae). As part of a selective-breeding program to increase EBC-46 yield from F. picrosperma plantations, we investigated potential gene biomarkers associated with biosynthesis of EBC-46. Initially, we identified individual plants that were either high (>0.039%) or low EBC-46 (<0.008%) producers, then assessed their differentially expressed genes within the leaves and roots of these two groups by quantitative RNA sequencing. Compared to low EBC-46 producers, high-EBC-46-producing plants were found to have 145 upregulated genes and 101 downregulated genes in leaves and 53 upregulated genes and 82 downregulated genes in roots. Most of these genes were functionally associated with defence, transport, and biosynthesis. Genes identified as expressed exclusively in either the high or low EBC-46-producing plants were further validated by quantitative PCR, showing that cytochrome P450 94C1 in leaves and early response dehydration 7.1 and 2-alkenal reductase in roots were consistently and significantly upregulated in high-EBC-46 producers. In summary, this study has identified biomarker genes that may be used in the selective breeding of F. picrosperma.
Keywords:
tigilanol tiglate; anti-cancer; biosynthesis pathway; gene expression; CYP94C1; R protein; ERD-7.1; 2-ARD; stress; drought1. Introduction
Terpenoids, also known as isoprenoids, are the largest and most diverse class of plant natural products, many of which have substantial pharmacological activity. A wide variety of terpenoids, ranging from monoterpenoids, sesquiterpenoids, and diterpenoids to triterpenoids and steroids are known from members of the Euphorbiaceae family [1,2,3], attracting considerable attention due to their valuable biological activities relating to the diterpenoid backbones and their diverse array of aliphatic and aromatic ester groups [4]. In particular, tigliane and related diterpenoids are of special interest because they have a very limited known distribution in nature, being found only in the plant families Euphorbiaceae and Thymelaeaceae [2]. The plant family Euphorbiaceae is a rich source of terpenoid natural products [5] and is particularly noted for the occurrence of diverse diterpenoid backbones supporting an array of aliphatic and aromatic ester groups [6]. Tigilanol tiglate (EBC-46) is one such terpenoid, a novel epoxy-tigliane diterpene ester discovered from the fruit of the native Australian rainforest tree F. picrosperma [7]. Fontainea picrosperma C.T. White (Euphorbiaceae) is a dioecious, subcanopy rainforest tree endemic to the Atherton Tablelands, Queensland, Australia. The species is locally common but has a restricted natural range [8,9].
EBC-46 is a novel epoxy-tigliane diterpene ester extracted from the fruit of F. picrosperma [7,10]. TT is likely present in all tissues of the plant, and biosynthesis occurs in the roots [11]. It is of particular interest due to its effectiveness as a local treatment for a range of cancers in humans and animals [7,12,13]. EBC-46 was approved for use as a local intratumoural therapy for canine mast cell tumours by major regulatory authorities, including the European Medicines Agency and the United States Food and Drug Administration in 2020 [10,14] and is currently in clinical development for a range of cancers in humans and in companion animals [12,15]. EBC-46 is not amenable to synthesis on a commercial scale and is currently produced by isolation and purification from the fruit of F. picrosperma [7,11,16]. Consequently, there is considerable interest in the potential for selective breeding of F. picrosperma to improve yields of EBC-46.
At present, neither the site nor the pathway leading to the biosynthesis of EBC-46 are fully understood. Roots are reported as the likely site of biosynthesis for macrocyclic diterpenes (e.g., jatrophane and ingenane) in other taxa of Euphorbiaceae [5], and recent studies suggest a similar situation with F. picrosperma with core enzymes encoding for the diterpenoid biosynthetic pathways found to be most highly expressed in roots [17]. A large repertoire of cytochrome P450 genes (P450s) was also reported that showed varied gene expression in both leaf and root tissue, which may correlate with different levels of EBC-46 [11].
The objective of this study was to investigate the potential to identify biomarker genes associated with the biosynthesis of EBC-46, which could be used in selective breeding of F. picrosperma to increase yields of the compound from commercial plantations. Towards achieving that, we have used metabolite analysis and differential gene expression approaches.
2. Results
2.1. Identification of Low and High EBC-46 Producing F. picrosperma Plants
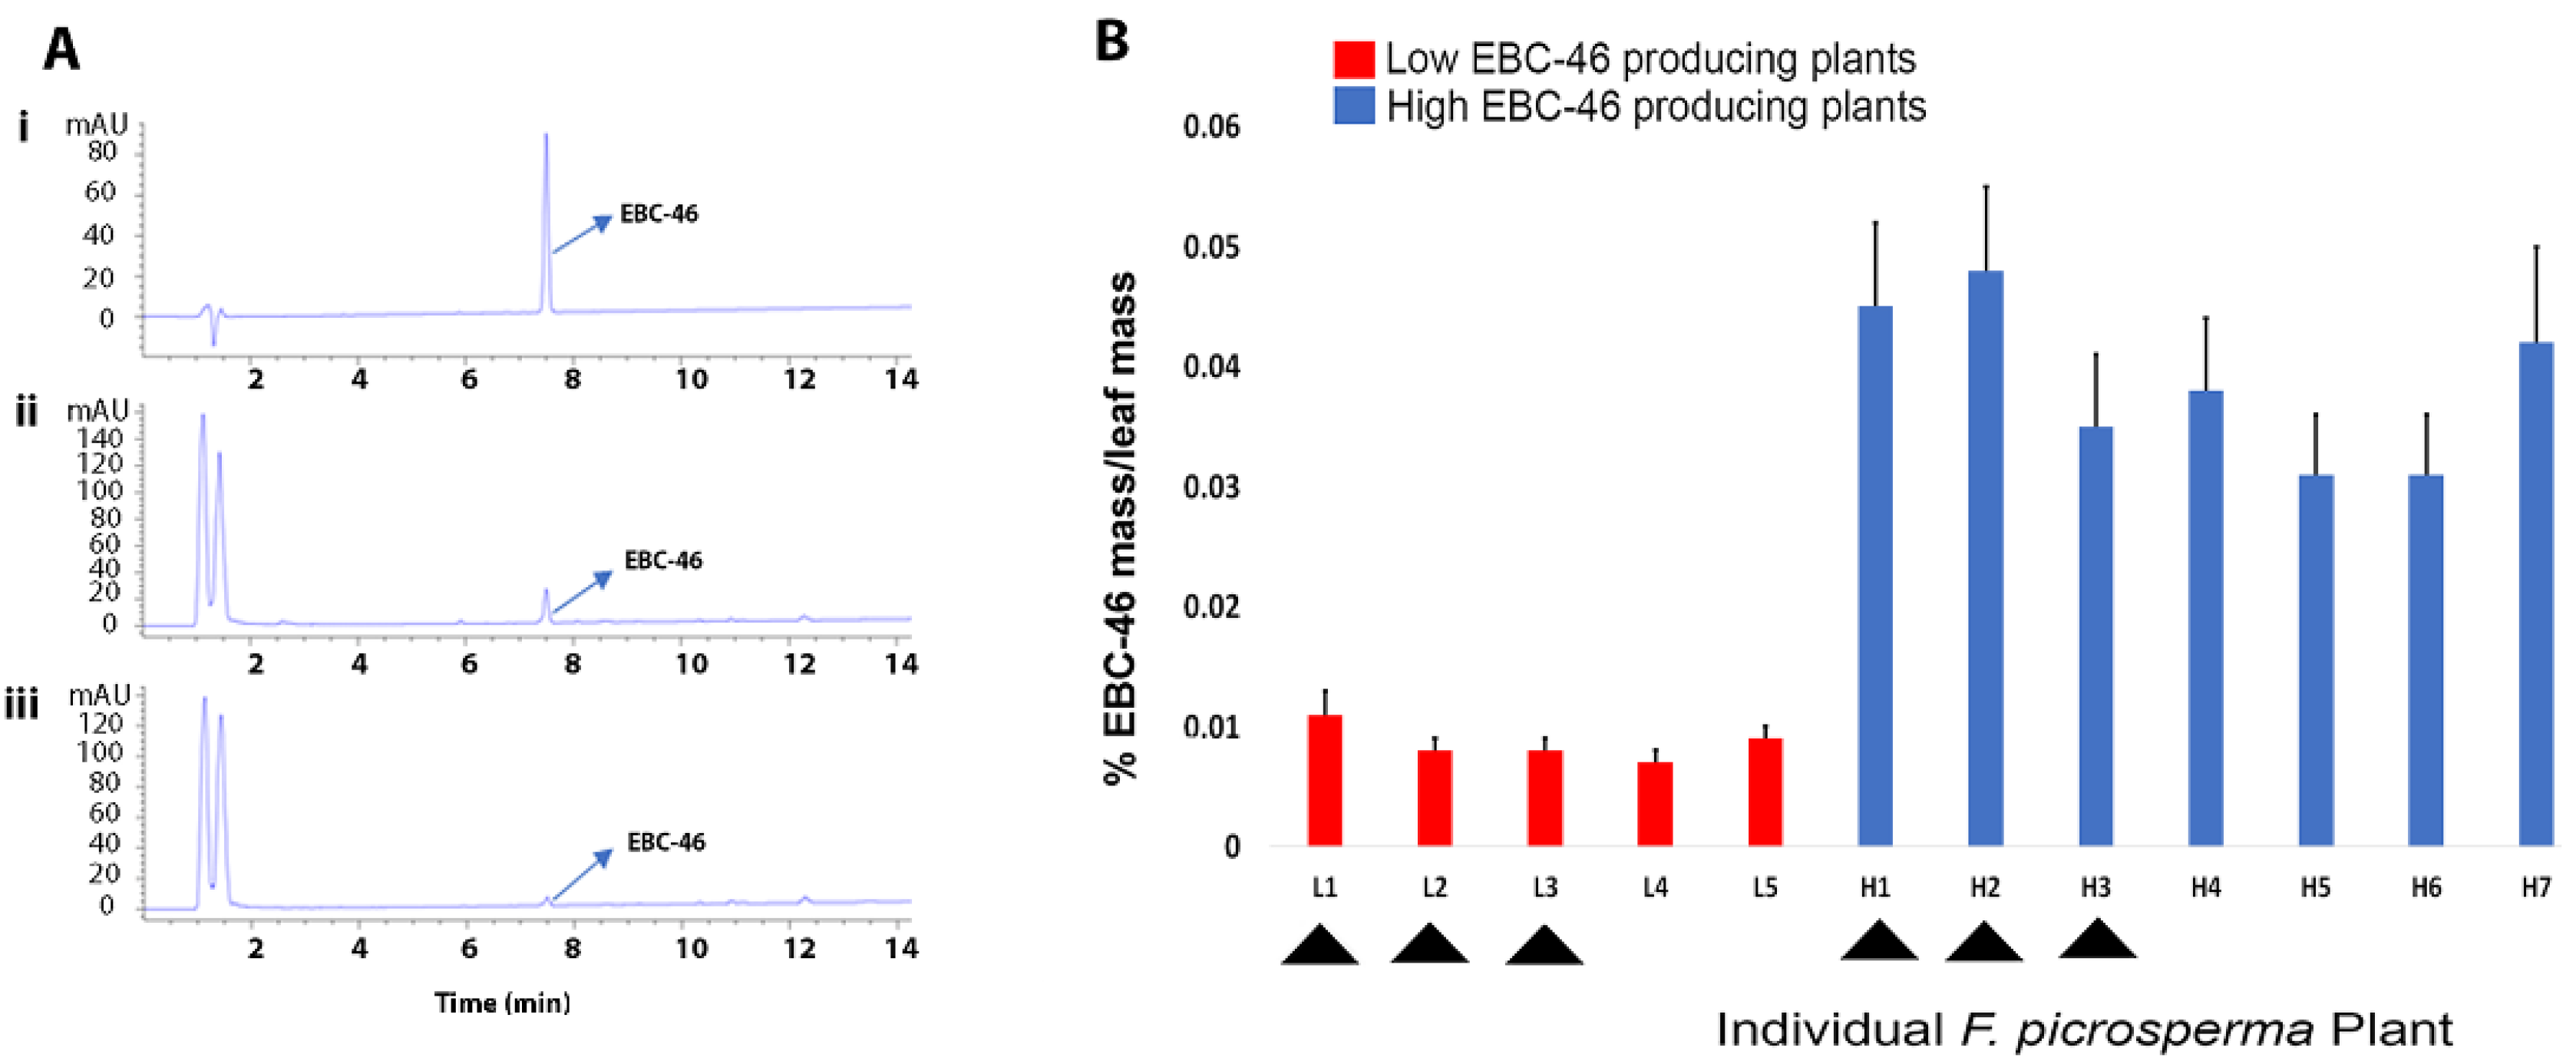
The average EBC-46 concentration of leaf tissue was determined from 12 different plants over a single year. Following HPLC analysis, plants could be separated into low-EBC-46 producers (L1-L5EBC-46) and high-EBC-46 producers (H1-H7 EBC-46) (Figure 1A,B). The concentration of EBC-46 in leaves of each high-EBC-46-producing plant (H1-7) was statistically and significantly different than in leaves of each low-EBC-46-producing plant (L1-5). We selected 3 LEBC-46 (0.008% (L1), 0.008% (L2), and 0.005% (L3) EBC-46 in dried leaves) and 3 HEBC-46 (0.051% (H1), 0.050% (H2), and 0.039% (H3) EBC-46 in dried leaves) plants for differential gene expression using quantitative RNA-seq analysis.
2.2. Identification and Analysis of Differentially Expressed Genes in Low- versus High-EBC-46-Producing F. picrosperma Plants
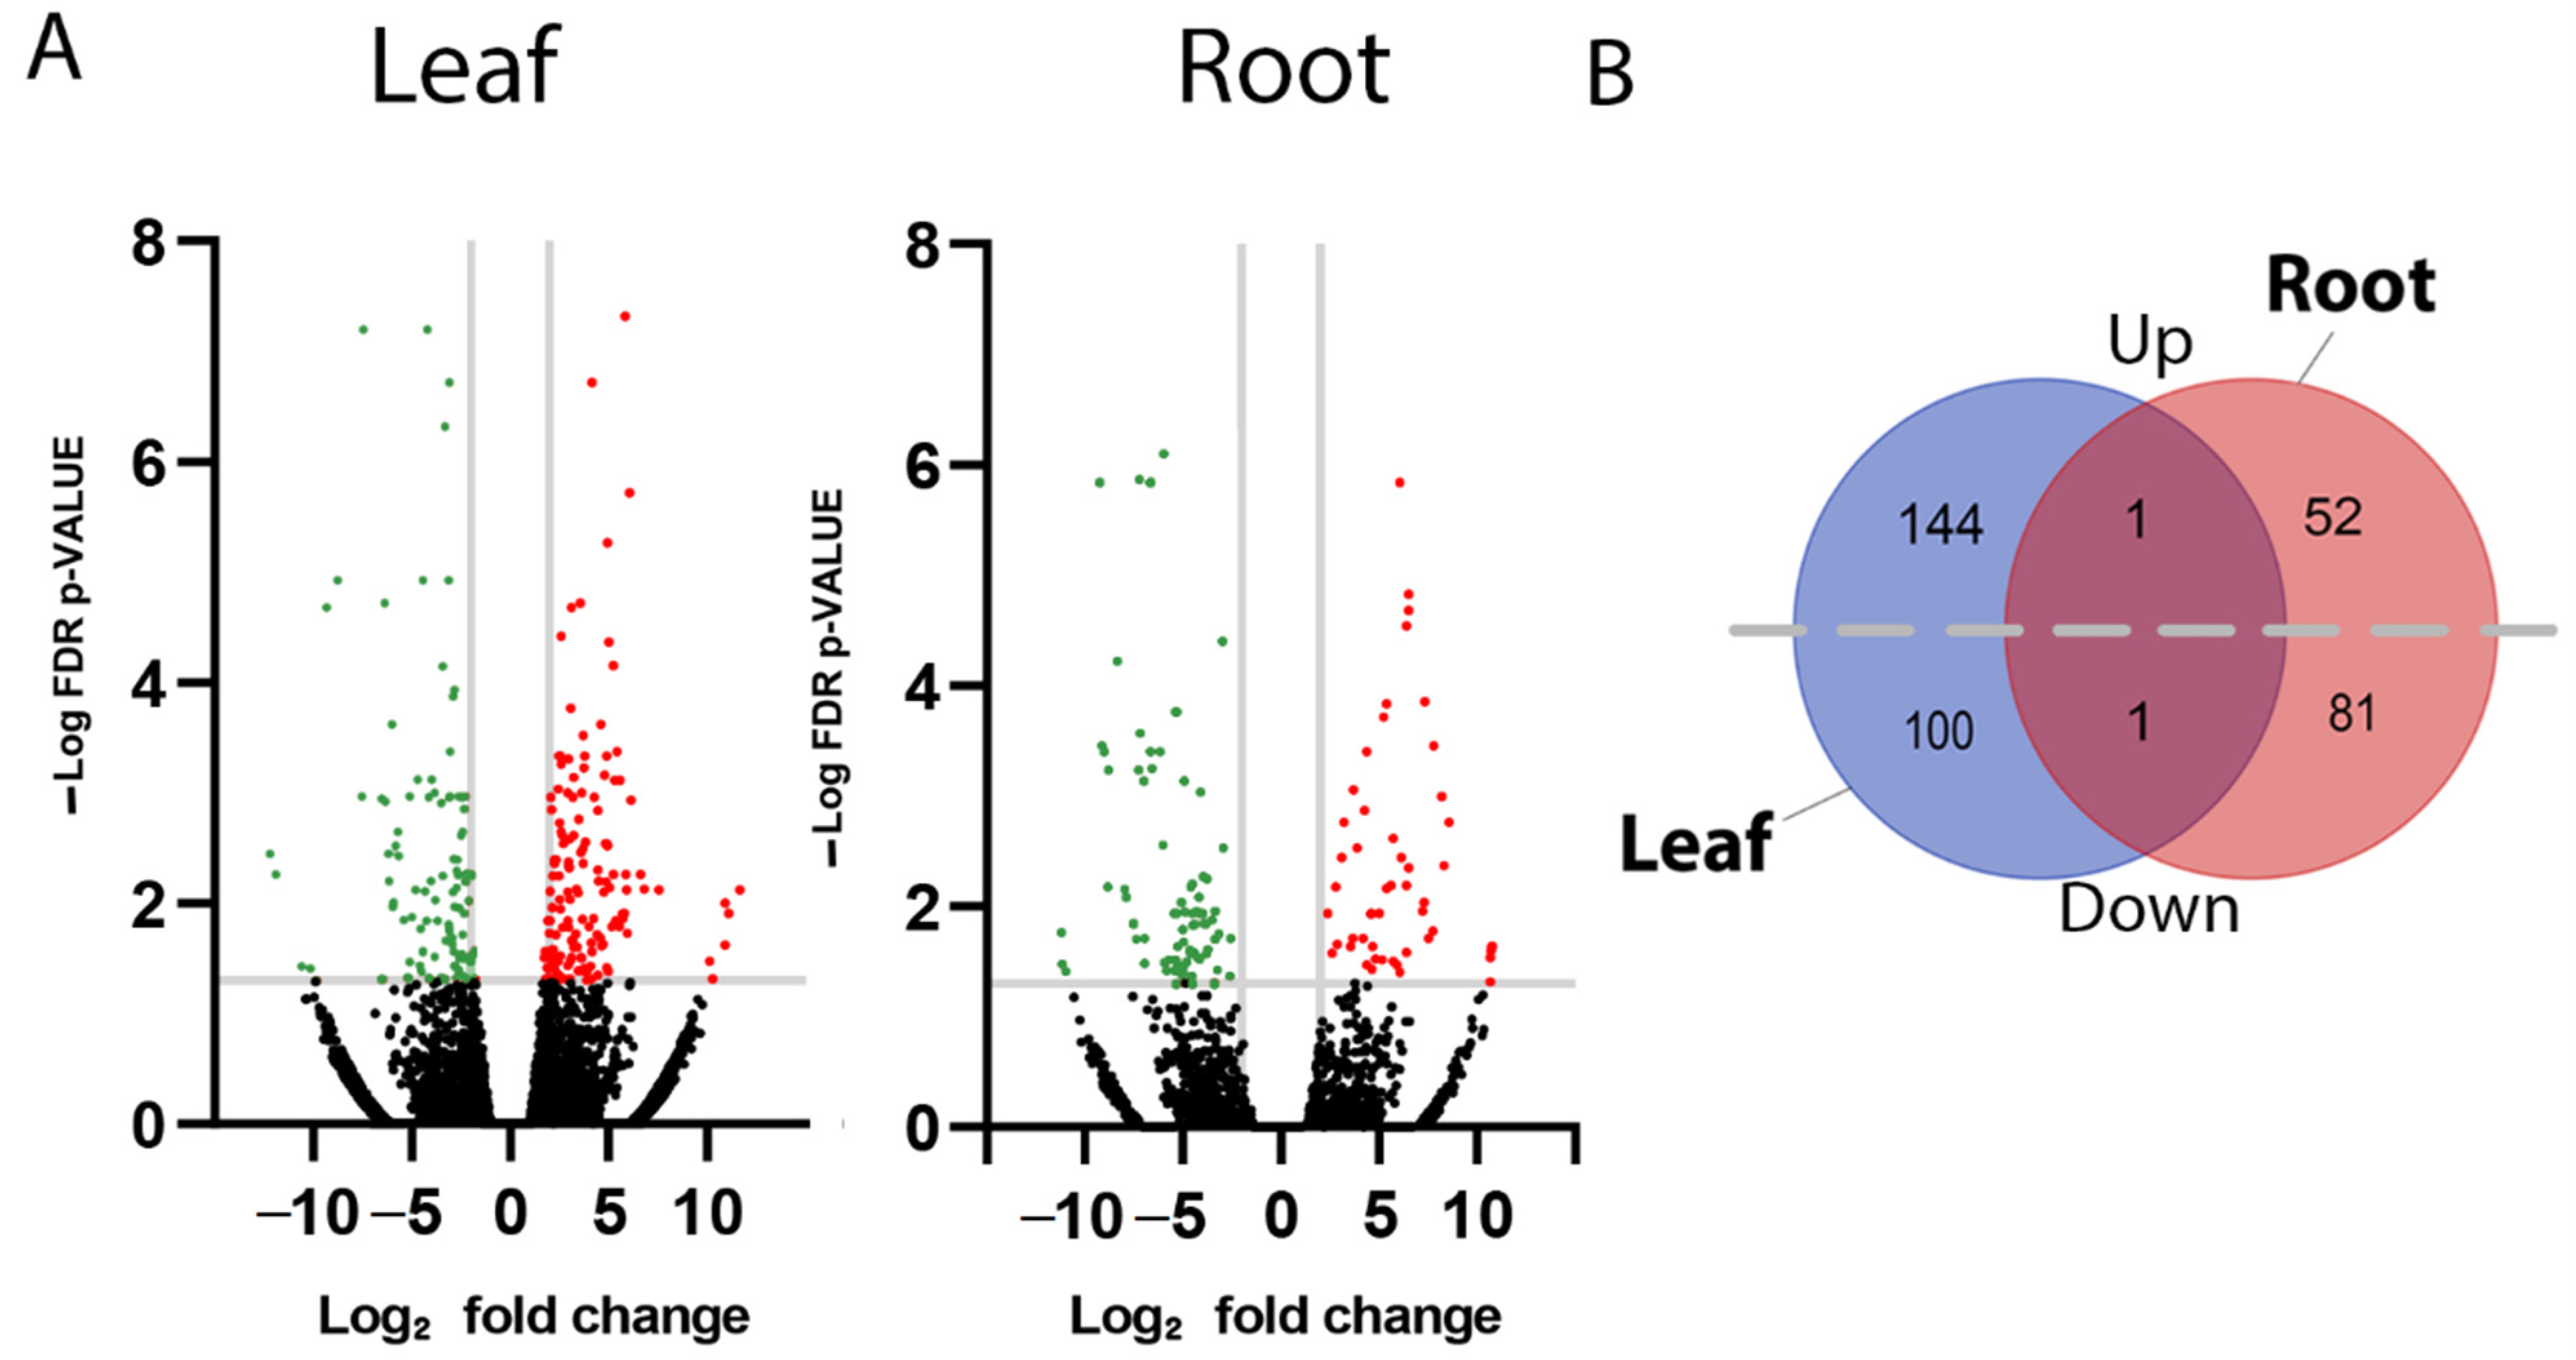
Significantly differentially expressed genes (DEGs) within leaf and root tissues of F. picrosperma were identified using a log2 fold-change of >+/−2 and p-value < 0.05 (Figure 2A and Supplementary File S1). Based on these criteria, a total of 246 significant DEGs were identified in leaf tissue of which 145 were upregulated and 101 were downregulated in HEBC-46 (Figure 2B). In root tissue, 135 significant DEGs were identified of which 53 were upregulated and 82 were downregulated in HEBC-46 (Figure 2B). There was a single common (in leaf and root) upregulated gene, encoding an alpha-glucosidase-like enzyme, while a gene encoding a putative disease-resistance enzyme was the single common downregulated gene. According to gene ontology (GO) analysis of leaf DEGs, there was enrichment of functions involved in transport (65%) and defence (35%), while in root tissue, DEGs were largely enriched in functions associated with metabolomic processes (23%).
2.3. Identification and Annotation of Biomarker Genes for High EBC-46 Producing Plants and Validation by RT-qPCR
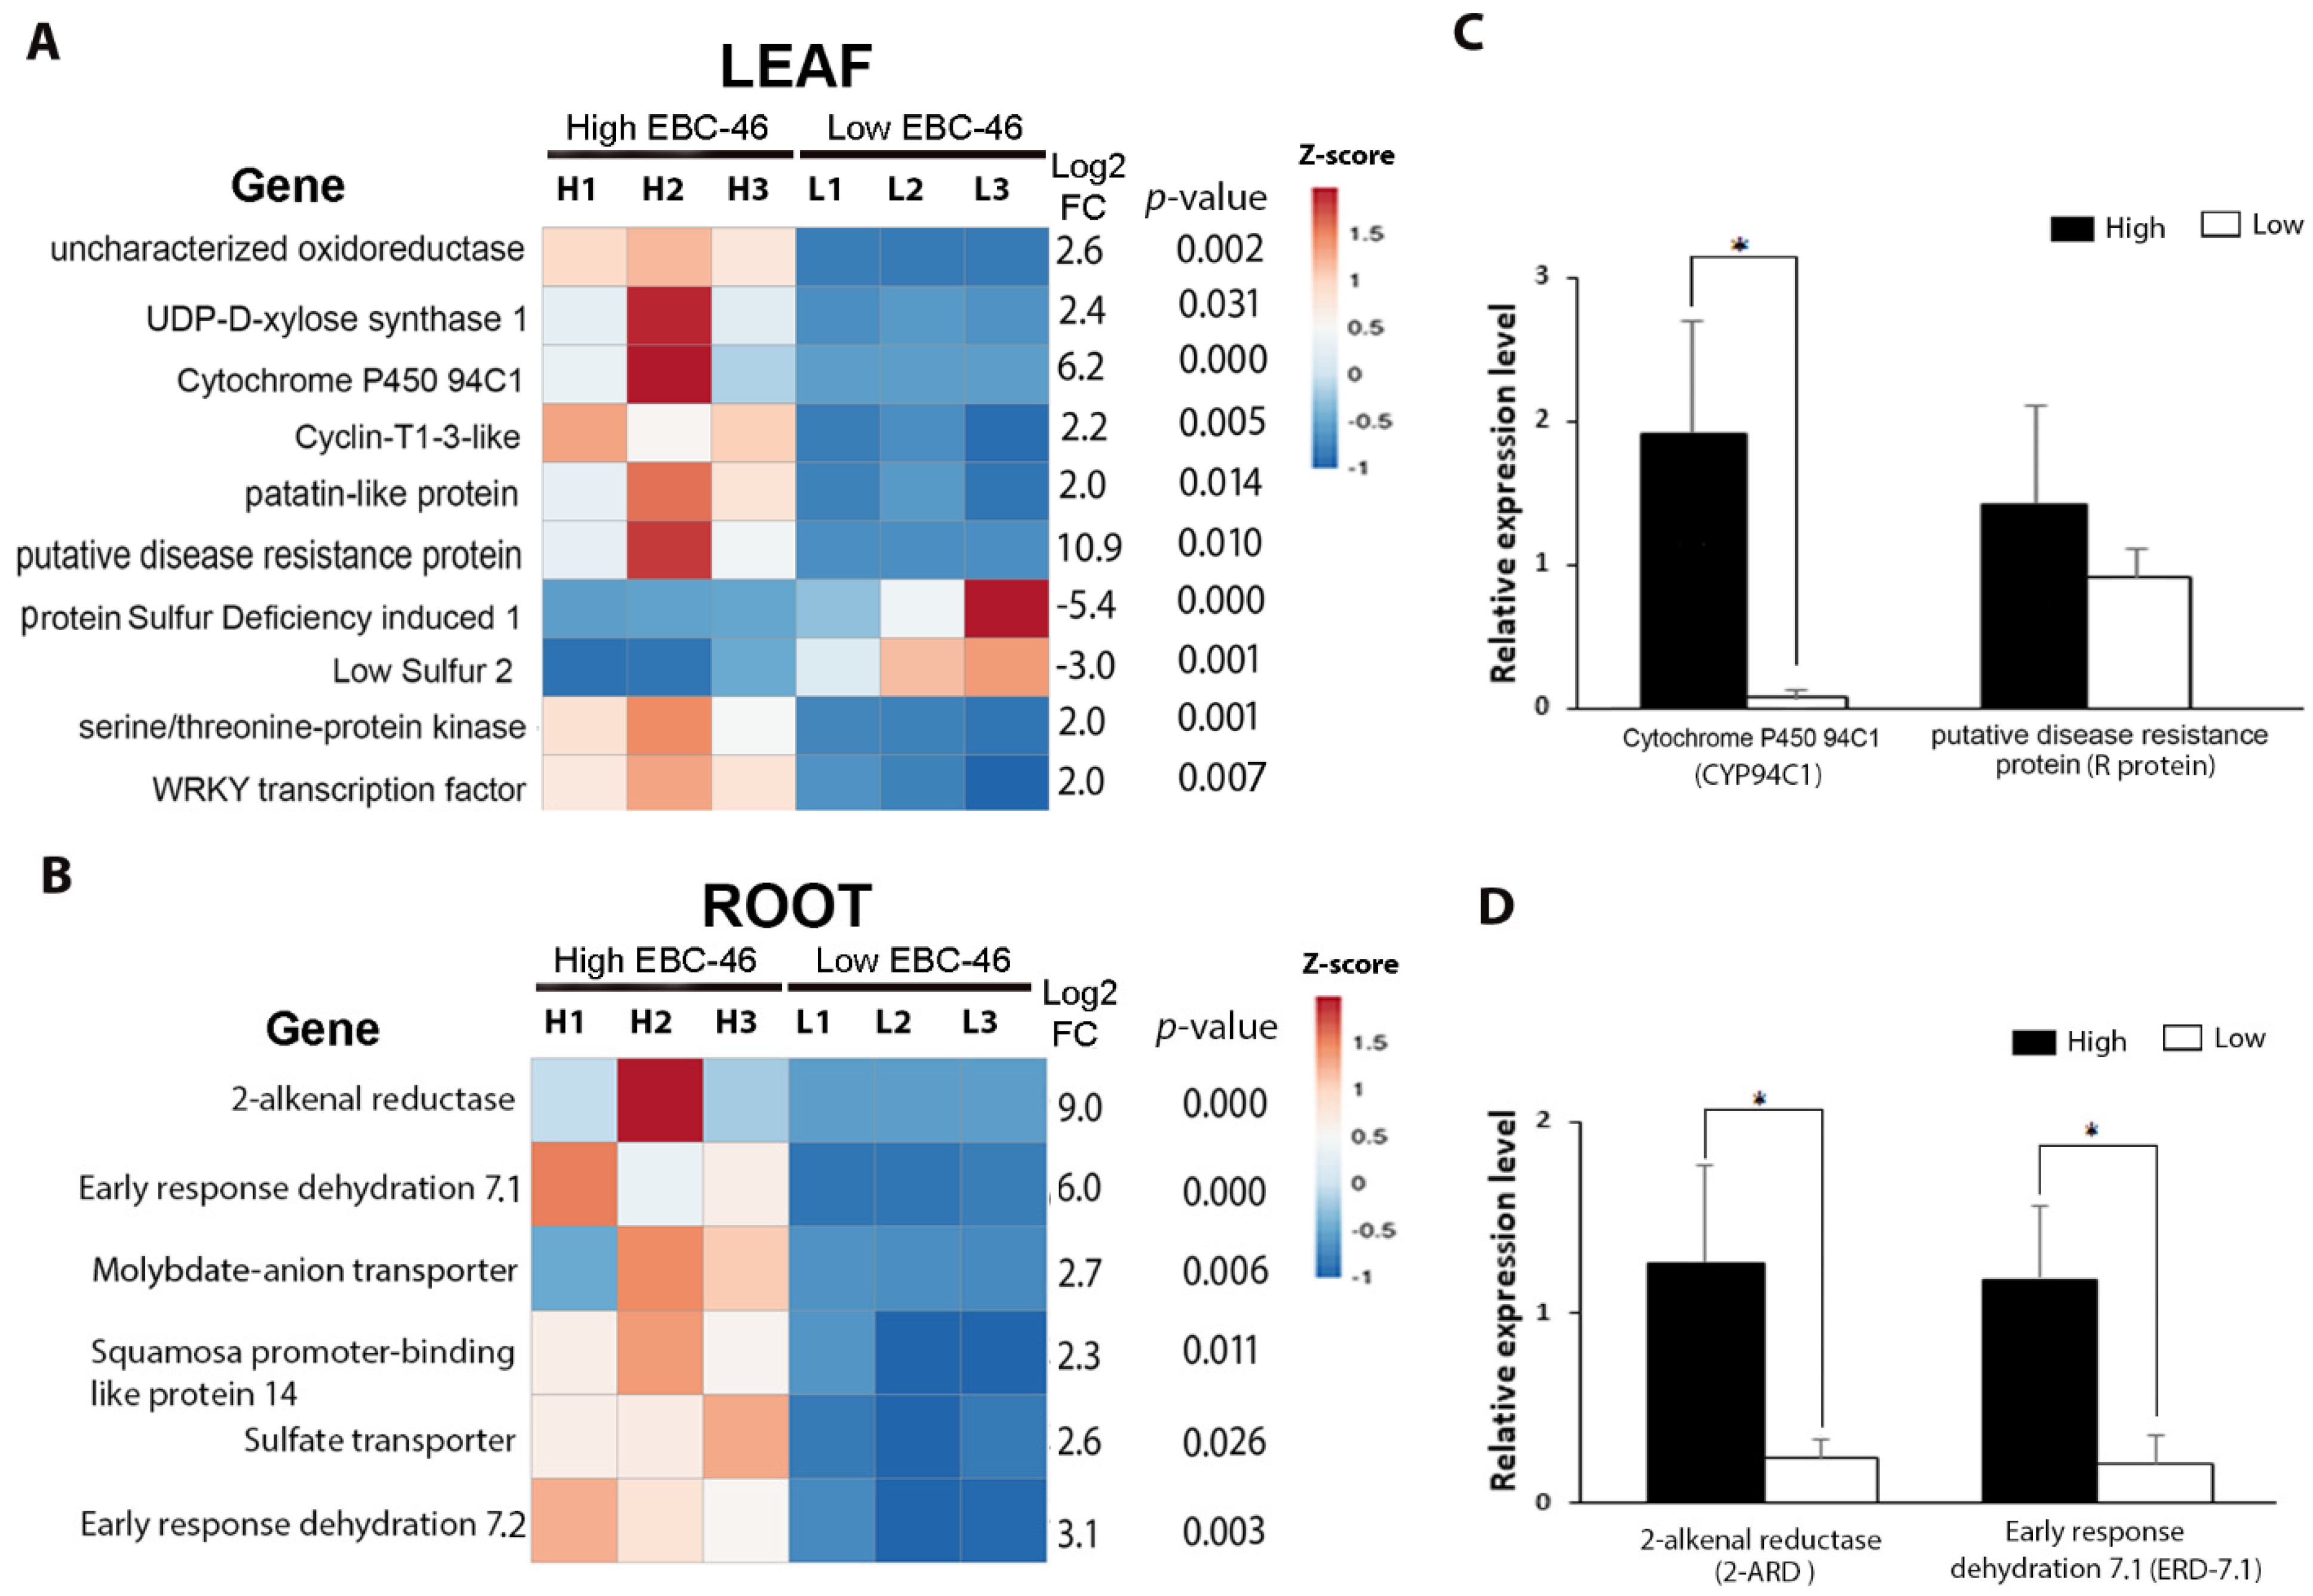
Candidate biomarker genes for high-EBC-46 production were subsequently investigated from the DEG dataset (Supplementary File S2). In leaf tissue, 10 genes were assessed as candidate biomarkers based on the desired parameters. Of these, eight were more highly expressed in HEBC-46 plants, while two were more highly expressed in LEBC-46 plants (Figure 3A). The putative disease-resistance protein (R protein) and cytochrome P450 CYP94C1 (CYP94C1) genes showed the highest relative abundance in HEBC-46 compared to LEBC-46 plants (log2 fold-change = 10.9 and 6.2, respectively). In root tissue, our DEG analysis had identified six genes as candidate biomarkers; all were more highly expressed in HEBC-46 plants (Figure 3B). The 2-alkenal reductase (2-ARD) and early response dehydration 7.1 (ERD-7.1) genes showed the highest relative abundance in HEBC-46 plants (log2 fold-change = 9 and 6, respectively).
To investigate the reliability of results obtained from RNA-seq gene expression, those genes with the highest fold-change difference (CYP94C1, R protein, 2-ARD, and ERD-7.1) were further validated using RT-qPCR on the same plants (Figure 3C,D and Supplementary File S3). The elongation factor1-α (EF1α), protein phosphatase 2 (PP2A), and glyceraldehyde 3-phosphate dehydrogenase (GAPDH) were selected as F. picrosperma endogenous gene-expression reference genes for normalization in RT-qPCR [18,19]. Following analysis, PP2A was identified as the most stable gene in both leaf and root tissue (Supplementary File S4). The results of candidate biomarker gene analysis showed that all genes were highly expressed in HEBC-46 plants compared to LEBC-46-producing plants, with only CYP94C1, ERD-7.1, and 2-ARD being significantly differentially expressed, where coefficient of correlation obtained for the standard curve (R2) were 0.691, 0.614, and 0.5949 accordingly.
3. Discussion
This study has identified potential biomarker genes for F. picrosperma that produce high levels of EBC-46 through metabolite analysis followed by tissue-specific comparative DEG analysis and real-time qPCR validation. The identified DEGs also help to piece together with a potential molecular mechanism for the biosynthesis of EBC-46.
All plants modify their physiology and metabolism in response to external stimuli, such as changes in environmental conditions (e.g., during drought and extreme temperatures) [20], predation, soil nutrient levels, and soil microbial composition [21]. Tissue concentrations of secondary metabolites often vary as a result of these external stimuli. Due to changes in concentrations of natural product, secondary metabolites have previously been reported in medicinally relevant plants, including Picea abies, Quercus robur L [22], and Tanacetum vulgare L. (Asteraceae) [23]. Genes directly involved in their biosynthesis can vary [24], as well as other genes that may not be directly involved in biosynthesis [25]. If the level of gene expression correlates significantly with the tissue concentration of a target secondary metabolite [26], the gene may be a valuable biomarker for selective breeding.
Secondary metabolites often present in only a few tissues, cell types, and organs [12]. In plants, defence metabolites are mostly found in specific tissues or cell types to minimize autotoxicity and/or to maximize the effectiveness of the metabolites [27,28]. In Nicotiana attenuata, for example, 63% of non-redundant metabolite spectra showed that secondary metabolites often have organ- and tissue-specific gene expression [29]. This is the case with EBC-46 in F. picrosperma, where the fruit contain significantly higher concentrations than other tissues. And whilst the function of EBC-46 in F. picrosperma is unclear, it is assumed that it is a deterrent to herbivores, protecting both the fruit and the developing seedling from predation.
RNA-seq DEG analysis was performed on three low- and three high-EBC-46-producing F. picrosperma plants, with the aim of identifying gene biomarkers for high levels of EBC-46 production. Gene expression profiling has been widely used to identify candidate genetic biomarkers. For instance, a large transcriptomic dataset in maize (Zea mays) allowed for the elucidation of 112 biomarker genes to quantitatively assess the response of maize to changes in soil nitrogen [30]. Our DEG analysis revealed a total of 381 genes significantly up-regulated and down-regulated in root and leaf tissue from HEBC-46 plants. Those up-regulated genes were primarily classified into the functional categories of metabolomic processes (in root) and transporter and defence mechanisms (in leaf). In Arabidopsis up-regulated genes are mostly involved in stress tolerance [31], and in wheat, biosynthesis-pathway genes are defined as defence-related molecules [32].
Previous transcriptomic analysis identified the core mevalonate (MVA) and 2-C-methyl-D-erythritol 4-phosphate (MEP) diterpene biosynthesis-pathway enzymes in Fontainea [17]. However, based on the comparative quantitative RNA-seq analysis per formed in this study, no MEP or MVA pathway core enzyme genes nor any diterpenoid unit genes were found to be significantly differentially expressed between low- and high-EBC-46 producing plants. Using the selection criterion of annotation, consistency in expression, p-value < 0.05, and relative abundance in tissues, 16 DEGs were selected in HEBC and LEBC plants. Four genes (CYP94C1, R protein, 2-ARD, and ERD7.1) were further selected for RT-qPCR based on highest log2 fold-change value, and three genes were validated as being significantly differentially expressed: CYP94C1 in leaf tissue and 2-ARD and ERD7.1 in root tissue.
Whilst CYP94C1 is a P450 gene, it has not been directly implicated with diterpenoid biosynthesis. In wheat, CYP94C1 has been associated with defence [33], and in Arabidopsis thaliana, it is found in leaf tissue and plays an important role in controlling flowering [34]. ERD7 has long been known to be related with drought stress [35], and more recently, other stress conditions, such as cold, salt, and excess light, were linked to ERD7 [36]. However, the molecular role of ERD7 is still uncertain. The 2-ARD is known to play an important role in the stress responses in a variety of organisms [37,38], including Arabidopsis, where it is involved in disease resistance [39]. In Jatropha curcas, which also belongs to the Euphorbiaceae family, ARD-like genes encode enzymes that can generate two novel compounds in the diterpenoid biosynthesis pathway [40]. In maize, 2-ARD significantly increased tolerance to low nitrogen stress [41] and plays a role in the detoxification of reactive carbonyls that generate oxidatively stressed cells in tobacco plants [42]. In F. picrosperma, 2-ARD was expressed in the root and almost exclusively in HEBC plants, whereas in Artemisia annua, the expression of 2-ARD is high in flowers, buds, and leaves and is not detectable in roots [43].
Terpenoids are a class of compounds that are close to steroids. Therefore, they are extensively studied in cancer studies [44]. It is unclear how these DEGs influence the production of EBC-46, nonetheless, they provide a molecular tool that could be used to support breeding programs with a focus on agronomic traits [45]. We envisage that these biomarker genes could be used for rapid screening and classification of individual F. picrosperma plants that are high EBC-46 producers. This, in turn, could enable selection and breeding of plant lines that will progressively yield maximal concentrations of EBC-46. Additionally, the aforementioned genes functionally link with stress and defence and support the notion that environmental manipulation, such as changes in temperature, disease, and nutrition, could help drive EBC-46 biosynthesis.
4. Materials and Methods
4.1. Plant Sample Preparation
Healthy, fully expanded leaves and actively growing root tips, including the apical meristem and root caps, were collected from Fontainea picrosperma grown in the University of the Sunshine Coast (Sippy Downs) greenhouse at ambient temperatures (18–24 °C) and relative humidity levels around 80%. Plants were grown in independent pots and kept in the greenhouse at ambient temperatures and humidity, according to Mitu et al. [17]. The harvested plant materials were washed with sterile Milli-Q-filtered water, immediately frozen in liquid nitrogen, and stored at −80 °C until use.
4.2. Quantification of EBC-46
Twelve plants (~2–4 years old) with young, healthy, fully expanded leaves were used. Single leaves from each plant were collected between 9.00–10.00 a.m. once a month over a single year. Dried F. picrosperma leaves (about 30 mg) were placed in 2 mL safe lock Eppendorf tubes, then frozen in liquid nitrogen, and homogenised by tissue lyser at 30 s for 2 min. For each sample, methanol (0.01667 mL × sample weight) was added and extracted in an ultrasonic bath at room temperature for 3 min. The sample was centrifuged at 8000× g for 1 min, and the supernatant was collected for high-performance liquid chromatography (HPLC) analysis. HPLC analyses were performed using an Agilent 1260 system equipped with a diode array detector and the data processed using the Chemstation software (C.01.05). Chromatographic separations were performed with a Halo RP-Amide column (4.6 mm × 150 mm, 2.7 µm) using mobile phases consisting of H2O (0.1% formic acid) (A) and CH3CN (0.1% formic acid) (B) with the following gradient program: 45–58% B from 0 to 13 min, 58–95% B from 13 to 13.5 min, 95% B from 13.5 to 15 min, 95–45% B from 15–15.1 min, and 45% from 15.1 to 18 min. The detection wavelength was set at 249 nm. The flowrate was 1 mL/min, and the column temperature was set at 40 °C. EBC-46 eluted at 7.3 min, as confirmed by comparison with EBC-46 reference standard provided by QBiotics Ltd.
EBC-46 concentration was determined in leaf tissues of six biological replicates. Student’s t-test was used to determine the mean value and statistically significant differences between high and low groups in Microsoft Excel 2016. Values were reported as the mean ± SE from three independent experiments.
4.3. Differential Gene Expression Analysis of Leaf and Root of F. picrosperma
Based on the EBC-46 quantitative analysis, three high and three low EBC-46 producers (HEBC-46 and LEBC-46) were used for RNA sequencing of leaf and root samples (raw reads were deposited into the NCBI, Sequence Read Archive (SRA) database under accession number PRJNA592624). Reads were mapped to the reference F. picrosperma transcriptome assembly, previously reported in Mitu et al. [11], derived from leaf and root RNAs. The number of mapped clean reads for each gene was counted and normalized into transcripts per million (TPM) to calculate the expression level of the gene. Differential expression between HEBC-46 and LEBC-46 samples was established as a log2 fold-change using the CLC Genomics workbench (Ver. 11.0.1) set at default parameters (Supplementary File S5). The differential expression significance cut-off was considered as adjusted log2 fold-change value ±2 between HEBC-46 and LEBC-46 plants and p-value < 0.05.
In total, 16 genes were selected based on annotation, consistency in expression, p-value < 0.05, and relative abundance in leaf tissue. Next, z-scores were generated for significantly differentially expressed genes based on sequencing depth normalized reads counts. Expression of each gene in leaf and root tissue was analysed by normal clustering. Relative expression profiles of significantly DEGs were presented in the form of a heatmap, which was constructed using Clustvis (https://biit.cs.ut.ee/clustvis/ (accessed on 18 February 2022)) [46], using default parameters and a hierarchical clustering analysis to assess biological sample relatedness. Values were reported as z-scores from three different HEBC-46 and LEBC-46 plants of F. picrosperma.
4.4. Reverse Transcription-Quantitative PCR (RT-qPCR)
Approximately 100 mg of leaf and root tissue from 3 HEBC-46 and 3 LEBC-46 F. picrosperma was collected between 9 and 10 a.m. once a month over a year. RNA extraction followed a procedure previously described by Mitu et al. [11]. The RNA integrity was assessed by visualization in 2.0% agarose gels, as well as Nanodrop spectrophotometer 2000c (Thermo Scientific, Waltham, MA, USA) at 260 and 280 nm.
Prior to complementary DNA (cDNA) synthesis, the RNA samples were treated with DNase I reagent kit (Thermo Fisher Scientific) to remove residual genomic DNA. Complementary DNA was then converted from the RNA using the Tetro cDNA synthesis set (Bioline) containing Oligo (dT) primers as well as random primers, and the method directly followed the manufacturer’s instructions. The primer pairs were used to confirm the integrity of RNA and cDNA of all tissue with housekeeping gene elongation factor 1-alpha (EFT-1α). Water was used as a negative control. PCRs were prepared using the GoTaq Green Master Mix (Promega), as per the manufacturer’s instructions. Each reaction used the following parameters: initial denaturation cycle at 95 °C for 5 min, subsequent 35 cycles of 15 s at 95 °C, 15 s at 60 °C as the annealing step, 40 s at 72 °C, and a final single extension cycle at 72 °C for 2 min. PCR products were run on 2% Tris-Borate-EDTA (TBE) agarose gel and then visualised with 0.5ug/mL ethidium bromide in a Gel Doc XR+ system coupled with Image Lab Software. Primer sequences for targeted genes, 2-ARD, ERD-7.1, CYP94C1, and R protein, and reference genes, EF1α, PP2A, and GAPDH, used in this experiment are provided in Supplementary File S6. We first determined the specificity of the designed primer pairs. All PCR products were examined by agarose [1.5% (w/v)] gel electrophoresis. For each primer pair, the appearance of a single band of the expected size on the agarose gel was considered consistent with the primers being specific to the target gene. RT-qPCR were carried out with a Rotor-Gene® Q (Qiagen) using PowerTrack™ SYBR™ Green Master Mix (Applied Biosystems, Massachusetts, United States). Each 10 μL reaction volume contained 1 μL cDNA, 5 μL PowerTrackTM SYBRTM Green Master Mix, 3.2 μL ultrapure water, and 0.4 μL each primer (400 nM). The reaction conditions included an initial denaturation step of 95 °C for 2 min, followed by 40 cycles of 95 °C for 5 s, 55 °C for 15 s, and 72 °C for 15 s. The dissociation curve analysis was obtained by heating the amplicon from 65 to 95 °C. Each RT-qPCR reaction was performed in three technical replicates and four biological replicates. A triplicate of non-template control was also included for each gene. The optimal annealing temperature was determined by running a qPCR at an annealing temperature gradient from 50 to 60 °C.
To obtain high accuracy of expression stability of reference genes, five different statistical algorithms, i.e., ΔCt [47], geNorm [48], BestKeeper [49], NormFinder [50], and RefFinder [51] were used to evaluate expression stability of the reference genes (Supplementary File S2). RefFinder (https://www.heartcure.com.au/reffinder/?type=reference (accessed on 3 March 2022)) was used to integrate the data obtained from ΔCt method, Genorm, BestKeeper, and NormFinder to calculate the recommended comprehensive ranking order [52]. All the software packages were used according to the manufacturer’s instructions.
4.5. Gene Expression and Statistical Analysis
The comparative CT method was used to compare the expression level of each gene [53]. The statistical significance of the differences between EBC-46 concentrations of HEBC-46 and LEBC-46 plants was determined using the Student’s t-test (p ≤ 0.05).
5. Conclusions and Future Directions
This study has resulted in furthering our knowledge of the molecular mechanisms that influenced EBC-46 production in F. picrosperma. We demonstrated that individual F. picrosperma plants can produce significantly different concentrations of EBC-46. This difference in concentration was correlated with significant differences in gene expression in both leaf and root tissues. Genes that potentially play a role in metabolomic processes, transporter mechanisms, and defence mechanisms were significantly upregulated in higher EBC-46-producing plants. Following interrogation of sixteen candidate biomarker genes, we have shown that four genes were significantly more highly expressed in higher EBC-46-producing plants, two of which are more highly expressed in leaf tissue, and two in root tissue, with three genes (CYP94C1, 2-ARD, and ERD7.1) being significantly differentially expressed and, therefore, being potential biomarkers for EBC-46 concentration in F. picrosperma. These results significantly advance our understanding of differentially expressed genes relating to the biosynthesis of EBC-46 in Fontainea and may facilitate the development of selected F. picrosperma lines with increased levels of EBC-46, as well as the identification of EBC-46 biosynthesis pathway genes.
Supplementary Materials
The following supporting information can be downloaded at: https://www.mdpi.com/article/10.3390/molecules27133980/s1, Supplementary File S1: Summary of differentially expressed genes in high- and low-EBC-46-producing Fontainea picrosperma plant’s leaf and root tissues, including (A) GO analysis of leaf tissue, (B) enzyme codes and enzyme names of leaf tissue, (C) GO analysis of root tissue, (D) enzyme codes and enzyme names of root tissue; Supplementary File S2: Expression levels of targeted genes across three different high- and low-EBC-46-producing Fontainea picrosperma plants leaf and root tissue along with nucleotide sequences, fold-change, p-value, and sequence size; Supplementary File S3: EBC-46 concentration and qPCR correlation among six high- and six low-EBC-46-producing plants; Supplementary File S4:. Efficiency of the candidate reference genes for RT-qPCR amplification; Figure S1: Electrophoretic map of RNA extracted from each root sample (A) and leaf sample (B); Figure S2: Primer specificity and amplicon size; Figure S3: Expression level of the candidate reference genes in leaf (A), root (B), and total samples of Blushwood (C); Table S1: Expression stability analysis of reference genes using five different algorithms; Supplementary File S5: Relative gene expression of differentially expressed genes in high- and low-EBC-46-producing Fontainea picrosperma plants across three different plants (leaf and root tissue); Supplementary File S6: Primer details of reference genes and candidate biomarker genes used for RT-qPCR.
Author Contributions
S.A.M. performed the experiments, analysed the data, and prepared the figures and/or tables. P.S. performed qPCR, analysed, the data and prepared the figures. T.D.T. conducted HPLC analysis for EBC-46. S.A.M. wrote the initial draft of the manuscript. The project was conceptualized by S.M.O., P.W.R. and S.F.C. All authors have read and agreed to the published version of the manuscript.
Funding
The authors acknowledge financial support from EcoBiotics Ltd. and the University of the Sunshine Coast.
Institutional Review Board Statement
Not applicable.
Informed Consent Statement
Not applicable.
Data Availability Statement
All data generated or analysed during this study are included in this article.
Acknowledgments
We would like to acknowledge technical assistance from Tracey McMahon and Saowaros Suwansa-ard from the University of the Sunshine Coast. We would also like to acknowledge provision of plant material from EcoBiotics Ltd.
Conflicts of Interest
SMO is a director and shareholder of QBiotics Group Ltd. PWR is a director, employee, and shareholder of EcoBiotics Ltd. and QBiotics Group Ltd. The remaining authors declare that they have no conflict of interest.
References
- Vasas, A.; Hohmann, J. Euphorbia diterpenes: Isolation, structure, biological activity, and synthesis (2008–2012). Chem. Rev. 2014, 114, 8579–8612. [Google Scholar] [CrossRef] [Green Version]
- Evans, F.; Taylor, S. Pro-inflammatory, tumour-promoting and anti-tumour diterpenes of the plant families Euphorbiaceae and Thymelaeaceae. In Fortschritte der Chemie Organischer Naturstoffe/Progress in the Chemistry of Organic Natural Products; Springer: Vienna, Austria, 1983; pp. 1–99. [Google Scholar]
- Schmidt, R.J. The biosynthesis of tigliane and related diterpenoids; an intriguing problem. Bot. J. Linn. Soc. 1987, 94, 221–230. [Google Scholar] [CrossRef]
- Vasas, A.; Redei, D.; Csupor, D.; Molnar, J.; Hohmann, J. Diterpenes from European Euphorbia species serving as prototypes for natural-product-based drug discovery. Eur. J. Org. Chem. 2012, 2012, 5115–5130. [Google Scholar] [CrossRef]
- Jaeger, R.; Cuny, E. Terpenoids with special pharmacological significance: A review. Nat. Prod. Commun. 2016, 11, 1373–1390. [Google Scholar] [CrossRef] [Green Version]
- Chassagne, F.; Cabanac, G.; Hubert, G.; David, B.; Marti, G. The landscape of natural product diversity and their pharmacological relevance from a focus on the Dictionary of Natural Products®. Phytochem. Rev. 2019, 18, 601–622. [Google Scholar] [CrossRef] [Green Version]
- Boyle, G.M.; D’Souza, M.M.; Pierce, C.J.; Adams, R.A.; Cantor, A.S.; Johns, J.P.; Maslovskaya, L.; Gordon, V.A.; Reddell, P.W.; Parsons, P.G. Intra-lesional injection of the novel PKC activator EBC-46 rapidly ablates tumors in mouse models. PLoS ONE 2014, 9, e108887. [Google Scholar] [CrossRef]
- Grant, E.L.; Wallace, H.M.; Brooks, P.R.; Burwell, C.; Reddell, P.W.; Ogbourne, S.M. Floral attraction and flower visitors of a subcanopy, tropical rainforest tree, Fontainea picrosperma. Ecol. Evol. 2021, 11, 10468–10482. [Google Scholar] [CrossRef]
- Jessup, L.; Guymer, G. A revision of Fontainea Heckel (Euphorbiaceae-Cluytieae). Austrobaileya 1985, 2, 112–125. [Google Scholar]
- De Ridder, T.R.; Campbell, J.E.; Burke-Schwarz, C.; Clegg, D.; Elliot, E.L.; Geller, S.; Kozak, W.; Pittenger, S.T.; Pruitt, J.B.; Riehl, J. Randomized controlled clinical study evaluating the efficacy and safety of intratumoral treatment of canine mast cell tumors with tigilanol tiglate (EBC-46). J. Vet. Intern. Med. 2021, 35, 415–429. [Google Scholar] [CrossRef]
- Mitu, S.A.; Ogbourne, S.M.; Klein, A.H.; Tran, T.D.; Reddell, P.W.; Cummins, S.F. The P450 multigene family of Fontainea and insights into diterpenoid synthesis. BMC Plant Biol. 2021, 21, 1–18. [Google Scholar] [CrossRef] [PubMed]
- De Ridder, T.; Ruppin, M.; Wheeless, M.; Williams, S.; Reddell, P. Use of the intratumoural anticancer drug tigilanol tiglate in two horses. Front. Vet. Sci. 2020, 7, 639. [Google Scholar] [CrossRef] [PubMed]
- Miller, J.; Campbell, J.; Blum, A.; Reddell, P.; Gordon, V.; Schmidt, P.; Lowden, S. Dose characterization of the investigational anticancer drug tigilanol tiglate (EBC-46) in the local treatment of canine mast cell tumors. Front. Vet. Sci. 2019, 6, 106. [Google Scholar] [CrossRef] [PubMed] [Green Version]
- Brown, G.K.; Campbell, J.E.; Jones, P.D.; De Ridder, T.R.; Reddell, P.; Johannes, C.M. Intratumoural Treatment of 18 Cytologically Diagnosed Canine High-Grade Mast Cell Tumours with Tigilanol Tiglate. Front. Vet. Sci. 2021, 8, 675804. [Google Scholar] [CrossRef] [PubMed]
- Panizza, B.J.; de Souza, P.; Cooper, A.; Roohullah, A.; Karapetis, C.S.; Lickliter, J.D. Phase I dose-escalation study to determine the safety, tolerability, preliminary efficacy and pharmacokinetics of an intratumoral injection of tigilanol tiglate (EBC-46). eBioMedicine 2019, 50, 433–441. [Google Scholar] [CrossRef] [Green Version]
- Grant, E.L.; Wallace, H.M.; Trueman, S.J.; Reddell, P.W.; Ogbourne, S.M. Floral and reproductive biology of the medicinally significant rainforest tree, Fontainea picrosperma (Euphorbiaceae). Ind. Crops Prod. 2017, 108, 416–422. [Google Scholar] [CrossRef]
- Mitu, S.A.; Cummins, S.F.; Reddell, P.W.; Ogbourne, S.M. Transcriptome analysis of the medicinally significant plant Fontainea picrosperma (Euphorbiaceae) reveals conserved biosynthetic pathways. Fitoterapia 2020, 146, 104680. [Google Scholar] [CrossRef]
- Li, R.; Cui, K.; Xie, Q.; Xie, S.; Chen, X.; Zhuo, L.; Cao, A.; Shen, H.; Jin, X.; Wang, F. Selection of the reference genes for quantitative gene expression by RT-qPCR in the desert plant Stipagrostis pennata. Sci. Rep. 2021, 11, 1–11. [Google Scholar] [CrossRef]
- Karuppaiya, P.; Yan, X.-X.; Liao, W.; Wu, J.; Chen, F.; Tang, L. Identification and validation of superior reference gene for gene expression normalization via RT-qPCR in staminate and pistillate flowers of Jatropha curcas–A biodiesel plant. PLoS ONE 2017, 12, e0172460. [Google Scholar]
- Schiop, S.T.; Al Hassan, M.; Sestras, A.F.; Boscaiu, M.; Sestras, R.E.; Vicente, O. Identification of Salt Stress Biomarkers in Romanian Carpathian Populations of Picea abies (L.) Karst. PLoS ONE 2015, 10, e0135419. [Google Scholar] [CrossRef] [Green Version]
- Marchand, G.; Mayjonade, B.; Vares, D.; Blanchet, N.; Boniface, M.C.; Maury, P.; Andrianasolo, F.N.; Burger, P.; Debaeke, P.; Casadebaig, P. A biomarker based on gene expression indicates plant water status in controlled and natural environments. Plant Cell Environ. Chem. Lett. 2013, 36, 2175–2189. [Google Scholar] [CrossRef]
- Matzke, K.; Riederer, M. A comparative study into the chemical constitution of cutins and suberins from Picea abies (L.) Karst, Quercus robur L. and Fagus sylvatica L. Planta 1991, 185, 233–245. [Google Scholar] [CrossRef] [PubMed]
- Benedek, K.; Bálint, J.; Máthé, I.; Mara, G.; Felföldi, T.; Szabó, A.; Fazakas, C.; Albert, C.; Buchkowski, R.W.; Schmitz, O.J. Linking intraspecific variation in plant chemical defence with arthropod and soil bacterial community structure and N allocation. Plant Soil 2019, 444, 383–397. [Google Scholar] [CrossRef] [Green Version]
- Staniek, A.; Bouwmeester, H.; Fraser, P.D.; Kayser, O.; Martens, S.; Tissier, A.; Van Der Krol, S.; Wessjohann, L.; Warzecha, H. Natural products–modifying metabolite pathways in plants. Biotechnol. J. 2013, 8, 1159–1171. [Google Scholar] [CrossRef] [PubMed]
- Delli-Ponti, R.; Shivhare, D.; Mutwil, M. Using Gene Expression to Study Specialized Metabolism—A Practical Guide. Front. Plant Sci. 2021, 11, 625035. [Google Scholar] [CrossRef]
- Steinfath, M.; Strehmel, N.; Peters, R.; Schauer, N.; Groth, D.; Hummel, J.; Steup, M.; Selbig, J.; Kopka, J.; Geigenberger, P. Discovering plant metabolic biomarkers for phenotype prediction using an untargeted approach. Plant Biotechnol. J. 2010, 8, 900–911. [Google Scholar] [CrossRef]
- Schilmiller, A.L.; Miner, D.P.; Larson, M.; McDowell, E.; Gang, D.R.; Wilkerson, C.; Last, R.L. Studies of a biochemical factory: Tomato trichome deep expressed sequence tag sequencing and proteomics. Plant Physiol. 2010, 153, 1212–1223. [Google Scholar] [CrossRef] [Green Version]
- Tissier, A. Glandular trichomes: What comes after expressed sequence tags? Plant J. 2012, 70, 51–68. [Google Scholar] [CrossRef]
- Li, D.; Heiling, S.; Baldwin, I.T.; Gaquerel, E. Illuminating a plant’s tissue-specific metabolic diversity using computational metabolomics and information theory. Proc. Natl. Acad. Sci. USA 2016, 113, E7610–E7618. [Google Scholar] [CrossRef] [Green Version]
- Yang, X.S.; Wu, J.; Ziegler, T.E.; Yang, X.; Zayed, A.; Rajani, M.; Zhou, D.; Basra, A.S.; Schachtman, D.P.; Peng, M. Gene expression biomarkers provide sensitive indicators of in planta nitrogen status in maize. Plant Physiol. 2011, 157, 1841–1852. [Google Scholar] [CrossRef] [Green Version]
- Nair, P.; Kandasamy, S.; Zhang, J.; Ji, X.; Kirby, C.; Benkel, B.; Hodges, M.D.; Critchley, A.T.; Hiltz, D.; Prithiviraj, B. Transcriptional and metabolomic analysis of Ascophyllum nodosum mediated freezing tolerance in Arabidopsis thaliana. BMC Genom. 2012, 13, 1–23. [Google Scholar] [CrossRef] [Green Version]
- Polturak, G.; Dippe, M.; Stephenson, M.J.; Chandra Misra, R.; Owen, C.; Ramirez-Gonzalez, R.H.; Haidoulis, J.F.; Schoonbeek, H.-J.; Chartrain, L.; Borrill, P. Pathogen-induced biosynthetic pathways encode defense-related molecules in bread wheat. Proc. Natl. Acad. Sci. USA 2022, 119, e2123299119. [Google Scholar] [CrossRef] [PubMed]
- Shukla, A.; Kaur, M.; Kanwar, S.; Kaur, G.; Sharma, S.; Ganguli, S.; Kumari, V.; Mazumder, K.; Pandey, P.; Rouached, H. Wheat inositol pyrophosphate kinase TaVIH2-3B modulates cell-wall composition and drought tolerance in Arabidopsis. BMC Biol. 2021, 19, 1–23. [Google Scholar] [CrossRef]
- Bruckhoff, V.; Haroth, S.; Feussner, K.; König, S.; Brodhun, F.; Feussner, I. Functional characterization of CYP94-genes and identification of a novel jasmonate catabolite in flowers. PLoS ONE 2016, 11, e0159875. [Google Scholar] [CrossRef] [Green Version]
- Kiyosue, T.; Yamaguchi-Shinozaki, K.; Shinozaki, K. Cloning of cDNAs for genes that are early-responsive to dehydration stress (ERDs) in Arabidopsis thaliana L.: Identification of three ERDs as HSP cognate genes. Plant Mol. Biol. 1994, 25, 791–798. [Google Scholar] [CrossRef] [PubMed]
- Barajas-Lopez, J.d.D.; Tiwari, A.; Zarza, X.; Shaw, M.W.; Pascual, J.; Punkkinen, M.; Bakowska, J.C.; Munnik, T.; Fujii, H. EARLY RESPONSE TO DEHYDRATION 7 remodels cell membrane lipid composition during cold stress in Arabidopsis. Plant Cell Physiol. 2021, 62, 80–91. [Google Scholar] [CrossRef]
- Esterbauer, H.; Schaur, R.J.; Zollner, H. Chemistry and biochemistry of 4-hydroxynonenal, malonaldehyde and related aldehydes. Free Radic. Biol. Med. 1991, 11, 81–128. [Google Scholar] [CrossRef]
- Comportl, M. Lipid peroxidation and biogenic aldehydes: From the identification of 4-hydroxynonenal to further achievements in biopathology. Free Radic. Res. 1998, 28, 623–635. [Google Scholar] [CrossRef] [PubMed]
- Takemoto, D.; Rafiqi, M.; Hurley, U.; Lawrence, G.J.; Bernoux, M.; Hardham, A.R.; Ellis, J.G.; Dodds, P.N.; Jones, D.A. N-terminal motifs in some plant disease resistance proteins function in membrane attachment and contribute to disease resistance. Mol. Plant-Microbe Interact. 2012, 25, 379–392. [Google Scholar] [CrossRef] [Green Version]
- Forestier, E.C.; Czechowski, T.; Cording, A.C.; Gilday, A.D.; King, A.J.; Brown, G.D.; Graham, I.A. Developing a Nicotiana benthamiana transgenic platform for high-value diterpene production and candidate gene evaluation. Plant Biotechnol. J. 2021, 19, 1614–1623. [Google Scholar] [CrossRef]
- Wang, Y.; Zhao, Y.; Wang, S.; Liu, J.; Wang, X.; Han, Y.; Liu, F. Up-regulated 2-alkenal reductase expression improves low-nitrogen tolerance in maize by alleviating oxidative stress. Plant Cell Environ. Chem. Lett. 2021, 44, 559–573. [Google Scholar] [CrossRef]
- Mano, J.i.; Belles-Boix, E.; Babiychuk, E.; Inzé, D.; Torii, Y.; Hiraoka, E.; Takimoto, K.; Slooten, L.; Asada, K.; Kushnir, S. Protection against photooxidative injury of tobacco leaves by 2-alkenal reductase. Detoxication of lipid peroxide-derived reactive carbonyls. Plant Physiol. 2005, 139, 1773–1783. [Google Scholar] [CrossRef] [PubMed] [Green Version]
- Zhang, Y.; Teoh, K.H.; Reed, D.W.; Covello, P.S. Molecular cloning and characterization of Dbr1, a 2-alkenal reductase from Artemisia annua. Botany 2009, 87, 643–649. [Google Scholar] [CrossRef]
- Yang, H.; Ping Dou, Q. Targeting apoptosis pathway with natural terpenoids: Implications for treatment of breast and prostate cancer. Curr. Drug Targets 2010, 11, 733–744. [Google Scholar] [CrossRef] [Green Version]
- Collard, B.C.; Mackill, D.J. Marker-assisted selection: An approach for precision plant breeding in the twenty-first century. Philos. Trans. R. Soc. B Biol. Sci. 2008, 363, 557–572. [Google Scholar] [CrossRef] [Green Version]
- Metsalu, T.; Vilo, J. ClustVis: A web tool for visualizing clustering of multivariate data using Principal Component Analysis and heatmap. Nucleic Acids Res. 2015, 43, W566–W570. [Google Scholar] [CrossRef]
- Silver, N.; Best, S.; Jiang, J.; Thein, S.L. Selection of housekeeping genes for gene expression studies in human reticulocytes using real-time PCR. BMC Mol. Biol. 2006, 7, 1–9. [Google Scholar] [CrossRef] [Green Version]
- Vandesompele, J.; De Preter, K.; Pattyn, F.; Poppe, B.; Van Roy, N.; De Paepe, A.; Speleman, F. Accurate normalization of real-time quantitative RT-PCR data by geometric averaging of multiple internal control genes. Genome Biol. 2002, 3, 1–12. [Google Scholar] [CrossRef] [Green Version]
- Pfaffl, M.W.; Tichopad, A.; Prgomet, C.; Neuvians, T.P. Determination of stable housekeeping genes, differentially regulated target genes and sample integrity: BestKeeper–Excel-based tool using pair-wise correlations. Biotechnol. Lett. 2004, 26, 509–515. [Google Scholar] [CrossRef]
- Andersen, C.L.; Jensen, J.L.; Ørntoft, T.F. Normalization of real-time quantitative reverse transcription-PCR data: A model-based variance estimation approach to identify genes suited for normalization, applied to bladder and colon cancer data sets. Cancer Res. 2004, 64, 5245–5250. [Google Scholar] [CrossRef] [Green Version]
- Xie, F.; Xiao, P.; Chen, D.; Xu, L.; Zhang, B. miRDeepFinder: A miRNA analysis tool for deep sequencing of plant small RNAs. Plant Mol. Biol. 2012, 80, 75–84. [Google Scholar] [CrossRef]
- Lawrence, J.; Nho, R. The role of the mammalian target of rapamycin (mTOR) in pulmonary fibrosis. Int. J. Mol. Sci. 2018, 19, 778. [Google Scholar] [CrossRef] [PubMed] [Green Version]
- Ratel, D.; Ravanat, J.L.; Berger, F.; Wion, D. N6-methyladenine: The other methylated base of DNA. Bioessays 2006, 28, 309–315. [Google Scholar] [CrossRef] [Green Version]
Figure 1.
EBC-46 concentration in leaves of 12 different Fontainea picrosperma plants. (A) HPLC chromatograms at 249nm mAU of (i) EBC-46 analytical standard at 0.1 mg/mL (retention time at 7.496 min), (ii) leaf extract from an example high-EBC-46-producing F. picrosperma plant, and (iii) leaf extract from an example low-EBC46-producing F. picrosperma plant. (B) Average EBC-46 concentration in 12 Fontainea picrosperma plants over one year. Arrowheads indicate plants that were selected for differential gene expression analysis. Error bars represent standard error between monthly analyses. L1-5, low-EBC-46-producing plants; H1-7, high-EBC-46-producing plants. The concentration of EBC-46 in leaves of each high-EBC-46-producing plant (H1-7) was statistically and significantly different than in leaves of each low-EBC-46-producing plant (L1-5).

Figure 2.
Identification of differentially expressed genes in leaf and root tissue from high- and low-EBC-46-producing F. picrosperma plants. (A) Volcano plots showing differentially expressed genes. Adjusted p-value < 0.05. Red colour represents significantly (+2) upregulated and green colour represents significantly (−2) downregulated genes. (B) Venn diagram showing the total number of significantly differentially expressed upregulated (Up) and downregulated (Down) genes in leaf and root tissue, as well as shared genes.

Figure 3.
Validation of differentially expressed genes. Heatmaps showing RNA-seq relative gene expression, log2 fold-change, and p-value for HEBC-46 and LEBC-46 F. picrosperma in (A) leaf tissue and (B) root tissue. Four genes were further analysed by RT-qPCR in (C) leaf tissue and (D) root tissue. * represents statistically significant differences (p < 0.05).

Publisher’s Note: MDPI stays neutral with regard to jurisdictional claims in published maps and institutional affiliations. |
© 2022 by the authors. Licensee MDPI, Basel, Switzerland. This article is an open access article distributed under the terms and conditions of the Creative Commons Attribution (CC BY) license (https://creativecommons.org/licenses/by/4.0/).
Share and Cite
MDPI and ACS Style
Mitu, S.A.; Stewart, P.; Tran, T.D.; Reddell, P.W.; Cummins, S.F.; Ogbourne, S.M. Identification of Gene Biomarkers for Tigilanol Tiglate Content in Fontainea picrosperma. Molecules 2022, 27, 3980. https://doi.org/10.3390/molecules27133980
AMA Style
Mitu SA, Stewart P, Tran TD, Reddell PW, Cummins SF, Ogbourne SM. Identification of Gene Biomarkers for Tigilanol Tiglate Content in Fontainea picrosperma. Molecules. 2022; 27(13):3980. https://doi.org/10.3390/molecules27133980
Chicago/Turabian StyleMitu, Shahida A, Praphaporn Stewart, Trong D Tran, Paul W Reddell, Scott F Cummins, and Steven M. Ogbourne. 2022. "Identification of Gene Biomarkers for Tigilanol Tiglate Content in Fontainea picrosperma" Molecules 27, no. 13: 3980. https://doi.org/10.3390/molecules27133980