Review

Comparative Evaluation of Various Total Antioxidant Capacity Assays Applied to Phenolic Compounds with the CUPRAC Assay

1
Istanbul University, Faculty of Engineering, Department of Chemistry, Avcilar, Istanbul 34320 Turkey
2
Istanbul Technical University, Faculty of Arts & Sciences, Department of Chemistry, Maslak, Istanbul Turkey
*
Author to whom correspondence should be addressed.
Molecules 2007, 12(7), 1496-1547; https://doi.org/10.3390/12071496
Submission received: 30 June 2007 / Revised: 17 July 2007 / Accepted: 18 July 2007 / Published: 19 July 2007
(This article belongs to the Special Issue Phenolics and Polyphenolics)

Abstract

:
It would be desirable to establish and standardize methods that can measure the total antioxidant capacity level directly from vegetable extracts containing phenolics. Antioxidant capacity assays may be broadly classified as electron transfer (ET)− and hydrogen atom transfer (HAT)−based assays. The majority of HAT assays are kinetics-based, and involve a competitive reaction scheme in which antioxidant and substrate compete for peroxyl radicals thermally generated through the decomposition of azo compounds. ET−based assays measure the capacity of an antioxidant in the reduction of an oxidant, which changes colour when reduced. ET assays include the ABTS/TEAC, CUPRAC, DPPH, Folin-Ciocalteu and FRAP methods, each using different chromogenic redox reagents with different standard potentials. This review intends to offer a critical evaluation of existing antioxidant assays applied to phenolics, and reports the development by our research group of a simple and low-cost antioxidant capacity assay for dietary polyphenols, vitamins C and E, and human serum antioxidants, utilizing the copper(II)-neocuproine reagent as the chromogenic oxidizing agent, which we haved named the CUPRAC (cupric ion reducing antioxidant capacity) method. This method offers distinct advantages over other ET−based assays, namely the selection of working pH at physiological pH (as opposed to the Folin and FRAP methods, which work at alkaline and acidic pHs, respectively), applicability to both hydrophilic and lipophilic antioxidants (unlike Folin and DPPH), completion of the redox reactions for most common flavonoids (unlike FRAP), selective oxidation of antioxidant compounds without affecting sugars and citric acid commonly contained in foodstuffs and the capability to assay –SH bearing antioxidants (unlike FRAP). Other similar ET–based antioxidant assays that we have developed or modified for phenolics are the Fe(III)− and Ce(IV)−reducing capacity methods.

Introduction

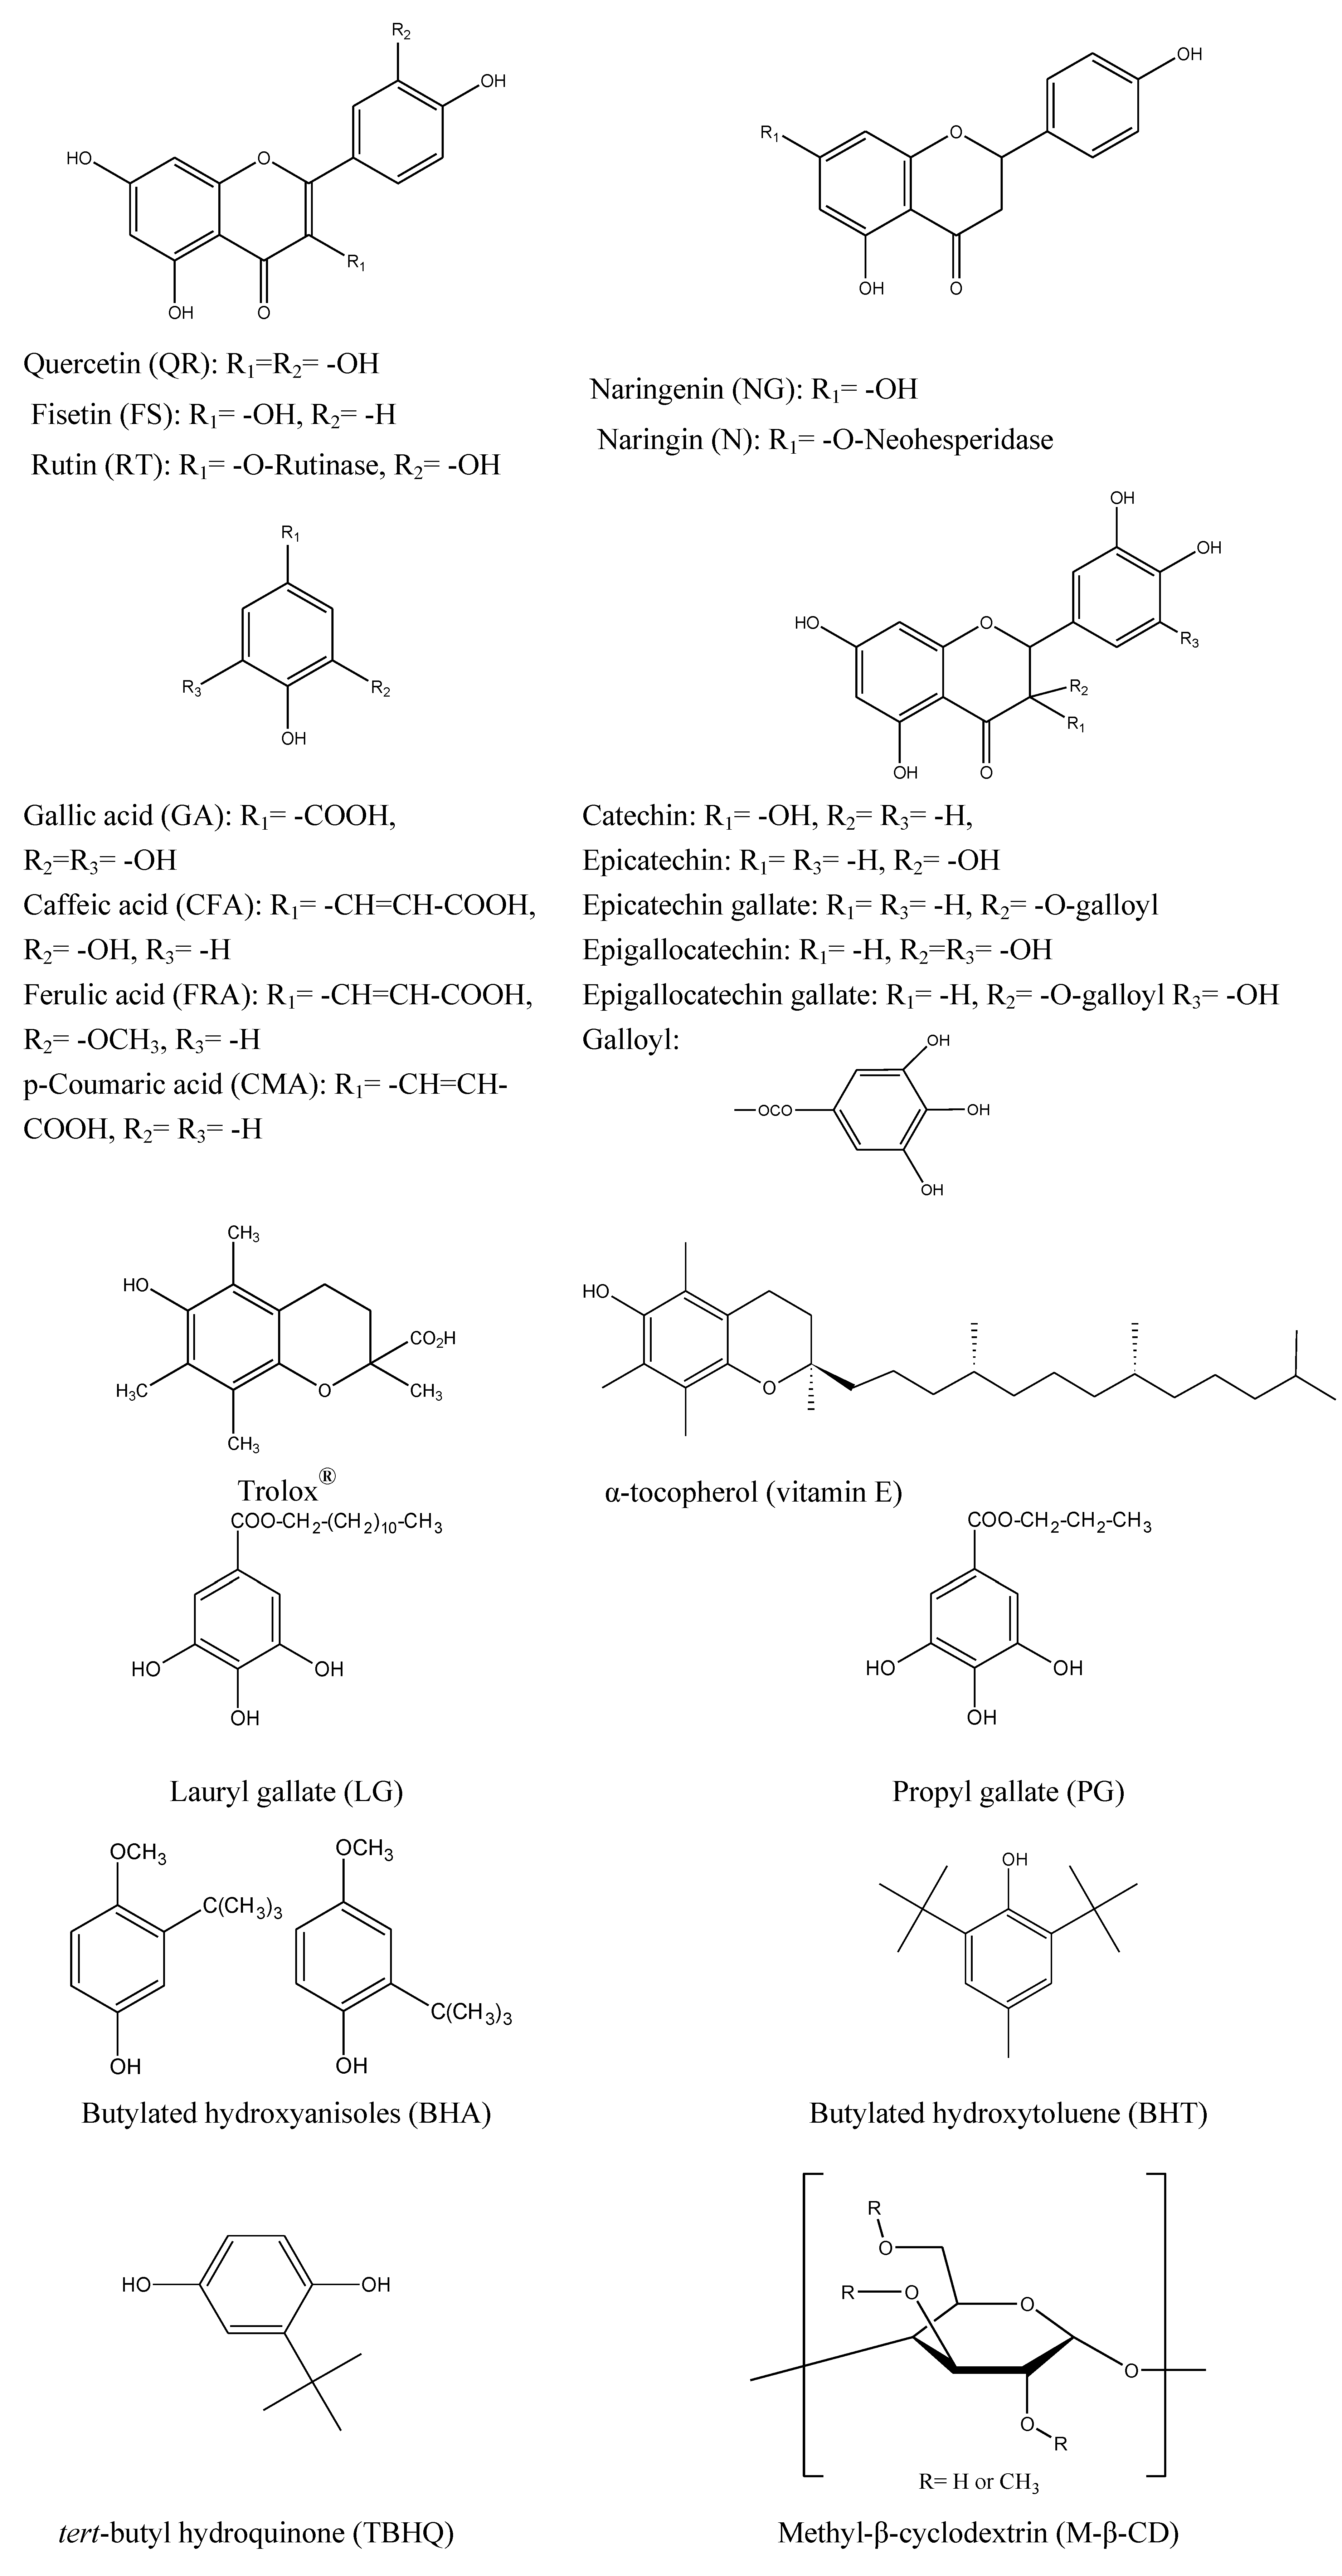
Classification and properties of phenolic compounds

Plant polyphenols are aromatic hydroxylated compounds, commonly found in vegetables, fruits and many food sources that form a significant portion of our diet, and which are among the most potent and therapeutically useful bioactive substances. Phenolic derivatives represent the largest group known as ‘secondary plant products’ synthesized by higher plants, probably as a result of antioxidative strategies adapted in evolution by respirative organisms starting from precursors of cyanobacteria. Many of these phenolic compounds are essential to plant life, e.g., by providing defense against microbial attacks and by making food unpalatable to herbivorous predators [1]. Although a precise chemical definition may be given for plant phenolics, it would inevitably include other structurally similar compounds such as the terpenoid sex hormones. Therefore, an operational definition of metabolic origin is preferable, and thus the plant phenols being regarded as those substances derived from the shikimate pathway and phenylpropanoid metabolism, following the phosphoenolpyruvate → phenylalanine → cinnamate → 4-coumarate course, leading to chalcone, flavanone, dihydroflavonol, and anthocyanin [2]. Significant antioxidant, antitumoral, antiviral and antibiotic activities are frequently reported for plant phenols. They have often been identified as active principles of numerous folk herbal medicines. In recent years, the regular intake of fruits and vegetables has been highly recommended, because the plant phenols and polyphenols they contain are thought to play important roles in long term health and reduction in the risk of chronic and degenerative diseases. Recognition of the benefits brought by these natural products to human health has encouraged the inclusion in everyday diets of some typical plant-derived food and beverages, among the most preferred examples being olive and vegetable oils, citrus and other fruit juices, chocolate, tea, coffee and wine.
Over eight thousand naturally occurring phenolic compounds are known [3]. These substances contain at least one aromatic ring with one or more attached –OH groups, in addition to other substituents [1], and can be divided into 15 major structural classes [4]. Major classes of plant phenolics with ‘the type of carbon skeleton, class name (example)’ format include: C6, simple phenols (resorcinol); C6-C1, phenolic acids (p-hydroxybenzoic acid); C6-C2, acetophenones and phenylacetic acids; C6-C3, hydroxycinnamic acids (caffeic acid); C6-C4, hydroxyanthraquinones (physcion); C6-C2-C6, stilbenes (resveratrol); C6-C3-C6, flavonoids (quercetin); (C6-C3)2, lignans (matairesinol); (C6-C3-C6)2, biflavonoids (agathisflavone); (C6-C3)n, lignins; (C6-C3-C6)n, condensed tannins (procyanidin) [2]. Tannins are considered to be polyphenolic metabolites of plants with a molecular weight larger than 500 and with the ability to precipitate gelatin and other proteins from solution [5], and to give typical phenol reactions such as forming a blue colour with FeCl3 [6]. Tannins may be subdivided into hydrolyzable and condensed tannins; the former are esters of gallic acid (gallo- and ellagi-tannins) while the latter are polyhydroxyflavan-3-ols, also known as proanthocyanidins [7]. Bennic [1] defines hydrolyzable tannins consisting of a polyhydric alcohol, such as glucose, to which gallic acid or its dimer hexahydrodiphenic acid are linked in ester linkages, whereas the condensed tannins contain the monomeric unit of a flavan-3-ol such as catechin or epicatechin that is linked through C-C bonds. Basic plant phenolic structures with examples are shown in Figure 1. A number of selected food plants harvested in different geographical locations of Turkey, with their speciation of major antioxidant phenolics and the method of analysis, are summarized in Table 1.
Figure 1. Basic plant phenolic structures with examples.
Molecules 12 01496 g001
Table 1. A number of selected food plants harvested in different geographical locations of Turkey, with their major speciation of antioxidant phenolics and the method of analysis.
Family and species nameLocal nameLocalityMajor phenolics containedAnalysis methodTherapeutic useRef
Herbs
(Asteraceae)
Achillea biebersteinii
Afan.
SarıçiçekKayseri SivasQuercetagitrin, QuercimeritrinUV, MS, PMR, IR and hydrolytic methodsFor abdominal pain, stomach ache[13]
(Asteraceae) Cichorium intybus L.Yabani Hindiba
(Common
chicory)
NiğdeDimalonyldelphin, Unknown Flavone CopigmentDPPH method (Radical scavenging activity), inhibition of hydrogen peroxide (H2O2), Fe2+chelating activityTo expel kidney stones; decoction, as tea[14]
(Asteraceae) Gundelia tournefortii L. var. tournefortiiKenger
(acanthus)
KayseriGallic Acid, QuercetinFolin-Ciocalteu methodFor removing water in spleen and thirst[15]
(Brassicaceae) Nasturtium officinale R. Br.Gerdemeotu (watercress)KonyaQuercetin, KaempferolHPLC-MSFor abdominal pain; chewed[16]
(Hypericaceae) Hypericum perforatum L.Kantoron
(common
St. John's wort)
NiğdeHyperforin, Adhyperforin, Hypericin, Protohypericin, Phenolic Acids, Neochlorogenic Acid, Chlorogenic Acid, Rutin, Isoquercitrin, Quercetin 3-Glucuronate, Hyperoside-Acetyl, Kaempferol 3-Rutinoside, Quercetin, Kaempferol, BiapigeninHPLC–MS–MSFor wound healing; stomach ache[17]
(Lamiaceae) Salvia officinalis L.Adaçay
(sage tea)
KayseriGallic Acid,
Caffeic Acid, Rosmarinic Acid, Hesperetin, Hispidulin, Carnosol, Carnosic Acid, Phenolic Acids, Flavonoids
HPLC-DADFor common cold, abdominal pain; decoction, as tea[18]
(Lamiaceae) Satureai cuneifolia Ten.Kekik
(thyme)
NiğdeCaffeic Acid, Luteolin-7-O-Glucoside, Rosmarinic Acid, ApigeninFolin-Ciocalteu method HPLCFor common cold, abdominal pain; infusion, as tea[18]
(Lamiaceae) Origonum onites L.Mercanköşk (marjoram)Muğla Manisa Mersin AdanaCaffeic Acid, Rosmarinic Acid, Apigenin, Hydroxybenzoic Acid Derivatives, Hydroxycinamic Acid Derivatives1,1-Diphenyl-2-picrylhydrazyl (DPPH)Radical Scavenging,
Folin-Ciocalteu method
For stomach, bowels and gallbladder aches[18,19]
(Lamiaceae) Teucrium polium L.Kokar Yavşan (polymountain)KaramanFlavonoidsFolin-Ciocalteu method HPLCFor common cold, antipyretic; decoction, as tea[20]
(Lamiaceae) Teucrium chamaedrys L.Kısa mahmut
(common germander)
NiğdeGallic acidFolin-Ciocalteu method,For stomach aches; infusion, as tea[21]
(Linaceae) Linum usitatissimum L.Zeyrek/keten tohumu
(flax seed)
NiğdeCaffeic Acid, P-Coumaric Acid, Chlorogenic Acid, Ferulic AcidHPLCFor abscesses; pounded seeds are mixed with yoghurt and applied on the abscess[22]
(Loranthaceae) Viscum album L. ssp. AlbumGüvelek otu/ ökseotu (mistletoe)NiğdeFlavanonDPPH radical methodFor diarrhoea and prostatitis; decoction, as tea[23]
(Loranthaceae) Malva neglecta Wallr.Ebegümeci
(mallow)
KayseriPropyl gallateFolin-Ciocalteu methodFor pain in mouth; fresh leaves are eaten[24]
(Urticaceae)
Urtica dioicia L.
Isırganotu
(nettle)
Kayseri
Niğde
Ankara
Quercetin, Kaempferol, PyrocatecholFolin-Ciocalteu methodAs panacea; decoction is taken every morning before breakfast or eaten fresh[24,25]
Fruitsi
(Anacardiaceae) Rhus coriaria L.Sumak (sumac)Kayseri
Sivas
Tannins, Fustin, Fisetin, Sulfuretin, Butein, Quercitrin, MyricetinFolin-Ciocalteu methodFor diarrhoea; powdered fruits or ‘sumach’ are sprinkled on boiled egg and ingested[26]
(Caprifoliaceae) Viburnum opulus L.Gilaburu
(European cranberrybush)
KayseriChlorogenic Acid, (+)-Catechin, Epicatechin, Cyanidin-3-Glucoside, Cyanidin-3-Rutinoside, QuercetinFolin-Ciocalteu method HPLCTo expel kidney stones; juice obtained by squeezing is taken orally[27]
(Cucurbitaceae) Cucurbita pepo L.Kestane Kabağı (squash summer)AnkaraFlavonols, Gallic AcidFolin–Ciocalteu methodFor sore throat, bronchitis; grated and boiled in milk or water and while warm, applied externally on neck[28]
(Cucurbitaceae) Citrullus lanatusMatsum. and NakaiKarpuz (watermelon)AnkaraFlavonolsHPLCFor wounds, dried pericarp is burned and ash is spread on wounds[28a]
(Juglandaceae) Juglans regia L.Ceviz (hickory)NiğdeEllagitanninsFolin-Ciocalteu method HPLCFor stomach ache; small fruits are swallowed as pills[29]
(Moraceae)
Morus nigra L.
Karadut (black mulberry)Ankara
İstanbul
Quercetin, Rutin, Isoquercitrin, Chlorogenic AcidHPLC,
Capillary electrophoresis
For canker; fruit juice is used as gargle[30]
(Punicaceae)
Punica granatum L.
Nar (pomegranate)NiğdeGallic Acid, Protocatechuic Acid, P-Hydroxybenzoic Acid, Vanillic Acid, Caffeic Acid, p-Coumaric Acid, Ferulic AcidHPLC-MS
TRAP method
For diarrhoea; dried rind of the fruit is ingested[31]
(Rosaceae) Armeniaca vulgaris Lam.Zerdali / kayısı (apricot)AnkaraHydroxycinnamic Acid and Derivatives, Quercetin, Kaempferol, Apigenin, Catechin, EpicatechinHPLCFor bruises; ointment prepared with ash of the seeds and butter is applied on affected parts[32]
(Rosaceae)
Cydonia oblonga Miller
Ayva
(quince)
AnkaraHydroxycinnamic Acid and Derivatives, Catechin, EpicatechinFolin-Ciocalteu method HPLC-MSFor cystitis; fruit is cooked in embers and applied externally on vagina[33]
(Rosaceae)
Malus sylvestris Miller ssp.
Elma (apple)AnkaraAnthocyanins, Catechin, Epicatechin, FlavonolsFolin-Ciocalteu method HPLC-MSFor bronchitis, cough and mumps[28a,33,34]
(Rosaceae)
Rosa canina L.
Kuşburnu
(rosehip)
Kayseri AnkaraProanthocyanidin, Flavonoids, Gallic AcidFolin-Ciocalteu method HPLCFor internal diseases and haemorrhoids; decoction, as tea[35]
(Rutaceae)
Citrus limon L.
Limon
(lemon)
KayseriFlavanones, Flavones, FlavonolsLiquid Chromatography HPLCTo expel kidney stones[28a,36]
(Solanaceae) Capsicum annum L.Acı biber
(hot pepper)
NiğdeFlavonoidsHPLCFor stomach ache; powdered hot red pepper fruits are cooked in milk and ingested[37]
(Solanaceae) Lycopersicum esculentum L.Domates
(tomatoe)
AnkaraQuercetin, Kaempferol, MyricetinHPLC
GC-MS
For burns; juice is applied on the affected area[28a,38]
(Vitaceae)
Vitis vinifera L.
Üzüm (grape)NiğdeAnthocyanins, Flavonols, Flavones1,1-Diphenyl-2-picrylhydrazyl (DPPH) radical scavenging methodFor bruises; pounded dry raisins are applied to bruises to relieve pain[28a,39]
Vegetables
(Brassicaceae) Brassica oleracea L. Var. Capitata DC.Kelem / lahana (cabbage)AnkaraQuercetin, Myricetin, Kaempferol, Luteolin, ApigeninHPLCFor ulcer, fresh leaves are ingested[28a,40c]
(Liliaceae)
Allium cepa L.
Soğan
(onion)
Niğde
Ankara
Kaempferol, Luteolin, Quercetin Davis method
Folin-Ciocalteu method HPLC
HPLC/MS/NMR
For abscesses; bulb is embedded in embers and applied to abscess to promote suppuration[28a,40]
(Liliaceae)
Allium sativum L.
Sarımsak
(garlic)
Niğde
Ankara
Apigenin, Myricetin, QuercetinDavis method
Folin-Ciocalteu method HPLC
For food intoxication pounded with yoghurt and applied on the affected part[40b]
(Poaceae)
Zea mays L.
Mısır (corn)AnkaraFlavonolsDPPH radical scavenging methodFor haemorrhoids; boiled stylus is taken orally[28a,41]
(Solanaceae) Solanum melongena L.Patlıcan
(eggplant)
AnkaraHydroxycinnamic Acid
and Derivatives
HPLC-MS
NMR
As abortifacient ; stalk of a fruit is washed and inserted in vagina[42]
(Solanaceae) Solanum tuberosum LPatates
(potatoes)
Kayseri
Ankara
Flavans, FlavonolsSwain and Hillis methods, Brand-
Williams et al. Methods
For headache; sliced tubers are applied to burns[43]
Leguminous vegetables
(Fabaceae)
Lens culinaris Medik.
Mercimek
(lentils)
AnkaraFlavans, Flavonols, Hydroxybenzoic Acids, Hydroxycinnamic Acids, Catechins, Flavones, Procyanidins, Resveratrol2,2-diphenyl-1-picrylhydrazyl (DPPH) methodFor burns; roasted seeds are milled and applied on affected area[28a,44]
(Fabaceae) Phaseolus vulgaris L.Fasulye
(beans, green)
AnkaraIsoflavonoid, FlavonolsFolin-Ciocalteu methodFor wounds; ashes of the seeds are applied on wounds[28a,45]
(Poaceae)
Hordeum vulgare L.
Arpa
(barley)
Niğde
Ankara
Flavans , FlavonesFolin-Ciocalteu methodFor abscesses; common cold and cough in pneumonia[28a]

Antioxidant/prooxidant properties, mechanisms, and structure-activity relationships

Flavonoids, with over 4,000 identifed species [8], constitute a special class of polyphenolic compounds that are built upon a C6-C3-C6 flavone skeleton in which the two aromatic rings are linked by three carbons cyclized with oxygen. Several classes of flavonoids differ with respect to the degree of unsaturation and oxidation of the three-carbon segment, as shown with seven representative structures in Figure 2. These structures correspond to the flavonoid aglycons, whereas the more complex flavonoid glycosides have one or more hydroxyl groups bound to sugars (e.g., glucose, rutinose, neohesperidose, etc.) by an acid-labile hemiacetal bond through certain positions (such as the 7-hydroxyl in flavones and isoflavones). Within each major class of flavonoids presented in Figure 2, there are many further variations in structural details.
Figure 2. Representative classes of flavonoids
Molecules 12 01496 g002
Flavonoids can exhibit their antioxidant activity (AO) in several ways [9]:
(i) Radical scavenging activity toward either reactive species (e.g., reactive oxygen species: ROS) such as .OH, O2.-, 1O2, or toward lipid peroxidizing radicals such as R., RO., and ROO.; radical scavenging action generally proceeds via hydrogen atom transfer or electron donation;
(ii) prevention of the transition metal− catalyzed production of reactive species (i.e., via Fenton-type reactions) through metal chelation;
(iii) interaction with other antioxidants (such as cooperative actions), localization, and mobility of the antioxidant at the microenvironment [10].
An antioxidant may be defined as ‘any substance that when present at low concentrations, compared with those of the oxidizable substrate, significanly delays or inhibits oxidation of that substrate’ [11]. For convenience, antioxidants have been traditionally divided into two classes; primary or chain-breaking antioxidants, and secondary or preventative antioxidants [12].
Chain-breaking mechanisms are represented by:
L. + AH → LH + A.
LO. + AH → LOH + A.
LOO. + AH → LOOH + A.
Thus radical initiation (by reacting with a lipid radical: L.) or propagation (by reacting with alkoxyl: LO. or peroxyl: LOO. radicals) steps are inhibited by the antioxidant: AH.
On the other hand, secondary (preventive) antioxidants retard the rate of oxidation. For example, metal chelators (e.g., iron-sequesterants) may inhibit Fenton-type reactions that produce hydroxyl radicals [46]:
Fe2+ + H2O2 → Fe3+ + .OH + OH-
One important function of antioxidants toward free radicals such as .OH, O2.-, and ROO. is to suppress free radical−mediated oxidation by inhibiting the formation of free radicals and/or by scavenging radicals. The formation of free radicals may be inhibited by reducing hydroperoxides and hydrogen peroxide and by sequestering metal ions [47] through complexation/chelation reactions. Radical scavenging action is dependent on both reactivity and concentration of the antioxidant. In a multiphase medium (such as an emulsion), the localization of the antioxidant at the interphases may be important.
Evaluation of antioxidant activity is complicated by the prooxidative effect of antioxidants in the presence of unsequestered metal ions such as iron and copper. Especially the lower oxidation states of these metals (i.e., Fe(II) and Cu(I)) should not be present at significant levels in tests measuring antioxidant status so as not to initiate Fenton-type reactions exemplified in Eq.4. The prooxidative effect of phenolic antioxidants (ArOH), generally induced by transition metal ions like Cu(II) in the presence of dissolved oxygen, gives rise to oxidative damage to lipids, and can be demonstrated by the following reactions [48]:
Cu(II) + ArOH → Cu(I) + ArO. + H+
ArO. + LH → ArOH + L.
L. + O2→ LOO.
LOO. + LH → LOOH + L.
Cu(I) + LOOH → Cu(II) + LO.+ OH-
The prooxidant activity of flavonoids is generally concentration-dependent, and both the antioxidant and the copper-initiated prooxidant activities of a flavonoid depend on the number and position of –OH substituents in its backbone structure [49]. Flavones and flavanones, which have no -OH substituents, showed neither antioxidant nor Cu-iniated prooxidant activities in the automated ORAC assays set for the purpose [49]. It was also observed that Cu(II)-induced prooxidant activity of Ar-OH proceeds via intra- and inter-molecular electron transfer reactions accompanying ROS (reactive oxygen species) formation, and copper complexation followed by oxidation of resveratrol analogues (e.g., 3,4-dihyroxystilbene) ended up with quinone (Ar=O) products [50]. The need for considering the possible prooxidant effects of antioxidants is only valid for in vitro antioxidant tests where great care should be taken in the design of experimental conditions. Since iron and copper are sequestered by proteins in vivo, there has been no conclusive evidence which shows that an antioxidant acts as a prooxidant in vivo by reducing metal ions, and it may be misleading to state that some antioxidants act as prooxidants under these conditions [10].
According to kinetic studies of aryloxy (Ar-O.) radical formation and decomposition reactions, the antioxidant (AO)-activity of a flavonoid is closely related to its chemical structure. Three structural requirements are important for high AO-activity of a flavonoid [51]:
(i) the ortho-dihydroxy (catechol) structure in the B-ring, imparting a greater stability to the formed aryloxy radicals as a result of flavonoid oxidation, possibly through H-bonding and electron-delocalization [52]. Another function of the catechol moiety in the B-ring is the possible chelation of transition metal ions that may otherwise cause ROS formation via Fenton-type reactions [53];
(ii) the 2,3-double bond, in conjugation with the 4-oxo function, enhancing electron-transfer and radical scavenging actions through electron-delocalization [53];
(iii) the presence of both 3- and 5-OH groups, enabling the formation of stable quinonic structures upon flavonoid oxidation [54]. Substitution of the 3-OH results in increase in tortion angle and loss of coplanarity, and subsequently reduced AO-activity [55]. A typical flavonoid which meets the above three criteria is quercetin, showing the highest antioxidant capacity in all TAC tests.
Aside from these structural requirements, the number of hydroxyl substituents on the flavonoid molecule, the position of these hydroxyls, the presence of glycosides (-OR) or aglycons (-OH), and the overall degree of conjugation are important in determining AO-activity [56]. For phenolic compounds having the same number of –OH groups, the presence of electron-donating –OMe groups in ortho- and para- positions with respect to the –OH substituents (especially in hydroxycinnamic acids) stabilizes the formed aryloxy radicals resulting from one-electron oxidation, and thereby increases AO-activity [57]. With the same number of hydroxyl and methoxy groups, hydroxycinnamic acids tend to be more effective in AO-capacity than the corresponding hydroxybenzoic acids, possibly due to the aryloxy-radical stabilizing effect of the –CH=CH-COOH linked to the phenyl ring by resonance [58,59].

Total antioxidant capacity (TAC) assays applied to phenolics

Oxygen free radicals that emerge as a result of the respirative cycle of oxidative phosphorylation may attack biological macromolecules like cellular DNA, giving rise to single- and double-strand breaks that may eventually cause cell ageing, cardiovascular diseases, mutagenic changes and cancerous tumor growth. When natural defences of the organism (of enzymatic, non-enzymatic or dietary origin) are overwhelmed by an excessive generation of reactive oxygen species (ROS), a situation of ‘oxidative stress’ occurs, in which cellular and extracellular macromolecules (proteins, lipids and nucleic acids) can suffer oxidative damage, causing tissue injury [60,61]. Consumption of foods naturally having antioxidant activity is the most efficient way of combating such tissue injuries, undesired transformations and preventing health risks.
The chemical diversity of phenolic antioxidants makes it difficult to separate and quantify individual antioxidants (i.e., parent compounds, glycosides, and many isomers) from the vegetable matrix. Moreover, the total antioxidant power as an ‘integrated parameter of antioxidants present in a complex sample’ [62] is often more meaningful to evaluate health beneficial effects because of the cooperative action of antioxidants. Therefore it is desirable to establish and standardize methods that can measure the total antioxidant capacity level directly from vegetable extracts containing phenolics. By means of standardized tests for TAC, the antioxidant values of foods, pharmaceuticals and other commercial products can be meaningfully compared, and variations within or between products can be controlled. By considering the changes in TAC values of human serum measured by standardized methods, one can detect diseases and monitor the course of medical treatments. For the sake of simplicity, only spectrophotometric or fluorometric assays using molecular probes (i.e., UV-Vis absorbing or fluorescent probes) will be discussed in this review. Due to complexity and limitations of directly following reaction kinetics of the inhibited autoxidation of lipids, molecular spectrometric assays that may or may not apply a suitable radical, but without a chain-propagation step as in lipid autoxidation, will be discussed. Antioxidant capacity assays may be broadly classified as electron transfer (ET)− and hydrogen atom transfer (HAT)−based assays [48,63], though in some cases, these two mechanisms may not be differentiated with distinct boundaries. In fact, most non-enzymatic antioxidant activity (e.g., scavenging of free radicals, inhibition of lipid peroxidation, etc.) is mediated by redox reactions [64]. In addition to these two basic classes considering mechanism, reactive oxygen species (ROS) scavenging assays will also be taken into account.
HAT−based assays measure the capability of an antioxidant to quench free radicals (generally peroxyl radicals) by H-atom donation. The HAT mechanisms of antioxidant action in which the hydrogen atom (H.) of a phenol (Ar-OH) is transfered to an ROO. radical can be summarized by the reaction:
ROO. + AH/ArOH → ROOH + A. / ArO.
where the aryloxy radical (ArO.) formed from the reaction of antioxidant phenol with peroxyl radical is stabilized by resonance. The AH and ArOH species denote the protected biomolecules and antioxidants, respectively. Effective phenolic antioxidants need to react faster than biomolecules with free radicals to protect the latter from oxidation. Since in HAT–based antioxidant assays, both the fluorescent probe and antioxidants react with ROO., the antioxidant activity can be determined from competition kinetics by measuring the fluorescence decay curve of the probe in the absence and presence of antioxidants, and integrating the area under these curves [48,63]. As an example of HAT−based assays, oxygen radical absorbance capacity (ORAC) assay [65] applies a competitive reaction scheme in which antioxidant and substrate kinetically compete for thermally generated peroxyl radicals through the decomposition of azo compounds such as ABAP (2,2’-azobis(2-aminopropane) dihydrochloride) [48,63]. The net area under curve (AUC), found by subtracting the AUC of blank from that of antioxidant-containing sample (the fluorescence decay of which is retarded), is an indication of the total antioxidant concentration of the sample in the ORAC method. The fluorescent probes used in the ORAC assay were initially β-phycoerythrin [66,67,68], and later fluorescein [69]. ORAC measures inhibition of peroxyl radical induced oxidations by antioxidants and thus reflects classical radical chain-breaking antioxidant activity by H-atom transfer [63,69]. The reaction was reported to go to completion so that both inhibition time and inhibition degree are considered in quantification of antioxidants [65]. Other HAT−based assays include total peroxyl radical-trapping antioxidant parameter (TRAP assay) using R-phycoerythrin as the fluorescent probe, developed by Wayner et al. [70] and further developed by Ghiselli et al. [62,68], crocin bleaching assay using AAPH as the radical generator [71], and β-carotene bleaching assay [72], although the latter bleaches not only by peroxyl radical attack but by multiple pathways [63]. In general, HAT reactions are relatively independent from solvent- and pH-effects, and are completed in a short time (at the order of sec-min).
On the other hand, the ET mechanism of antioxidant action is based on the reactions:
ROO. + AH/ArOH → ROO- + AH.+/ArOH.+
AH.+ / ArOH.+ + H2O ↔ A. / ArO. + H3O+
ROO- + H3O+ ↔ ROOH + H2O
where the reactions are relatively slower than those of HAT– based assays, and are solvent– and pH–dependent. The aryloxy radical (ArO.) is subsequently oxidized to the corresponding quinone (Ar=O). The more stabilized the aryloxy radical is, the easier will be the oxidation from ArOH to Ar=O due to reduced redox potential. In fact, in most ET–based assays, the antioxidant action is simulated with a suitable redox-potential probe, i.e., the antioxidants react with a fluorescent or colored probe (oxidizing agent) instead of peroxyl radicals. Spectrophotometric ET−based assays measure the capacity of an antioxidant in the reduction of an oxidant, which changes colour when reduced. The degree of colour change (either an increase or decrease of absorbance at a given wavelength) is correlated to the concentration of antioxidants in the sample. ABTS/TEAC (Trolox®-equivalent antioxidant capacity) [73,74] and DPPH [75,76,77] are decolorization assays, whereas in Folin total phenols assay [78,79], FRAP (ferric reducing antioxidant power) [80,81] and CUPRAC (cupric reducing antioxidant capacity) [82,83], there is an increase in absorbance at a prespecified wavelength as the antioxidant reacts with the chromogenic reagent (i.e., in the latter two methods, the lower valencies of iron and copper, namely Fe(II) and Cu(I), form charge-transfer complexes with the ligands, respectively). The basic chromophores used in Folin, ABTS/TEAC, FRAP, ferricyanide, ferric-phenanthroline, DPPH and CUPRAC assays are shown Figure 3. There is no visible chromophore in the Ce4+–reducing antioxidant capacity assay developed recently by Ozyurt et al. [84], as the remaining Ce(IV) in dilute sulfuric acid solution after polyphenol oxidation under carefully controlled conditions was measured at 320 nm. These assays generally set a fixed time for the concerned redox reaction, and measure thermodynamic conversion (oxidation) during that period. ET−based assays include ABTS/TEAC, DPPH, Folin-Ciocalteu (FCR), FRAP, and CUPRAC using different chromogenic redox reagents with different standard potentials. Although the reducing capacity of a sample is not directly related to its radical scavenging capability, it is a very important parameter of antioxidants. The reaction equations of various ET−based assays can be summarized as follows:
Folin: Mo(VI) (yellow) + e- (from AH) → Mo(V) (blue)
λmax=765 nm
where the oxidizing reagent is a molybdophosphotungstic heteropolyacid comprised of 3H2O·P2O5·13 WO3·5 MoO3·10H2O, in which the hypothesized active center is Mo(VI).
FRAP: Fe(TPTZ)23+ + ArOH → Fe(TPTZ)22+ + ArO. + H+
λmax=595 nm
where TPTZ: 2,4,6-tripyridyl-s-triazine ligand.
Prussian Blue: Fe(CN)63- + ArOH → Fe(CN)64- + ArO.+ H+
Fe(CN)64- + Fe 3+ + K+→ KFe[Fe(CN)6]
λmax=700 nm
ABTS/TEAC: ABTS + K2S2O8→ ABTS.+
λmax=734 nm
ABTS.+ + ArOH → ABTS + ArO. + H+
where ABTS: 2,2’-azino-bis(3-ethylbenzothiazoline-6-sulfonic acid) and TEAC is Trolox®-equivalent antioxidant capacity (also the name of the assay). Although other wavelengths such as 415 and 645 nm have been used in the ABTS assay [63], the 734 nm peak wavelength has been predominantly preferred due to less interference from plant pigments.
DPPH: DPPH. + ArOH → DPPH + ArO. + H+
where DPPH. is the [2,2-di(4-tert-octylphenyl)-1-picrylhydrazyl] stable radical with λmax=515 nm.
CUPRAC: n Cu(Nc)22+ + Ar(OH)n→ n Cu(Nc)2+ + Ar(=O)n + n H+
where the polyphenol is oxidized to the corresponding quinone, and the reduction product, i.e., bis(neocuproine)copper(I) chelate, shows absorption maximum at 450 nm.
As for molecular probes used in the colorimetric/fluorometric detection of reactive oxygen species (ROS), nitro blue tetrazolium (NBT) has been used for superoxide anion (O2.-), scopoletin for hydrogen peroxide (H2O2), deoxyribose/thiobarbituric acid (TBA) or modified CUPRAC reagent for hydroxyl radicals (.OH), and tetra-tert-butylphtalocyanine for singlet oxygen (1O2) [48]. Ewing and Janero developed a superoxide dismutase (SOD) microassay based on spectrophotometric assessment of O2.-–mediated NBT reduction by an aerobic mixture of NADH and phenazine methosulfate, which produces superoxide chemically at non-acidic pH [85]. Hydrogen peroxide has been assayed by its ability to oxidize scopoletin, a naturally occurring fluorescent compound, in the presence of horseradish peroxidase as catalyst, to a non-fluorescent product, and the decrease in fluorescence is an indication of H2O2 at nanomolar levels [86]. Hydroxyl radicals generated from a Fenton-reaction (Eq. 4) were most frequently detected by means of their oxidative attack on deoxyribose probe producing malondialdehyde (MDA) as the end product; MDA was colorimetrically detected by formation of colored products with TBA, forming the basis of the TBARS (thiobarbituric acid–reactive substances) method [87, 88]. Bektasoglu et al. [89] used p-aminobenzoate, 2,4- and 3,5-dimethoxybenzoate probes for detecting hydroxyl radicals generated from an equivalent mixture of Fe(II)+EDTA with hydrogen peroxide. The produced hydroxyl radicals attacked both the probe and the water-soluble antioxidants in 37oC-incubated solutions for 2 h. The CUPRAC absorbance of the ethylacetate extract due to the reduction of Cu(II)-neocuproine reagent by the hydroxylated probe decreased in the presence of .OH scavengers, the difference being proportional to the scavenging ability of the tested compound [89].
Figure 3. Basic chromophores used in TAC (total antioxidant capacity) assays.
Molecules 12 01496 g003

Critical evaluation and comparison of total antioxidant capacity (TAC) assays

In comparing antioxidant activity / capacity assays, it should be borne in mind that AO-activity assays deal with the kinetics of a reaction and measure the reaction rate, while AO-capacity assays mainly concentrate on the thermodynamic conversion and measure the number of electrons or radicals donated or quenched, respectively, by a given antioxidant molecule [62]. The area under curve (AUC) method pertaining to ORAC and similar assays is actually an effort to simultaneously measure reaction rate and efficiency.
Frankel and Meyer [90] criticized one-dimensional methods to evaluate the antioxidant status of food and biological fluids, and questioned both ORAC and TRAP, two leading HAT–based assays, in regard to the validity of their assumption whether the antioxidant mechanism of β-phycoerythrin protection by antioxidants actually mimics critical biological substrates. The initial probe for the ORAC reaction, β-PE, showed inconsistent reactivity toward ROO. from lot-to-lot, was photo-bleached due to reasons other than peroxyl radical attack, and exhibited non-specific protein binding to condensed tannins, therefore the probe of the ORAC test was later changed to fluorescein, though reporting high Trolox®-equivalent antioxidant capacities (TEAC values) for most antioxidants [69] incompatible with the findings of conventional assays. However, the ORAC assay is applicable to both food samples and biological fluids, and therefore may be useful in detecting and therapeutical monitoring of diseases. Antioxidant activity assays existing in literature based on the measurement of radical scavenging activity of antioxidant compounds suffer from the difficulties encountered in the formation and stability of colored radicals [91] such as ABTS (2,2’-azinobis-(3-ethylbenzothiazoline-6-sulfonic acid)) [73] and DPPH (2,2’-diphenyl-1-picrylhydrazyl) [77].
Re et al. developed an improved ABTS radical cation decolorization assay using persulfate as the oxidant, and thereby compensated for the weaknesses of the original ferryl myoglobulin/ABTS assay [74]. Actually of the three TEAC tests developed at different periods, namely TEAC assay I (ABTS.+ generated enzymatically with metmyoglobin and hydrogen peroxide), TEAC II (radical generation with filtration over the MnO2 oxidant), and TEAC III (with K2S2O8 oxidant) were totally different from each other, were applicable to different solvent media, and their findings for a given antioxidant could vary significantly [92]. The ‘pre-addition technique’ as in TEAC I, employed by adding antioxidants before radical generation, could result in an overestimation of antioxidant capacity, because many substances interfered with the formation of the radical; TEAC I measured the ability of delaying radical formation as well as scavenging of the radical [92]. The advantages of ABTS/TEAC were reported to be operational simplicity, reproducibility, diversity, and the most important of all, flexible usage in multiple media to determine both hydrophilic and lipophilic antioxidant capacity of food extracts and physiological fluids, since the reagent is soluble in both aqueous and organic solvent media [93].
The total radical trapping parameter (TRAP) assay of Wayner et al. [70] was the most widely used method of measuring total antioxidant capacity of plasma or serum during the last decade, however it suffered from the major drawback of oxygen electrode end-point in that the electrode would not maintain its stability over the required time period [94]. Antioxidant assays based on spectrophotometric methods of thiobarbituric acid-reactive substances (TBARS) formation have poor reproducibility due to instability of substrates used for lipid peroxidation [94]. The inhibition of accumulation of colored radical reagents in the presence of antioxidants is expressed in the units of “lag time” (i.e., the time period required for the colored radical to emerge in the reaction medium), constituting a rather unobjective approach for antioxidant assay, because “lag time” is not always linearly correlated to antioxidant concentration. On the other hand, the ferric reducing antioxidant potency (FRAP) assay of antioxidants [80], which is based on ferric–to–ferrous reduction in the presence of a Fe(II)-stabilizing ligand such as tripyridyltriazine (TPTZ), is both unrealistic (i.e., the colored complex is formed at a definitely acidic pH such as pH=3.6, much lower than the physiological pH) and insufficiently responsive to thiol- type (i.e., -SH containing) antioxidants [95] like glutathione [96]. Moreover, the antioxidants detected by FRAP were limited to water-soluble ones (i.e., soluble in aqueous ethanol solutions), and carotenoids had no ferric reducing ability [64]. Pulido et al. [64] also reported that the absorbance of caffeic acid, ferulic acid, quercetin, and tannic acid did not stabilize within the measurement period of the FRAP protocol (4 min), and was slowly increasing even after several hours of reaction time.
The range of tests used for antioxidant activity measurement is a testimony to the uncertainty surrounding the chemistry of antioxidant compounds. Thus for example, in tests where free radical oxidation is induced by a metal ion like Cu(II) or Fe(III), it is uncertain whether the test measures the ability of the antioxidant to interact with a free radical or its ability to bind the metal ion [97]. Current literature taking a philosophical look at antioxidant indexes clearly states that there is no ‘total antioxidant’ as a nutritional index available for food labeling because of the lack of standard quantitation methods [98]. Analogically, there is no single parameter for antioxidant status of food and biological fluids that corresponds to the widely accepted ‘French hardness parameter’ of water, defined as the mg-amount of CaCO3-equivalent hardness per 100 mL of water. Everybody understands the same meaning from a given level of water hardness, but unfortunately, an analogic extraction of useful knowledge is not possible from the results of antioxidant activity/capacity tests with different mechanisms, procedures, and reporting units. The inevitable consequences of the current situation are that the antioxidant values of foods cannot be effectively evaluated and compared, an objective inventory of antioxidant plant foods may not be prepared, widely agreeable antioxidant-rich diets cannot be designed, and total antioxidant status of human serum cannot serve as an active indicator for detecting and monitoring diseases. In this regard, the antioxidant activities of common vegetables (total sample size: 927) collected from the U.S. market, analyzed using the ORAC and FRAP procedures, did not correlate well [98]. Exactly a similar situation exists for human plasma or serum where different tests yield different results that do not correlate well. For example, Cao and Prior observed a weak linear correlation between serum ORAC and serum FRAP, but no correlation either between serum ORAC and serum TEAC, or between serum FRAP and serum TEAC [95]. Actually, there may not be a point in comparing kinetic-based antioxidant activities with efficiency-based antioxidant capacities, i.e., ET– and HAT–based methods should be compared among thremselves. On the other hand, the authors do not share the opinion of Huang et al. [48] who state that “the excellent linear correlations between the results of ET–based tests and those of Folin total phenolics assay are not surprising, as one of the assays having similar chemistry must be redundant”. The redox potentials and solvent dependencies of these ET–based TAC tests may be quite different from each other, resulting in different TEAC values of food and plant phenolics, and it is a good idea to always correlate those results to get a clear picture of the antioxidant status of complex samples. Besides, Kähkönen et al. [99] clearly showed that antioxidant activity does not necessarily correlate with high amounts of phenolics, and that is why both phenolic content and antioxidant activity information must be discussed when evaluating the antioxidant potential of extracts. Likewise, a high flavonoid content –assayed with aluminium chloride colorimetry– does not necessarily mean a high antioxidant capacity; the low correlation Park et al. [100] observed between either ABTS/TEAC or CUPRAC results and total flavonoids content was due to the nature of measurement technique. The AlCl3 colorimetric test for flavonoids [101] does not measure those flavonoids that do not bear the characteristic chelating functional groups for Al binding. Essentially flavones (e.g., chrysin, apigenin, luteolin, etc.) and flavonols (e.g., quercetin, myricetin, morin, rutin, etc.) react with Al(III), while flavanones and flavanonols do not complex to the same extent [101].
Total antioxidant capacity (TAC) assays measure the capacity of biological samples only under defined conditions prescribed by the given method using different oxidants in each case. If the standard potential of the oxidant is too high (e.g., the potential of the ferric-ferrous couple is 0.77 V, that may significantly increase in the presence of a ferrous-stabilizing ligand such as phenanthroline), then compounds other than food and plasma antioxidants of interest, like glucose or citrate, the latter being used to preserve food and plasma, may also be oxidized within sufficient time [102] causing positive error. Berker et al. [103] examined in detail the Fe(III)–based TAC tests for phenolics, and found that due to the slow kinetics of high-spin Fe(III), most redox reactions in iron-based assays may be accelerated upon incubation of antioxidant samples with the Fe(III)-ligand complex at elevated temperature. This proved to increase thermodynamic efficiency of oxidation of analytes at the expense of the loss of valuable information on reaction kinetics, e.g., Firuzi et al. [54] consider that FRAP value with 4-min absorbance reading takes into account the kinetics of the reaction with Fe(III) more than the FRAP value with 60-min reading. Similar observations were made by FRAP users; due to gradual increase of FRAP absorbance with time for some hydroxycinnamic acids and flavonoids [64], one should find a compromise between measurement techniques (e.g., rapid versus delayed absorbance measurement at 37 °C) as both reaction kinetics and thermodynamics should be reflected in the obtained results to get useful information about food polyphenols. In a comparison with ORAC, Ou et al. [98] described FRAP as a method having some drawbacks concerning interference, reaction kinetics, and quantitation methods, but the reagents are inexpensive, stable, and the results are fairly reproducible [80]. The fact that flavonoids with the highest FRAP activity were the most easily oxidizable compounds with the lowest oxidation potentials [54] confirmed that FRAP was a true ET–based assay.
Some methods measure only the hydrophilic antioxidants (like Folin and FRAP), while others detect only those soluble in organic solvents, especially alcohols (like DPPH) [91]. Alhough widely used for measuring and comparing the antioxidant status of phenolic compounds and foodstuffs, the evaluation of antioxidant activity by the changes in DPPH absorbance should be carefully interpreted since the absorbance of DPPH radical at 517 nm after reaction with a given antioxidant is decreased by light, oxygen, pH, and type of solvent [104]. A further disadvantage of DPPH is steric inaccessibility (i.e., small molecules may have a better chance to access the radical with subsequently higher TAC values) and narrow linear range of absorbance versus concentration [63]. Not all methods measure protein-thiols, or smaller molecule -SH compounds of different origin (such as GSH, with FRAP). The exact chemistry and redox potential of the Folin reagent is unknown [48], and therefore it may act as a nonspecific reagent, simultaneously oxidizing compounds (such as sugars) that are not classified under the title ‘antioxidants’ [105]. Arnao criticized the decolorization assays like ABTS and DPPH with the argument that, the more initial color there is in a sample, the smaller the absorbance decrease and the less antioxidant activity is measured, even when one works with minimal sample volumes [91]. Especially carotenoids were reported to interfere in the 515 nm-absorbance measurement of DPPH [106]. Van den Berg concludes that ‘quantitative evaluation of antioxidant capacity using the ABTS/TEAC can be troublesome and even impossible, but it can be used to provide a ranking order of antioxidants’ [107].
To briefly summarize the current situation, it is believed that there is no single, widely-acceptable assay method applicable to a reasonable variety of compounds in plasma and food matrices. Thus one aim of this review is to report a simple, widely applicable antioxidant capacity method for food extracts and human serum, as successively performed previously for dietary polyphenols, vitamins C and E [82], utilizing the copper(II)-neocuproine (Cu(II)-Nc) reagent as the chromogenic oxidizing agent. Since copper(II) (or cupric) ion reducing ability is measured, the method is named by our research group as “cupric reducing antioxidant capacity” abbreviated as the CUPRAC method. This method should be advantageous over FRAP (ferric reducing antioxidant power) since the redox chemistry of copper(II) -as opposed to that of chemically inert high-spin ferric ion having half-filled d-orbitals in its electronic configuration- should involve faster kinetics. The bis(neocuproine)copper(I) cation chromophore is soluble both in water and organic media, therefore the CUPRAC method is capable to assay both hydrophilic and lipophilic antioxidants. Since the optimal pH of the method is close to the physiological one, there would be no risk of underestimation (under acidic conditions) or overestimation (under basic conditions) of TAC, due to either protonation of antioxidants or proton dissociation of phenolic compounds, respectively. As in similar electron-transfer based assays, the antioxidant capacity is assumed to be equal to reducing capacity [48]. Of the eight criteria proposed by Prior et al. [63] for defining an ideally standardized method of antioxidant capacity measurement, the CUPRAC method meets six, such as simplicity, clarity of end-point and mechanism, readily available instrumentation, good intra- and inter-assay reproducibility, adaptibility to simultaneously assay lipophilic and hydrophilic antioxidants, and high throughput for routine analyses. It should be mentioned here that CUPRAC does not measure chemistry actually occurring in lipid oxidation, and it does not utilize a biologically relevant radical source, however the latter must not be a prerequisite for a widely accepted assay.

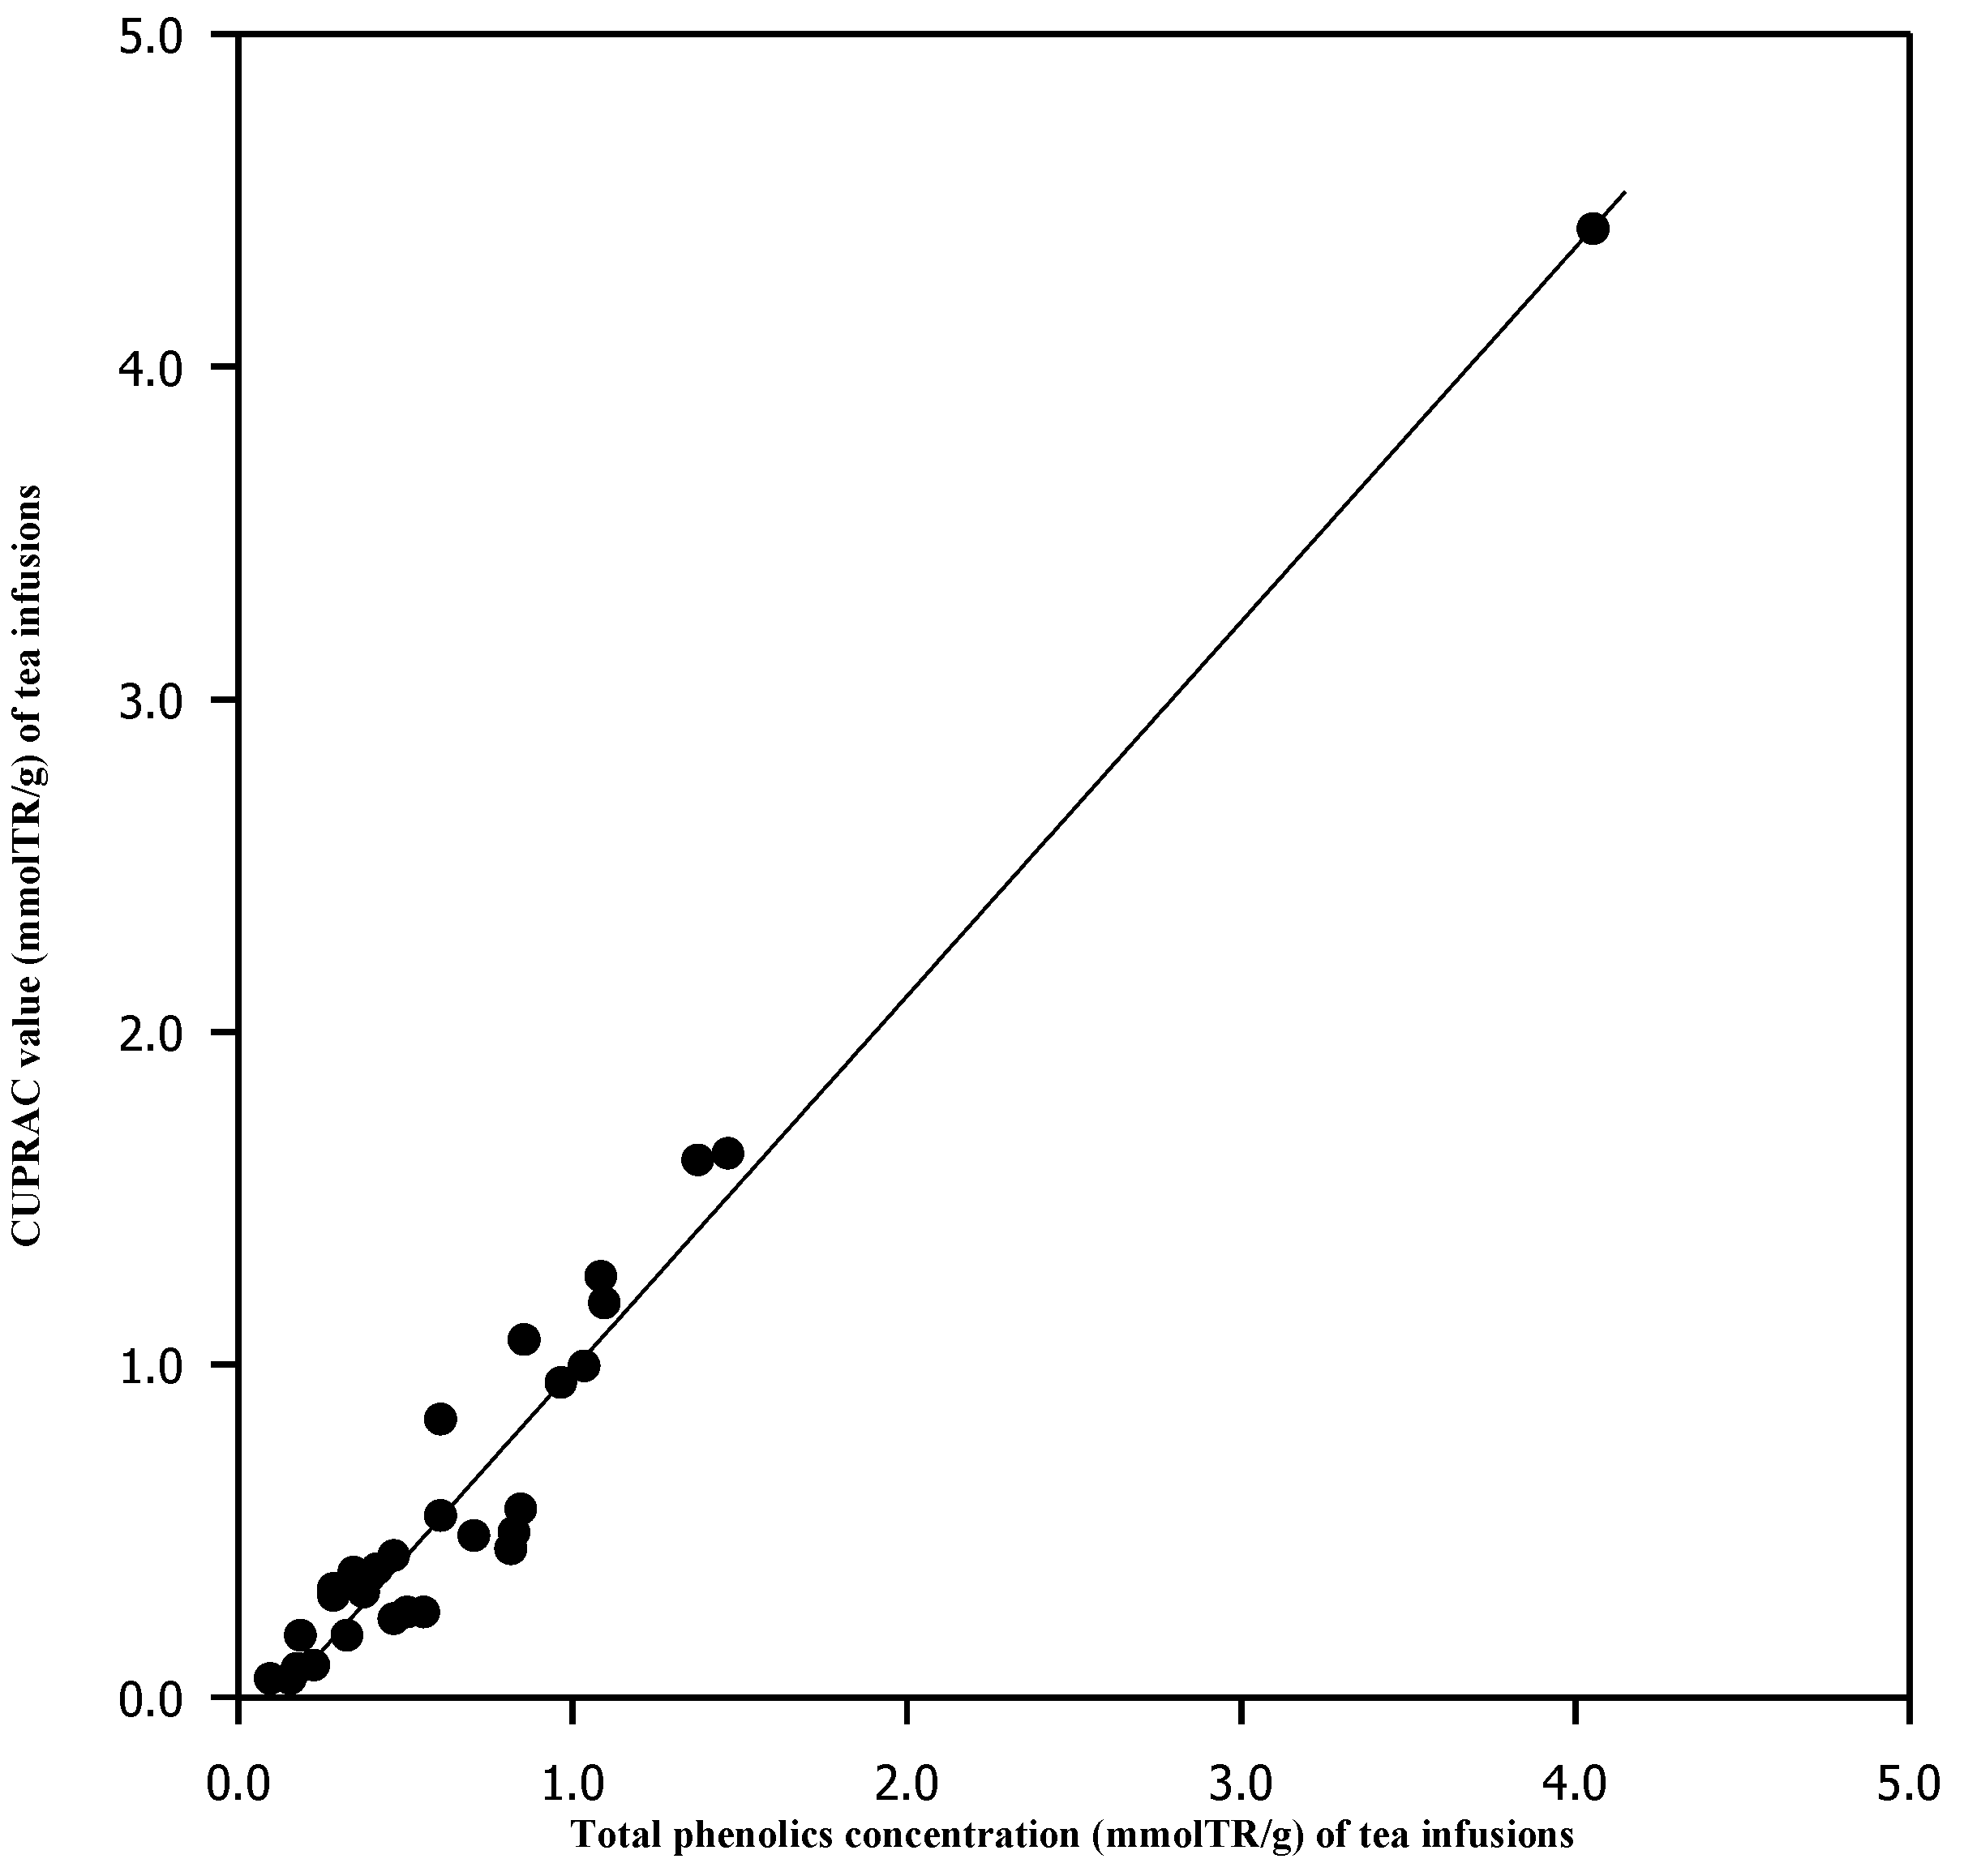
Antioxidant capacities of regularly consumed fruits, vegetables, and beverages due to phenolics

Phenolic substances can be extracted from plant material using a sequence of solvents with divergent polarity. In general, useful solvents with decreasing order of polarity are: water, 80 % methanol or 70 % ethanol, 80 % acetone and ethyl acetate. Among antioxidant phenolics, certain classes of compounds such as phenolic acids, hydroxycinnamic acids, flavonoids, and carotenoids require a decreasing order of solvent polarity for extraction, respectively, although suitable solvent combinations may be tailored for specific purposes. Moreover, the dielectric constant of the solvent, intra-/inter-molecular hydrogen bonding associations and standard redox potential of phenolics and derived aryloxy radicals in a given solvent may be important for electron transfer kinetics in antioxidant assays [48,63]. Although it is difficult to define a universally acceptable solvent, 80 % MeOH and 70 % EtOH are generally the most preferred solvents for phenolics extraction from plants. Due to the diversity of phenolic antioxidant phytochemicals in botanicals, certain compromises have to be made in solvent selection [63], which is beyond the scope of this review.
In antioxidant tests carried out by TEAC, ORAC and FRAP methods on regularly consumed fruits and vegetables available on the U.K. market, fruits and vegetables rich in anthocyanins (e.g., strawberry, raspberry, and red plum) showed the highest TAC values, followed by those rich in flavones (e.g., orange and grapefruit) and flavonols (e.g., onion, leek, spinach and green cabbage), while the hydroxycinnamic acids–rich ones (e.g., apple, tomato, pear, and peach) exhibited the lower values. The antioxidant capacities (in TEAC units, on fresh weight basis) followed the hierarchic order: strawberry >> raspberry = red plum >> red cabbage >>> grapefruit = orange > spinach > broccoli > green grape ≈ onion > green cabbage > pea > apple > cauliflower ≈ pear > tomato ≈ peach = leek > banana ≈ lettuce [108]. For plant foods consumed in the Italian market, spinach was the highest TAC exhibiting vegetable, followed by peppers and asparagus, while in fruits, berries (i.e., blackberry, redcurrant, and raspberry) showed the highest capacities; coffee and citrus juices among beverages, and soybean oil and extra virgin olive oil among the vegetable oils, were the richest in antioxidants [109]. For fruits consumed in the American diet, Vinson et al. [110] made a distinction between free phenols (sample extracted with 50 % MeOH, incubated at 90 0C, cooled and centrifuged) and total phenols (sample extracted with 1.2 M HCl in 50 % MeOH), and found that, on a fresh weight basis, cranberry had the highest total phenols, and was distantly followed by red grape; fruits had significantly better quantity and quality of phenolic antioxidants than vegetables. Only a few fruits (avocado, cranberry, honeydew melon, and orange) had a large portion of their phenolic contents in free form; the other fruits had a high percentage (31-94 %) of the phenols conjugated [110]. In the American food market, the phenolic antioxidant capacity –analyzed with the DPPH method– of various plant food were as follows: fruits; 600-1700 μmol Trolox® equivalent (TE)/100 g, with a high 2200 TE for plums; berries averaged 3700 TE and vegetables averaged 450 TE with a high 1400 TE for red cabbage; whole grain breakfast cereals analyzed 2200-3500 TE [111]. A meal containing a 100-g serving of breakfast cereals, fruits, and vegetables provided an average antioxidant content of 2731, 1200, and 447 TE, respectively [111].
A total of 927 freeze-dried vegetable samples from the American market were analyzed using the ORAC and FRAP methods, and the rank order with ORAC was: green pepper > spinach > purple onion > broccoli > beet > cauliflower > red pepper > white onion > snap bean > tomato > white cabbage > carrot > pea, whereas with FRAP, the order was: red pepper > green pepper > beet > spinach > cauliflower > tomato > broccoli > white cabbage > purple onion > carrot > snap bean > white onion > pea [98]. Aside from the inherent disagreement between the two assays (ORAC and FRAP) of antioxidant status determination, the findings were observed not only to depend on species, but also on geographical origin and harvest time. On the basis of ORAC findings, Ou et al. [98] concluded that green pepper, spinach, purple onion, broccoli, beet, and cauliflower were the leading sources of antioxidant activity against peroxyl radicals. Wu et al. [112] found from a survey of 100 different foods that hydrophilic and lipophilic ORAC values ranged between 0.9-2641 and 0.07-1611 μmol TE/g, respectively, lipophilic ORAC values being less than 10 % of the hydrophilic ones for a great majority of samples. The fruits with hydrophilic ORAC values ranging between 14,000 and 2,000 μmol TE per serving were listed as: all berry fruits, red bean, apple (Red Delicious and Granny Smith), pecan, sweet cherry, black plum, russet potato, black bean, Gala apple, walnut, Golden Delicious and Fuji apple, date, pear, hazelnut, orange, raisin, fig, avocado, broccoli, red cabbage, red potato, pistachio, and red grape [112]. Cao et al. [113] reported that based on the fresh weight of the vegetable, garlic had the highest ORAC antioxidant activity (μmol TE/g) against peroxyl radicals (19.4) followed by kale (17.7), spinach (12.6), Brussels sprouts, alfalfa sprouts, broccoli flowers, beets, red bell pepper, onion, corn, eggplant (9.8-3.9), cauliflower, potato, sweet potato, cabbage, leaf lettuce, string bean, carrot, yellow squash, iceberg lettuce, celery, and cucumber (3.8-0.5); the green and black teas had much higher antioxidant activity against peroxyl radicals than all these vegetables [113].
Apak et al. [114] investigated the TAC values of 25 different medicinal and food herbs with the aid of Folin, ABTS and CUPRAC methods. The highest antioxidant capacities of some herbal teas available in the Turkish market were observed for scarlet pimpernel (Anagallis arvensis), sweet basil (Ocimum basilicum), green tea (Camellia sinensis), and lemon balm (Melissa officinalis) in this order (1.63, 1.18, 1.07, and 0.99 mmol Trolox® equivalent (TE) per gram, respectively). For infusions prepared from ready-to-use tea bags, the CUPRAC values were highest for Ceylon blended ordinary tea (4.41), green tea with lemon (1.61), English breakfast ordinary tea (1.26), and green tea (0.94), all of which were manufactured types of Camellia sinensis. Following the strongest antioxidant herbs with capacities close to or slightly exceeding 1.0 mmol TE g-1, sage, thyme, coriander, coltsfoot, blackberry and immortelle (Helichrysum) exhibited capacities around 0.5 mmol TE g-1. The correlation of Folin total phenolics content of herbal teas with their CUPRAC and ABTS total antioxidant capacities gave linear curves with correlation coefficients of 0.966 and 0.936, respectively, showing that the CUPRAC assay results better correlated with total phenolics content of herbal infusions [114].
Guclu et al. [115] determined the TAC values of five varieties of apricots harvested in Malatya (Turkey), namely Hacihaliloglu, Cologlu, Kabaasi, Soganci, and Zerdali, using three different assays: CUPRAC, ABTS/persulfate, and Folin (the TAC values in the units of μmol TE g-1 reported in this order for the assays): fresh apricot (3.62 ± 0.65 ; 3.47 ± 0.60 ; 10.1 ± 1.27), sun-dried apricot (14.2 ± 3.1; 14.1 ± 2.9; 36.2 ± 5.8) , and desulphited apricot which was originally sulphited-dried (13.6 ± 2.7; 13.8 ± 2.4; 40.3 ± 3.5). In this study, the CUPRAC test was performed for the assay of both TAC and sulphite content of apricots; sulphite, normally contributing to the color measured in the CUPRAC method, could be removed prior to assay on a strongly basic anion exchanger at pH 3 in the form of HSO3-, without affecting the analytical precision of phenolic TAC determination. The CUPRAC results correlated well with those of ABTS and Folin (r = 0.93). The tests also showed that the sun-dried Malatya apricot completely preserved its antioxidant values unlike some other dried fruits, and gave very close TAC values to the desulphited samples which were originally sulphited-dried [115].
Taking 100 g fresh weight of fruit, 150 mL-glass beverage and 500 mL-glass beer as the standard serving amounts, Paganga et al. [116] reported that the hierarchic equalities of TE– total antioxidant activities of some beverages and fruits were: 1 glass of red wine = 12 glasses of white wine = 2 cups of tea = 4 apples = 5 portions of onion = 5.5 portions of eggplant = 3.5 glasses of blackcurrant juice = 3.5 glasses of beer = 7 glasses of orange juice = 20 glasses of apple juice (long-life). Naturally these values are the results of in vitro TAC tests, and are not associated with the in vivo levels of antioxidants when these food sources are ingested as diet. Velioglu et al. [117] state that when all plant materials are included in statistical analysis, there is a positive and highly significant relationship between total phenolics content (Folin) and antioxidant activity (β-carotene bleaching); however, for plants with phenolics content largely consisting of anthocyanins, there may not be a significant correlation between these two assay results. Among edible plant materials, Kähkönen et al. [99] found remarkably high antioxidant activity and high phenolic content (gallic acid equivalents > 20 mg g-1) for berries, though these two parameters did not have the same meaning for all samples. A list of selected plant food, of which the total antioxidant contents were assayed using different methods, are tabulated in Table 2.
Table 2. Major phenolic components, total phenolic content, and total antioxidant capacity of some selected fruits and vegetables
FruitMajor phenolic components [108]Total phenols [108,110]
(mg GAE/ 100 g Fw)
TEAC [108,109,116]
(µmol TE/ 100 g Fw)
ORAC
[108,112]
(µmol TE/ 100 g Fw)
FRAP
[108,109]
(µmol Fe2+/ 100 g Fw)
DPPH [111]
(µmol TE/ 100 g Fw)
StrawberryPelargonidin-3-glucoside
Cinnamoyl glucose
330±4
78.3±12
2591±68
1134
2437±95
3577
3352±38
2800
3100
RaspberryCyanidin-3-sophoroside
Cyanidin-3-glucoside
228±61846±10
1679
1849±232
4925
2325±53
4303
5100
Red plumCyanidin-3-glucoside
3´-Caffeoylquinic acid
320±12
133±12
1825±28
511
2564±185
6239
2057±25
1279
2200
OrangeHesperidin
Narirutin
Neohesperidin
126±6
23.8±13
849±25
874
1904±259
1814
1181±6
2050
600
BananaQuercetin-3-glucoside /conjugates38±4
191±36
181±39
64
331±59
879
164±32
228
1100
Apple5´-Caffeoylquinic acid
Rutin
Quercetin-3-glucoside/conjugates
48±1
109±15
343±13
159
640±270
560±18
2936
394±8
384
1400
SpinachFlavonol conjugates
Hydroxycinnamate conjugates
72±1757±54
849
1655±115
2640
1009±35
2694
500
BroccoliHydroxycinnamate conjugates
Flavonol conjugates
128±4648±25
304
1335±62
1590
833±16
1167
600
OnionQuercetin conjugates88±1532±29
182
580±320
988±30
1029
369±13
528
200
TomatoChalconaringenin
5´-Caffeoylquinic acid
30±1255±14
165
160±60
420±39
460
344±7
512
200
LettuceQuercetin conjugates
5´-Caffeoylquinic acid
14±1171±12
133
319±37
1550
124±7
494
150
Notes: For the ORAC antioxidant capacities, the first values correspond to ORACβ-PE and second to ORACFL. The ORAC test using fluorescein (FL) probe has been reported in the literature to yield much higher values than the classical assay using β-phycoerythrin probe. The fruits and vegetables assayed were collected from different food markets, as indicated in the text.

Results and Discussion

Reaction, spectra, and conditions of the CUPRAC assay

The chromogenic redox reagent used for the CUPRAC assay was bis(neocuproine)copper(II) chelate. This reagent was useful at pH 7, and the absorbance of the Cu(I)-chelate formed as a result of redox reaction with reducing polyphenols was measured at 450 nm. The color was due to the Cu(I)-Nc chelate formed (see Figure 4, for Cu(I)-Nc spectra obtained with reacting varying concentrations of ascorbic acid with the CUPRAC reagent). The reaction conditions such as reagent concentration, pH, and oxidation time at room and elevated temperatures were optimized as shown in the experimental section, derived from other sources [82,83].
The chromogenic oxidizing reagent of the developed CUPRAC method, i.e., bis(neocuproine)copper(II) chloride (Cu(II)-Nc), reacts with n-electron reductant antioxidants (AO) in the following manner:
n Cu(Nc)22+ + n-electron reductant (AO) ↔ n Cu(Nc)2+ + n-electron oxidized product + n H+
In this reaction, the reactive Ar-OH groups of polyphenolic antioxidants are oxidized to the corresponding quinones (Ar=O) and Cu(II)-Nc is reduced to the highly colored Cu(Nc)2+ chelate showing maximum absorption at 450 nm. Although the concentration of Cu2+ ions was in stoichiometric excess of that of neocuproine in the CUPRAC reagent for driving the redox equilibrium reaction represented by (Eq. 22) to the right, the actual oxidant was the Cu(Nc)22+ species and not the sole Cu2+, because the standard redox potential of the Cu(II/I)-neocuproine was 0.6 V, much higher that that of the Cu2+/Cu+ couple (0.17 V) [118]. As a result, polyphenols were oxidized much more rapidly and efficiently with Cu(II)-Nc than with Cu2+, and the amount of colored product (i.e., Cu(I)-Nc chelate) emerging at the end of the redox reaction was equivalent to that of reacted Cu(II)-Nc. The liberated protons are buffered in ammonium acetate medium. In the normal CUPRAC method (CUPRACN), the oxidation reactions were essentially complete within 30 min. Flavonoid glycosides required acid hydrolysis to their corresponding aglycons for fully exhibiting their antioxidant potency. Slow reacting antioxidants needed elevated temperature incubation so as to complete their oxidation with the CUPRAC reagent [82, 83]. Special precautions to exclude oxygen from the freshly prepared and analyzed solutions of pure antioxidants were not necessary since oxidation reactions with the CUPRAC reagent were much more rapid than with dissolved O2 (i.e., the latter would not appreciably occur during the period of CUPRAC protocol since there is a spin restriction for the ground state triplet of dioxygen molecule to participate in fast reactions). However, plant extracts should be purged with N2 to drive off O2, and should be kept in a refrigerator if not analyzed on the day of extraction, since complex catalyzed reactions with unpredictable kinetics may take place in real systems. Additionally, the oxidation of ascorbic acid with dissolved oxygen may take place more rapidly than of polyphenolics, especially in the presence of transition metal salts.
Figure 4. Visible spectra of Cu(I)-Nc chelate produced as a result of CUPRAC reaction with varying concentrations of ascorbic acid.
Molecules 12 01496 g004

Trolox® equivalent antioxidant capacites (TEAC coefficients) of antioxidants

The TEAC coefficients (i.e., the reducing potency −in Trolox® mM equivalents− of 1 mM antioxidant solution under investigation) of various hydrophilic antioxidant compounds (the formulas of which are given in Figure 5) found with the developed CUPRAC method and compared to those measured with the reference methods are tabulated in Table 3. The TEAC coefficients of various antioxidants using CUPRAC, ABTS/TEAC, Folin, FRAP (instant and incubated), ferricyanide, Fe(III)-phenanthroline, and Ce(IV) reducing antioxidant capacity assays were experimentally found in our laboratories with the exception of some FRAP data; the findings of Fe(III)–based assays were reported by Berker et al. [103], and of Ce(IV) based assays by Ozyurt et al. [84]. The linear calibration curves of the tested antioxidants as absorbance versus concentration with respect to the CUPRAC method (figures not shown) generally gave correlation coefficients close to unity (r ≥ 0.999) within the useful absorbance range of 0.1-1.1 The highest antioxidant capacities in the CUPRAC method were observed for epicatechin gallate, epigallocatechin gallate, quercetin, fisetin, epigallocatechin, catechin, caffeic acid, epicatechin, gallic acid, rutin, and chlorogenic acid in this order, in accordance with theoretical expectations, because the number and position of the hydroxyl groups as well as the degree of conjugation of the whole molecule are important for easy electron transfer. Among the Fe(III)–reducing antioxidant assays developed by our research group, the ferric-phenanthroline and the ferricyanide (i.e., hexacyanoferrate(III)+Fe(III)) assays gave comparable results with those of more popular assays (Table 3), though with much less expensive and more stable reagents [103] than those utilizing radicalic reagents. The TEAC coefficients of incubated FRAP assay were higher than those of standard FRAP (the latter with absorbance measurement at the end of 6 min of reagent addition), because the oxidation reactions for phenolic and hydroxycinnamic acids and for flavonoids were more complete with the incubated FRAP assay. The ferric reducing tests of ferricyanide and ferric-phenanthroline effectively competed with incubated FRAP, yielding compatible results [103], and the ferricyanide test had the additional advantage of being carried out at near-neutral pH as opposed to the common acidic media of iron–based methods.
Figure 5. The formulas of the hydrophilic and lipophilic antioxidants (and of methyl-β-cyclodextrin used in solubility enhancement) tested with the CUPRAC assay.
Molecules 12 01496 g005
The results obtained with the Folin method were generally higher than with others, because the essential component of the Folin reagent, i.e., molybdo-phospho-tungstate heteropoly acid, had an indefinite but much higher redox potential than those of the other reagents which lie in the range of E0 = 0.6-0.7 V. It may be concluded that the Folin reagent is a nonspecific oxidant for polyphenols, in accord with relevant literature [105]. A similar conclusion may be drawn for TEACCe(IV) findings (Table 3), where Ce(IV) in 0.3 M H2SO4 medium behaved as a powerful oxidant for polyphenols [84]. The rutin/quercetin pair showed TEACCe(IV) coefficients of 7.5/7.9, while the naringin/naringenin pair exhibited TEAC values of 5.32/6.56 (Table 3). Thus it may be inferred that in the acidic Ce(IV) reducing capacity method, flavonoid glycosides normally yielding much lower TEAC values in other ET–based methods are hydrolyzed to their corresponding aglycons, and exhibit their full antioxidant capacity.

Structure-acitivity relationships in CUPRAC

A novel antioxidant capacity assay eligible for standardization (i.e., to be used in determining the antioxidant status of food and biological fluids) has to pay attention to some structural requirements of antioxidant potency. For example, the presence of 5-hydroxy-4-keto group in A & C rings in flavonols, the 2,3-double bond connecting the two ring systems of flavonol via conjugation, and the 3’,4’-dihydroxy substitution of the B ring are considered as important structural characteristics for antioxidant potency [51,57], all three of which are combined in quercetin (the formula of which is given in Figure 5). As a result, the TEAC coefficient in the CUPRAC assay was highest among flavonols for quercetin. Fisetin had one –OH group less than quercetin, and therefore gave the lower TEAC value (Table 3). Rutin, having an O-rutinase substituent instead of –OH in the 3-position (Figure 5), showed the lower capacity. In general, when flavonoid glycosides were hydrolyzed to the corresponding aglycons (i.e., O-sugar substituent being converted to –OH), their CUPRAC antioxidant capacities significantly improved.
Table 3. Antioxidant capacities of the polyphenolic compounds (in the units of TEAC: Trolox® equivalent antioxidant capacity) as measured by CUPRAC, ABTS/persulfate, Folin, FRAP, Ferricyanide, Fe(III)-phenanthroline, and Ce(IV) assays.
Antioxidant NameTEACCUPRACTEACABTSTEACFolin
TEACNTEACITEACHTEACH&ITEAC6min
Flavonoids
Epicatechin gallate (ECG)5.325.65 3.514.35
Epigallocatechingallate (EGCG)4.895.49 3.152.78
Quercetin (QR)4.38 2.775.17
Fisetin (FS)3.904.18 2.623.90
Epigallocatechin (EGC)3.353.60
Catechin (CT)3.093.563.083.493.144.09
Epicatechin (EC)2.772.89 2.693.22
Rutin (RT)2.56 3.801.156.75
Morin (MR)1.883.32 1.793.37
Kaempherol1.581.87 0.902.01
Hesperetin (HT)0.991.050.850.981.114.50
Hesperidin (HD)0.971.110.790.951.403.29
Naringenin (NG)0.052.28 3.030.645.52
Naringin (N)0.020.13 0.621.12
Hydroxycinnamic Acids
Caffeic acid (CFA)2.892.962.873.221.393.27
Chlorogenic acid (CGA)2.472.721.201.421.212.84
Ferulic acid (FRA)1.201.231.181.342.163.49
p-Coumaric acid (CMA)0.551.000.531.151.632.54
Vitamins
α-Tocopherol (TP)1.101.020.990.871.02
Ascorbic acid (AA)0.96 1.03
Benzoic Acids
Gallic acid(GA)2.62 3.481.23
Sinapic acid (SNA)1.242.17 1.113.39
Vanillic acid (VA)1.241.521.321.571.253.05
Syringic Acid (SA)1.121.641.131.671.502.49
Antioxidant NameTEACFRAPTEACFerricyanideTEACFe(III)-PhenTEACCe(IV)
TEACOrigTEACI
Flavonoids
Epicatechin gallate (ECG)3.52
Epigallocatechingallate (EGCG)4.02
Quercetin (QR)2.92 4.323.274.167.90
Fisetin (FS)
Epigallocatechin (EGC)2.00
Catechin (CT)1.24 3.44
Epicatechin (EC)1.45
Rutin (RT)1.122.202.072.357.50
Morin (MR)
Kaempherol 0.98
Hesperetin (HT)
Hesperidin (HD)
Naringenin (NG)0.22 6.56
Naringin (N) 5.32
Hydroxycinnamic Acids
Caffeic acid (CFA)1.131.842.481.941.94
Chlorogenic acid (CGA)1.61 2.38
Ferulic acid (FRA)0.871.120.701.182.70
p-Coumaric acid (CMA) 2.22
Vitamins
α-Tocopherol (TP)
Ascorbic acid (AA)1.01 1.140.991.011.08
Benzoic Acids
Gallic acid(GA)1.85 3.032.783.864.20
Sinapic acid (SNA)
Vanillic acid (VA)
Syringic Acid (SA)
As for hydroxycinnamic acids which are almost the most abundant phenolic components in the citrus family and in some other fruits, the TEAC coefficients with respect to the CUPRAC method (and with respect to the ABTS assay, as shown in parantheses) were as follows: caffeic acid 2.9 (1.4), chlorogenic acid 2.5 (1.2), ferulic acid 1.2 (2.2), and p-coumaric acid 0.6 (1.6). The Trolox® equivalent capacity order for these phenolic acids was just the opposite of that of the most widely used ABTS assay [57]. Structural properties of hydroxycinnamic acids would normally dictate that two –OH bearing caffeic and chlorogenic acids should exhibit higher TEAC coefficients than one –OH bearing ferulic and p-coumaric acids (see Figure 5 for formulas). Furthermore, ferulic acid having an electron-donating methoxy group in ortho-position relative to the phenolic –OH, thereby allowing increased stabilization of the resulting aryloxyl radical through electron delocalization after H-atom donation by the hydroxyl group, should show a higher TEAC coefficient than para-coumaric acid which lacks such a group. Thus structural requirements dictate that hydroxycinnamic acids should have a TEAC order as measured by the CUPRAC and not by the ABTS assay. Moreover, the order of peroxyl radical scavenging ability of hydroxycinnamic acids, and thus the order for their ability to enhance the resistance of LDL to oxidation, was measured as caffeic acid > chlorogenic acid > ferulic acid > p-coumaric acid [57,119,120], again entirely consistent with the results of the CUPRAC method. Although the antioxidant activity of rosmarinic acid, another powerful antioxidant hydroxycinnamic acid, was reported to be much higher than those of Trolox® [121], α-tocopherol, caffeic acid, ferulic acid, BHT [122] and other plant phenolics [123], the ABTS/TEAC and DPPH methods applied by different researchers report low TEAC values within the interval of 1.5-2.0 for rosmarinic acid [124,125] while the CUPRAC method finds a TEAC value close to that of quercetin. The TEAC order of hydroxycinnamic acids (Table 3) clearly reflects the superiority of CUPRAC over other similar ET–based methods.
Gallic acid had one more –OH group than chlorogenic acid, and therefore showed the higher capacity. The catechin group, also known as “tea antioxidants”, gave a capacity order in accord with the number and position of their –OH groups, together with the overall extent of conjugation in the molecule. Inspection of Table 3 reveals that all these structural requirements for antioxidant potency are met by the TEAC results of the CUPRAC assay. The TEAC values found with CUPRAC correlated linearly (r=0.8) to those of ABTS but the correlation of both assays to Folin were poor (Table 3), because both CUPRAC and ABTS were similar ET–based antioxidant assays with close reduction potentials while the exact potential of the Folin reagent with the presumably higher potential is not definitely known. The phenols are essentially dissociated to phenolates in the Folin assay carried out in alkaline medium, facilitating oxidation. As a result, the high TEAC values listed in Table 3 achieved with the Folin assay reveal that the Folin reagent should have oxidized the tested phenolics to a greater extent than either CUPRAC or ABTS/TEAC. Nevertheless, the CUPRAC and Folin results of TAC values of herbal teas, as reported by Apak et al. [114], correlated very well (Figure 6), as the hierarchy for TAC of real samples follows almost the same trend for ET–based assays.
Among the antioxidants tested by the CUPRAC assay, those of which the oxidation potentials were measured with cyclic voltammetry (CV) by Firuzi et al. [54] were quercetin (0.39 V), fisetin (0.39 V), catechin (0.45 V), rutin (0.46 V), uric acid (0.53 V), and naringenin (0.89 V). The standard potentials and TEAC values (with respect to the normal CUPRAC method) of these antioxidants correlated linearly with a high correlation coefficient (in absolute value), i.e., r = - 0.986, meaning that antioxidants within a given class (flavonoids, hydroxycinnamic acids, etc.) with the lowest oxidation potentials were the most active compounds in the CUPRAC assay, showing the highest TEAC coefficients. Briefly, oxidizability of an antioxidant correlates well with its CUPRAC capacity (in TEAC units), confirming that CUPRAC is a genuine ET–based assay.
Figure 6. The correlation of CUPRAC assays results with those of Folin for herbal extracts.
Molecules 12 01496 g006

Simultaneous CUPRAC assay of lipophilic and hydrophilic antioxidants

In the CUPRAC testing of synthetic (lipophilic) antioxidants in DCM solution, BHT (butylated hydroxytoluene) showed less TAC than other similar compounds. This low TAC of BHT in individual solution could be enhanced in the presence of other synthetic antioxidants like BHA (butylated hydroxyanisole), and its molar absorptivity rose to the level of ε = 1.61x10⁴ Lmol-1cm-1. Thus, in DCM medium, the TEAC coefficients of synthetic antioxidants were as follows: BHA (0.96), BHT (0.95 in DCM solution containing a fixed amount of BHA), TBHQ (0.90), lauryl gallate: LG (2.40), and propyl gallate: PG (2.31). The use of BHA as an internal standard in DCM medium−measurements showed an improvement only on the TEAC value of BHT, and not on those of other synthetic antioxidants. Intermolecular hydrogen bonding associations in a non-aqueous solvent such as DCM may restrict full display of antioxidant potency of bulky substituents−containing phenolics like BHT (which may show steric hindrance to the CUPRAC reaction). On the other hand, addition of BHA to DCM may give rise to new possibilities of H-bonding interactions, releasing BHT molecules from possible associates to exhibit an antioxidant potency close to that of BHA (which has a single phenolic –OH, like BHT). Although β-carotene did not react with the CUPRAC reagent in aqueous ethanol, its TEAC coefficient in DCM medium was 3.3 [82]. The capability of the CUPRAC method to measure antioxidants in DCM solution as a result of the solubility of the CUPRAC chromophore, i.e., Cu(I)-Nc, in DCM constituted a clear advantage over other ET−based assays like Folin and FRAP which cannot measure such antioxidants.
The TEAC coefficients of various lipophilic and hydrophilic antioxidants (the formulas of which are given in Figure 5) in 7 % methyl-β-cyclodextrin (M-β-CD) aqueous medium using the modified CUPRAC method [126] were as follows: BHA (1.50), BHT (0.68), TBHQ (0.90), LG (1.97), PG (2.75), vitamin E (0.90), Trolox® (1.00), ascorbic acid (0.91), quercetin (5.16), caffeic acid (2.77), and ferulic acid (1.18). Both propyl gallate and lauryl gallate contained the 3,4,5-trihydroxy benzoic acid moiety in their molecular structures, and therefore exhibited greater antioxidant potency than BHA, BHT, or TBHQ, in proportion to the number of their –OH groups. The TEAC for BHT was lower than that of BHA, although they contained the same number of phenolic -OH groups. This may be explained by the steric hindrance of the two bulky butyl groups in BHT compared to the single butyl group in BHA, and by the presence of a para-methoxy group (relative to phenolic –OH) in BHA, increasing the electron density in the para-position thereby stabilizing the aryloxy radical when the parent compound (BHA) loses one electron.
The ‘antioxidant polarity paradox’ states that hydrophilic antioxidants are often less effective in oil-in-water emulsions than lipophilic antioxidants, whereas lipophilic antioxidants are less effective in bulk oils than hydrophilic antioxidants [127,128]. The single solvent convenience incorporating M-β-CD of a modified CUPRAC procedure capable of measuring both hydrophilic and lipophilic antioxidants [126] is expected to partly solve the ‘antioxidant polarity paradox’ in the sense of developing an antioxidant assay relatively independent of solvent effects so that each antioxidant, disregarding its lipophilicity level, may exhibit its characteristic antioxidant capacity merely arising from its structural property, i.e., electron-transfer capability, in an aqueous-rich medium.
Apak et al. [83] were also able to apply the CUPRAC method to a complete series of plasma antioxidants for the assay of total antioxidant capacity of serum, and the resulting absorbance at 450 nm was recorded either directly (e.g., for ascorbic acid, α-tocopherol, and glutathione) or after incubation at 500C for 20 min (e.g., for uric acid, bilirubin and albumin), quantitation being made by means of a calibration curve. The lipophilic antioxidants, α-tocopherol and β-carotene, were assayed in dichloromethane. Lipophilic antioxidants of serum were extracted with n-hexane from an ethanolic solution of serum subjected to centrifugation. Hydrophilic antioxidants of serum were assayed after perchloric acid precipitation of proteins in the centrifugate [83]. The TAC determination of human serum constitutes another example of the simultaneous assay of lipophilic and hydrophilic antioxidants by the CUPRAC method.

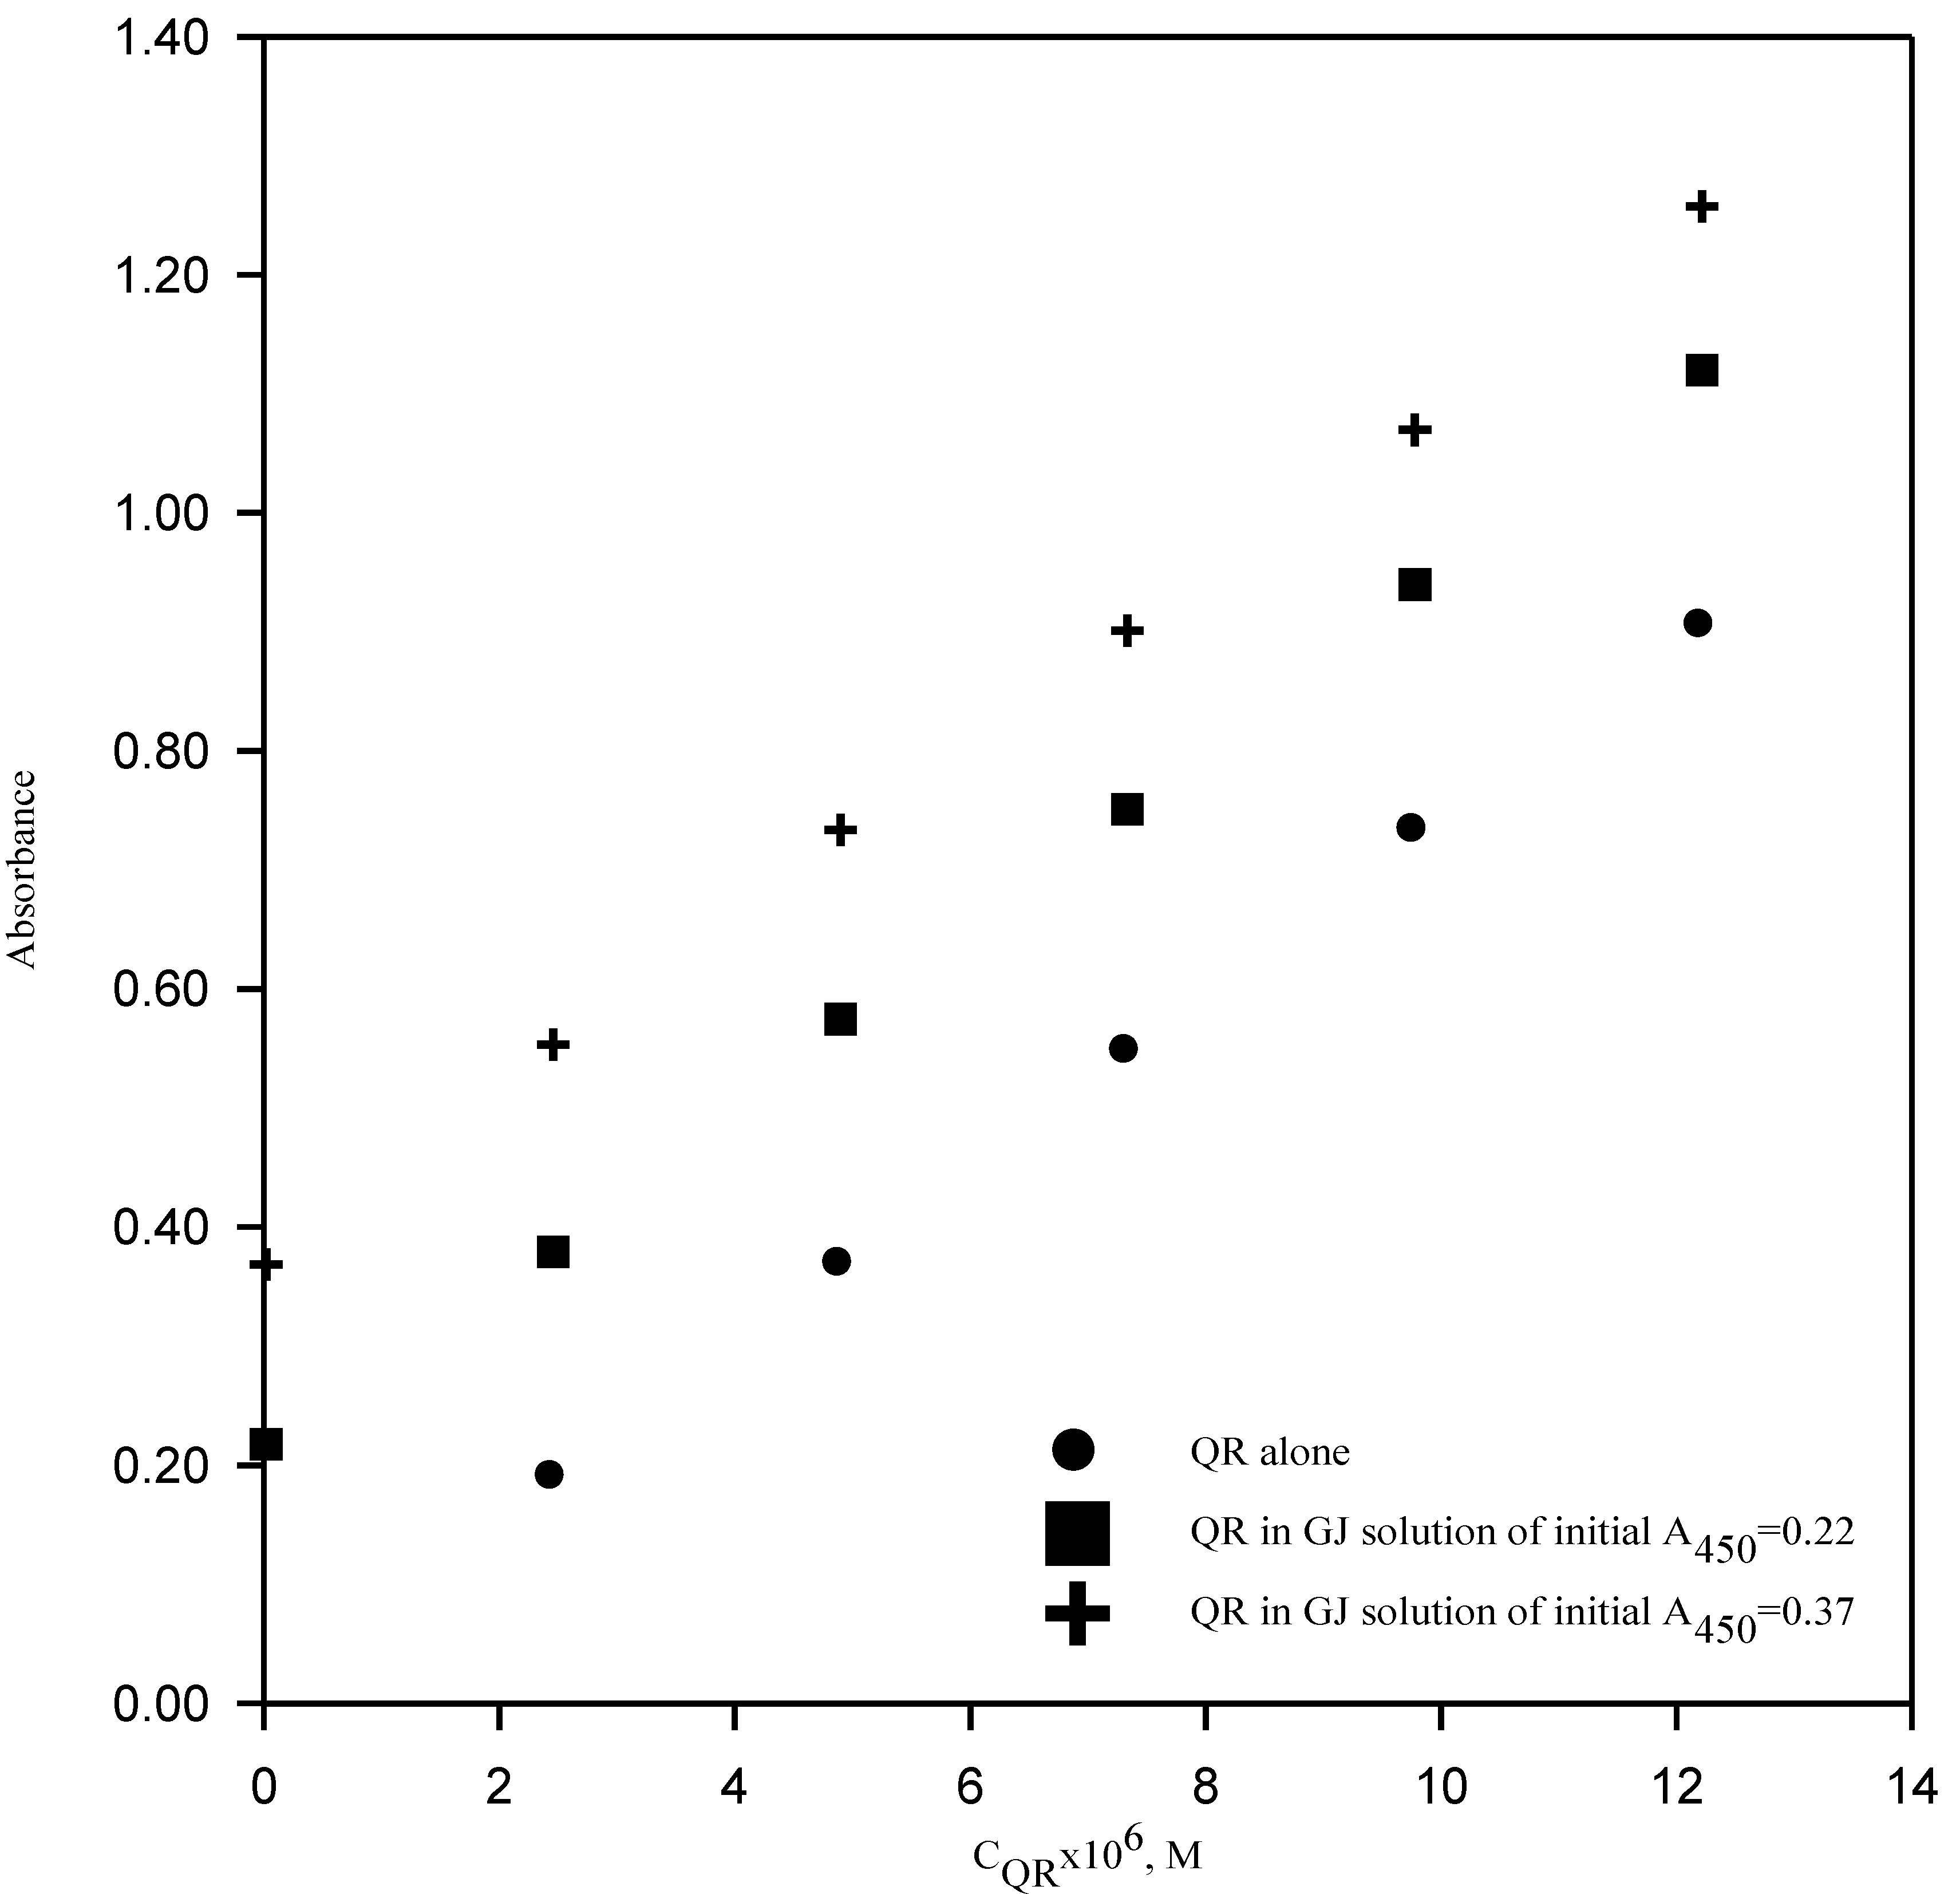
CUPRAC assay of synthetic and real mixtures

Synthetic mixtures −prepared by mixing standard solutions of antioxidants− obeyed Beer’s law fairly well. Ternary and quaternary mixtures of lipophilic and hydrophilic antioxidants, assayed in the same aqueous medium in the presence of M-β-CD, exhibited the theoretically expected antioxidant capacity (AOC) within ± 9 %, meaning that chemical deviations from Beer’s law essentially did not exist and the CUPRAC absorbances of constituents were additive. The original CUPRAC method was previously shown to be free from chemical deviations from Beer’s law, as demonstrated on synthetic mixtures of hydrophilic phenolic compounds [82]. Possible combinations of ternary mixtures of the antioxidants (quercetin, catechin, rutin, galllic acid, hydroxycinnamic acids, ascorbic acid, naringenin, and Trolox®) were synthetically prepared, and the suitably diluted solutions were analyzed for antioxidant capacity using the CUPRAC method. The experimentally measured capacities were generally within (+/-) 5 % interval of the theoretically computed values using the formula:
Capacitytotal = TEAC1 concn.1+ TEAC2 concn.2 +TEAC3 concn.3 + ....+TEAC n concn.n
where 1,2,........,n denote the corresponding constituents of the synthetic mixture. The comparison of expected (using Eq. 23) and experimentally found antioxidant capacities of synthetic mixture solutions (as mM Trolox®-equivalents) found with CUPRAC were generally in accord with each other.
Figure 7. CUPRAC calibration curves of quercetin in grape juice.
Molecules 12 01496 g007
The accordance of theoretical and experimental findings, combined with the parallellism of the linear calibration curves of each antioxidant compound tested in the presence of the other compound, effectively demonstrated that there were no chemical interactions of intereferent nature among the synthetic solution constituents, and that the antioxidant capacities of the tested antioxidants were additive [82]. This reasoning was also applied to plant extracts like grape and orange juices and green tea as real complex mixtures, and standard calibration curves of selected antioxidant compounds (quercetin, gallic acid, Trolox® and ascorbic acid) were redrawn in these plant extracts showing good parallelism of linear curves in pure aqueous solution and in real complex mixtures having an initial non-zero absorbance with the CUPRAC reagent (see Figure 7 for parallelism of CUPRAC calibration curves of quercetin in grape juice). Again, this showed that that the constituents of a real matrix solution did not chemically interact with selected pure antioxidants, and that the antioxidant capacities were additive. Thus the proposed CUPRAC method may be effectively used for the antioxidant capacity assay of synthetic mixtures and real solutions.

Sensitivity enhancement with preconcentration in CUPRAC

The CUPRAC method was also useful in concentrating the colored cations derived from the antioxidant values of dilute solutions where ordinary TAC assay gave negligible absorbances [129]. When an antioxidant reduced the chromogenic reagent Cu(II)-Nc, the resulting large cation of Cu(Nc)2+ could selectively be retained at pH 7 on a weakly acidic cation exchanger Amberlite IRC-50 resin in Na+-form. The resin–retained species was eluted with (1:1 (v/v) EtOH + 1 M aqueous HClO4) mixture solution, neutralized, and subjected to absorbance reading, yielding preconcentration factors between 5-10, thereby increasing analytical sensitivity [129]. Since it is known that the large Cu(Nc)2+ cation can be extracted with large anions into O-donor organic solvents in the form of ion associates, solvent extraction–preconcentration of the CUPRAC chromophore is another possibility for sensitivity enhancement, and merits further research.

The findings of other CUPRAC users in plant, food, and biological materials

Prior et al. [63] have classified CUPRAC as one of the electron transfer-based methods, and summarized the superiorities of the CUPRAC method over other antioxidant assays. They state that due to the lower redox potential of the CUPRAC reagent, reducing sugars and citric acid –which are not true antioxidants but oxidizable substrates in other similar assays– are not oxidized with the CUPRAC reagent. Gorinstein et al. [130] have acknowledged that the highest capacities of polyphenolic compounds measured with CUPRAC were noted for catechin, caffeic acid, and gallic acid, in accordance with the capacity order of ABTS. CUPRAC and ABTS/TEAC antioxidant capacities for the raw and boiled garlic extracts were similar with a linear correlation. The authors state that “as an advantage to other electron transfer- based assays as ABTS and Folin, CUPRAC values were acceptable in regard to its realistic pH close to the physiological pH” [130]. In another research of the Gorinstein group, Park et al. [100] have correctly acknowledged that the CUPRAC and total polyphenols measurement results in the extracts of kiwifruit (that underwent ethylene treatment) correlated very well (R2 =0.81), better than with other total antioxidant capacity (TAC) assays (such as ABTS/TEAC). The low correlation the authors observed between CUPRAC results and flavonoids content [100] was due to the nature of measurement technique. The AlCl3 test for flavonoids does not measure those flavonoids that do not bear the characteristic chelating functional groups for Al binding, such as the 5-hydroxy-4-keto group. Essentially flavones (e.g., chrysin, apigenin, luteolin, etc.) and flavonols (e.g., quercetin, myricetin, morin, rutin, etc.) react with Al(III), while flavanones and flavanonols do not complex to the same extent [101]. Fruhwirth et al. [131] have stated that the CUPRAC assay, being applicable at pH 7.0 and responsive to thiol-type antioxidants, is a significant improvement over the conventional FRAP assay. The authors note that among the hydroxycinnamic acids, the conventional ABTS/TEAC method gave a much higher TEAC coefficient for ferulic acid than for caffeic acid, while their “αPROX” anti-protein fluorescence screening assay results were in accordance with theory and with the findings of CUPRAC. The authors also think that the conventional ABTS and FRAP methods dramatically overestimate the TEAC value of gallic acid, while their measurement was in accord with that of CUPRAC [131]. Mazor et al. [132] measured the Trolox®- (TEAC), CUPRAC-, and Fe(II)- equivalents (as FRAP values) of some antioxidants, i.e., bucillamine (BUC), N-acetyl cysteine (NAC), glutathione (GSH), ascorbic acid, and Trolox®. The reduction yield of the CUPRAC reagent (i.e., to the Cu(I)-Nc chelate) was proportional to the antioxidant concentrations, and doubled for the 2-e reducing agents like ascorbic acid, Trolox® and BUC (the latter containing 2 –SH groups), relative to the 1-e reducing agents, NAC and GSH (containing 1 –SH group). On the other hand, the widely used FRAP method, although being capable of detecting BUC and NAC, was unable to detect the 1 –SH bearing tripeptide GSH [132], pointing out to a distinct inferiority of FRAP. The research group of Topcu measured the antioxidant activity of rhubarb (Rheum ribes) extract with CUPRAC and other methods in comparison to the performance of BHT and α-tocopherol, and correlated the CUPRAC findings with those of FRAP [133].

Advantages of the CUPRAC method over other ET–based antioxidant capacity assays

The advantages of the CUPRAC method over other similar assays are summarized below:
1) The CUPRAC reagent is fast enough to oxidize thiol-type antioxidants [83,134], whereas according to the protocol developed by Benzie and Strain [80], the FRAP method may only measure with serious negative error certain thiol-type antioxidants like glutathione (i.e., the major low molecular-weight thiol compound of the living cell). The CUPRAC assay also responds much faster than FRAP to certain hydroxycinnamic acids. The possible reason for this with respect to electronic configurations is the kinetic inertness of high-spin d5-Fe(III) having half-filled d-orbitals, while CUPRAC utilizing d9-Cu(II) oxidant involves faster kinetics.
2) The CUPRAC reagent is selective, because it has a lower redox potential than that of the Fe(III)/Fe(II) couple in the presence of phenanthroline or other Fe(II)-stabilizing similar ligands. The standard potential of the Cu(II,I)-Nc redox couple is about 0.6 V [118], close to that of ABTS+./ABTS, i.e., 0.68 V. Simple sugars and citric acid, which are not true antioxidants, are not oxidized in the CUPRAC method.
3) The reagent is much more stable and easily accessible than the chromogenic radical reagents (e.g., ABTS, DPPH). The cupric reducing ability measured for a biological sample may indirectly but efficiently reflect the total antioxidant power of the sample even though no major radicalic species is utilized in the assay.
4) The method is easily applicable to conventional laboratories using standard equipment like a colorimeter rather than more sophisticated but costly insrumental techniques of analysis.
5) The redox reaction giving rise to a colored chelate of Cu(I)-Nc is relatively insensitive to a number of parameters adversely affecting certain radicalic reagents such as DPPH [104], i.e., air, sunlight, solvent type, and pH, the latter to a certain extent.
6) The CUPRAC absorbance versus concentration curves are perfectly linear over a wide concentration range, unlike those of other methods yielding polynomial curves. The method perfectly complied with dilution, as the absorbance versus concentration curves of diluted extracts passed through the origin [114]. The molar absorptivity (e.g., ε = 7.3 x 10⁴ L mol-1cm-1 for quercetin) is sufficiently high to sensitively determine most phenolic antioxidants. Preconcentration of the CUPRAC chromophore using a weakly acidic cation-exchange resin is also possible for very sensitive applications.
7) The TAC values of antioxidants found with CUPRAC are perfectly additive, i.e., the TAC of a phenolic mixture is equal to the sum of TAC values of its constituent polyphenols.
8) The method involves minimal sample preparation, the experimental procedure is flexible and suitable for automation.
9) The method proved to correlate well with ABTS or Folin-Ciocalteu assays in herbal plant infusions [114] and apricot extracts [115].
10) The redox reaction producing colored species is carried out at nearly physiological pH (pH 7 of ammonium acetate buffer) as opposed to the unrealistic acidic conditions (pH 3.6) of FRAP, or basic conditions (pH 10) of Folin-Ciocalteu (FCR) assay. At more acidic conditions than the physiological pH, the reducing capacity may be suppressed due to protonation on phenolics, whereas in more basic conditions, proton dissociation of phenolics (converted into phenolates) would enhance a sample’s reducing capacity.
11) The method can simultaneously measure hydrophilic as well as lipophilic antioxidants (e.g., β-carotene and α-tocopherol). BHA, BHT, α-tocopherol, and most other oil-soluble antioxidants may be easily assayed in MeOH, while β-carotene requires dichloromethane (DCM) for fully exhibiting its antioxidant potency (as the bis(neocuproine)copper(I) chelate is also soluble in DCM). The lipophilic antioxidants of serum may be assayed separately from the hydrophilic ones by hexane extraction of serum, followed by colour development in DCM [83]. As an advantage over the widely used Folin and FRAP reagents, CUPRAC can measure lipophilic antioxidants.
12) The within-run and between-run coefficients of variation (CV) of the CUPRAC method for human serum (0.7 and 1.5 %) are much lower than those of most methods that find wide use in total antioxidant assays [83]. The CV of CUPRAC is much lower than those of most kinetic-based assays.
13) Since the Cu(I) ion produced as the product of the CUPRAC redox reaction is in chelated state (i.e., Cu(I)-Nc), it cannot act as a prooxidant that may cause oxidative damage to lipids. The ferric ion-based assays were criticized for producing Fe2+, which may act as a prooxidant to produce .OH radicals as a result of its Fenton-type reaction with H2O2 [135]. The stable Cu(I)-chelate was previously shown by us not to react with hydrogen peroxide, but the reverse reaction, i.e., oxidation of H2O2 with Cu(II)-Nc, is possible [118]. Since a cascade of ROS-generating reactions oxidizing lipids is not possible with CUPRAC, there is no negative error of antioxidant determination due to possible prooxidant effect of Cu(I).

Conclusions

This review makes a critical evaluation of existing antioxidant assays applied to phenolics, and reports the CUPRAC method in detail as a simple and inexpensive antioxidant capacity assay for dietary polyphenols (both natural and synthetic antioxidant phenols), vitamins C and E, and human serum antioxidants, utilizing the copper(II)-neocuproine reagent as the chromogenic oxidizing agent. This method has distinct advantages over other ET−based assays, namely simplicity, availability and stability of reagents, reproducibility over a wide concentration range, selection of working pH at physiological pH (as opposed to Folin and FRAP methods, which work at alkaline and acidic pH, respectively), applicability to both hydrophilic and lipophilic antioxidants (unlike Folin and DPPH), completion of the redox reactions for most common flavonoids within reasonable time (unlike FRAP), selective oxidation of antioxidant compounds without affecting sugars and citric acid commonly contained in foodstuffs, and the capability to assay –SH bearing antioxidants (unlike FRAP). Although at the First International Congress on Antioxidant Methods held in Orlando, FL, in June 2004, it was proposed that procedures and applications for three assays, namely ORAC, Folin, and ABTS/TEAC, be considered for standardization [63], we propose that CUPRAC, considering its enormous advantages over other similar ET–based assays, should be added to the list of assays that merit standardization. We recommend the use of CUPRAC to scientists preparing an inventory of food plants rich in phenolic antioxidants.

Experimental

General

The CUPRAC method is comprised of mixing the antioxidant solution (directly or after acid hydrolysis) with a copper(II) chloride solution, a neocuproine (2,9-dimethyl-1,10-phenanthroline) alcoholic solution, and an ammonium acetate aqueous buffer at pH 7, and subsequently measuring the developed absorbance at 450 nm after 30 min (normal measurement). Since the color development is fast for compounds like ascorbic acid, gallic acid and quercetin but slow for naringin and naringenin, the latter compounds were assayed after incubation at 50 0C on a water bath for 20 min (after Cu(II)-Nc reagent addition) so as to enable complete oxidation (incubated measurement). The flavonoid glycosides were hydrolyzed to their corresponding aglycones by refluxing in 1.2 M HCl-containing 50% MeOH so as to exert maximal reducing power towards Cu(II)-Nc (hydrolyzed measurement). Certain compounds also needed incubation after acid hydrolysis to fully exhibit their reducing capability (hydrolyzed and incubated measurement). The CUPRAC antioxidant capacities of synthetic mixtures of antioxidants (i.e., polyphenols, vitamins C and E) were experimentally measured as Trolox® equivalents, and compared to those theoretically found by making use of the principle of additivity of absorbances assuming no chemical deviations from Beer’s law concerning mixtures. Thus the total CUPRAC antioxidant capacity of a mixture containing various antioxidants should be finally measured after a suitable combination of hydrolysis and incubation procedures so as to obtain maximum absorbance at 450 nm.

Standards, samples and reagents

The flavonoids; fisetin, quercetin, rutin, naringin, naringenin, (-) epicatechin, (-) epigallocatechin, (-) epicatechin gallate, and (-) epigallocatechin gallate, as well as lipophilic (synthetic) antioxidants; butylated hydroxyanisole (BHA), butylated hydroxytoluene (BHT), tert-butylhydroquinone (TBHQ), and propyl gallate (PG), methanol, and the CUPRAC ligand: neocuproine (2,9-dimethyl-1,10-phenanthroline) were purchased from Sigma Chemical Co.; (-) catechin, gallic acid, lauryl gallate (LG), and methyl-β-cyclodextrin (M-β-CD) from Fluka Chemicals and dichloromethane (DCM) from Riedel de Haen. Hydroxycinnamic acids like ferulic acid, p-coumaric acid, caffeic acid and ascorbic acid, and Trolox® (6-hydroxy-2,5,7,8-tetramethylchroman-2-carboxylic acid) were supplied by Aldrich Chemicals Co. α-Tocopherol, ammonium acetate, copper(II) chloride, 96% EtOH, and all other chemicals were from E. Merck. The real matrix media containing a mixture of antioxidants were the following: dried food plants and commercial samples of herbal tea bags were supplied from the Turkish food market (Malatya Pazari & Doga Bitki Urunleri Sanayi), fruit juices were squeezed from the fresh fruit at the time of measurement.

Preparation of solutions

A 1.0x10⁻² M copper(II) chloride solution was prepared from CuCl2·2H2O (0.4262 g) dissolved in H2O and diluted to 250 mL with additional water. Ammonium acetate (NH4Ac) buffer at pH=7.0 was prepared by dissolving NH4Ac (19.27 g) in water and diluting to 250 mL. Neocuproine (Nc) solution (7.5x10⁻³ M) was prepared by dissolving Nc (0.039 g) in 96% EtOH, and diluting to 25 mL with ethanol. All hydrophilic polyphenolic compounds and vitamin solutions were freshly prepared in 96% EtOH at 1 mM (1.0x10⁻³ M) concentration prior to measurement. The standard solutions of synthetic antioxidants, namely BHA, BHT, TBHQ, LG and PG well as of the carotenoid β-carotene were prepared at 1.0x10⁻³ M concentrations in dichloromethane (DCM), and diluted to the desired concentration suitable for absorbance measurement within the applicability range of Beer’s law.
For CUPRAC testing of both hydrophilic and lipophilic antioxidants in the same aqueous solution containing the macrocylic oligosaccharide methyl-β-cyclodextrin (M-β-CD) as the solubility enhancer ligand, the standard solutions at 1.0x10⁻³ M concentration of lipophilic antioxidants BHA, TBHQ, LG, PG, and α-tocopherol; of hydrophilic antioxidants ascorbic acid, ferulic acid, caffeic acid, Trolox® and quercetin; and at 1.0x10⁻² M concentration of BHT were all prepared in EtOH. The cyclodextrin stock solution was prepared in water at 7 % (w/v) for M-β-CD.

Normal sample measurement

To a test tube were added Cu(II), Nc, and NH4Ac buffer solutions (1 mL each). Antioxidant sample (or standard) solution (x mL) and H2O (1.1-x) mL were added to the initial mixture so as to make the final volume 4.1 mL. The tubes were stoppered, and after ½ h, the absorbance at 450 nm (A450) was recorded against a reagent blank. The UV-Vis spectrophotometer used was Varian CARY 1E, equipped with quartz cuvettes. The standard calibration curves of each antioxidant compound was constructed in this manner as absorbance versus concentration, and the molar absorptivitiy of the CUPRAC method for each antioxidant was found from the slope of the calibration line concerned. The scheme for normal measurement of hydrophilic antioxidants can be summarized as follows:
1 mL Cu(II) + 1 mL Nc + 1 mL buffer + x mL antioxidant soln. + (1.1 – x ) mL H2O; total vol.= 4.1 mL, measure A450 against a reagent blank 30 min after reagent addition.
The scheme for normal measurement of lipophilic antioxidants was:
1 mL Cu(II) + 1 mL Nc + 1 mL buffer + x mL antioxidant soln. in DCM+ (1.1 – x ) mL DCM; measure A450 against a reagent blank 30 min after reagent addition.
The scheme for normal measurement of both hydrophilic and lipophilic antioxidants in aqueous solution containing 7 % M-β-CD as the solubility enhancer was as follows:
Five mL-aliquots of ethanolic antioxidant solutions were taken, water (15 mL) was added to each, and an aliquot of the resulting mixture (2 mL) was taken for analysis. This was completely solubilized by adding 7 % M-β-CD solution (2 mL) to the aqueous mixture. The subsequent CUPRAC assay was performed by adding CuCl2 (1 mL), Nc solution (1 mL) and NH4Ac solution (1 mL) to the M-β-CD–containing final analyte mixture (x mL), followed by water (1.1-x mL). The absorbance of the final solution (of 4.1 mL total volume) at 450 nm was recorded against a reagent blank after 30 min standing at room temperature.

Incubated sample measurement

The mixture solutions containing sample and reagents were prepared as described in ‘normal measurement’; the tubes were stoppered and incubated for 20 min in a water bath at temperature 50 0C. The tubes were cooled to room temperature under running water, and their A450 values were measured.

Hydrolyzed sample measurement

A suitable mass of the polyphenol standard was weighed such that the final antioxidant concentration of the methanolic solution would be 1 mM. Each standard was dissolved in a suitable volume of 50% MeOH. In a 100 mL flask, sufficient hydrochloric acid was added to each solution until the final HCl molarity was 1.2 M, and diluted to the mark with 50% MeOH. This solution was decanted to a distillation flask into which a few pieces of boiling stone were added, and refluxed at 80 °C for 2 h. The flask was cooled to room temperature under running tap water. The hydrolyzate was neutralized with 1 M NaOH. The neutralized solution was then subjected to ‘normal measurement’.

Hydrolyzed and incubated sample measurement

The neutralized hydrolyzate was subjected to incubation at 50 °C in a water bath for 20 min. The A450 of running water-cooled samples were ‘normally measured’.

Measurement of ternary synthetic solutions

Individual 1 mM solutions of the antioxidant compounds were prepared in 96% EtOH. Ternary mixtures of the antioxidants were prepared in suitable volume ratios such that the final absorbance of the mixture did not exceed 0.80 using the CUPRAC method. To the mixtures were added Cu(II), Nc, and NH4Ac buffer in this order (1 mL each). Water was added for dilution to a final volume of 4.1 mL. The ternary mixture solutions were subjected to both ‘normal’ and ‘incubated measurement’ so as to test the hypothesis of the additivity of absorbances due to each antioxidant, and the theoretically calculated CUPRAC antioxidant capacities of the mixtures were compared to those experimentally found.

Application of the method to real mixtures (e.g. plant extracts and beverages)

One tea bag of the commercial herbal teas was dipped separately into freshly boiled water (250 mL) in a beaker, occasionally shaken for 2 min, and let to stand in the same solution for 3 more min, enabling a total stewing time of 5 min. The herbal tea solution was let to cool to room temperature, and filtration was applied to the sample using a Whatman black-band filter paper for removing particulates. Steeping was applied only to herbal tea samples of which the infusions were measured for antioxidant capacity. Other plant extracts and fruit juices were directly measured after filtration and dilution.
In cases when the technique of standard additions was employed (i,.e., increasing amounts of quercetin or other polyphenolic standard added to a plant extract or beverage), the real sample solution was appropriately diluted with water such that its original CUPRAC absorbance at 450 nm would lie between 0.2-0.4 abs. units. The standard calibration curves of the selected polyphenolic standard were redrawn in these real solutions so as to observe the parallelism between the calibration lines (e.g., of quercetin) individually in water and in real solution.

Calculation of total antioxidant capacity and polyphenolic content

The molar absorptivity of Trolox® in the tested TAC methods were as follows:
ε Trolox = 1.67x10⁴ L mol-1 cm-1 (CUPRAC method); ε Trolox = 2.6x10⁴ L mol-1 cm-1 (ABTS method); ε Trolox = 4.65x10³ L mol-1 cm-1 (Folin method).
The TEACCUPRAC coefficients of phenolic compounds having linear calibration curves passing through the origin were simply calculated by dividing the molar absorptivity (ε) of the species under investigation by that of Trolox® under corresponding conditions (e.g., the ε values of normal and incubated solutions of Trolox® were 1.67x10⁴ and 1.86x10⁴ L mol-1 cm-1, respectively). For example, the molar absorptivity of catechin was ε = 5.16x10⁴ in the normal CUPRAC method; the TEAC coefficient of catechin was found as εcatechin / εTrolox = 5.16x10⁴ / 1.67x104 = 3.09.
If a herbal infusion (initial volume = Vcup) prepared from (m) grams of dry matter was diluted (r) times prior to analysis, and a sample volume of (Vs) was taken for analysis from the diluted extract, and colour development (after 30 min of reagent addition) was made in a final volume of (Vf) to yield an absorbance of (Af), then the Trolox® equivalent antioxidant capacity of the plant material (in mmol Trolox® per gram of dry matter, or simply mmol TE/g) was found using the equation:
Capacity (in mmol TE/g) = (Af / εTR) (Vf / Vs) r (Vcup / m)
Example calculation [114]: lemon balm (dry herbal tea material, 1.5465 g) was weighed and prepared into a 250 mL-infusion; this infusion (8 mL) was diluted to 100 mL prior to analysis (dilution ratio = r = 12.5). The volume of sample solution taken for analysis was Vs = 0.2 mL, and the total volume of final solution (in which colour development was made) in the CUPRAC method was Vf = 4.1 mL. The Trolox® equivalent capacity of lemon balm using the above equation was (0.401/1.67x104) (4.1/0.2)12.5 (250/1.5465) = 0.99 mmol TE/g.

Acknowledgments

The authors would like to express their gratitude to Istanbul University Research Fund, Bilimsel Arastirma Projeleri Yurutucu Sekreterligi, for the funding of Project YOP-4/27052004, to State Planning Organization of Turkey (DPT) for the Advanced Research Project of Istanbul University (2005K120430), and to TUBITAK (Turkish Scientific and Technical Research Council) for the research projects 105T402 and 106T514.

Abbreviations

AAPH
2,2’-Azobis(2-amidinopropane) hydrochloride
ABAP
2,2’-Azobis(2-aminopropane)
ABTS
2,2’-Azinobis-(3-ethylbenzothiazoline-6-sulfonic acid)
AO
Antioxidant
AOC
Antioxidant capacity
AUC
Area under curve
BHA
Butylated hydroxyanisole
BHT
Butylated hydroxytoluene
BUC
Bucillamine
CD
Cyclodextrin
CV
Coefficient of variation
CUPRAC
Cupric reducing antioxidant capacity
DCM
Dichloromethane
DPPH
2,2-Di(4-tert-octylphenyl)-1-picrylhydrazyl
ET
Electron transfer
EtOH
Ethanol
FCR
Folin-Ciocalteu reagent
FRAP
Ferric reducing antioxidant power
GSH
Glutathione
HAT
Hydrogen atom transfer
LDL
Low-density lipoprotein
LG
Lauryl gallate
M-β-CD
Methyl-β-cyclodextrin
MDA
Malondialdehyde
MeOH
Methanol
NAC
N-acetyl cysteine
NBT
Nitro blue tetrazolium
ORAC
Oxygen radical absorbance capacity
PG
Propyl gallate
ROS
Reactive oxygen species
SOD
Superoxide dismutase
TAC
Total antioxidant capacity
TBA
Thiobarbituric acid
TBARS
Thiobarbituric acid–reactive substances
TBHQ
Tert-butyl hydroquinone
TEAC
Trolox® equivalent antioxidant capacity
TPTZ
Tripyridyltriazine
TRAP
Total peroxyl radical-trapping antioxidant parameter

References and Notes

  1. Bennick, A. Interaction of Plant Polyphenols with Salivary Proteins. Crit. Rev. Oral Biol. Med. 2002, 13, 184–196. [Google Scholar] [CrossRef]
  2. Robards, K.; Antolovich, M. Analytical Chemistry of Fruit Bioflavonoids. A Review. Analyst 1997, 122, 11–34. [Google Scholar] [CrossRef]
  3. Balasundram, N.; Sundram, K.; Samman, S. Phenolic Compounds in Plants and Agri-Industrial By-Products: Antioxidant Activity, Occurrence, and Potential Uses. Food Chem. 2006, 99, 191–203. [Google Scholar] [CrossRef]
  4. Harborne, J.B.; Simmonds, N.W. The natural distribution of the phenolic aglycones. In Biochemistry of phenolic compounds; Academic Press: New York, 1964; pp. 77–127. [Google Scholar]
  5. Mehansho, H.; Butler, L.G.; Carlson, D.M. Dietary Tannins and Salivary Proline-Rich Proteins: Interactions, Induction and Defense Mechanisms. Ann. Rev. Nutr. 1987, 7, 423–440. [Google Scholar] [CrossRef]
  6. Khanbabaee, K.; Van Ree, T. Tannins: Classification and Definition. Nat. Prod. Rep. 2001, 18, 641–649. [Google Scholar]
  7. Porter, L.J. Tannins. In Methods in Plant Biochemistry; Vol. I, Plant Phenolics; Dey, P.M., Harborne, J.B., Eds.; Academic Press: San Diego, CA, 1989; pp. 389–419. [Google Scholar]
  8. Middleton, E., Jr.; Kandaswami, C. The Impact of Plant Flavonoids on Mammalian Biology: Implications for Immunity, Inflammation and Cancer. In The Flavonoids. Advances since 1986; Harborne, J.B., Ed.; London: Chapman and Hall, 1994; pp. 619–645. [Google Scholar]
  9. Bombardelli, E.; Morazzoni, P. The Flavonoids: New Perspectives in Biological Activities and Therapeutics. Chimicaoggi 1993, 25–28. [Google Scholar]
  10. Niki, E.; Noguchi, N. Evaluation of Antioxidant Capacity. What Capacity is Being Measured by Which Method? IUBMB Life 2000, 50, 323–329. [Google Scholar] [CrossRef]
  11. Gutteridge, J.M.C. Free Radicals and Aging. Rev. Clin. Gerontol. 1994, 4, 279–288. [Google Scholar] [CrossRef]
  12. Madhavi, D. L.; Deshpande, S. S.; Salunkhe, D. K. Introduction. Food Antioxidants: Technological, Toxicological, and Health Perspectives; Madhavi, D. L., Deshpande, S. S., Salunkhe, D.K., Eds.; Marcel Dekker, Inc.: New York, NY., 1996; pp. 1–4. [Google Scholar]
  13. Sokmen, A.; Sokmen, M.; Daferera, D.; Polissiou, M.; Candan, F.; Unlu, M.; Akpulat, H.A. The in Vitro Antioxidant and Antimicrobial Activities of The Essential Oil and Methanol Extracts of Achillea biebersteini Afan. (Asteraceae). Phytother Res. 2004, 18, 451–456. [Google Scholar] Oskay, E.; Yeşilada, A. Four Flavonoids and Three Other Constituents from Achillea Biebersteinii. J. Nat. Prod. 1984, 47, 742. [Google Scholar]
  14. Harborne, J.B.; Williams, C.A. Advances in Flavonoid Research since 1992. Phytochemistry 2000, 55, 481–504. [Google Scholar] El, S.N.; Karakaya, S. Radical Scavenging and Iron-chelating Activities of Some Greens Used as Traditional Dishes in Mediterranean Diet. Int. J. Food Sci. Nutr. 2004, 55, 67–74. [Google Scholar]
  15. Coruh, N.; Sağdıçoğlu Celep, A.G.; Özgökçe, F.; İşcan, M. Antioxidant Capacities of Gundelia tournefortii L. Extracts and Inhibition on Glutathione-S-Transferase Activity. Food Chem. 2007, 100, 1249–1253. [Google Scholar] [CrossRef]
  16. Justesen, U.; Knuthsen, P. Composition of Flavonoids in Fresh Herbs and Calculation of Flavonoid Intake by Use of Herbs in Traditional Danish Dishes. Food Chem. 2001, 73, 245–250. [Google Scholar] [CrossRef]
  17. Silva, B.A.; Ferreres, F.; Malva, J.O.; Dias, A.C.P. Phytochemical and Antioxidant Characterization of Hypericum Perforatum Alcoholic Extracts. Food Chem. 250, 90, 157–167. [Google Scholar] Cakir, A.; Mavi, A.; Yıldırım, A.; Duru, M.E.; Harmandar, M.; Kazaz, C. Isolation and Characterization of Antioxidant Phenolic Compounds from the Aerial Parts of Hypericum hyssopifolium L. by Activity-Guided Fractionation. J. Ethnopharm. 2003, 87, 73–83. [Google Scholar]
  18. Dorman, H.J.; Bachmayer, O.; Kosar, M.; Hiltunen, R. Antioxidant Properties of Aqueous Extracts from Selected Lamiaceae Species Grown in Turkey. J. Agric. Food Chem. 2004, 52, 762–770. [Google Scholar] [CrossRef]
  19. Günzler, H.; Bahadir, A.M.; Vorsdorf, R.; Danzer, K.; Fresenius, W.; Galensa, R.; Huber, W.; Linscheid, M.; Lüderwald, I.; Schwedt, G.; Tölg, G.; Wisser, H. Analytiker Taschenbuch; Springer: Berlin, Heidelberg, New York, 1997; Volume 15, pp. 147–178. [Google Scholar] Akgül, A.; Ayar, A. Yerli Baharatların Antioksidan Etkileri. J. Agric. For. 1993, 17, 1061–1069. [Google Scholar] (c)Tuzlacı, E. Datça Yarımadası (Muğla) Florası ve Bu Yörede Halkın Yararlandığı Bitkiler. 14. Bitkisel İlaç Hammaddeleri Toplantısı, Bildiriler. 2002. [Google Scholar] Everest, A.; Ozturk, E. Focusing on the Ethnobotanical Uses of Plants in Mersin and Adana Provinces (Turkey). J. Ethnobiol. Ethnomed. 2005, 1, 1–6. [Google Scholar]
  20. Stocker, P.; Yousfi, M.; Djerridane, O.; Perrier, J.; Amziani, R.; El Boustani, S.; Moulin, A. Effect of Flavonoids from Various Mediterranean Plants on Enzymatic Activity of Intestinal Carboxylesterase. Biochimie 2004, 86, 919–925. [Google Scholar] [CrossRef]
  21. zgen, U.; Mavi, A.; Terzi, Z.; Yildirim, A.; Coşkun, M.; Houghton, P.J. Antioxidant Properties of Some Medicinal Lamiaceae (Labiatae) Species. Pharm. Bio. 2006, 44, 107–112. [Google Scholar] [CrossRef]
  22. Lorenc-Kukula, K.; Amarowicz, R.; Oszmianski, J.; Doermann, P.; Starzycki, M.; Skala, J.; Zuk, M.; Kumla, A.; Szopa, J. Pleiotropic Effect of Phenolic Compounds Content Increases in Transgenic Flax Plant. J. Agric. Food Chem. 2005, 53, 3685–3692. [Google Scholar] [CrossRef]
  23. Deliorman, D.; Çalış, I.; Ergun, F.; Uydeş; Doğan, B.S.; Buharalıoğlu, C.K.; Kanzık, I. Studies on the Vascular Effects of the Fractions and Phenolic Compounds Isolated from Viscum album ssp. Album. J. Ethnopharm. 2000, 72, 323–329. [Google Scholar] [CrossRef]
  24. Mavi, A.; Terzi, Z.; Ozgen, U.; Yildirim, A.; Coskun, M. Antioxidant Properties of Some Medicinal Plants: Prangos ferulacea (Apiaceae), Sedum sempervivoides (Crassulaceae), Malva neglecta (Malvaceae). Cruciata taurica (Rubiaceae), Rosa pimpinellifolia (Rosaceae), Galium verum subsp. verum (Rubiaceae), Urtica dioica (Urticaceae). Biol. Pharm. Bull. 2004, 27, 702–705. [Google Scholar] [CrossRef]
  25. Gülcin, I.; Küfrevioğlu, O. I.; Oktay, M.; Büyükokuroğlu, M.E. Antioxidant, Antimicrobial, Antiulcer and Analgesic Activities of Nettle (Urtica dioica L.). J. Ethnopharm. 2004, 90, 205–215. [Google Scholar]
  26. Candan, F.; Somken, A. Effects of Rhus coriaria L. (Anacardiaceae) on Lipid Peroxidation and Free Radical Scavenging Activity. Phytother. Res. 2004, 18, 84–86. [Google Scholar] Candan, F. Effect of Rhus coriaria L. (Anacardiaceae) on Superoxide Radical Scavenging and Xanthine Oxidase Activity. J. Enz. Inhib. Med. Chem. 2003, 18, 59–62. [Google Scholar] Bozkurt, H. Investigation of the Effect of Sumac Extract and BHT Addition on the Quality of Sucuk (Turkish dry-fermented sausage). J. Sci. Food Agric. 2006, 86, 849–856. [Google Scholar]
  27. Velioglu, Y.S.; Ekici, L.; Poyrazoglu, E.S. Phenolic Composition of European Cranberrybush (Viburnum opulus L.) Berries and Astringency Removal of Its Commercial Juice. Int. J. Food Sci. Techol. 2006, 41, 1011–1015. [Google Scholar] [CrossRef]
  28. Peterson, J.; Dwyer, J. Taxonomic Classification Helps Identify Flavonoid Containing Foods on Semiquantitative Food Frequency Questionnaire. J. Am. Diet. Assoc. 1998, 98, 677–685. [Google Scholar] Mongkolsilp, S.; Pongbupakit, I.; Sae-Lee, N.; Sitthithaworn, W. Radical Scavenging Activity and Total Phenolic Content of Medicinal Plants Used in Primary Health Care. SWU J. Pharm. Sci. 2004, 9, 32–35. [Google Scholar]
  29. Li, L.; Tsao, R.; Yang, R.; Liu, C.; Zhu, H.; Young, J.C. Polyphenolic Profiles And Antioxidant Activities Of Heartnut (Juglans ailanthifolia Var. Cordiformis) And Persian Walnut (Juglans regia L.). J. Agric. Food Chem. 2006, 54, 8033–8040. [Google Scholar] [CrossRef]
  30. Kristó, Sz.T.; Ganzler, K.; Apáti, P.; Szoke, É.; Kéry, Á. Analysis of Antioxidant Flavonoids from Asteraceae and Moraceae Plants by Capillary Electrophoresis. Chromatographia 2002, 56, 121–126. [Google Scholar] [CrossRef]
  31. Ricci, D.; Giamperi, L.; Bucchini, A.; Fraternale, D. Antioxidant Activity of Punica Granatum Fruits. Fitoterapia 2006, 77, 310–312. [Google Scholar] Ghisoelli, A.; Serafini, M.; Maiani, G.; Azzini, E.; Ferro-Luzzi, A. A Fluorescence-Based Method for Measuring Total Plasma Antioxidant Capability. Free Radic. Biol. Med. 1995, 18, 29–36. [Google Scholar]
  32. Ayranci, E.; Tunc, S. The Effect of Edible Coatings on Water and Vitamin C Loss of Apricots (Armeniaca Vulgaris Lam.) and Green Peppers (Capsicum Annuum L.). Food Chem. 2004, 87, 339–342. [Google Scholar] Häkkinen, S. Flavonols and Phenolic Acids in Berries and Berry Products. Doctoral Dissertation, Kuopio University Publications D. Medical Sciences 221, 2000. [Google Scholar] De Simón, F.B.; Pérez-Ilzarbe, J.; Hernández, T.; Gómez-Cordovés, C.; Estrella, I. Importance of Phenolic Compounds for the Characterization of Fruit Juices. J. Agric. Food Chem. 1992, 40, 1531–1535. [Google Scholar] Tomás-Lorente, F.; Garcia-Viguera, C.; Ferreres, F.; Tomás-Barberán, F.A. Phenolic Compounds Analysis in the Determination of Fruit Jam Genuineness. J. Agric. Food Chem. 1992, 40, 1800–1804. [Google Scholar]
  33. Hamauzu, Y.; Yasui, H.; Inno, T.; Kume, C.; Omanyuda, M. Phenolic Profile, Antioxidant Property, and Anti-Influenza Viral Activity of Chinese Quince (Pseudocydonia sinensis Schneid.), Quince (Cydonia oblonga Mill.), and Apple (Malus domestica Mill.) Fruits. J. Agric. Food Chem. 2005, 53, 928–934. [Google Scholar]
  34. Schieber, A.; Keller, P.; Carle, R. Determination of Phenolic Acids and Flavonoids of Apple and Pear by High-Performance Liquid Chromatography. J. Chrom. A. 2001, 910, 265–273. [Google Scholar] [CrossRef]
  35. Daels-Rakotoarison, D.A.; Gressier, B.; Trotin, F.; Brunet, C.; Luyckx, M.; Dine, T.; Bailleul, F.; Cazin, M.; Cazin, J.C. Effects of Rosa canina Fruit Extract on Neutrophil Respiratory Burst. Phytother Res. 2002, 16, 157–161. [Google Scholar] Gao, X.; Bjork, L.; Trajkovski, V.; Uggla, M. Evaluation of Antioxidant Activities of Rosehip Ethanol Extracts in Different Test Systems. J. Sci. Food Agric. 2000, 80, 2021–2027. [Google Scholar]
  36. Del Río, J.A.; Fuster, M.D.; Gómez, P.; Porras, I.; García -Lidón, A.; Ortuño, A. Citrus Limon: A Source of Flavonoids of Pharmaceutical Interest. Food Chem. 2004, 84, 457–461. [Google Scholar] [CrossRef]
  37. Perucka, I.; Materska, M. Phenylalanine Ammonia-Lyase and Antioxidant Activities of Lipophilic Fraction of Fresh Pepper Fruits Capsicum Annum L. Innov. Food Sci. Emerg. Techn. 2001, 2, 189–192. [Google Scholar] [CrossRef]
  38. Bilgiçli, N.; Elgün, A.; Türker, S. Effects of Various Phytase Sources on Phytic Acid Content, Mineral Extractability ond Protein Digestibility of Tarhana. Food Chem. 2006, 98, 329–337. [Google Scholar] Tokuşoğlu, Ö.; Ünal, M.K.; Yildirim, Z. HPLC-UV and GC-MS Characterization of the Flavonol Aglycons Quercetin, Kaempferol, and Myricetin in Tomato Pastes and Other Tomato-Based Products. Acta Chromatogr. 2003, 13, 196–207. [Google Scholar]
  39. Fauconneau, B.; Waffo-Teguo, P.; Huguet, F.; Barrier, L.; Decendit, A.; Merillon, J.M. Comparative Study of Radical Scavenger and Antioxidant Properties of Phenolic Compounds from Vitis vinifera Cell Cultures Using in vitro Tests. Life Sci. 1997, 61, 2103–2110. [Google Scholar]
  40. Shon, M.Y.; Choi, S.D.; Kahng, G.G.; Nam, S.H.; Sung, N.J. Antimutagenic, Antioxidant and Free Radical Scavenging Activity of Ethyl Acetate Extracts From White, Yellow and Red Onions. Food Chem. Tox. 2004, 42, 659–666. [Google Scholar] Lanzotti, V. The Analysis of Onion and Garlic. J. Chrom. A. 2006, 1112, 3–22. [Google Scholar] Franke, A.A.; Custer, L.J.; Arakaki, C.; Murphy, S.P. Vitamin C and Flavonoid Levels of Fruits and Vegetables Consumed in Hawaii. J. Food Compos. Analy. 2004, 17, 1–35. [Google Scholar]
  41. Pedreschi, R.; Cisneros-Zevallos, L. Antimutagenic and Antioxidant Properties of Phenolic Fractions from Andean Purple Corn (Zea mays L.). J. Agric. Food Chem. 2006, 54, 4557–4567. [Google Scholar] [CrossRef]
  42. Whitaker, B.D.; Stommel, J.R. Distribution of Hydroxycinamic Acid Conjugates in Fruit of Commercial Eggplant (Solanum melongena L.) Cultivars. J. Agric. Food Chem. 2003, 51, 3448–3454. [Google Scholar] [CrossRef]
  43. Reyes, L.F.; Cisneros-Zevallos, L. Wounding Stress Increases the Phenolic Content and Antioxidant Capacity of Purple-Flesh Potatoes (Solanum tuberosum L.). J. Agric. Food Chem. 2003, 51, 5296–5300. [Google Scholar] Swain, T.; Hillis, W.E. The Phenolic Constituents of Prunus domestica. I. -The Quantitative Analysis of Phenolic Constituents. J. Sci. Food Agric. 1959, 10, 63–68. [Google Scholar] Brand-Williams, W.; Cuvelier, M.E.; Berset, C. Use of a Free Radical Method to Evaluate Antioxidant Activity. Lebensm. Wiss. Technol. 1995, 28, 25–30. [Google Scholar]
  44. Dueñas, M.; Hernández, T.; Estrella, I. Assessment of in Vitro Antioxidant Capacity of the Seed Coat and the Cotyledon of Legumes in Relation to Their Phenolic Contents. Food Chem. 2006, 98, 95–103. [Google Scholar] [CrossRef]
  45. Jiratanan, T.; Liu, R.H. Antioxidant Activity of Processed Table Beets (Beta vulgaris var, conditiva) and Green Beans (Phaseolus vulgaris L.). J. Agric. Food Chem. 2004, 52, 2659–2670. [Google Scholar] [CrossRef]
  46. Ames, B.N.; Shigenaga, M.K.; Hagen, T.M. Oxidants, Antioxidants, and the Degenerative Diseases of Aging. Proc. Natl. Acad. Sci., USA. 1993, 90, 7915–7922. [Google Scholar]
  47. Niki, E. Antioxidant Activity: Are We Measuring It Correctly? Nutrition 2002, 18, 524–525. [Google Scholar] [CrossRef]
  48. Huang, D.; Ou, B.; Prior, R.L. The Chemistry Behind Antioxidant Capacity Assays. J. Agric. Food Chem. 2005, 53, 1841–1856. [Google Scholar] [CrossRef]
  49. Cao, G.; Sofic, E.; Prior, R.L. Antioxidant and Prooxidant Behavior of Flavonoids: Structure-Activity Relationships. Free Radic. Biol. Med. 1997, 22, 749–760. [Google Scholar] [CrossRef]
  50. Zheng, L.-F.; Wei, Q.-Y.; Cai, Y.-J.; Fang, J.G.; Zhou, B.; Yang, L.; Liu, Z.-L. DNA Damage Induced by Resveratrol and Its Synthetic Analogues in the Presence of Cu(II) Ions: Mechanism and Structure-Activity Relationship. Free. Radic. Biol. Med. 2006, 41, 1807–1816. [Google Scholar] [CrossRef]
  51. Bors, W.; Hellers, W.; Michel, C.; Saran, M. Radical Chemistry of Flavonoid Antioxidants. In Antioxidants in Therapy and Preventive Medicine; Emerit, I., Ed.; Plenum Pub Corp; 1999a; Volume 1, pp. 165–170. [Google Scholar] Bors, W.; Hellers, W.; Michel, C.; Saran, M. Flavonoids as Antioxidants: Determination of Radical-Scavenging Efficiencies. Meth. Enzymol. 1990b, 186, 343–355. [Google Scholar]
  52. Van Acker, S.A.B.E.; van den Berg, D.-J.; Tromp, M.N.J.L.; Griffioen, D.H.; van Bennekom, W.P.; van der Vijgh, W.J.F.; Bast, A. Structural Aspects of Antioxidant Activity of Flavonoids. Free Radic. Biol. Med. 1996, 20, 331–342. [Google Scholar] [CrossRef]
  53. Pietta, P.-G. Flavonoids as Antioxidants. J. Nat. Prod. 2000, 63, 1035–1042. [Google Scholar] [CrossRef]
  54. Firuzi, O.; Lacanna, A.; Petrucci, R.; Marrosu, G.; Saso, L. Evaluation of The Antioxidant Activity of Flavonoids by "Ferric Reducing Antioxidant Power" Assay and Cyclic Voltammetry. Biochim. Biophys. Acta 2005, 1721, 174–184. [Google Scholar] [CrossRef]
  55. Seeram, N.P.; Nair, M.G. Inhibition of Lipid Peroxidation and Structure-Activity-Related Studies of the Dietary Constituents Anthocyanins, Anthocyanidins, and Catechins. J. Agric. Food Chem. 2002, 50, 5308–5312. [Google Scholar] [CrossRef]
  56. Tripoli, E.; Guardia, M.L.; Giammanco, S.; Majo, D.D.; Giammanco, M. Citrus Flavonoids: Molecular Structure, Biological Activity and Nutritional Properties: A Review. Food Chem. 2007, 104, 466–479. [Google Scholar] [CrossRef]
  57. Rice-Evans, C.A.; Miller, N.J.; Paganga, G. Antioxidant Properties of Phenolic Compounds. Trends Plant Sci. 1997, 2, 152–159. [Google Scholar] [CrossRef]
  58. Rice-Evans, C.A.; Miller, N.J.; Paganga, G. Structure-Antioxidant Activity Relationships of Flavonoids and Phenolic Acids. Free Radic. Biol. Med. 1996, 20, 933–956. [Google Scholar] [CrossRef]
  59. Cai, Y.-Z.; Sun, M.; Xing, J.; Luo, Q.; Corke, H. Structure-Radical Scavenging Activity Relationships of Phenolic Compounds from Traditional Chinese Medicinal Plants. Life Sci. 2006, 78, 2872–2888. [Google Scholar] [CrossRef]
  60. Halliwell, B.; Gutteridge, J.M.C. Free Radicals in Biology and Medicine; Oxford University Press: Oxford, UK, 1989. [Google Scholar]
  61. Halliwell, B.; Aruoma, O.I. DNA Damage by Oxygen-Derived Species. Its Mechanism and Measurement in Mammalian Systems. FEBS Lett. 1991, 281, 9–19. [Google Scholar] [CrossRef]
  62. Ghiselli, A.; Serafini, M.; Natella, F.; Scaccini, C. Total Antioxidant Capacity as a Tool to Assess Redox Status: Critical View and Experimental Data. Free Radic. Biol. Med. 2000, 29, 1106–1114. [Google Scholar] [CrossRef]
  63. Prior, R.L.; Wu, X.; Schaich, K. Standardized Methods for the Determination of Antioxidant Capacity and Phenolics in Foods and Dietary Supplements. J. Agric. Food Chem. 2005, 53, 4290–4302. [Google Scholar] [CrossRef]
  64. Pulido, R.; Bravo, L.; Saura-Calixto, F. Antioxidant Activity of Dietary Polyphenols as Determined by A Modified Ferric Reducing/Antioxidant Power Assay. J. Agric. Food Chem. 2000, 48, 3396–3402. [Google Scholar] [CrossRef] [Green Version]
  65. Cao, G.; Verdon, C.P.; Wu, A.H.B.; Wang, H.; Prior, R.L. Automated Assay of Oxygen Radical Absorbance Capacity with The COBAS FARA II. Clin. Chem. 1995, 41, 1738–1744. [Google Scholar]
  66. Glazer, A.N. Phycoerythrin Fluorescence-Based Assay for Reactive Oxygen Species. Methods Enzymol. 1990, 186, 161–168. [Google Scholar] [CrossRef]
  67. Cao, G.; Alessio, H.M.; Cutler, R.G.; Alessio, H.M. Oxygen-Radical Absorbance Capacity Assay for Antioxidants. Free Radic. Biol.Med. 1993, 14, 303–311. [Google Scholar] [CrossRef]
  68. Ghiselli, A.; Serafini, M.; Maiani, G.; Azzini, E.; Ferro-Luzzi, A. A Fluorescence-Based Method for Measuring Total Plasma Antioxidant Capability. Free Radic. Biol.Med. 1995, 18, 29–36. [Google Scholar] [CrossRef]
  69. Ou, B.; Hampsch-Woodill, M.; Prior, R.L. Development and Validation of An Improved Oxygen Radical Absorbance Capacity Assay Using Fluorescein as The Fluorescent Probe. J. Agric. Food Chem. 2001, 49, 4619–4626. [Google Scholar] [CrossRef]
  70. Wayner, D.D.M.; Burton, G.W.; Ingold, K.U.; Locke, S. Quantitative Measurement of The Total, Peroxyl Radical-Trapping Antioxidant Capability of Human Blood Plasma by Controlled Peroxidation. The Important Contribution Made By Plasma Proteins. FEBS Lett. 1985, 187, 33–37. [Google Scholar] [CrossRef]
  71. Bors, W.; Michel, C.; Saran, M. Inhibition of The Bleaching of The Carotenoid Crocin. A Rapid Test for Quantifying Antioxidant Activity. Biochim. Biophys. Acta - Lipids Lipid Metab. 1984, 796, 312–319. [Google Scholar] [CrossRef]
  72. Burda, S.; Oleszek, W. Antioxidant and Antiradical Activities of Flavonoids. J. Agric. Food Chem. 2001, 49, 2774–2779. [Google Scholar] [CrossRef]
  73. Miller, N.J.; Rice-Evans, C.A.; Davies, M.J.; Gopinathan, V.; Milner, A. A Novel Method for Measuring Antioxidant Capacity and Its Application to Monitoring the Antioxidant Status in Premature Neonates. Clin. Sci. 1993, 84, 407–412. [Google Scholar]
  74. Re, R,; Pellegrini, N.; Proteggente, A.; Pannala, A.; Yang, M. Antioxidant Activity Applying An Improved ABTS Radical Cation Decolorization Assay. Free Radical Biol Med. 1999, 26, 1231–1237. [Google Scholar] [CrossRef]
  75. Brand-Williams, W.; Cuvelier, M.E.; Berset, C. Use of a Free Radical Method to Evaluate Antioxidant Activity. Lebensm. Wiss. Technol. 1995, 28, 25–30. [Google Scholar] [CrossRef]
  76. Bondet, V.; Brand-Williams, W.; Berset, C. Kinetics and Mechanisms of Antioxidant Activity Using The DPPH• Free Radical Method. Food Sci. Technol. 1997, 30, 609–615. [Google Scholar]
  77. Sanchez-Moreno, C.; Larrauri, J.A.; Saura-Calixto, F.A. A Procedure to Measure the Antiradical Efficiency of Polyphenols. J. Sci. Food Agric. 1998, 76, 270–276. [Google Scholar] [CrossRef]
  78. Folin, O.; Ciocalteu, V. On Tyrosine and Tryptophane Determinations in Proteins. J. Biol. Chem. 1927, 73, 627–650. [Google Scholar]
  79. Singleton, V.L.; Orthofer, R.; Lamuela-Raventos, R.M. Analysis of Total Phenols and Other Oxidation Substrates and Antioxidants by Means of Folin-Ciocalteu Reagent. Meth. Enzymol. 1999, 299, 152–178. [Google Scholar] [CrossRef]
  80. Benzie, I.F.F.; Strain, J.J. The Ferric Reducing Ability of Plasma (FRAP) as a Measure of 'Antioxidant Power': The FRAP Assay. Anal. Biochem. 1996, 239, 70–76. [Google Scholar] [CrossRef]
  81. Benzie, I.F.F.; Szeto, Y.T. Total Antioxidant Capacity of Teas by The Ferric Reducing/Antioxidant Power Assay. J. Agric. Food Chem. 1999, 47, 633–636. [Google Scholar] [CrossRef]
  82. Apak, R.; Güçlü, K.; Özyürek, M.; Karademir, S.E. A Novel Total Antioxidant Capacity Index for Dietary Polyphenols, Vitamins C and E, Using Their Cupric Ion Reducing Capability in the Presence of Neocuproine: CUPRAC Method. J. Agric. Food Chem. 2004, 52, 7970–7981. [Google Scholar] [CrossRef]
  83. Apak, R.; Güçlü, K.; Ozyurek, M.; Karademir, S.E.; Altun, M. Total Antioxidant Capacity Assay of Human Serum Using Copper(II)-Neocuproine as Chromogenic Oxidant: The CUPRAC Method. Free Radic. Res. 2005, 39, 949–961. [Google Scholar]
  84. Ozyurt, D.; Demirata, B.; Apak, R. Determination of Total Antioxidant Capacity by a New Spectrophotometric Method Based on Ce(IV) Reducing Capacity Measurement. Talanta 2007, 71, 1155–1165. [Google Scholar] [CrossRef]
  85. Ewing, J.F.; Janero, D.R. Microplate Superoxide Dismutase Assay Employing a Nonenzymatic Superoxide Generator. Anal. Biochem. 1995, 232, 243–248. [Google Scholar] [CrossRef]
  86. De la Harpe, J.; Nathan, C.F. A Semi-Automated Micro-Assay for H2O2 Release by Human Blood Monocytes and Mouse Peritoneal Macrophages. J. Immunol. Methods 1985, 78, 323–336. [Google Scholar] [CrossRef]
  87. Gutteridge, J.M.C. Thiobarbituric Acid-Reactivity Following Iron-Dependent Free-Radical Damage to Amino Acids and Carbohydrates. FEBS Lett. 1981, 128, 343–346. [Google Scholar] [CrossRef]
  88. Halliwell, B.; Gutteridge, J.M.C. Formation of Thiobarbituric-Acid-Reactive Substance from Deoxyribose in The Presence of Iron Salts: The Role of Superoxide and Hydroxyl Radicals. FEBS Lett. 1981, 128, 347–352. [Google Scholar] [CrossRef]
  89. Bektasoglu, B.; Çelik, S.E.; Özyürek, M.; Güçlü, K.; Apak, R. Novel Hydroxyl Radical Scavenging Antioxidant Activity Assay for Water-Soluble Antioxidants Using a Modified CUPRAC Method. Biochem. Biophys. Res. Commun. 2006, 345, 1194–1200. [Google Scholar] [CrossRef]
  90. Frankel, E.N.; Meyer, A.S. The Problems of Using One-Dimensional Methods to Evaluate Multifunctional Food and Biological Antioxidants. J. Sci. Food Agric. 2000, 80, 1925–1941. [Google Scholar] [CrossRef]
  91. Arnao, M.B. Some Methodological Problems in the Determination of Antioxidant Activity Using Chromogen Radicals: A Practical Case. Trends Food Sci. Tech. 2000, 11, 419–421. [Google Scholar] [CrossRef]
  92. Schleiser, K.; Harwat, M.; Böhm, V.; Bitsh, R. Assessment of Antioxidant Activity by Using Different in Vitro Methods. Free Radic. Res. 2002, 36, 177–187. [Google Scholar]
  93. Awika, J.M.; Rooney, L.W.; Wu, X.; Prior, R.L.; Cisneros-Zevallos, L. Screening Methods to Measure Antioxidant Activity of Sorghum (Sorghum bicolor) and Sorghum Products. J. Agric. Food Chem. 2003, 51, 6657–6662. [Google Scholar] [CrossRef]
  94. Rice-Evans, C.A.; Miller, N.J. Total Antioxidant Status in Plasma and Body Fluids. Meth. Enzymol. 1994, 234, 279–293. [Google Scholar] [CrossRef]
  95. Cao, G.; Prior, R.L. Comparison of Different Analytical Methods for Assessing Total Antioxidant Capacity of Human Serum. Clin. Chem. 1998, 44, 1309–1315. [Google Scholar]
  96. Janaszewska, A.; Bartosz, G. Assay of Total Antioxidant Capacity: Comparison of Four Methods as Applied to Human Blood Plasma. Scand. J. Clin. Lab. Invest. 2002, 62, 231–236. [Google Scholar] [CrossRef]
  97. Robards, K.; Prenzler, P.D.; Tucker, G.; Swatsitang, P.; Glover, W. Phenolic Compounds and Their Role in Oxidative Processes in Fruits. Food Chem. 1999, 66, 401–436. [Google Scholar] [CrossRef]
  98. Ou, B.; Huang, D.; Hampsch-Woodill, M.; Flanagan, J.A.; Deemer, E.K. Analysis of Antioxidant Activities of Common Vegetables Employing Oxygen Radical Absorbance Capacity (ORAC) and Ferric Reducing Antioxidant Power (FRAP) Assays: A Comperative Study. J. Agric. Food Chem. 2002, 50, 3122–3128. [Google Scholar] [CrossRef]
  99. Kähkönen, M.P.; Hopia, A.I.; Vuorela, H.J.; Rauha, J.-P.; Pihlaja, K.; Kujala, T.S.; Heinonen, M. Antioxidant Activity of Plant Extracts Containing Phenolic Compounds. J. Agric. Food Chem. 1999, 47, 3954–3962. [Google Scholar] [CrossRef]
  100. Park, Y.-S.; Jung, S.-T.; Kang, S.-G.; Delgado-Licon, E.; Katrich, E.; Tashma, Z.; Trakhtenberg, S.; Gorinstein, S. Effect of Ethylene Treatment on Kiwifruit Bioactivity. Plant Foods Hum. Nutr. 2006, 61, 151–156. [Google Scholar] [CrossRef]
  101. Chang, C.-C.; Yang, M.-H.; Wen, H.-M.; Chern, J.-C. Estimation of Total Flavonoid Content in Propolis by two Complementary Colorimetric Methods. J. Food Drug Anal. 2002, 10, 178–182. [Google Scholar]
  102. Besada, A. A Facile and Sensitive Spectrophotometric Determination of Ascorbic Acid. Talanta 1987, 34, 731–732. [Google Scholar] [CrossRef]
  103. Berker, K.I.; Güçlü, K.; Tor, I.; Apak, R. Comparative Evaluation of Fe(III) Reducing Power-Based Antioxidant Capacity Assays in the Presence of Phenanthroline, Batho-phenanthroline, Tripyridyltriazine (FRAP), and Ferricyanide Reagents. Talanta 2007, 72, 1157–1165. [Google Scholar] [CrossRef]
  104. Ozcelik, B.; Lee, J.H.; Min, D.B. Effects of Light, Oxygen, and pH on The Absorbance of 2,2-Diphenyl-1-Picrylhydrazyl. J. Food Sci. 2003, 68, 487–490. [Google Scholar] [CrossRef]
  105. Singleton, V.L.; Rossi, J.A. Colorimetry of Total Phenolics with Phosphomolybdic-Phosphotungstic Acid Reagent. Am. J. Enol. Vitic. 1965, 16, 144–158. [Google Scholar]
  106. Noruma, T.; Kikuchi, M.; Kawakami, Y. Proton-Donative Antioxidant Activity of Fucoxanthin with 1,1-diphenyl-2-picrylhydrazyl (DPPH). Biochem. Mol. Biol. Int. 1997, 42, 361–370. [Google Scholar]
  107. Van den Berg, R.; Haenen, G.R.M.M.; Van den Berg, H.; Bast, A. Applicability of an Improved Trolox Equivalent Antioxidant Capacity (TEAC) Assay for Evaluation of Antioxidant Capacity Measurement of Mixtures. Food Chem. 1999, 66, 511–517. [Google Scholar] [CrossRef]
  108. Proteggente, A.R.; Pannala, A.S.; Paganga, G.; van Buren, L.; Wagner, E.; Wiseman, S.; van de Put, F.; Dacombe, C.; Rice-Evans, C.A. The Antioxidant Activity of Regularly Consumed Fruit and Vegetables Reflects Their Phenolic and Vitamin C Composition. Free Radic. Res. 2002, 36, 217–233. [Google Scholar] [CrossRef]
  109. Pellegrini, N.; Serafini, M.; Colombi, B.; Del Rio, D.; Salvatore, S.; Bianchi, M.; Brighenti, F. Total Antioxidant Capacity of Plant Foods, Beverages and Oils Consumed in Italy Assessed by Three Different In Vitro Assays. J. Nutr. 2003, 133, 2812–2819. [Google Scholar]
  110. Vinson, J.A.; Su, X.; Zubik, L.; Bose, P. Phenol Antioxidant Quantity and Quality in Foods: Fruits. J. Agric. Food Chem. 2001, 49, 5315–5321. [Google Scholar] [CrossRef]
  111. Miller, H.E.; Rigelhof, F.; Marquart, L.; Prakash, A.; Kanter, M. Antioxidant Content of Whole Grain Breakfast Cereals, Fruits and Vegetables. J. Am. Coll. Nutr. 2000, 19, 312–319. [Google Scholar] [CrossRef]
  112. Wu, X.; Beecher, G.R.; Holden, J.M.; Haytowitz, D.B.; Gebhardt, S.E.; Prior, R.L. Lipophilic and Hydrophilic Antioxidant Capacities of Common Foods in the United States. J. Agric. Food Chem. 2004, 52, 4026–4037. [Google Scholar] [CrossRef]
  113. Cao, G.; Sofic, E.; Prior, R.L. Antioxidant Capacity of Tea and Common Vegetables. J. Agric. Food Chem. 1996, 44, 3426–3431. [Google Scholar] [CrossRef]
  114. Apak, R.; Güçlü, K.; Özyürek, M.; Karademir, S.E.; Erçağ, E. The Cupric Ion Reducing Antioxidant Capacity (CUPRAC) and Polyphenolic Content of Some Herbal Teas. Int. J. Food Sci. Nutr. 2006, 37, 292–304. [Google Scholar]
  115. Güçlü, K.; Altun, M.; Özyürek, M.; Karademir, S.E.; Apak, R. Antioxidant Capacity of Fresh, Sun- and Sulfited-Dried Malatya Apricot (Prunus Armeniaca) Assayed by CUPRAC, ABTS/TEAC and Folin Methods. Int. J. Food Sci. Tech. 2006, 41, 76–85. [Google Scholar] [CrossRef]
  116. Paganga, G.; Miller, N.; Rice-Evans, C.A. The Polyphenolic Content of Fruit and Vegetables and Their Antioxidant Activities. What does a Serving Constitute? Free Radic. Res. 1999, 30, 153–162. [Google Scholar] [CrossRef]
  117. Velioglu, Y.S.; Mazza, G.; Gao, L.; Oomah, B.D. Antioxidant Activity and Total Phenolics in Selected Fruits, Vegetables, and Grain Products. J. Agric. Food Chem. 1998, 46, 4113–4117. [Google Scholar] [CrossRef]
  118. Tütem, E.; Apak, R.; Baykut, F. Spectrophotometric Determination of Trace Amounts of Copper(I) and Reducing Agents with Neocuproine in the Presence of Copper(II). Analyst 1991, 116, 89–94. [Google Scholar] [CrossRef]
  119. Castelluccio, C.; Bolwell, G.P.; Gerrish, C.; Rice-Evans, C.A. Differential Distribution of Ferulic Acid to the Major Plasma Constituents in relation to Its Potential as An Antioxidant. Biochem. Journal. 1996, 316, 691–694. [Google Scholar]
  120. Kanski, J.; Aksenova, M.; Stoyanova, A.; Butterfield, D.A. Ferulic Acid Antioxidant Protection Against Hydroxyl and Peroxyl Radical Oxidation in Synaptosomal and Neuronal Cell Culture Systems In Vitro: Structure-Activity Studies. J. Nutr. Biochem. 2002, 13, 273–281. [Google Scholar] [CrossRef]
  121. Tepe, B.; Eminagaoglu, O.; Akpulat, H.A.; Aydın, E. Antioxidant Potentials of Rosmarinic Acid Levels of Methanolic Extracts of Salyvia verticillata (L.) subsp. verticillata and S. verticillata (L.) subsp. amasiaca (Freyn & Bornm.) Bornm. Food Chem. 2007, 100, 985–989. [Google Scholar] [CrossRef]
  122. Chen, J.H.; Ho, C.-T. Antioxidant Activities of Caffeic Acid and Its Related Hydroxycinnamic Acid Compounds. J. Agric. Food Chem. 1997, 45, 2374–2378. [Google Scholar] [CrossRef]
  123. Cervellati, R.; Renzulli, C.; Guerra, M.C.; Speroni, E. Evaluation of Antioxidant Activity of Some Natural Polyphenolic Compounds Using the Briggs-Rauscher Reaction Method. J. Agric. Food Chem. 2002, 50, 7504–7509. [Google Scholar] [CrossRef]
  124. Kim, D.-O.; Lee, C.Y. Comprehensive Study on Vitamin C Equivalent Antioxidant Capacity (VCEAC) of Various Polyphenolics in Scavenging a Free Radical and its Structural Relationship. Critic. Rev. Food Sci. Nutr. 2004, 44, 253–273. [Google Scholar] [CrossRef]
  125. Miliauskas, G.; van Beek, T.A.; Venskutonis, P.R.; Linssen, J.P.H.; de Waard, P. Antioxidative Activity of Geranium Macrorrhizum. Eur. Food Res. Technol. 2004, 218, 253–261. [Google Scholar] [CrossRef]
  126. Çelik, S.E.; Özyürek, M.; Güçlü, K.; Apak, R. CUPRAC Total Antioxidant Capacity Assay of Lipophilic Antioxidants in Combination with Hydrophilic Antioxidants Using the Macrocyclic Oligosaccharide Methyl-β-Cyclodextrin as the Solubility Enhancer. React. Func. Polym. 2007, in press. [Google Scholar]
  127. Porter, W.L.; Black, E.; Drolet, A.M. Use of Polyamide Oxidative Fluorescence Test on Lipid Emulsions: Contrast in Relative Effectiveness of Antioxidants in Bulk Versus Dispersed Systems. J. Agric. Food Chem. 1989, 37, 615–624. [Google Scholar] [CrossRef]
  128. Frankel, E.N.; Huang, S-W.; Aeschbach, R.; Prior, E. Antioxidant Activity of a Rosemary Extract and its Constituents, Carnosic Acid, Carnosol and Rosmarinic Acid in Bulk Oil and Oil-in-Water Emulsion. J. Agric. Food Chem. 1996, 44, 131–135. [Google Scholar]
  129. Özyürek, M.; Çelik, S.E.; Berker, K.I.; Güçlü, K.; Tor, I.; Apak, R. Sensitivity Enhancement of CUPRAC and Iron(III)-Phenanthroline Antioxidant Assays by Preconcentration of Colored Reaction Products on a Weakly Acidic Cation Exchanger. React. Func. Polym. 2007, in press. [Google Scholar]
  130. Gorinstein, S.; Leontowicz, M.; Leontowicz, H.; Najman, K.; Namiesnik, J.; Park, Y.-S.; Jung, S.-T.; Kang, S.-G.; Trakhtenberg, S. Supplementation of Garlic Lowers Lipids and Increases Antioxidant Capacity in Plasma of Rats. Nutr. Res. 2006, 26, 362–368. [Google Scholar] [CrossRef]
  131. Fruhwirth, G.O.; Wagner, F.S.; Hermetter, A. The αPROX Assay: Fluorescence Screening of the Inhibitory Effects of Hydrophilic Antioxidants on Protein Oxidation. Anal. Bioanal. Chem. 2006, 384, 703–712. [Google Scholar] [CrossRef]
  132. Mazor, D.; Greenberg, L.; Shamir, D.; Meyerstein, D.; Meyerstein, N. Antioxidant Properties of Bucillamine: Possible Mode of Action. Biochem. Biophys. Res. Commun. 2006, 349, 1171–1175. [Google Scholar] [CrossRef]
  133. Ozturk, M.; Aydogmus-Ozturk, F.; Duru, M.E.; Topcu, G. Antioxidant Activity of Stem and Root Extracts of Rhubarb (Rheum ribes): An Edible Medicinal Plant. Food Chem. 2007, 103, 623–630. [Google Scholar] [CrossRef]
  134. Tütem, E.; Apak, R. Simultaneous Spectrophotometric Determination of Cystine and Cysteine in Amino Acid Mixtures Using Copper(II)-Neocuproine Reagent. Anal. Chim. Acta. 1991, 255, 121–125. [Google Scholar] [CrossRef]
  135. Halliwell, B.; Gutteridge, J.M.C. Oxygen Toxicity, Oxygen Radicals, Transition Metals and Disease. Biochem. J. 1984, 219, 1–14. [Google Scholar]
  • Sample Availability: Samples of the compounds are available from authors.

