1. Introduction
With the rapid development of information and Internet technologies, a large amount of information needs to be transmitted over the Internet, so information security has received wide attention. Digital images, as an important data content for multimedia transmission, contain a large amount of private visual information, and their secure transmission in public channels and trusted storage in cloud environments are difficult to fully guarantee [
1]. For some special fields, such as military, business, and medicine, digital images have stricter requirements for their confidentiality. As a special type of image, medical images are different from ordinary digital images, carrying important information closely related to patients’ lives and having strong sensitivity and privacy. The leakage and destruction of medical images during transmission in today’s more advanced telemedicine may cause significant damage and harm to medical institutions and individual patients, and may even constitute a threat to health and life. To facilitate the sharing and remote processing of medical images in a more secure way, many people have tried different methods, the most common ones include image encryption [
2,
3,
4], data hiding [
5,
6], and image watermarking [
7,
8]. Among these methods, image encryption is considered to be one of the most important methods for securing image data [
9].
Medical images cannot match the requirements of real-time transmission of current information because they contain a lot of data, have a slow encryption speed, and take a long time to encrypt. As a result, traditional encryption algorithms such as AES and DES [
10,
11,
12] are no longer suited for the encryption of medical images. Many researchers have discovered that chaotic systems are characterized by ergodicity, unpredictability, and sensitivity to beginning values, which makes chaos well suited for picture encryption [
13,
14,
15]. Low-dimensional chaotic systems and high-dimensional chaotic systems are the most common classifications for chaotic systems. Refs. [
16,
17] proposed a method of making a simple and effective chaotic system by using the difference of the output sequences of two identical existing one-dimension (1D) chaotic maps. Simulations and performance evaluations showed that the proposed system is able to produce a one-dimension (1D) chaotic system with better chaotic performances and larger chaotic ranges compared with the previous chaotic maps. Ref. [
18] proposed a new chaotic system that utilizes two existing one-dimensional chaotic map levels combined into one, and although its complexity and sensitivity are improved compared to the original one-dimensional map, the size of the parameter space is still finite. Ref. [
19] proposed a new two-dimensional sine improved logistic iterative chaotic map with infinite collapse (ICMIC) modulation map (2D-SLIM) based on the improved two-dimensional closed-loop modulation coupling model. The performance analysis results show that it has a large parameter space, large Lyapunov exponents, and high complexity. Ref. [
20] proposed a sixth-order cellular neural network (CNN) hyperchaotic system, in addition, an octal number communication system based on this hyperchaotic system was given. This communication system has the features of large capacity of signal transmission, high security, and good expansibility. The original information signal can be covered and recovered effectively in this octal number communication system. Ref. [
21] proposed a semi-symmetric image encryption scheme based on function projective synchronization between two hyperchaotic systems, and it has several advantages such as great speed and relatively low complexity compared respectively to symmetric and asymmetric algorithms. In particular, the key is generated simultaneously and independently in encryption and decryption sides, which effectively avoids the key transmission and threats of key exposure. Moreover, the sixth-order CNN is not only regarded as the drive system for key synchronization, but is also used for diffusing key generation to enhance the security and sensitivity of the scheme.
By comparing various encryption algorithms, Ref. [
17] uses an improved chaotic system based on a one-dimensional chaotic system, which is a low-dimensional system with few control parameters, high real-time performance, and low computational cost, but the chaotic behavior with small key space needs to be improved. In Ref. [
18], low-dimensional chaos is also used and has the same characteristics. In Refs. [
12,
19,
20,
21], high-dimensional chaos is used to compensate for the problems of low-dimensional chaotic key space and chaotic behavior. However, due to its complex structure and multiple parameters, it increases the difficulty and computational complexity of its hardware and software implementation, and its real-time performance is poor and time consumption is large. Therefore, it is necessary to use a chaotic system with few control parameters and complex chaotic behavior. In this paper, we propose a new chaotic system for a medical image encryption algorithm to address the above problems. The system consists of a one-dimensional chaotic map with one control parameter, and the bifurcation diagram, Lyapunov exponent, 0–1 test, and sample entropy analysis are performed to verify the good performance of the chaotic system. To compensate for the problem of small key space due to few control parameters, a key generation model is proposed, which not only keeps the advantages of simple and fast implementation of the original one-dimensional chaotic system, but also solves the shortcoming of insufficient key space of the one-dimensional chaotic system.
To boost encryption effectiveness, in addition to using chaotic systems with high real-time performance, the problem should be solved from the image itself, such as compressing and encrypting the image [
22,
23,
24]. Unfortunately, most compression algorithms lead to lossy image decryption, and any degradation of image quality may lead to misdiagnosis, so most methods of image compression are not suitable for medical images. Image encryption algorithms are currently classified into two types: full image encryption, which encrypts the entire image, and selective image encryption, which encrypts only a portion of the image. Selective image encryption has been popular in recent years as a way to reduce image encryption and decryption processing time while maintaining a high level of security, and has received the attention of many scientists and engineers with several encryption schemes proposed [
25,
26,
27]. For medical images, only part of an image is meaningful and the other parts are pure black regions, which can be divided into two parts, private and non-private regions, where the private region is also called the region of interest (ROI) and the non-private region is also called the region of background (ROB) [
28]. The method for selecting the region of interest is just as crucial as the encryption algorithm in the region of interest encryption technique. ROI encryption techniques can be classified into two groups based on the privacy region selection method: manually selected encryption and automatically selected encryption. The manual selection of the ROI encryption approach entails the user determining a certain privacy zone and then encrypting that region [
29,
30]. This method is time-consuming and inaccurate. As a result, a plethora of automated selection schemes have been presented. A pixel-based scanning method is proposed in the literature [
31] from the left and right sides to the center and a threshold value is used to determine the contour of the ROI. An algorithm for ROI determination of raw medical images based on block energy was proposed in the literature [
32]. Refs. [
33,
34] set the size of ROI to a rectangle in medical images and then encrypts it, however, due to the shape and size of ROI, this solution is limited and cannot adequately secure personal information. Ref. [
35] suggested a medical image encryption technique that is fully selective and chaotic. The approach is divided into rounds, and in the diffusion phase of each round, a pseudo-random matrix of the same size as the input image is used to improve the scheme’s speed while retaining good security. Ref. [
36] proposed a game theory-based ROI optimized nondestructive medical image encryption and decryption scheme. The ROI parameters are optimized using a bargaining game. This allows accurate and adaptive determination of the region of interest, adapting to a wide range of medical image types and encryption requirements. However, this requires us to test all the pixel thresholds and finally select the most suitable segmentation threshold from all the results. To address the above, we design an efficient and secure image encryption algorithm using medical image characteristics. We combine image segmentation with image encryption by first segmenting the image adaptively, segmenting the ROI according to the obtained target segmentation threshold, and encrypting only the ROI, which reduces the processing delay and resource overhead.
Contribution:
- (1)
The 1D--cos-cot (1D-ECC) chaotic map is proposed and the performance of the map is tested and analyzed, which has a wider range of control parameters. When compared to a traditional 1D chaotic system, this system has better real-time performance and chaotic behavior.
- (2)
A key generation model based on DICOM (Digital Imaging and Communications in Medicine) file information is proposed, and the initial values and control parameters of the 1D -cos-cot map (1D-ECC) chaotic map are generated using this model to further generate the keystream and expand the key space.
- (3)
A new 1D -cos-cot map (1D-ECC) medical image region of the interest-based encryption algorithm is proposed, and the simulation and security evaluation results show that the algorithm has high security and can resist common attacks.
The rest of this paper is organized as follows. The 1D
-cos-cot (1D ECC) chaotic map will be introduced in
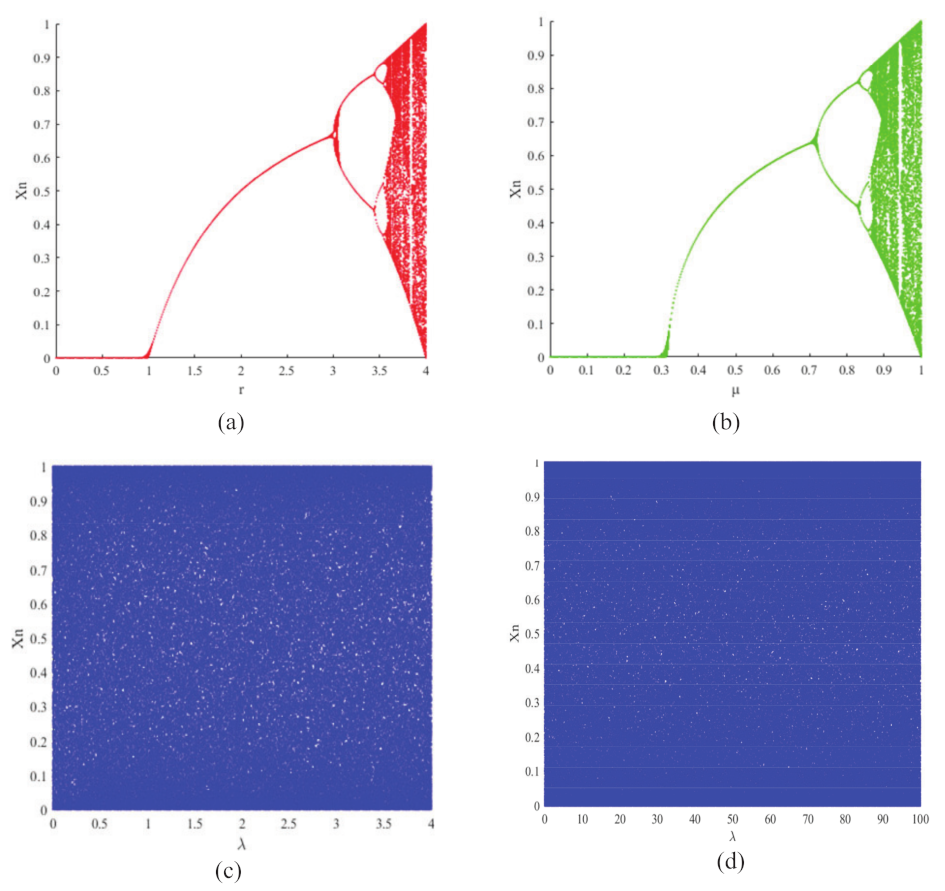
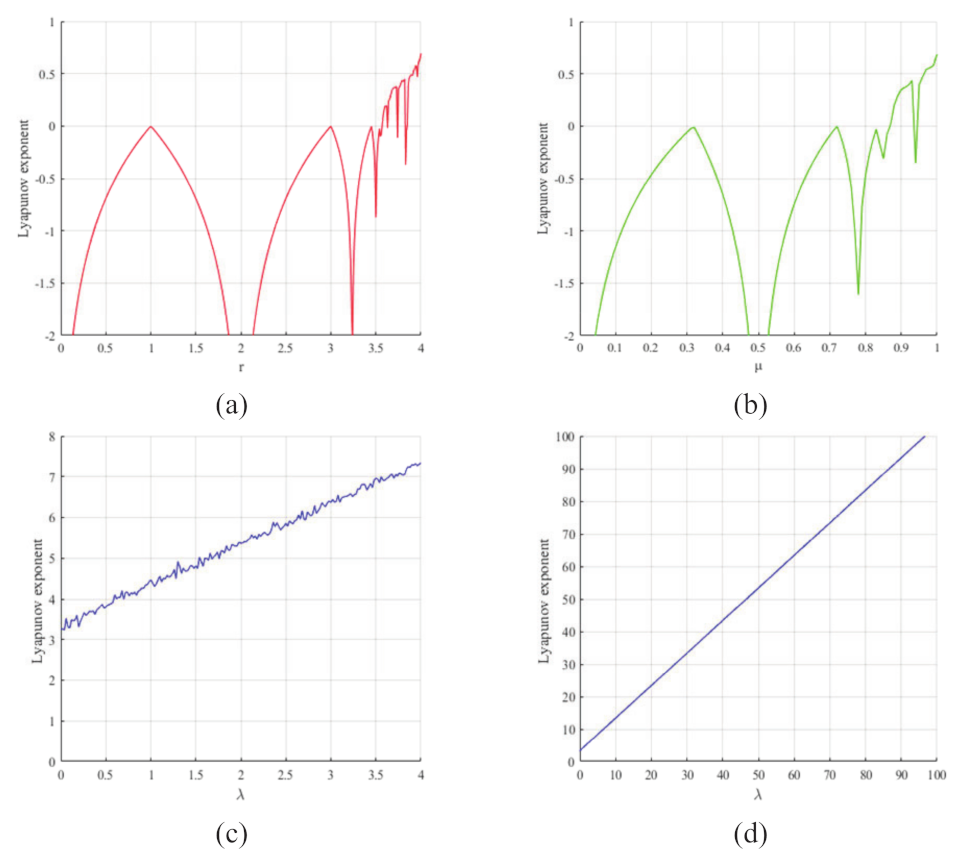
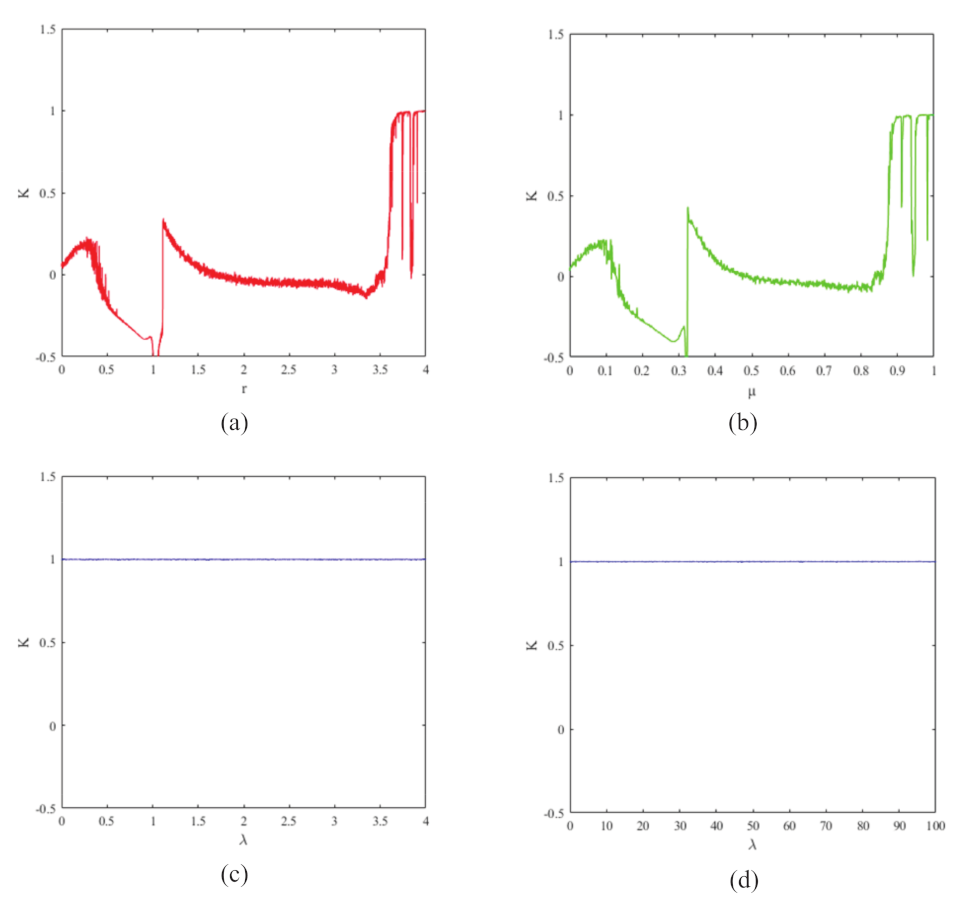
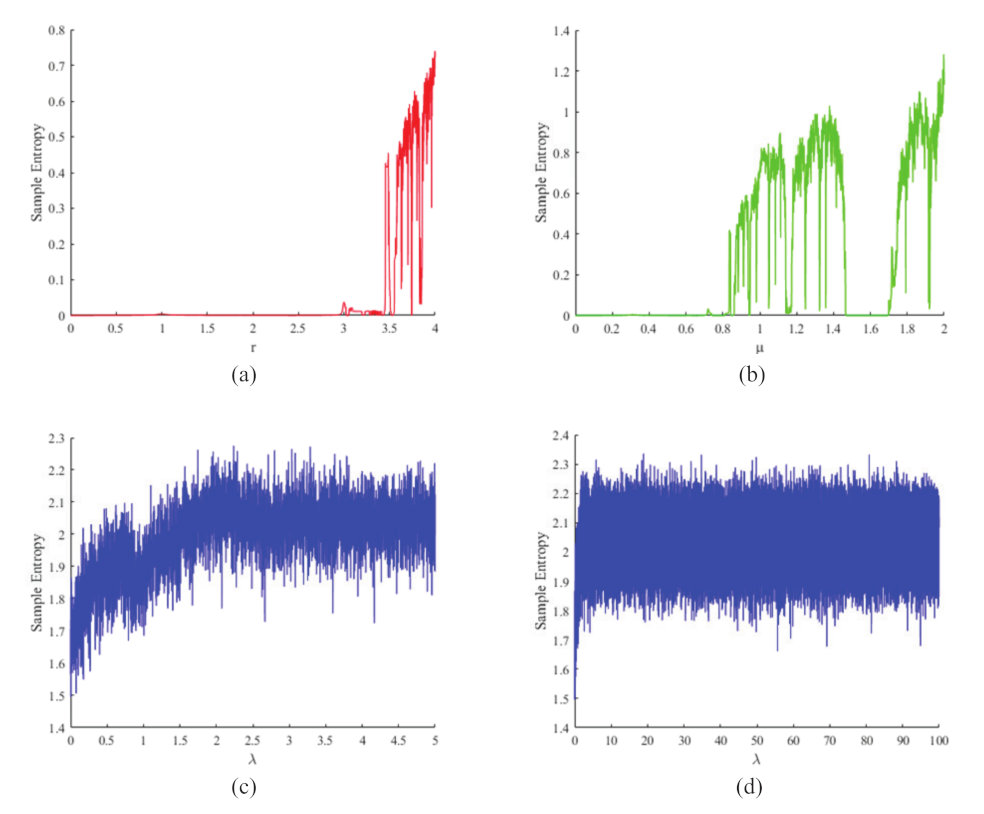
Section 2 and its performance will be evaluated using a bifurcation diagram, Lyapunov exponent, 0–1 test, and sample entropy test.
Section 3 will introduce the key generation model based on the DICOM file with a 1D-ECC chaotic map.
Section 4 will cover the implementation of the entire encryption algorithm. Simulation results will be given in
Section 5, and then the security performance of the 1D-ECC chaotic map based encryption algorithm will be further analyzed. Finally, the conclusion will be given in
Section 7.
3. DICOM File-Based Key Generation Model with 1D-ECC Chaotic Map
In this section, the DICOM standard is introduced and 1D-ECC is applied to generate encryption keys based on DICOM data information.
3.1. Introduction of DICOM
The DICOM (Digital Imaging and Communications in Medicine) standard is a standard for the communication and administration of medical imaging information and related data [
43]. The overall structure of a DICOM file is shown in
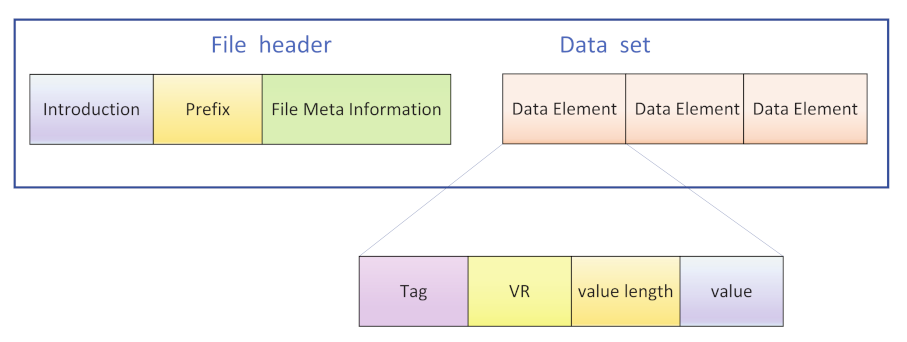
Figure 5. Each DICOM file must include a header, and the DICOM file header contains relevant information that identifies the data set. The main feature of DICOM format medical image files is that they contain not only basic information such as image size, width, height, and number of bits per pixel, but also a lot of medical information in the data elements of the data set, such as hospital name, test type, basic patient information, doctor information, etc.
The main component of a DICOM file is the data set, which consists of data elements arranged in a prescribed order, the most basic unit being the data element. For DICOM files, which are usually transferred explicitly, the data elements are arranged in the order of the tags from smallest to largest. It consists of four main parts:
- (1)
DICOM Tag: the identification of the information stored.
- (2)
VR (value representation): store the data type describing the information.
- (3)
Value length: store the length of the data describing the information.
- (4)
Value: store the data value describing the information.
DICOM Tags are classified into four groups: (a) Patient, (b) Study, (c) Series, and (d) Image’s Name.
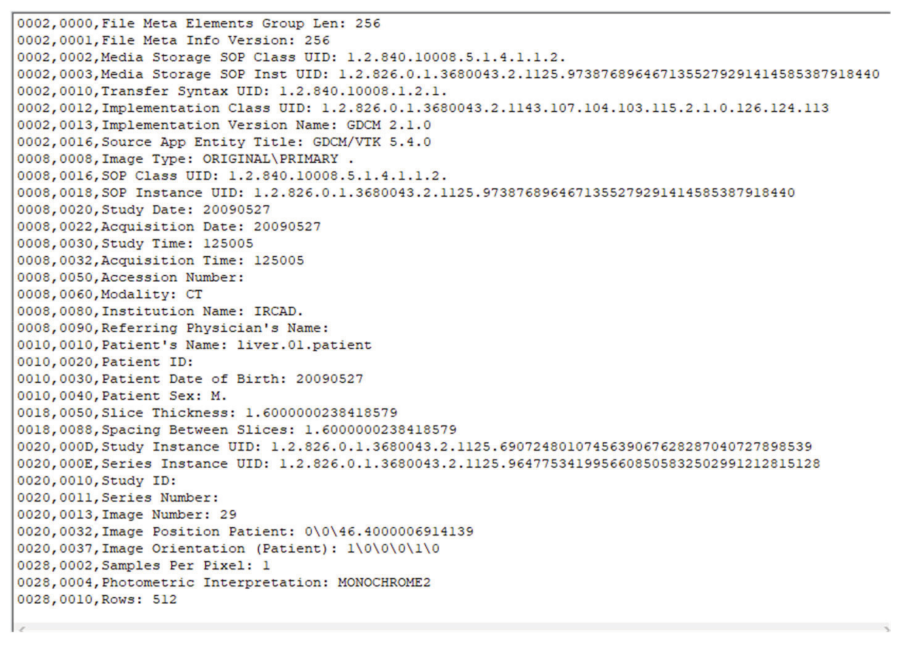
Figure 6 shows some of the data element information in the DICOM image. As shown in
Figure 6, each DICOM Tag is identified by the combination of two hexadecimal numbers, Group and Element. For example, the tag
represents the Patient’s Name, which stores the Patient Name of this DICOM image, and the tag (0010, 0030) represents the Patient Date of Birth, which stores the date of birth of the patient for this DICOM image. In DICOM, the data values stored in each tag are different. Therefore, we mainly apply the data value stored in the data element describing this information and use the data value as the key to 1D-ECC chaos mapping after processing, which ensures that the plaintext ciphertext is highly correlated and further improves the security of the algorithm.
3.2. Key Generation
As the encrypted image is closely related to the key, it is very important to use a good key generation algorithm. First, set the control parameter
and the initial value
for the 1D-ECC chaotic map as the user key. To generate the random number sequence A, the chaotic map is iterated
times. To avoid transient effects, the first 1000 sequences of random number sequence A are discarded to obtain the random number sequence B. The first six elements of the random number sequence B are selected as
, which are used to control the selection of DICOM tag information. For
, the following operations are performed to obtain
.
where
S is the total number of DICOM data elements,
, as a control pointer for DICOM data element selection, and six sets of DICOM data element information can be obtained. For example, the information obtained is:
- (1)
: SOP Instance UID (Instance UID number); UID form is a string used to uniquely identify various different information objects in the DICOM standard, such as the value representation type of data elements, DICOM abstract syntax name, transmission syntax, application context name to ensure uniqueness in various different countries, regions, manufacturers, and equipment use.
- (2)
: Patient’s Name.
- (3)
: Patient Date of Birth (the patient’s date of birth).
- (4)
: Patient ID (patient’s ID).
- (5)
: Image Date (image date).
- (6)
: Accession Number (registration number).
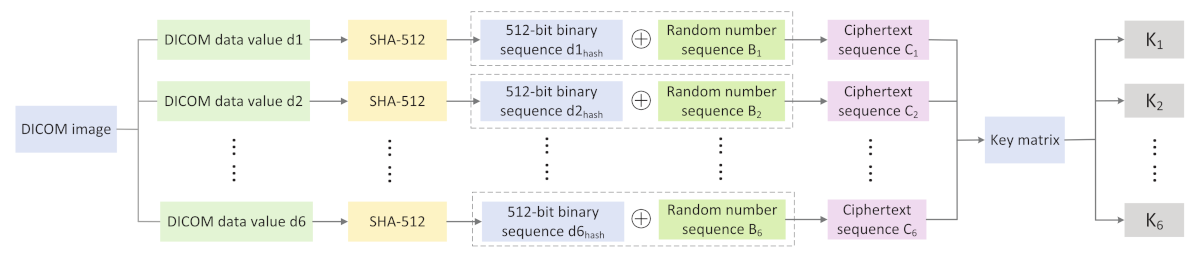
As the information in the DICOM image is public, to improve the security of the key, we carry out XOR encryption on the selected data value and use the encrypted DICOM data value to generate the key used in the subsequent encryption process, as shown in
Figure 7 The specific operations are as follows:
Step 1: The selected six groups of DICOM Tag information are noted as ;
Step 2: The hash function is irreversible, conflict-resistant, covert, and can effectively withstand known plaintext attacks and selected plaintext/ciphertext attacks when compared to the random key generation approach. Therefore, we operate on the data using SHA-512, which is part of a set of hashing algorithms called SHA-2 that performs a hash function on the given data and yields a hexadecimal string of 128 bits in length. Using this to operate on
, a hexadecimal hash string of 128 bits in length is obtained and the hash value is noted as
,
,
,
,
, and
, respectively, as shown in the following equation:
Step 3: Convert , , , , , and from hexadecimal to binary, as one hexadecimal number is equal to four binary numbers, yielding six binary sequences of length 512;
Step 4: Convert the random number sequence B from decimal to binary; for the random number B, intercept every 512 bits, intercept six times, and obtain six binary chaotic sequences of length 512 as ;
Step 5:
,
,
,
,
, and
and
are subjected to heteroskedastic operation (⊕) to obtain six ciphertext sequences
;
Step 6: divide
, i.e., each ciphertext sequence, into 32 groups (the length of each group is 16 bits), and convert them from binary to decimal to find a
decimal matrix
;
Step 7: Perform a dissimilarity operation on each element of the key in each row;
Step 8: According to the obtained
, to carry out the operation of Formula (13) to obtain the subsequent encryption process requires the control parameters
and the initial value initial value
specific operation, as shown in (14).
where
e is the information entropy of the region of interest in the image to be encrypted,
is the downward rounding function, and
is the modulo function. The addition of e ensures that the key of each encryption is highly dependent on the plaintext image and improves the correlation between the ciphertext and the plaintext.
3.3. Generation of Chaotic Sequences
Using the steps outlined above, the initial values of control parameters and the initial values are obtained, and the chaotic sequences are generated as follows:
Step 1: Substitute the obtained parameters and the initial value into the system and iterate times to obtain the chaotic sequence ;
Step 2: Substitute the obtained parameter and the initial value into the system, and iterate times to obtain the chaotic sequence ;
Step 3: Substitute the obtained parameter and the initial value into the system, and iterate times to obtain the chaotic sequence ;
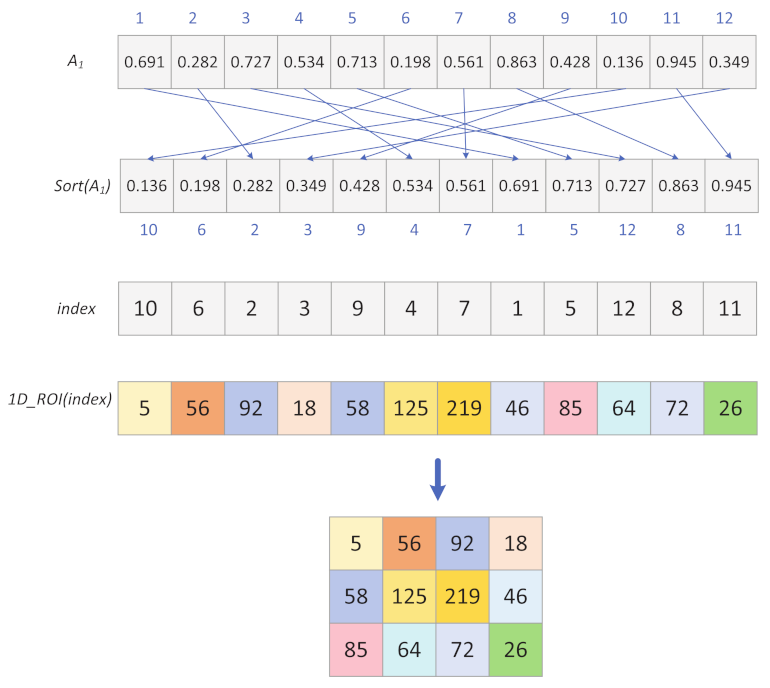
Step 4: Arrange the chaotic sequence in ascending order and record its index sequence ;
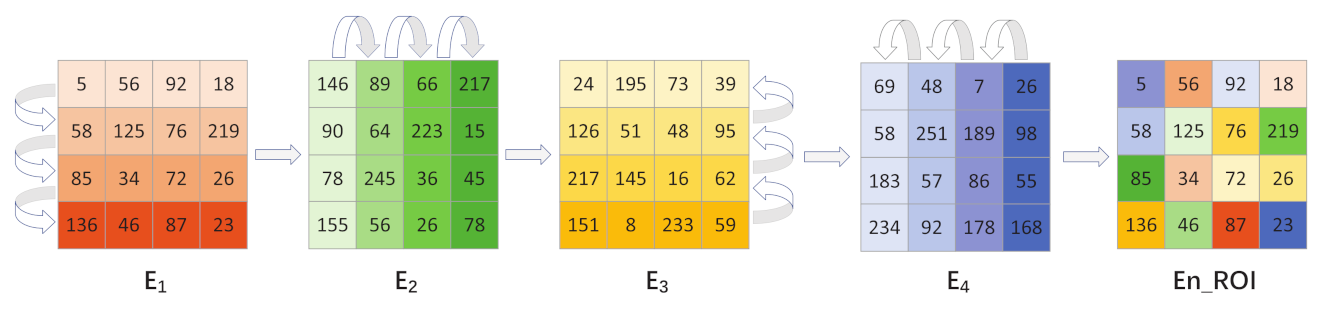
Step 5: The chaotic sequences
and
are operated as shown in (15) and (16) to obtain the diffusion key stream
and
, respectively;
Step 6: Divide the chaotic sequence into two chaotic sequences of length ;
Step 7: Divide the chaotic sequence into two chaotic sequences of length ;
Among them, the index sequence is used for the first permutation, the chaotic sequences are used for the two-dimensional bidirectional diffusion.
4. Selection of Region of Interest Blocks
In this section, the selection of target thresholds and the process of determining the region of interest (ROI) are mainly described. The OTSU threshold segmentation method is used in the region of interest block selection process to segment the region of interest in the picture and acquire the target threshold t, which will be used for the later judgment of the region of interest.
4.1. Target Threshold Segmentation
The OTSU algorithm is a fast approach for binarizing images that was proposed by Japanese researcher Otsu in 1979 [
44], and it is based on the clustering concept:
- (1)
Dividing the number of gray levels of an image into two parts by gray level, such that the difference in gray values between two parts is the largest and the difference in gray levels between each part is the smallest.
- (2)
Finding a suitable gray level to divide by the calculation of a variance.
- (3)
The traversal method is used to obtain the threshold t that maximizes the variance between classes, and t is the desired target threshold.
The OTSU method is often regarded as the best technique for image segmentation threshold selection because it is simple to implement and is unaffected by picture brightness or contrast, making it ideal for ROI segmentation in medical images.
4.2. Selection of Region of Interest
Step 1: The size of the plaintext image is , and the plaintext image is partitioned into blocks of size (n is an integer that can be divided by M and N), which are divided into S blocks, . Here, we set n to 4, and the size of each image block is .
Step 2: calculate the average of grayscale pixels for each image block according to Equation (
17).
where mean() is the mean function and
denotes the
i-th image block,
.
Step 3: The identification method of the region of interest is as follows:
When , then the image block is the region of interest , and the corresponding region of interest flag bit can be set to 1.
When , the image block is a non-interest region , and the corresponding region of interest flag bit can be set to 0.
Where t is the threshold value for determining the ROI region, which is obtained by thresholding the image by the above OTSU threshold segmentation method; where r is the image region of interest number, ; where is the corresponding flag bit of the s region of interest; and where is the number of all image blocks in the image that are discriminated as regions of interest.
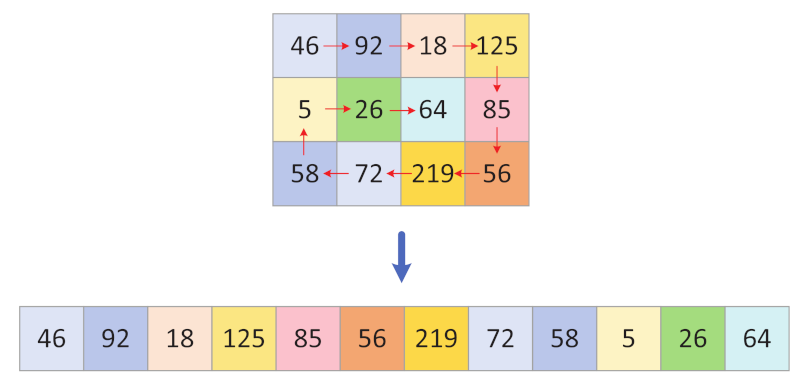
Step 4: The r region of interest sequence
are combined into a matrix in a top-down order to obtain the region of interest matrix
with length (
) and width
, operating as shown in
Figure 8.


