
Research on Product Core Component Acquisition Based on Patent Semantic Network


Abstract
:1. Introduction
2. Related Work
2.1. Methods of Patent Information Mining
2.2. Methods of Patent Analyzation
2.3. Methods of Core Component Acquisition
2.4. Summary
3. Research Framework
3.1. Overview of Core Components
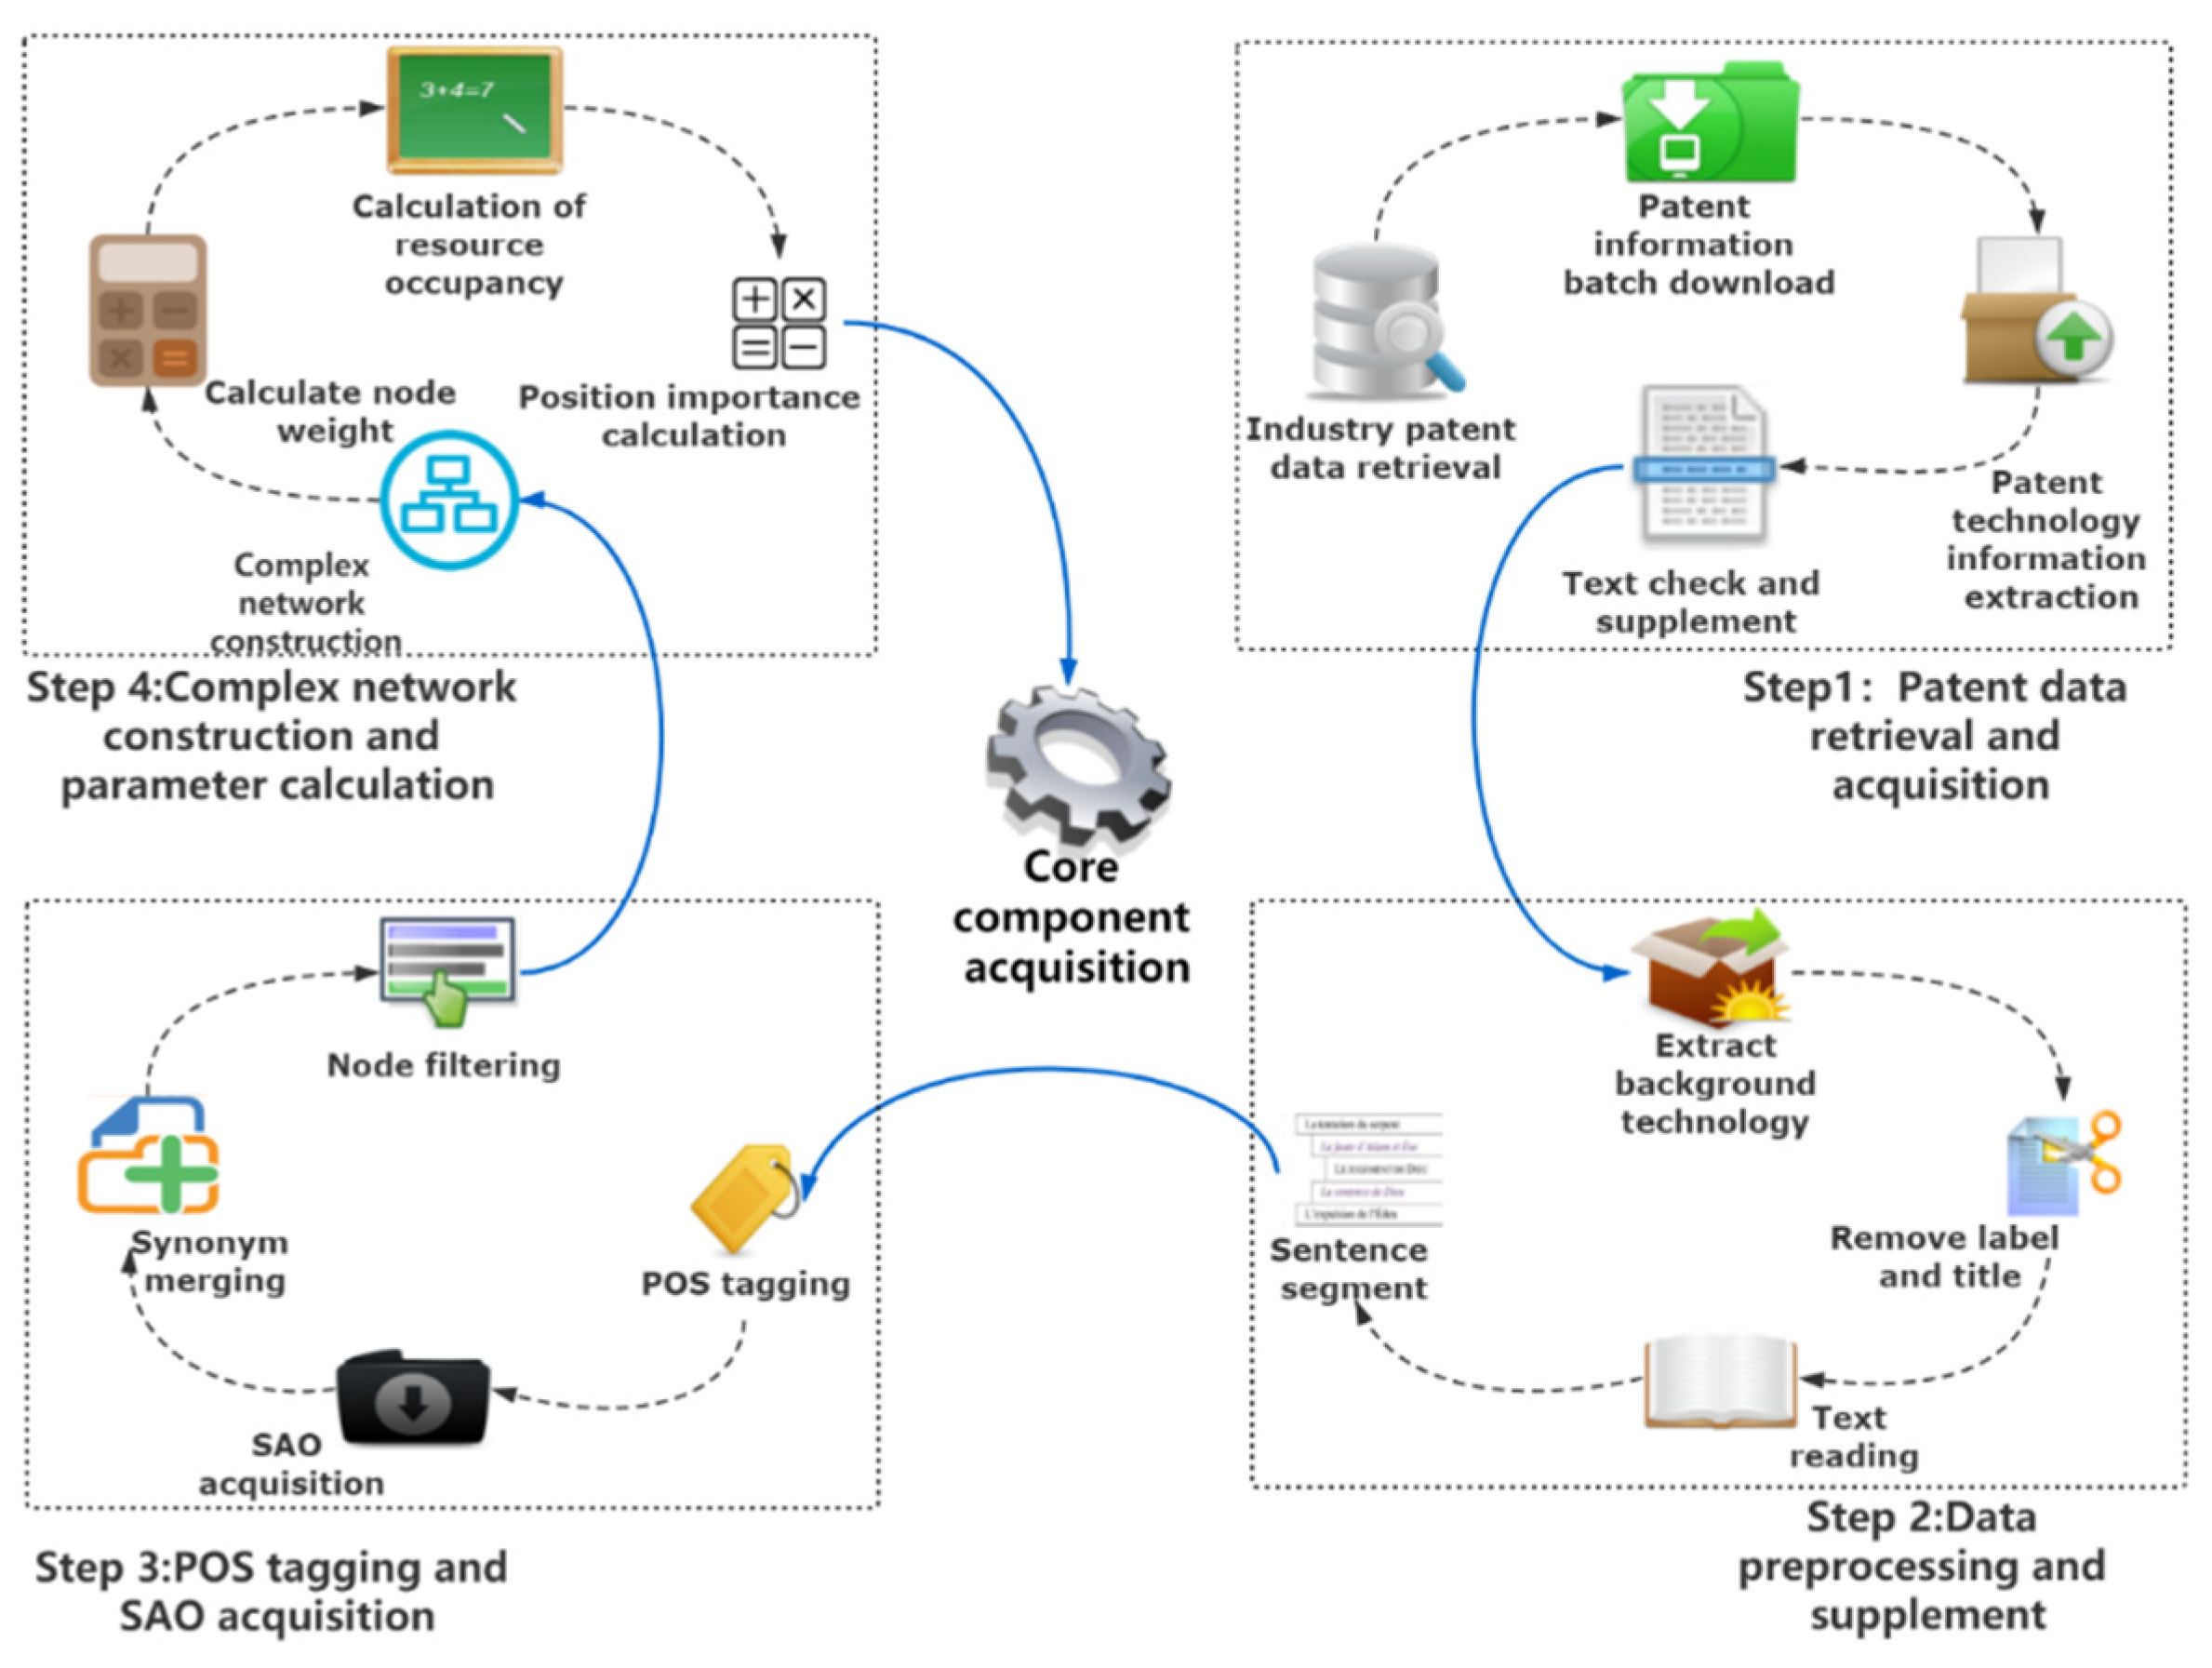
3.2. Research Framework of Core Component Acquisition
4. Methods
4.1. POS Tagging and SAO
| Algorithm 1: The algorithm of SAO extraction process. |
| 01.//Variable: PT——patent text 02.//Variable: ST——sentence 03.//Variable: WD——word; 04.//Variable: WDPOS——word with POS tagging 05.//Function: SAO——subject-action-object 06.//Function: POST——POS tagging 07.//Function: DEP_GRAM——dependency grammar 08.//Variable: DataFrame——distributed data set 09. Begin: 10. import nlp package 11. import CSV to DataFrame 12. Subject_POS_list = [“Subj”, “nsubj”, “nsubjpass”] 13. Action_POS_list = [“aux”, “auxpass”, “complm”, “prt”, “cordmod”, “mmod”] 14. Object_POS_list = [“obj”,”dobj”, “pobj”] 15. def getSubject (ST): 16. for word in ST: 17. WD = word 18. WDPOS =POST(word) 19. If WDPOS in Subject_POS_list: 20. Subject = WD 21. Return Action 22. def getAction (ST): 23. for word in ST: 24. WD = word 25. WDPOS =POST(word) 26. If WDPOS in Action_POS_list: 27. Action = WD 28. Return Action 29. def getObjection (ST): 30. for word in ST: 31. WD = word 32. WDPOS = POST(word) 33. If WDPOS in Object_POS_list: 34. Object = WD 35. Return Object 36. data = pd. DataFrame() 37. for i in range(len(csv)): 38. ST = split (PT, Regular expression clause) 39. for j in range (len (ST)): 40. Subject = getSubject (WD) 41. Action = getAction (WD) 42. Object = getObject (WD) 43. SAO = (Subject,Action,Object) 44. end 45. data = data.append(SAO) 46 end for. 47. output(data)) |
4.2. Semantic Similarity
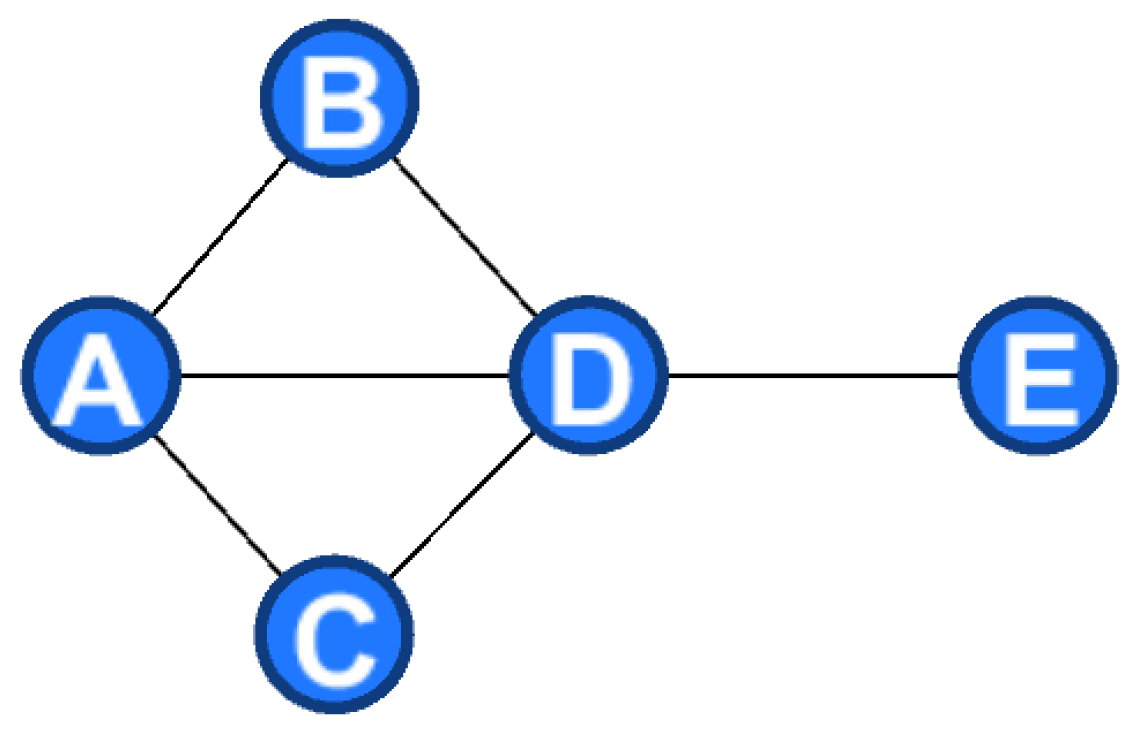
4.3. Complex Network
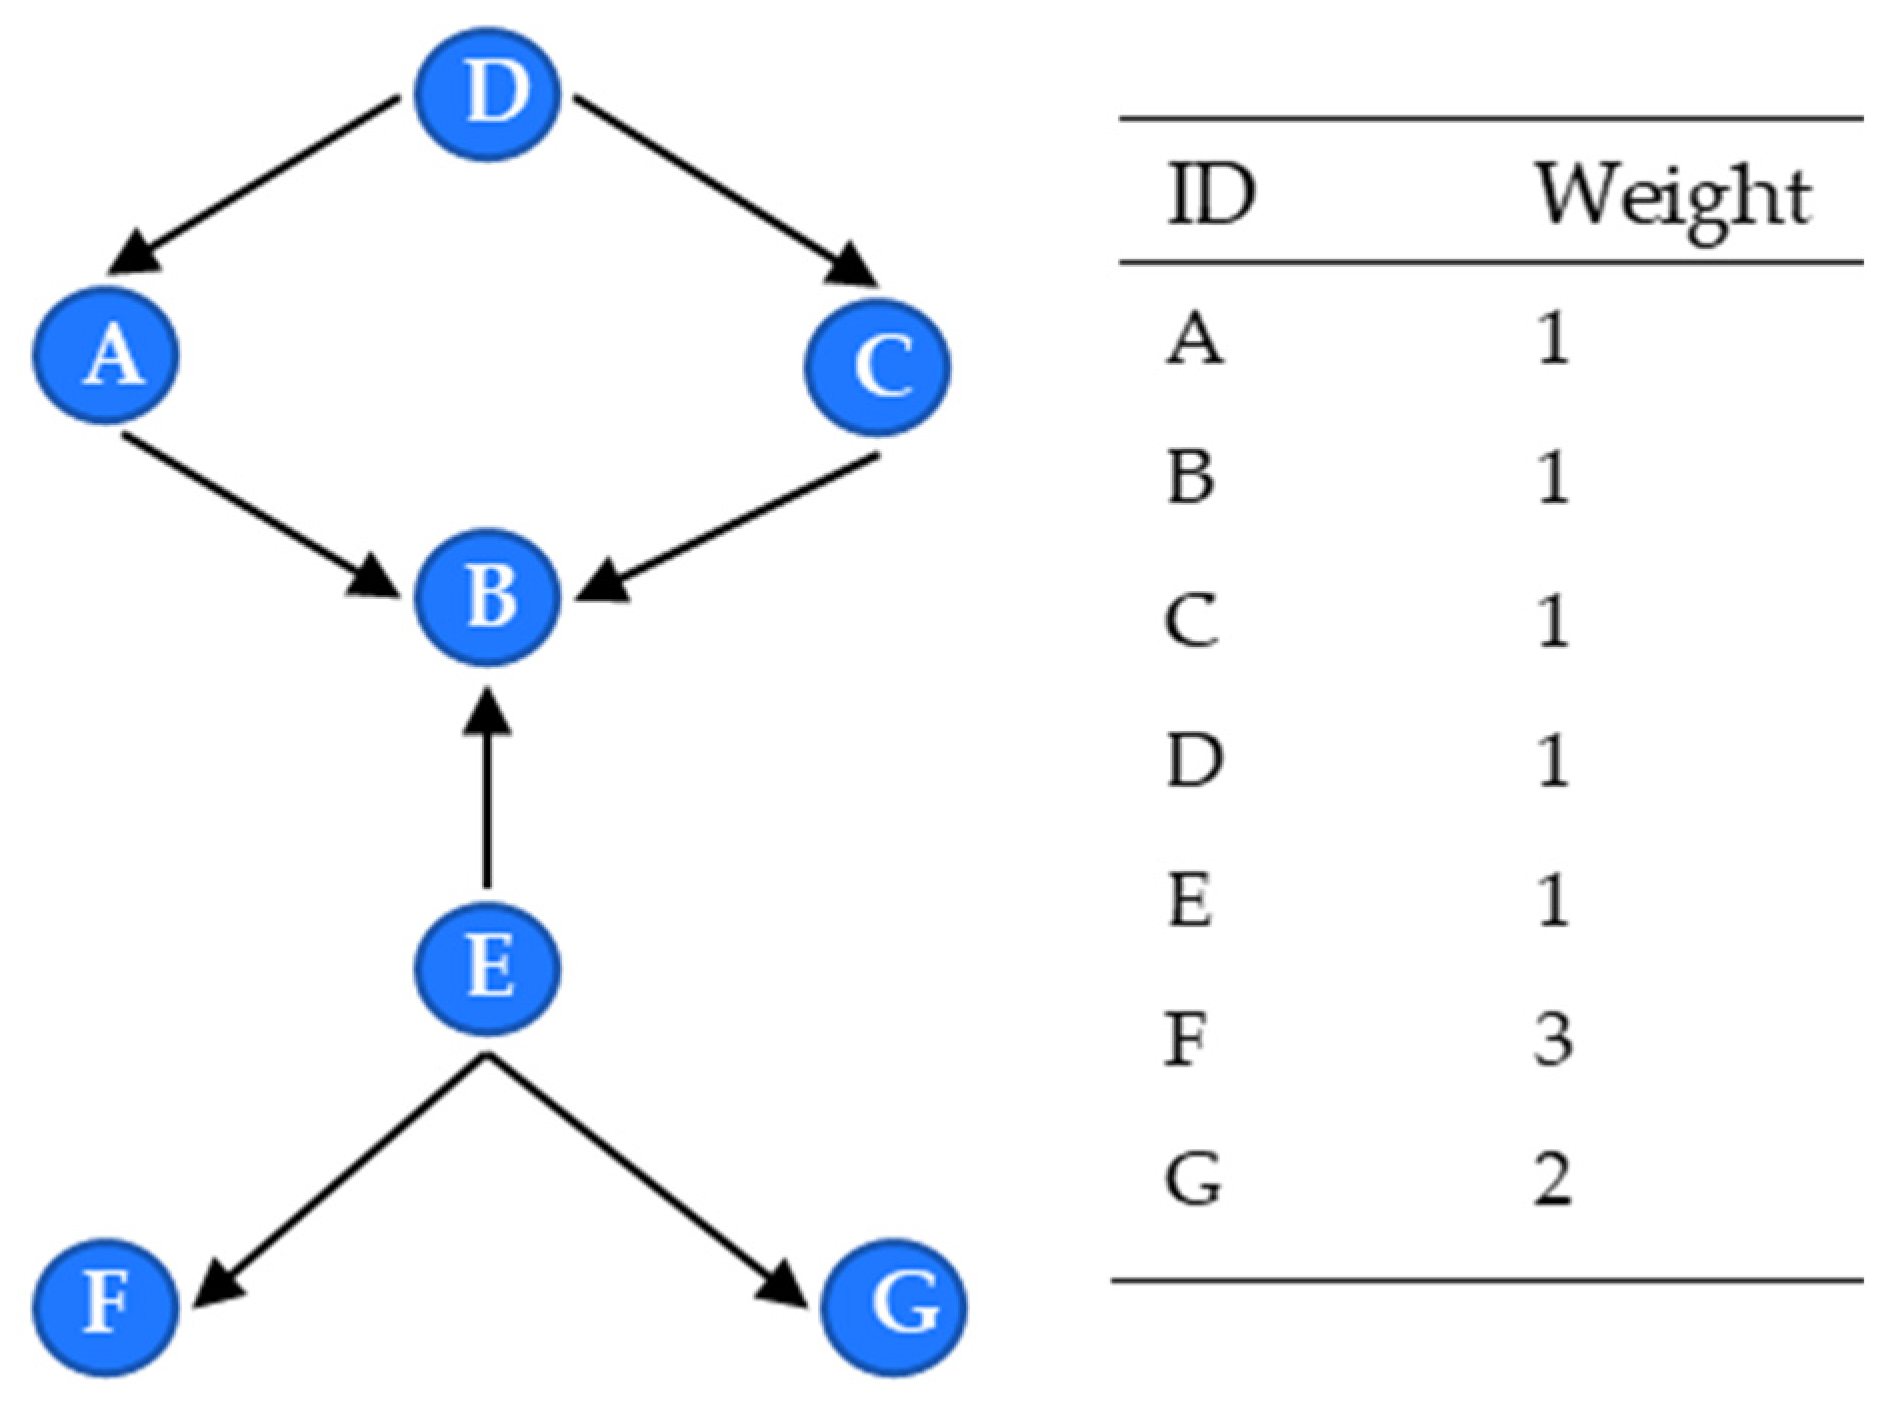
4.3.1. Calculation of Element Position Importance Based on Structural Hole Theory
4.3.2. Calculation of Component Resource Occupancy Based on Eigenvector Centrality
4.3.3. Comprehensive Weight Calculation of Core Components
5. Illustration and Discussion
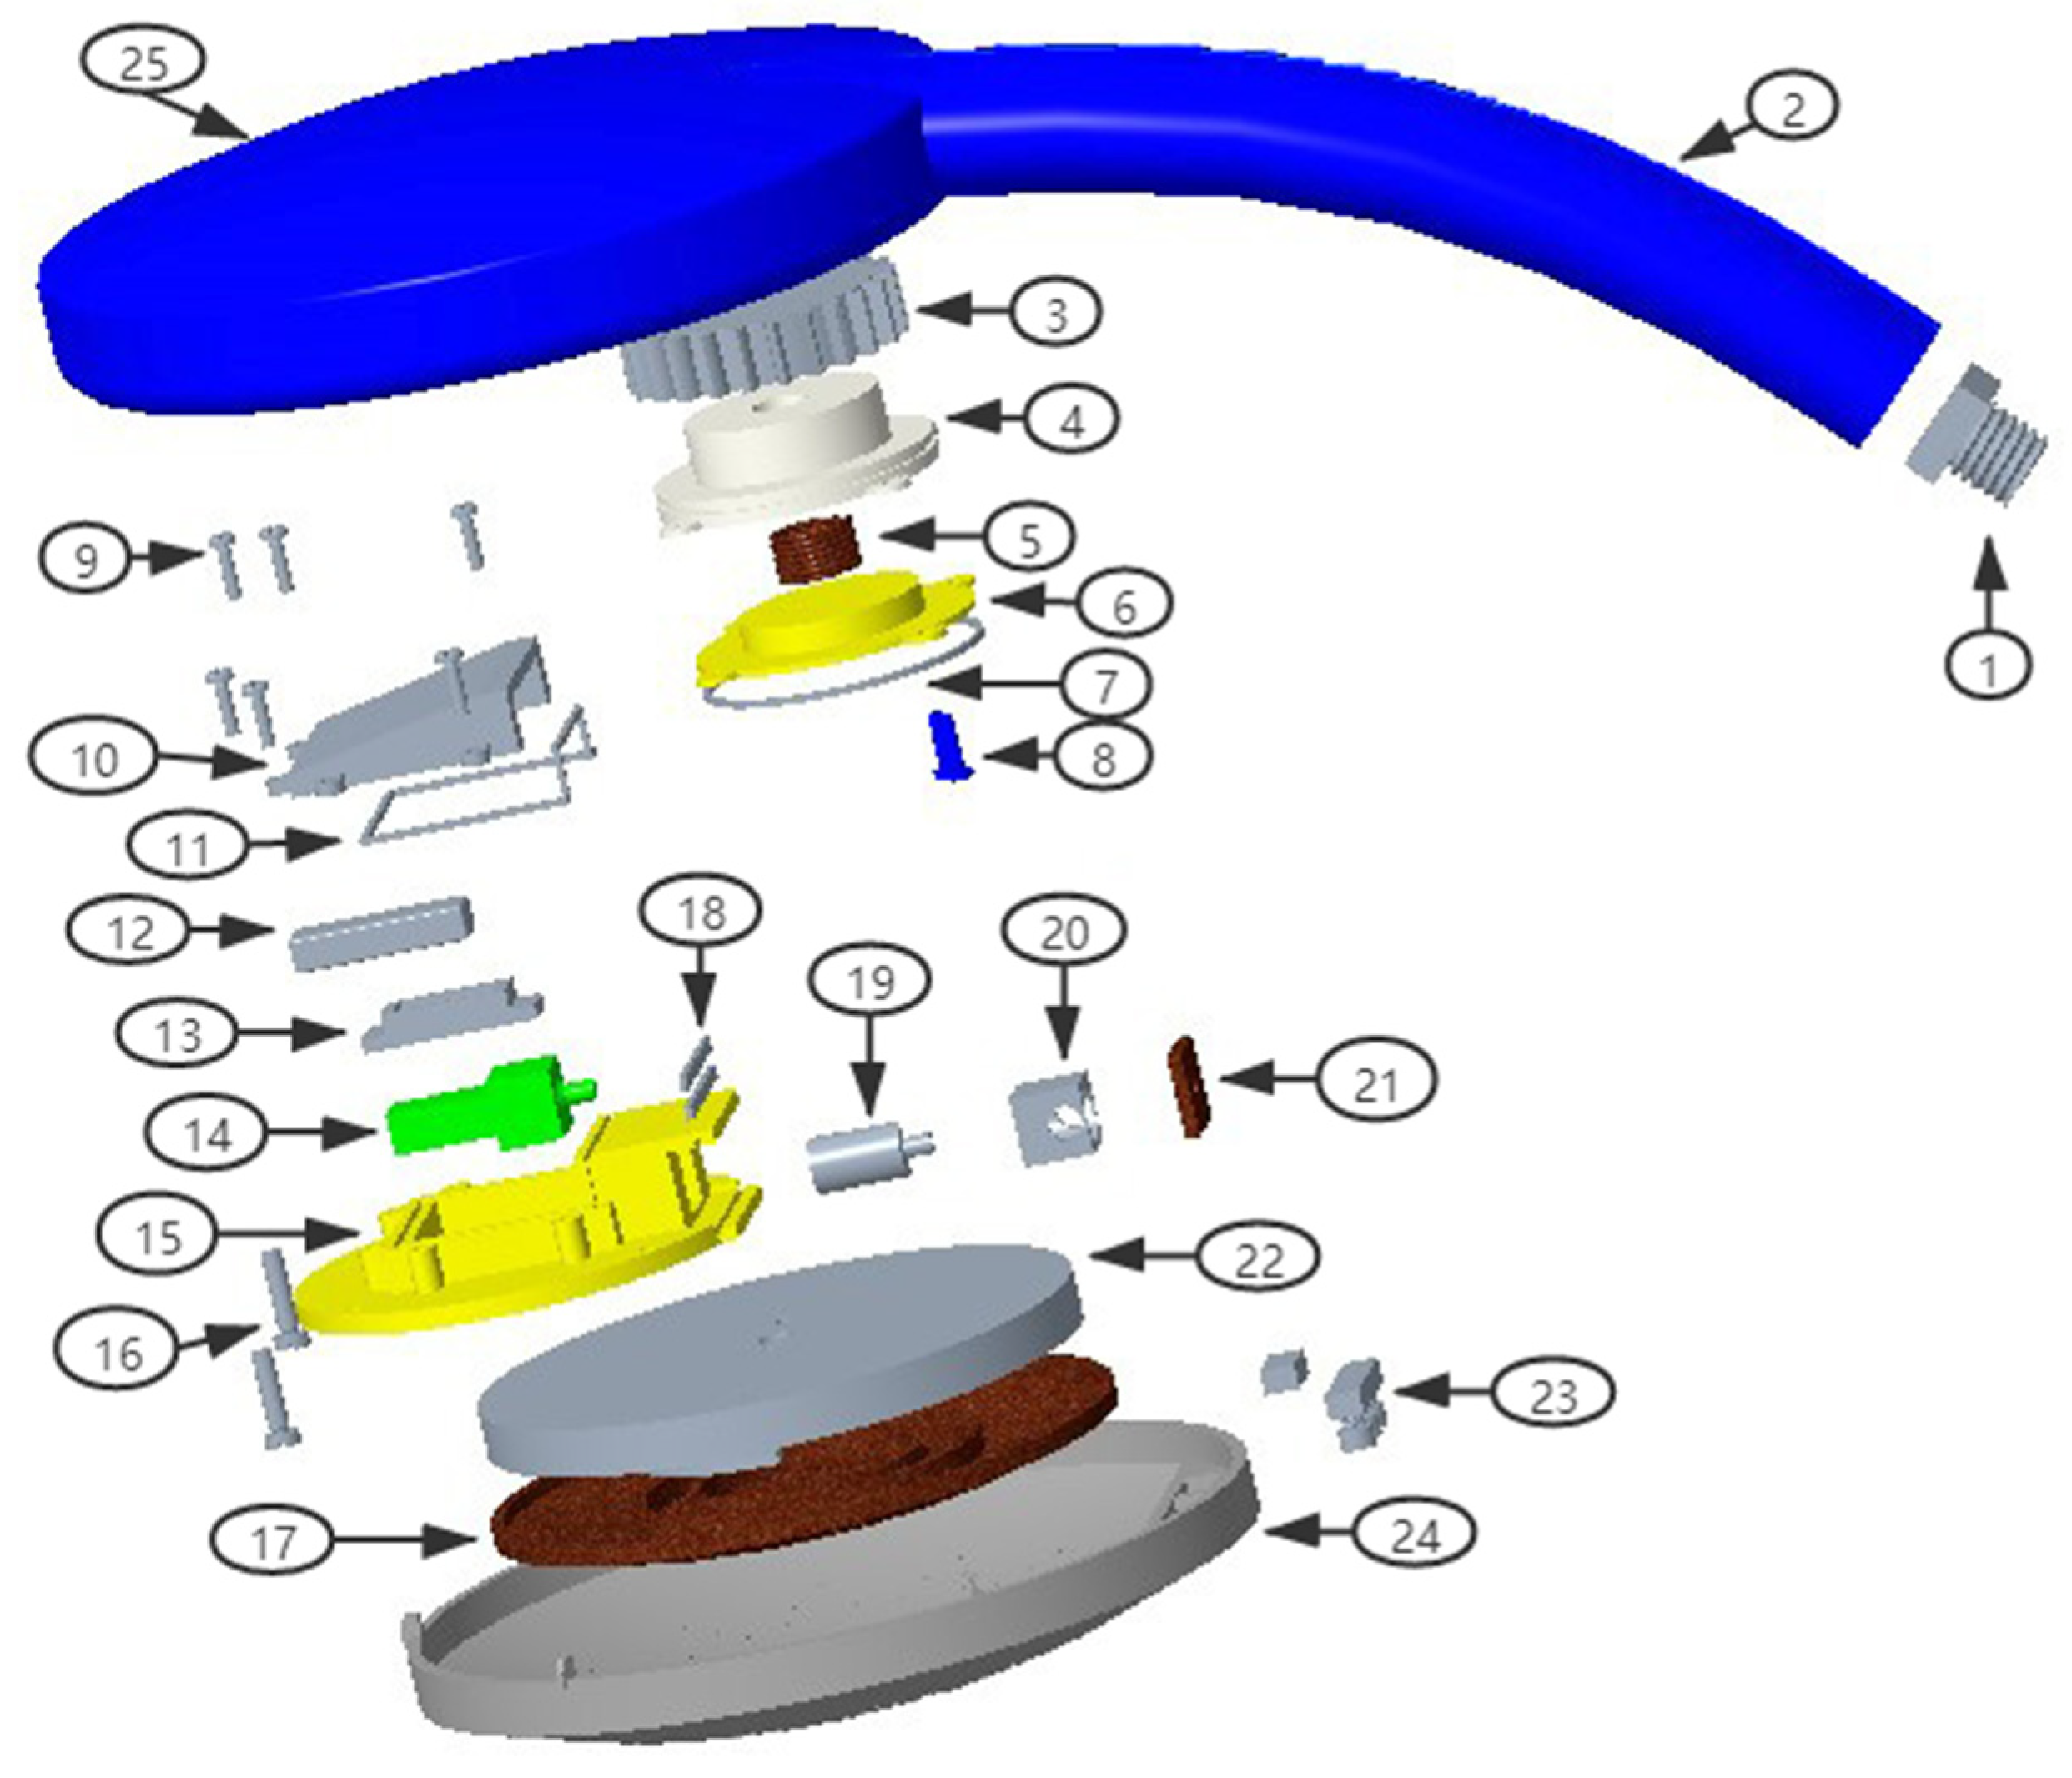
5.1. Research Background
5.2. Retrieval and Acquisition of Patent Data
5.3. Data Preprocessing and Supplementation
5.4. POS Tagging and SAO Acquisition
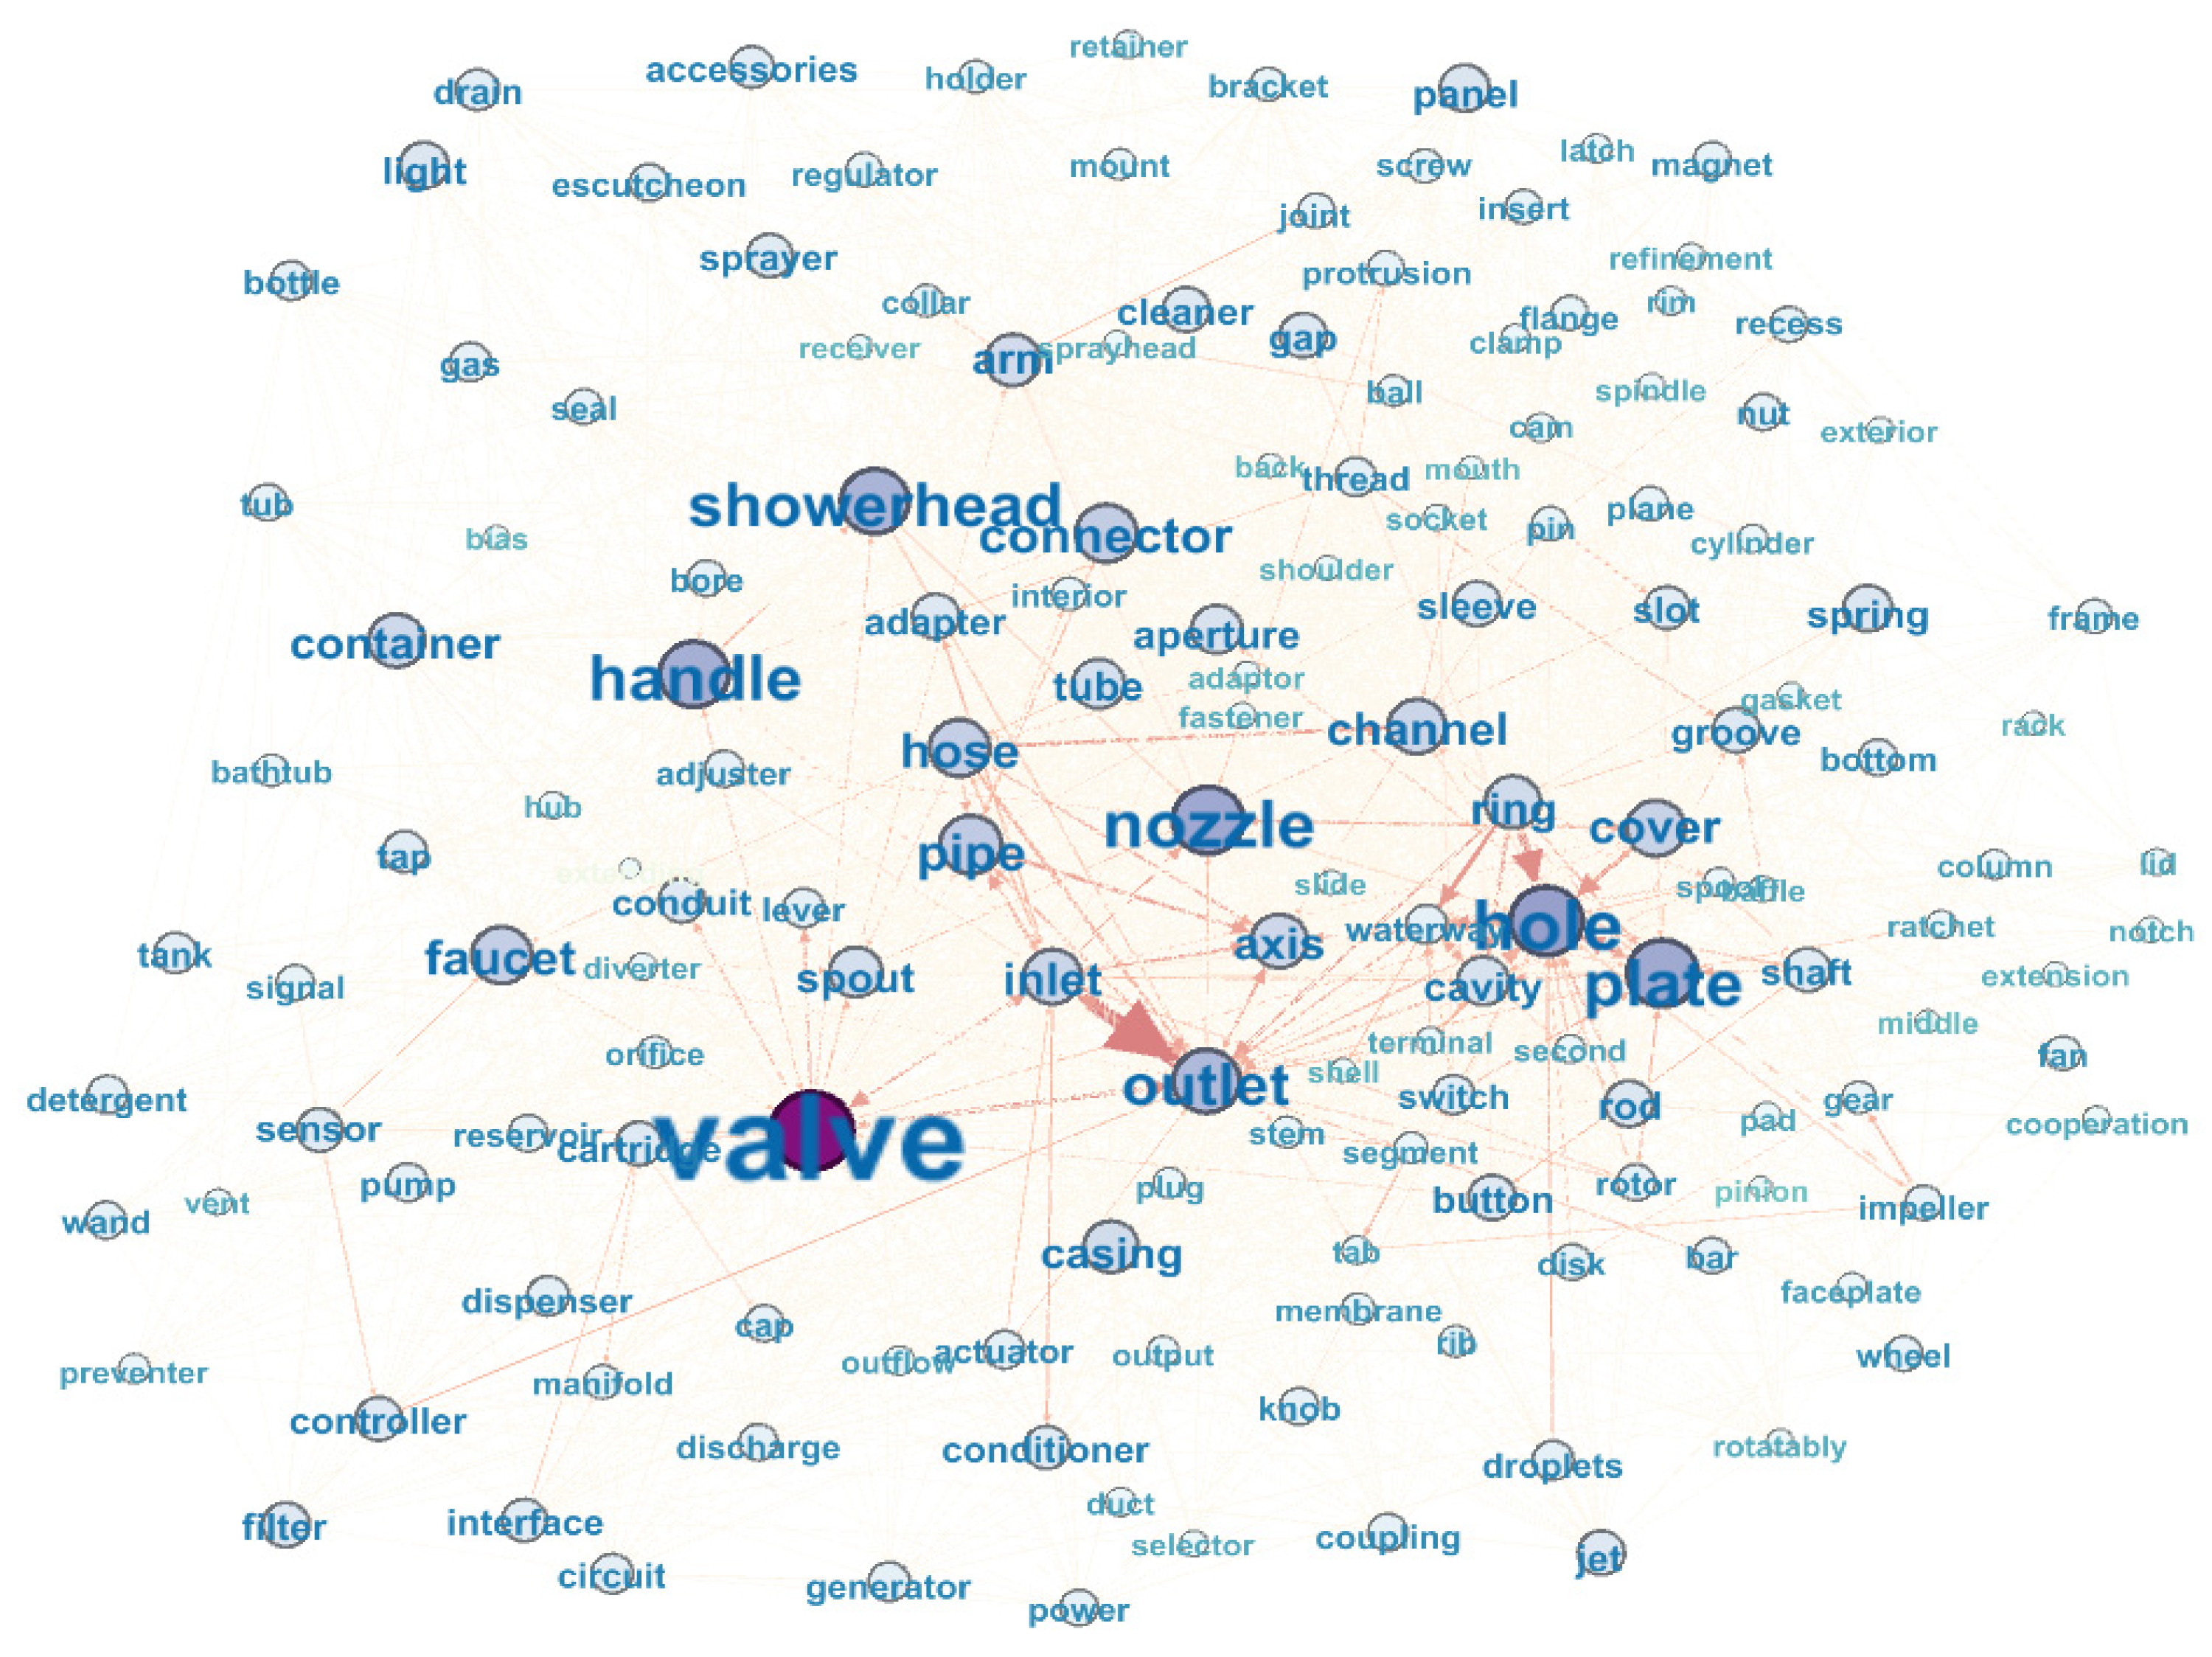
5.5. Complex Network Construction and Core Component Acquisition
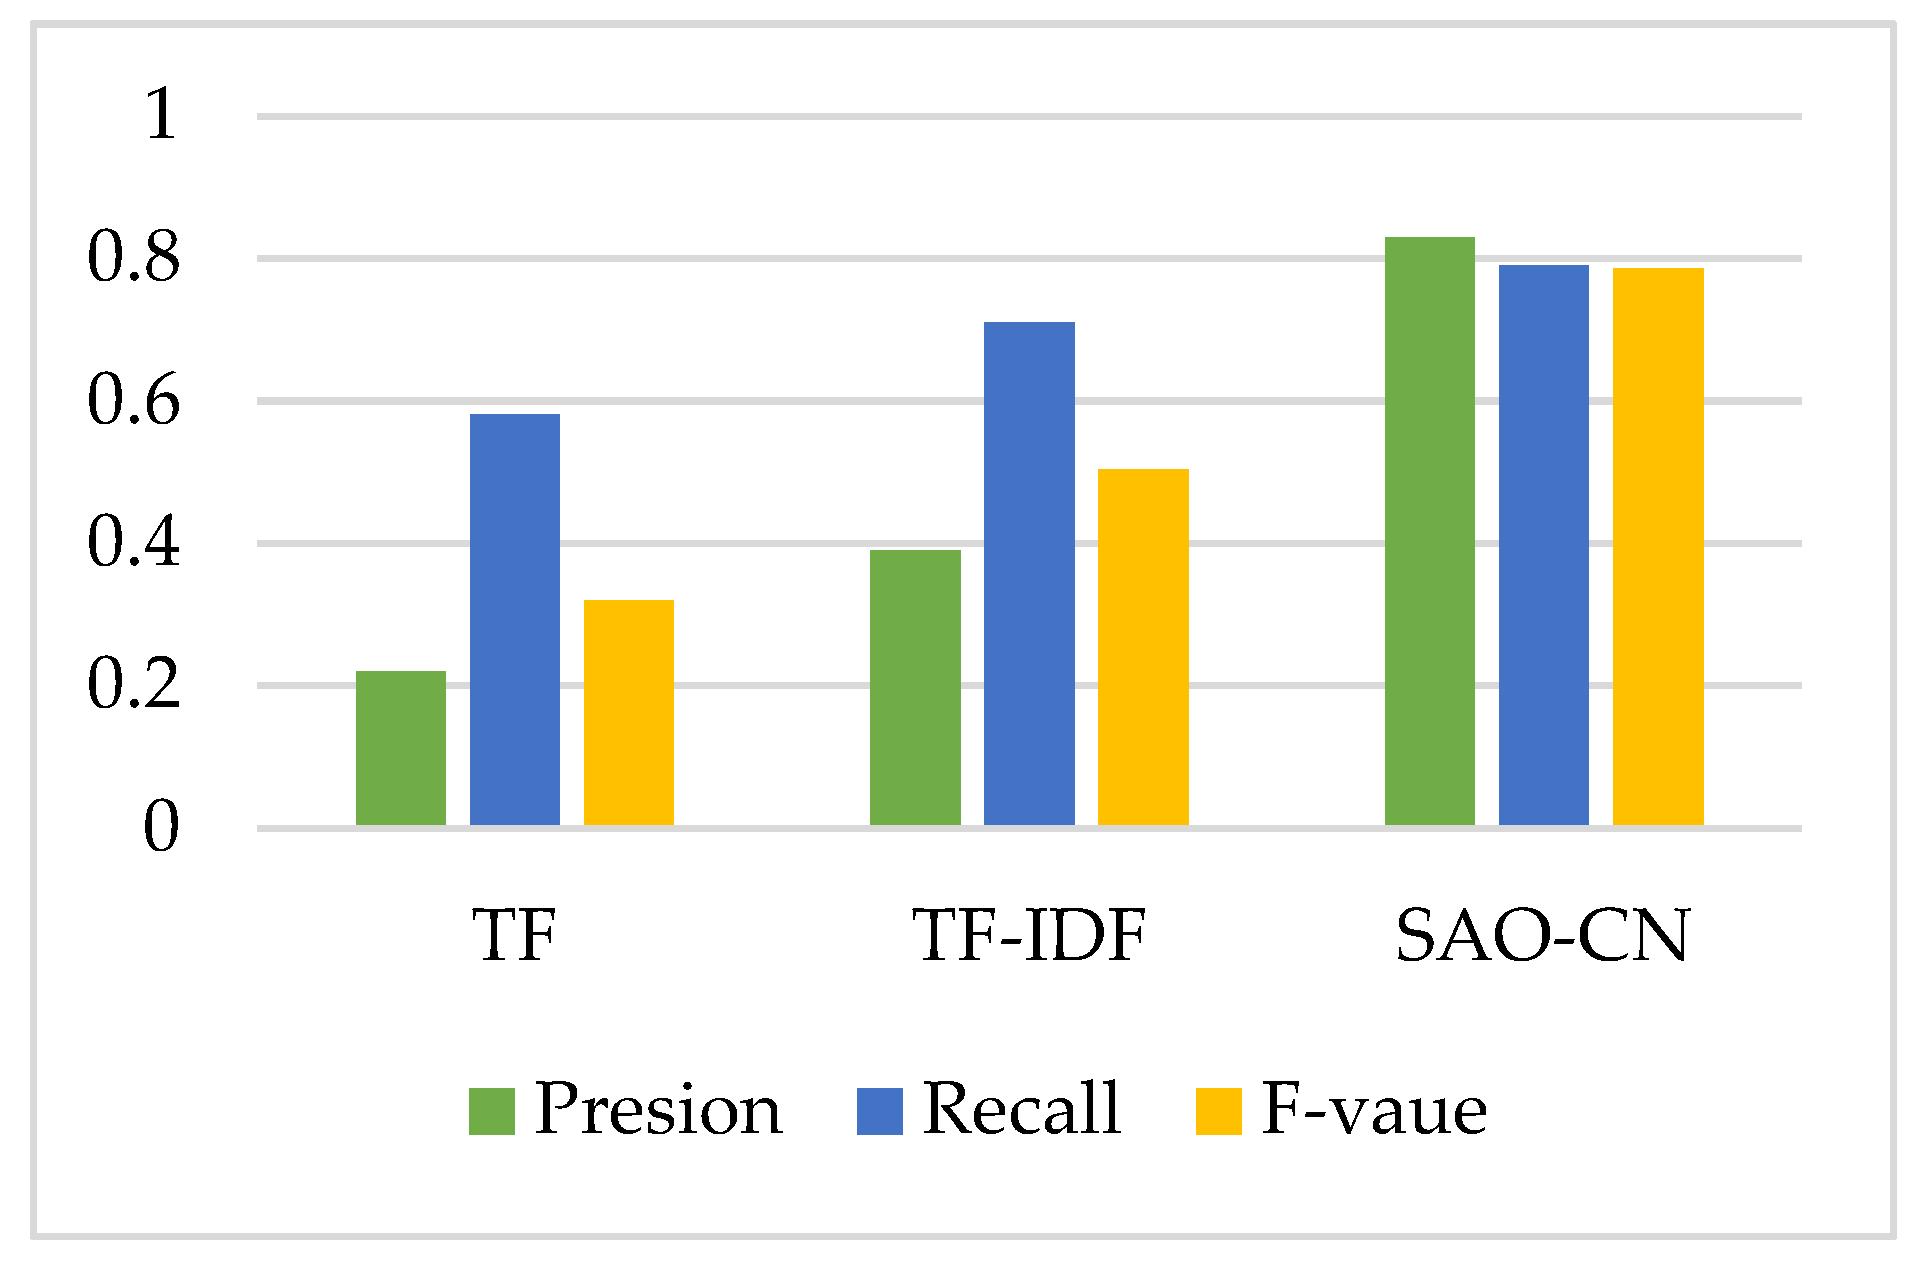
5.6. Demonstration and Discussion
6. Conclusions
Author Contributions
Funding
Conflicts of Interest
References
- Yu, Y.W.; Deng, Y.M.; Lu, W.F.; Nee, A.Y.C. Analysis of mechanical systems with adaptable functions for the evaluation of functional coupling and component importance. Int. J. Adv. Manuf. Technol. 2015, 76, 1449–1458. [Google Scholar] [CrossRef]
- Burton, N.; Galvin, P. Component complementarity and transaction costs: The evolution of product design. Rev. Manag. Sci. 2020, 14, 845–867. [Google Scholar] [CrossRef]
- Jeong, Y.; Yoon, B. Development of patent roadmap based on technology roadmap by analyzing patterns of patent development. Technovation 2015, 39, 37–52. [Google Scholar] [CrossRef]
- Fankhauser, M.; Moser, C.; Nyfeler, T. Patents as early indicators of technology and investment trends: Analyzing the Microbiome space as a case study. Front. Bioeng. Biotechnol. 2018, 6, 86–93. [Google Scholar] [CrossRef] [PubMed] [Green Version]
- Kwon, S.; Porter, A.; Youtie, J. Navigating the innovation trajectories of technology by combining specialization score analyses for publications and patents: Graphene and nano-enabled drug delivery. Scientometrics 2016, 106, 1057–1071. [Google Scholar] [CrossRef]
- Leydesdorff, L.; Kushnir, D.; Rafols, I. Interactive overlay maps for US patent (USPTO) data based on International Patent Classification (IPC). Scientometrics 2014, 98, 1583–1599. [Google Scholar] [CrossRef] [Green Version]
- Zhang, G.; Feng, Y.; Yu, G.; Liu, L.; Hao, Y. Analyzing the time delay between scientific research and technology patents based on the citation distribution model. Scientometrics 2017, 111, 1287–1306. [Google Scholar]
- Wang, J.; Chen, Y. A novelty detection patent mining approach for analyzing technological opportunities. Adv. Eng. Inform. 2019, 42, 100941. [Google Scholar] [CrossRef]
- Minjung, L.; Chang-Hyeon, S.; Yeon-bae, K. The effect of knowledge convergence characteristics on firm’s innovation performance via International Patent Classification(IPC) co-occurrence network analysis—Focused on Electricity and Electronic SMEs. J. Intellectual. Property 2018, 13, 245–284. [Google Scholar]
- Chen, Y.; Chiu, Y. Cross-language patent matching via an international patent classification-based concept bridge. J. Inf. Sci. 2013, 39, 737–753. [Google Scholar] [CrossRef] [Green Version]
- Duch-Brown, N.; Teresa Costa-Campi, M. The diffusion of patented oil and gas technology with environmental uses: A forward patent citation analysis. Energ. Policy 2015, 83, 267–276. [Google Scholar]
- Kim, D.H.; Lee, B.K.; Sohn, S.Y. Quantifying technology-industry spillover effects based on patent citation network analysis of unmanned aerial vehicle (UAV). Technol. Forecas. Soc. Chang. 2016, 105, 140–157. [Google Scholar] [CrossRef]
- Cochoy, F.; Soutjis, B. Back to the future of digital price display: Analyzing patents and other archives to understand contemporary market innovations. Soc. Stud. Sci. 2020, 50, 3–29. [Google Scholar] [CrossRef] [PubMed]
- Nizar, G.; Khaled, K.; Rose, D. Supporting patent mining by using ontology-based semantic annotations. Web. Intell. 2007, 45, 435–438. [Google Scholar]
- Lei, L.; Qi, J.J.; Zheng, K. Patent analytics based on feature vector space model: A case of IoT. IEEE Access 2019, 7, 45705–45715. [Google Scholar] [CrossRef]
- Gerken, J.M.; Moehrle, M.G. A new instrument for technology monitoring: Novelty in patents measured by semantic patent analysis. Scientometrics 2012, 91, 645–670. [Google Scholar] [CrossRef]
- Lee, C.; Wang, M.; Hsiao, Y.; Tsai, B. Ontology-based GFML agent for patent technology requirement evaluation and recommendation. Soft Comput. 2019, 23, 537–556. [Google Scholar] [CrossRef]
- Kreuchauff, F.; Korzinov, V. A patent search strategy based on machine learning for the emerging field of service robotics. Scientometrics 2017, 111, 743–772. [Google Scholar] [CrossRef] [Green Version]
- Sarica, S.; Luo, J.; Wood, K.L. TechNet: Technology semantic network based on patent data. Expert Syst. Appl. 2020, 142, 112995. [Google Scholar] [CrossRef] [Green Version]
- Ki, W.; Kim, K. Generating information relation matrix using semantic patent mining for technology planning: A case of nano-sensor. IEEE Access 2017, 5, 26783–26797. [Google Scholar] [CrossRef]
- An, J.; Kim, K.; Mortara, L.; Lee, S. Deriving technology intelligence from patents: Preposition-based semantic analysis. J. Informetr. 2018, 12, 217–236. [Google Scholar] [CrossRef]
- Wang, X.F.; Ren, H.C.; Chen, Y.; Liu, Y.; Qiao, Y.; Huang, Y. Measuring patent similarity with SAO semantic analysis. Scientometrics 2019, 121, 1–23. [Google Scholar] [CrossRef]
- Chen, L.; Xu, S.; Zhu, L.; Zhang, J.; Lei, X.; Yang, G. A deep learning based method for extracting semantic information from patent documents. Scientometrics 2020, 125, 289–312. [Google Scholar] [CrossRef]
- Xiong, W.; Cao, J.; Zhou, X.; Du, J.; Nie, B.; Zeng, Z.; Li, T. Design and evaluation of a prescription drug monitoring program for Chinese patent medicine based on knowledge graph. Evid.-Based Complementary Altern. Med. 2021, 2021, 1–8. [Google Scholar] [CrossRef]
- Yoon, B.; Kim, S.; Kim, S.; Seol, H. Doc2vec-based link prediction approach using SAO structures: Application to patent network. Scientometrics 2021, 1–30. [Google Scholar] [CrossRef]
- Iwan, V.W.; Thorsten, T.; Katja, R. Inventive progress measured by multi-stage patent citation analysis. Res. Policy 2005, 34, 1591–1607. [Google Scholar]
- Jiang, M.; Zhou, P. Research on the Patent Innovation Performance of University-Industry Collaboration Based on Complex Network Analysis. J. Bus.-Bus. Mark 2014, 21, 65–83. [Google Scholar]
- Park, H.J.; Chun, H.S.; Jeong, J.K.; Jang, D.J. Surveys of domestic and foreign patents for improving cardiovascular Disease. J. Korean Soc. Food Cult. 2007, 22, 673–681. [Google Scholar]
- Choi, S.W.; Lee, C.W.; You, Y.Y. Technological Capability Analysis of Competitor Using Patent Information: Focused on Mobile Communication Technology development companies. J. Digit. Converg. 2014, 12, 115–123. [Google Scholar]
- Li, X.; Li, Q. Calculation of Sentence Semantic Similarity Based on Syntactic Structure. Math. Probl. Eng. 2015, 2015, 1–8. [Google Scholar]
- Kim, M.; Park, Y.; Yoon, J. Generating patent development maps for technology monitoring using semantic patent-topic analysis. Comput. Ind. Eng. 2016, 98, 289–299. [Google Scholar] [CrossRef]
- Changyong, L.; Bokyoung, K.; Juneseuk, S. Novelty-focused patent mapping for technology opportunity analysis. Technol. Forecast. Soc. Chang. 2015, 90, 355–365. [Google Scholar]
- Yin, F.L.; Wang, Y.Y.; Liu, J.B.; Ji, M.Q. Enhancing embedding-based chinese word similarity evaluation with concepts and synonyms knowledge. Comput. Modeling Eng. Sci. 2020, 124, 747–764. [Google Scholar] [CrossRef]
- Klahn, C.; Fontana, F.; Leutenecker-Twelsiek, B.; Meboldt, M. Mapping value clusters of additive manufacturing on design strategies to support part identification and selection. Rapid Prototyp. J. 2020, 26, 1797–1807. [Google Scholar] [CrossRef]
- Zheng, X.Y.; Jia, R.; Aisikaer Gong, L.L.; Zhang, J.R.; Dang, J. Component identification and defect detection in transmission lines based on deep learning. J. Intell. Fuzzy Syst. 2021, 40, 3147–3158. [Google Scholar] [CrossRef]
- Dorji, T.C.; Atlam, E.; Yata, S.; Fuketa, M.; Morita, K.; Aoe, J. Extraction, selection and ranking of Field Association (FA) Terms from domain-specific corpora for building a comprehensive FA terms dictionary. KAIS 2011, 27, 141–161. [Google Scholar] [CrossRef]
- Hu, J.; Li, S.B.; Yao, Y.; Yu, L.Y.; Yang, J.C.; Hu, J.J. Patent keyword extraction algorithm based on distributed representation for patent classification. Entropy 2018, 20, 104. [Google Scholar] [CrossRef] [Green Version]
- Yoon, J.; Seo, W.; Coh, B.Y.; Song, I.; Lee, J.M. Identifying product opportunities using collaborative filtering-based patent analysis. Comput. Ind. Eng. 2017, 107, 376–387. [Google Scholar] [CrossRef]
- Kim, H.; Joung, J.; Kim, K. Semi-automatic extraction of technological causality from patents. Comput. Ind. Eng. 2018, 115, 532–542. [Google Scholar] [CrossRef]
- Choi, J.; Jeong, B.; Yoon, J.; Coh, B.Y.; Lee, J.M. A novel approach to evaluating the business potential of intellectual properties: A machine learning-based predictive analysis of patent lifetime. Comput. Ind. Eng. 2020, 145, 106544. [Google Scholar] [CrossRef]
- Kang, Y.; Tang, D. Matrix-Based conceptual solution generation approach of multifunction product. Adv. Mech. Eng. 2013, 5, 791071. [Google Scholar] [CrossRef]
- Lin, S.Y.; Wu, C.T. Application of TRIZ inventive principles to innovate recycling machine. Adv. Mech. Eng. 2016, 8, 1687814016647303. [Google Scholar] [CrossRef] [Green Version]
- Yang, C.; Zhu, D.; Wang, X.; Zhang, Y.; Zhang, G.; Lu, J. Requirement-oriented core technological components’ identification based on SAO analysis. Scientometrics 2017, 112, 1229–1248. [Google Scholar] [CrossRef]
- Lim, J.; Choi, S.; Lim, C.; Kim, K. Sao-based semantic mining of patents for semi-automatic construction of a customer job map. Sustainability 2017, 9, 1386. [Google Scholar] [CrossRef] [Green Version]
- Guo, J.F.; Wang, X.F.; Li, Q.R.; Zhu, D.H. Subject-action-object-based morphology analysis for determining the direction of technological change. Technol. Forecast. Soc. 2016, 105, 27–40. [Google Scholar] [CrossRef]
- Sice, P.; Elvin, G.; Riachy, C.; Shang, Y.; Ogwu, S.; Zink, C. Online screening of X-System music playlists using an Integrative Wellbeing Model informed by the theory of autopoiesis. IEEE Access 2020, 8, 182307–182319. [Google Scholar] [CrossRef]
- Quillian, M.R. The teachable language comprehender. Commun. ACM 1969, 12, 459–476. [Google Scholar] [CrossRef]
- Burt, R.S. Structural Holes; Harvard University Press: Cambridge, MA, USA, 1992. [Google Scholar]
- Robert, I.; Liu, A. Application of data analytics for product design: Sentiment analysis of online product reviews. CIRP J. Manuf. Sci. Technol. 2018, 23, 128–144. [Google Scholar]
- Dias Canedo, E.; Cordeiro Mendes, B. Software Requirements Classification Using Machine Learning Algorithms. Entropy 2020, 22, 1057. [Google Scholar] [CrossRef]


| Method | Mode of Action | Advantage | Disadvantage | Literature |
|---|---|---|---|---|
| Complex network | The keywords in the patent text are regarded as nodes, the associations between keywords are regarded as edges, and the complex patent network is constructed for analysis | Strong visualization, which is conducive to clarifying the relationship between keywords and facilitating network analysis | Insufficient dynamic visualization | Iwan, Thorsten and Katja |
| Vector | Performs word vector training on the domain corpus to construct technical efficacy topics | Suitable for large databases, high degree of automation | Lack of judgment on the semantic connection of keywords | Park, Chun and Jeong |
| TRIZ | Through the analysis and extraction of patent knowledge, it is introduced into TRIZ tool to provide a large number of heuristic principles, effects, structures, etc. for solving product innovation problems in specific fields. | Not only makes up for the limitations of TRIZ and the ambiguity and broadness of the obtained solutions, but also makes up for the microscopic nature of knowledge acquired through patents. | Relies on the designer’s subjective experience and domain knowledge | Li et al. |
| keyword map | Transforms technical information in patents into a map of technology-directed functionality | The content is detailed and helpful for understanding technological trends | Difficult to find and organize information. | Kim M, Park Y and Yoon J |
| Method | Mode of Action | Advantage | Disadvantage | Literature |
|---|---|---|---|---|
| Network algorithm | Map product components to networks, and identify core components through network measurement algorithms. | Easy to measure position and use of nodes in network, strong visualization. | Insufficient dynamic visualization. | Yin et al. |
| Machine learning | The model is trained through sample data, and the trained model is used to analyze and predict data. | High degree of automation, faster training speed. | Influenced by algorithm accuracy and quality. | Zheng et al. |
| QFD | Obtains the components that contribute most to requirements through requirement analysis. | Strong purpose, high excavation accuracy. | Influenced by subjective experience. | Klahn et al. |
| TF-IDF | Takes the frequency of keywords appearing in the text and the frequency of keywords appearing in all texts as the criteria for judging the importance of keywords. | The algorithm is simple and easy to implement. | Semantic order and context in the text are ignored. | Dorji et al. |
| Tag | Explanation | Tag | Explanation |
|---|---|---|---|
| aux | auxiliary (be) | Root | root node |
| conj | conjunct | Subj | subject |
| nsubj | nominal subject | Obj | object |
| nsubjpass | passive nominal subject | Dobj | direct object |
| SYM | symbol | Amod | adjectival modifier |
| num | numeric modifier | Attr | attributive |
| comp | complement | punct | punctuation |
| … | … | … | … |
| No | SAO Structure | Example |
|---|---|---|
| 1 |  | The switching mechanism is disposed on fixing holder” (US10464077): 1. switching mechanism-disposed-holder. |
| 2 |  | the forward position and the backward position are arranged at two sides of the initial position (US10449559): 1. forward position-arranged at-initial position 2. backward position-arranged at-initial position. |
| 3 |  | Preferably, the rotation valve comprises a sleeve, a valve core unit, a rotation support and a switch knob (US8720799): 1. rotation valve-comprises-sleeve. 2. rotation valve-comprises-valve core unit. 3. rotation valve-comprises-rotation support. 4. rotation valve-comprises-switch knob. |
| 4 |  | The present invention has arisen to mitigate and/or obviate the afore-described disadvantages (US20150354186A1): 1. Invention-mitigate-disadvantages. 2. Invention-obviate-disadvantages. |
| 5 |  | The temperature display is disposed on the curved pendant and connected with the temperature sensor (US20180202135A1): 1. temperature display-disposed on-curved pendant. 2. temperature display–connected- temperature sensor. |
| No | Component | Functionality | Component |
|---|---|---|---|
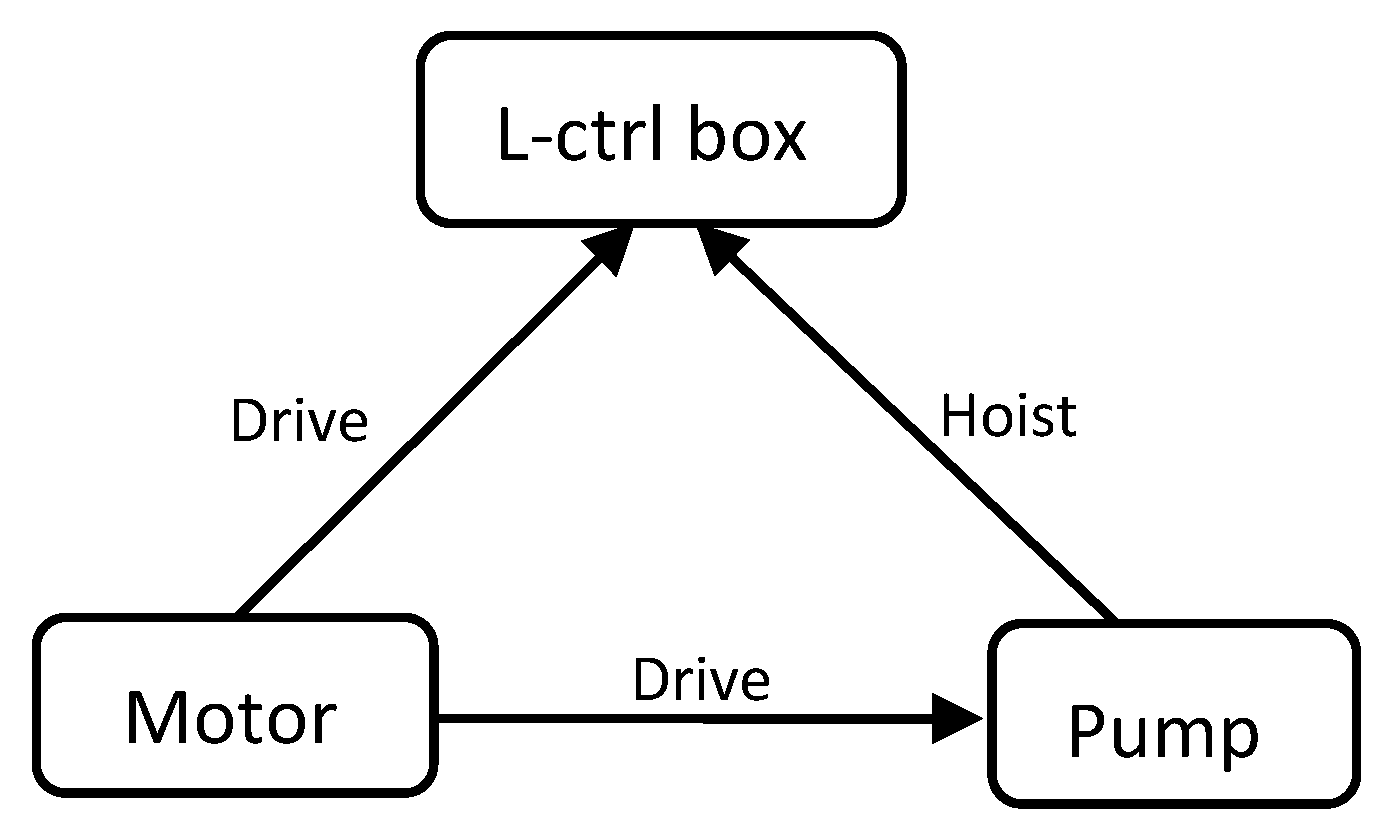
| 1 | motor | drive | liquid-ctrl box |
| 2 | liquid-ctrl box | hoist | pump |
| 3 | liquid-ctrl box | pass-through | pipeline |
| 4 | motor | drive | pump |
| 5 | pump | drive | hydraulic oil |
| 6 | filter | filtration | hydraulic oil |
| 7 | pipeline | conduction | hydraulic oil |
| 8 | hydraulic-oil | drive | piston |
| 9 | cylinder | storage | hydraulic oil |
| 10 | cylinder | guide | piston |
| … | … | … | … |
| Retrieval of Patents | Result |
|---|---|
| Title or Abstract:(showerhead * OR shower head * OR sprayer *) AND CPC:(B05B1/18) AND Time:(from 1 January 1914 to 1 December 2019) | 1733 |
| No | Patent Number | S | A | O |
|---|---|---|---|---|
| 1 | US20150273490A1 | |||
| 2 | US20150273490A1 | Embodiments | include | use |
| 3 | US20150273490A1 | Embodiments | include | showerhead |
| 4 | US20150273490A1 | Embodiments | include | invention |
| 5 | US20150273490A1 | Embodiments | include | chamber |
| 6 | US20150273490A1 | Embodiments | include | insulator |
| … | … | … | … | |
| 1048569 | US10207280 | |||
| 1048570 | US20150273490A1 | body | is | chamber |
| 1048571 | US20150273490A1 | body | is | outlets |
| 1048572 | US20150273490A1 | body | is | joint |
| Id | Weighted Degree |
|---|---|
| valve | 6881 |
| hole | 7950 |
| nozzle | 3615 |
| plate | 5036 |
| handle | 2513 |
| … | … |
| conduit | 1085 |
| cartridge | 1073 |
| controller | 1051 |
| sensor | 846 |
| shaft | 2205 |
| Rank by CI | Component | CRO | CPI | CI |
|---|---|---|---|---|
| 1 | valve | 0.702236961 | 1 | 0.85111848 |
| 2 | hole | 0.587594404 | 0.967555 | 0.777574702 |
| 3 | outlet | 0.558008416 | 0.964982 | 0.761495208 |
| 4 | plate | 0.571470938 | 0.866782 | 0.719126469 |
| 5 | inlet | 0.527199305 | 0.855714 | 0.691456652 |
| 6 | pipe | 0.537497082 | 0.824818 | 0.681157541 |
| 7 | axis | 0.521848944 | 0.81001 | 0.665929472 |
| 8 | nozzle | 0.56987848 | 0.738293 | 0.65408574 |
| 9 | handle | 0.562902512 | 0.713606 | 0.638254256 |
| 10 | connector | 0.537076218 | 0.71216 | 0.624618109 |
| 11 | channel | 0.520952 | 0.71189 | 0.61642122 |
| 12 | showerhead | 0.558708 | 0.664609 | 0.611658319 |
| 13 | casing | 0.516216 | 0.664802 | 0.590509075 |
| 14 | cavity | 0.510695 | 0.656919 | 0.583807209 |
| 15 | tube | 0.508913 | 0.652626 | 0.58076929 |
| 16 | hose | 0.526853 | 0.625187 | 0.576020133 |
| 17 | groove | 0.502273 | 0.622823 | 0.562548247 |
| 18 | ring | 0.516556 | 0.600572 | 0.558564007 |
| 19 | cover | 0.525866 | 0.565686 | 0.545776232 |
| 20 | arm | 0.516927 | 0.555637 | 0.536281896 |
| … | … | … | … |
Publisher’s Note: MDPI stays neutral with regard to jurisdictional claims in published maps and institutional affiliations. |
© 2022 by the authors. Licensee MDPI, Basel, Switzerland. This article is an open access article distributed under the terms and conditions of the Creative Commons Attribution (CC BY) license (https://creativecommons.org/licenses/by/4.0/).
Share and Cite
Lin, W.; Liu, X.; Xiao, R. Research on Product Core Component Acquisition Based on Patent Semantic Network. Entropy 2022, 24, 549. https://doi.org/10.3390/e24040549
Lin W, Liu X, Xiao R. Research on Product Core Component Acquisition Based on Patent Semantic Network. Entropy. 2022; 24(4):549. https://doi.org/10.3390/e24040549
Chicago/Turabian StyleLin, Wenguang, Xiaodong Liu, and Renbin Xiao. 2022. "Research on Product Core Component Acquisition Based on Patent Semantic Network" Entropy 24, no. 4: 549. https://doi.org/10.3390/e24040549