
Event-by-Event Investigation of the Two-Particle Source Function in Heavy-Ion Collisions with EPOS


Abstract
:1. Introduction
2. The EPOS Model
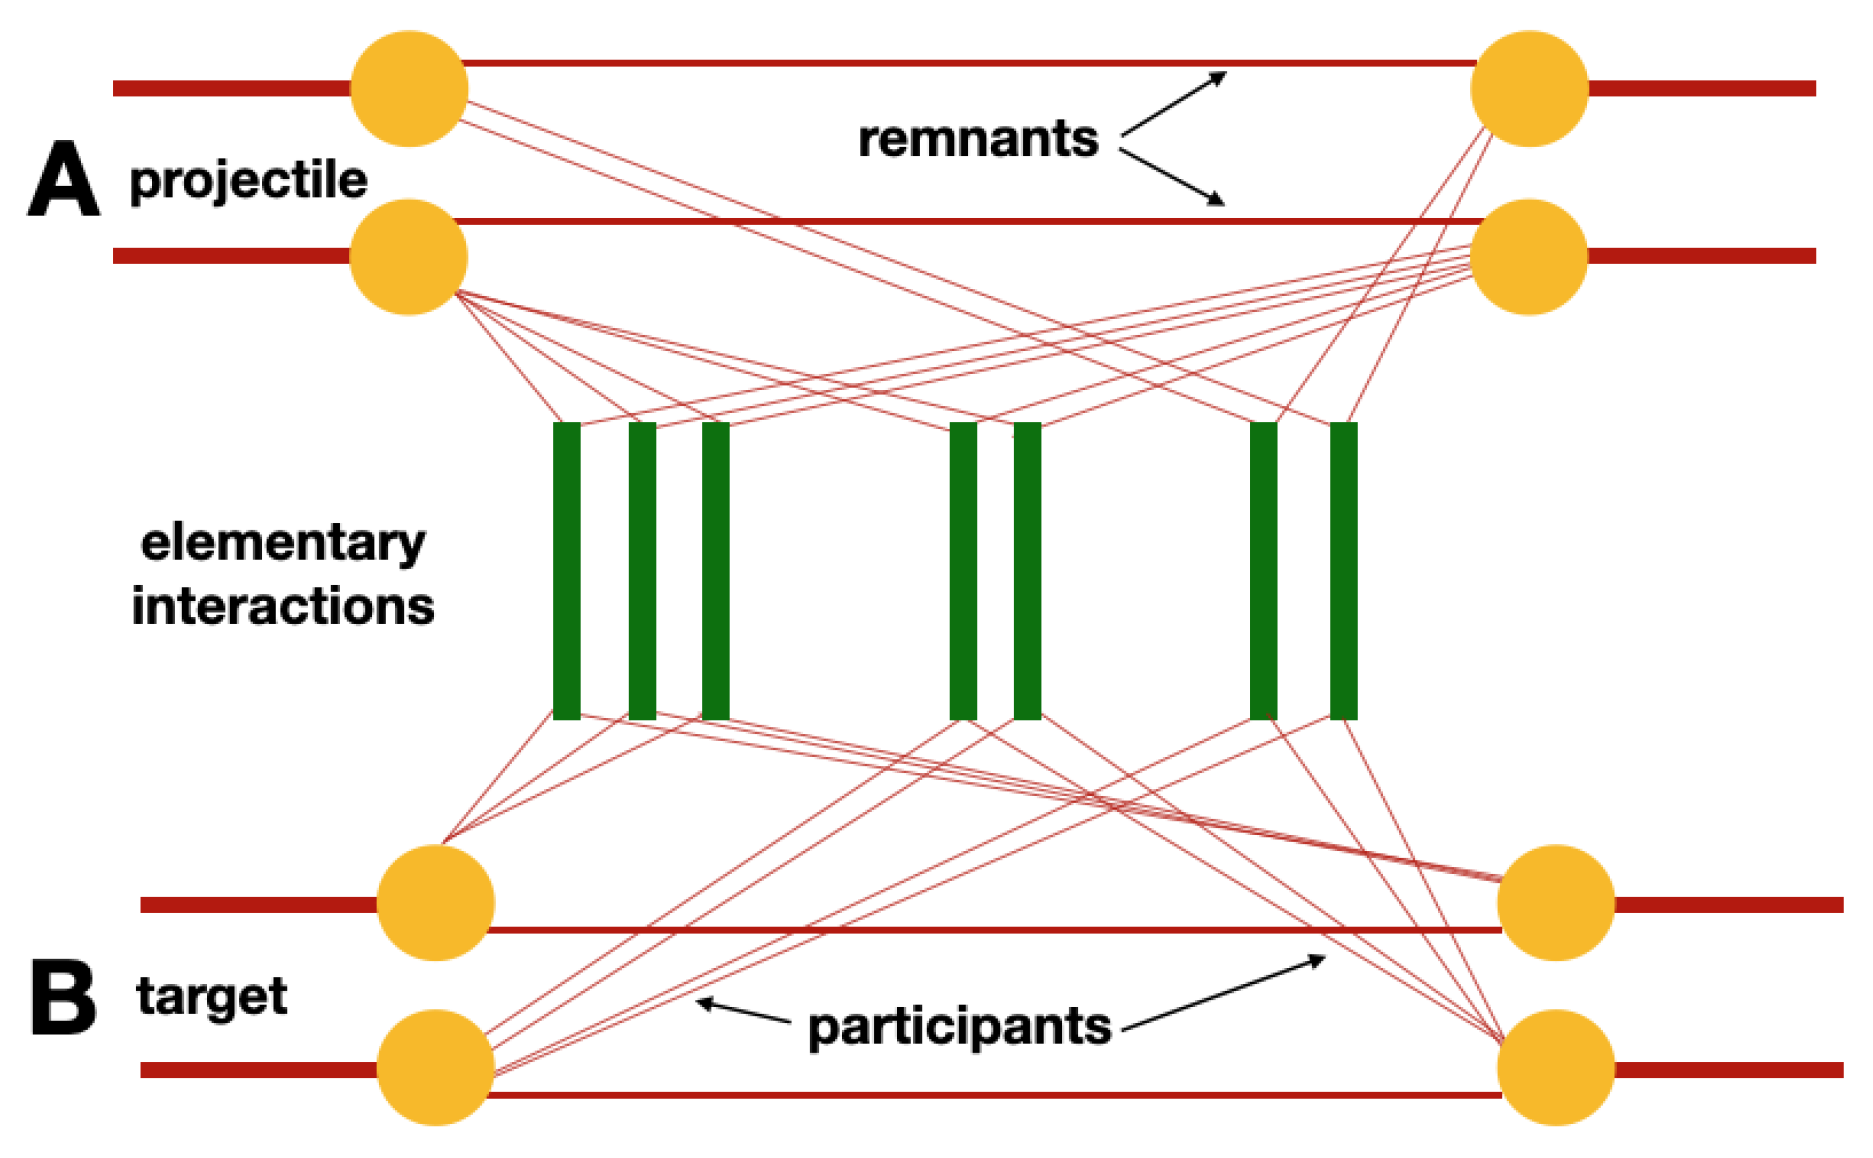
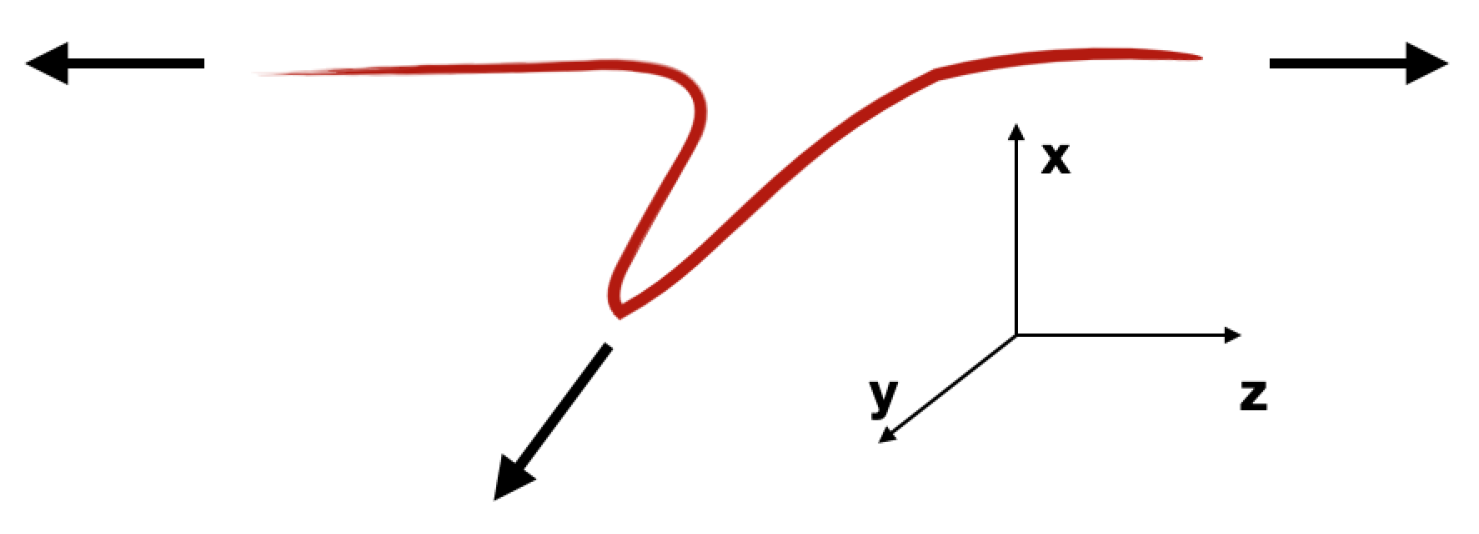
- initial stage (based on the Parton Gribov–Regge theory);
- core/corona division;
- hydrodynamical evolution;
- hadronization;
- hadron rescattering;
- resonance decays.
2.1. Initial Stage of the Evolution
2.2. Core-Corona Approach
2.3. Viscous Hydrodynamical Evolution, Event-by-Event Treatment and EoS
2.4. Hadronization and Hadronic Cascades
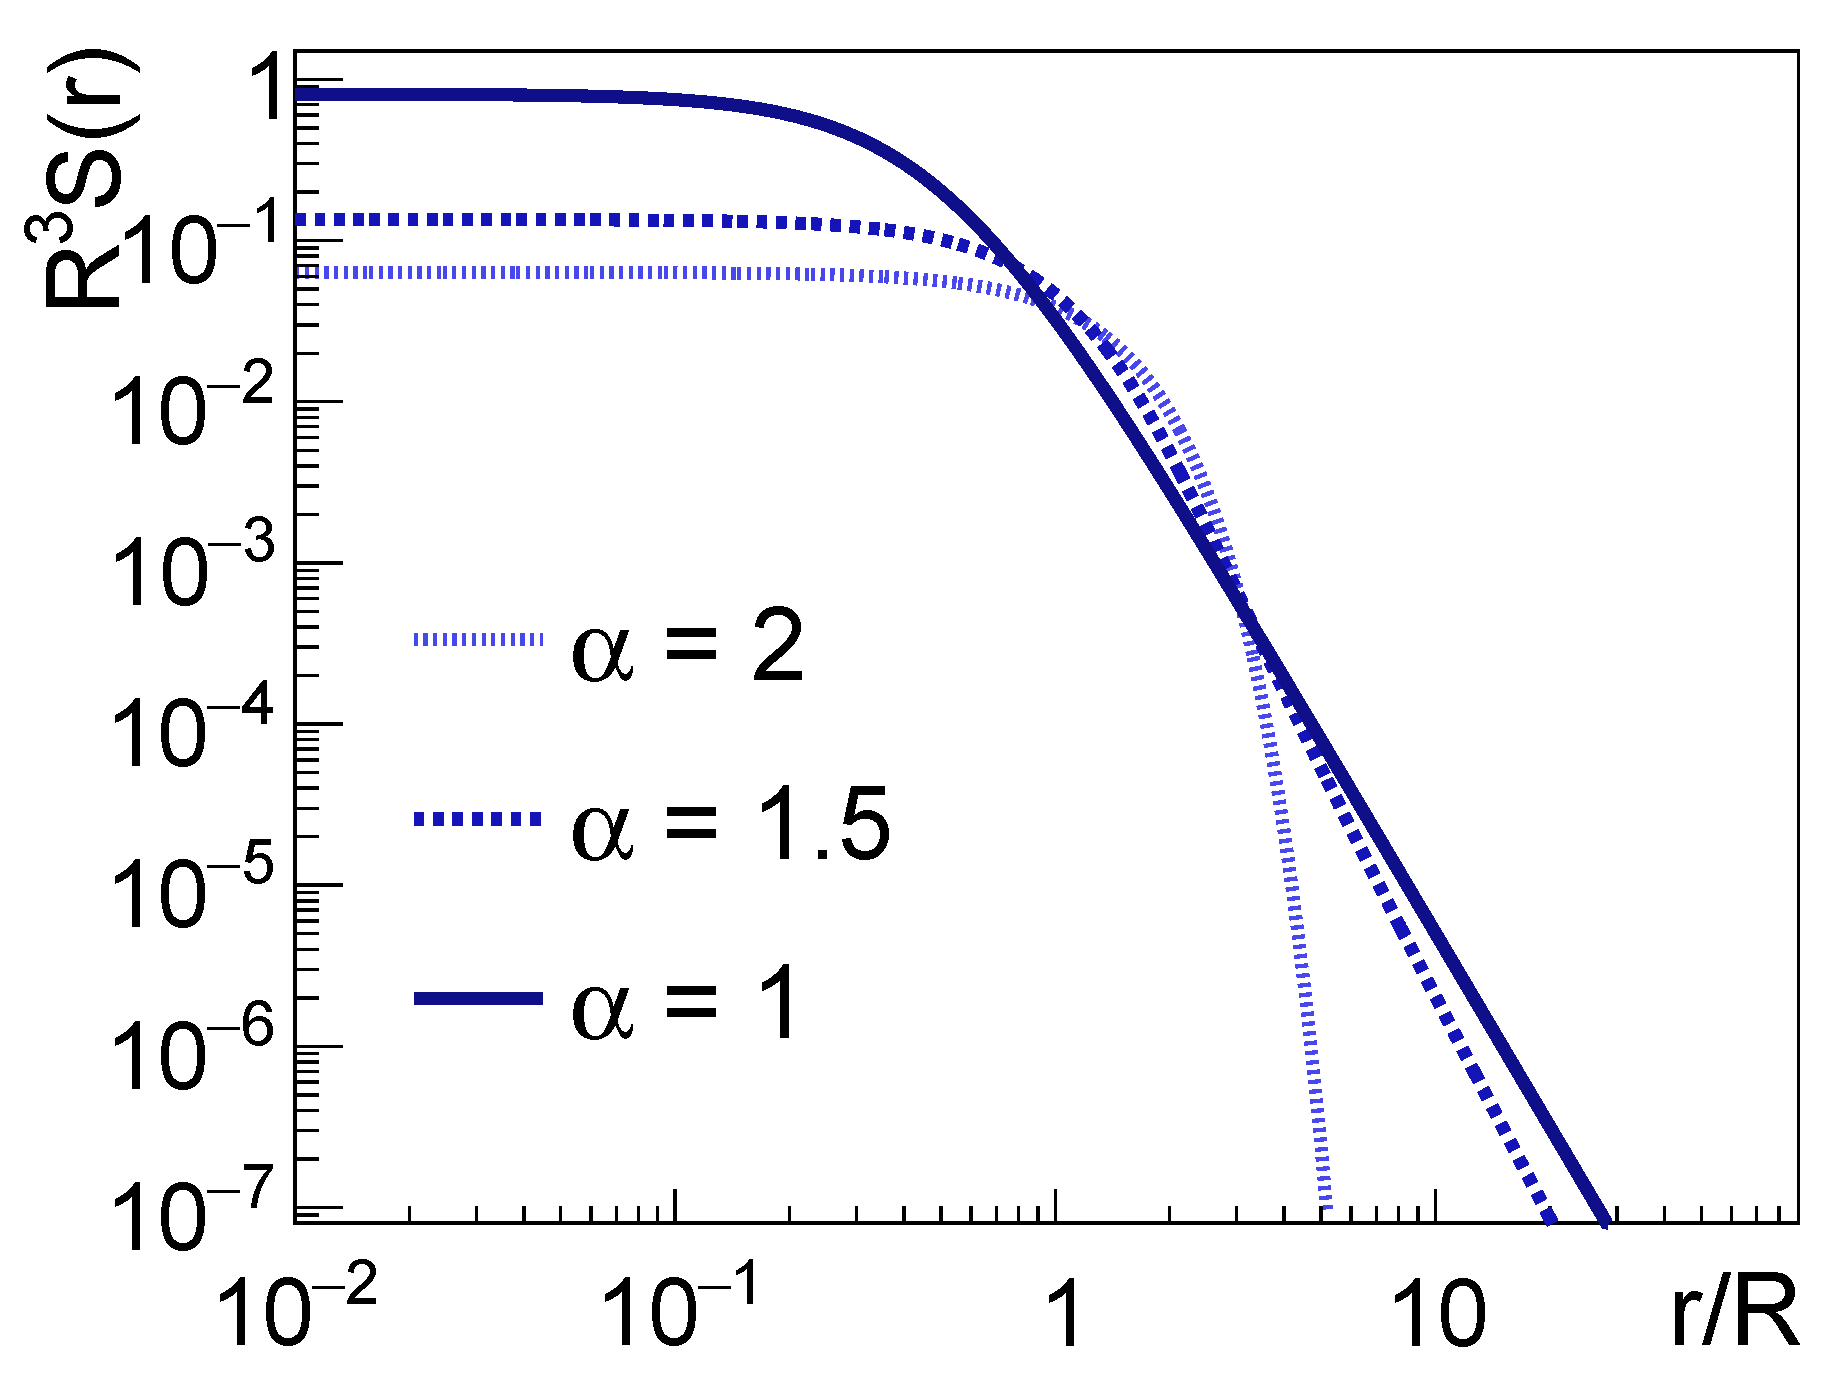
3. the Two-Particle Source Function
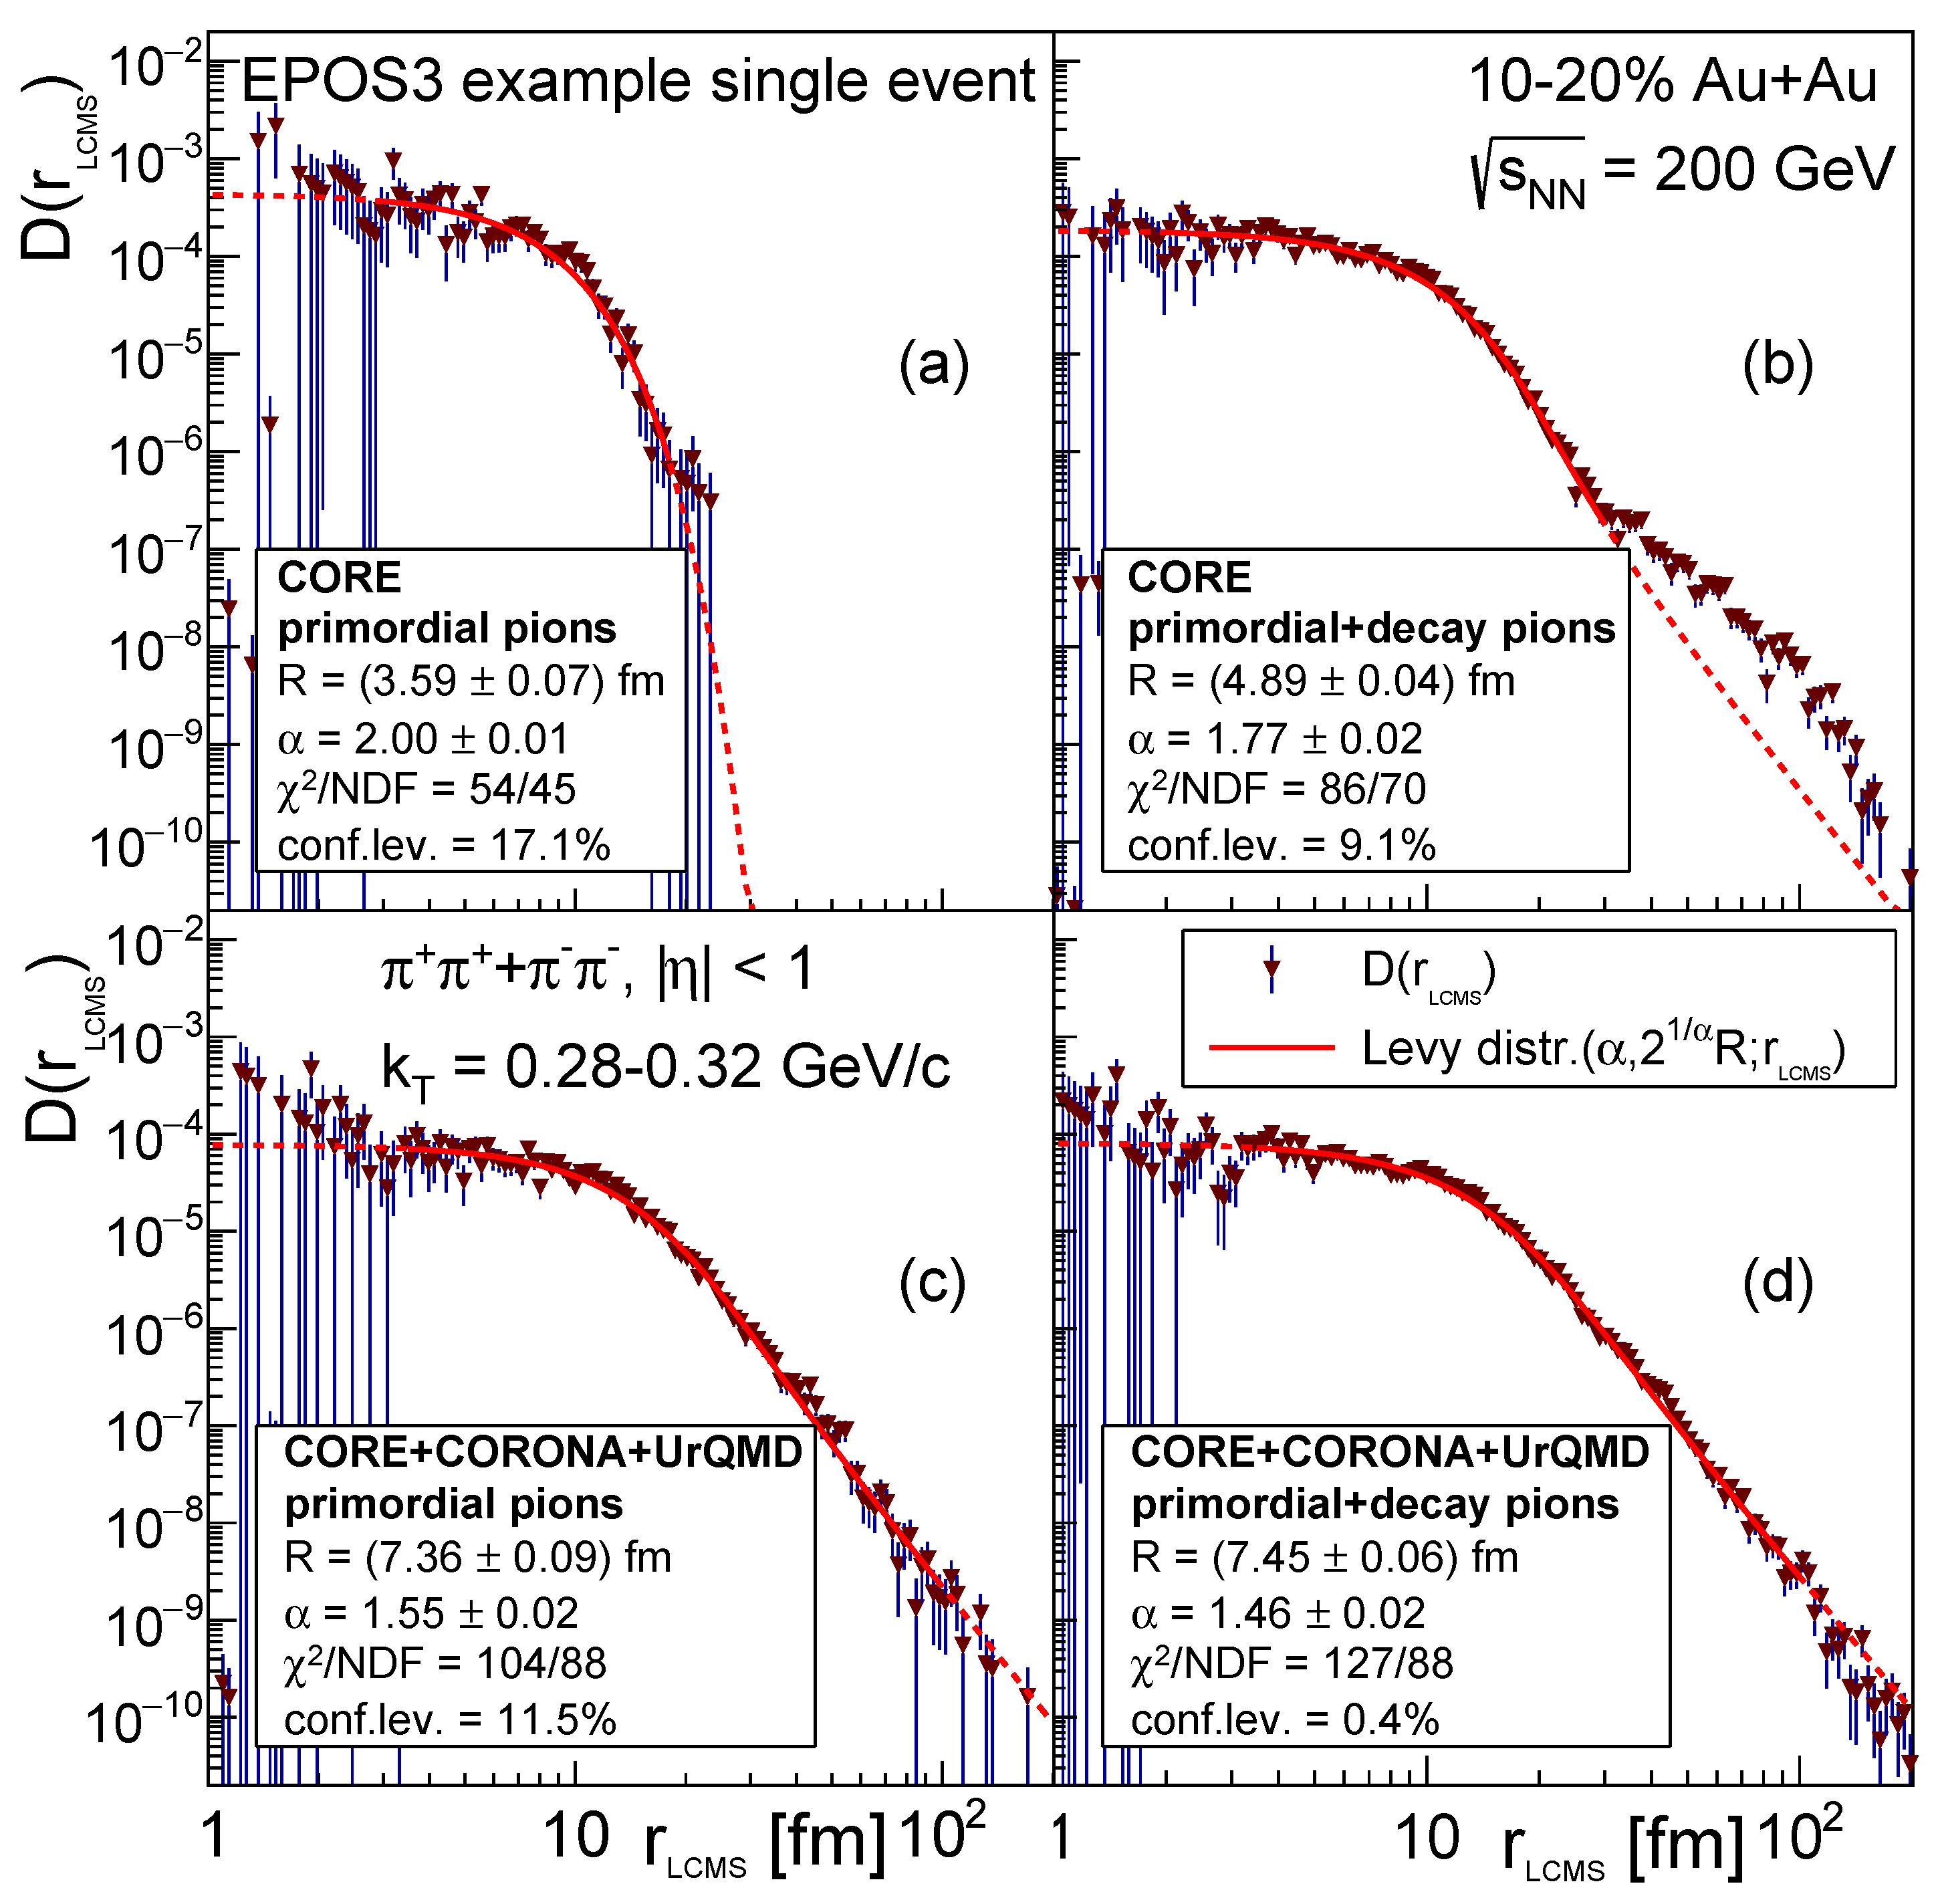
4. Analysis Method
- (a)
- CORE with only primordial pions;
- (b)
- CORE with primordial + decay pions;
- (c)
- CORE+CORONA+UrQMD with only primordial pions;
- (d)
- CORE+CORONA+UrQMD with primordial + decay pions,
5. Results and Discussion
6. Summary and Conclusions
Author Contributions
Funding
Data Availability Statement
Acknowledgments
Conflicts of Interest
Appendix A

| Primordial Pions | ||||||||
|---|---|---|---|---|---|---|---|---|
| Centr. | [GeV/c] | [GeV/] | [fm] | [fm] | cor() | cov() [fm] | ||
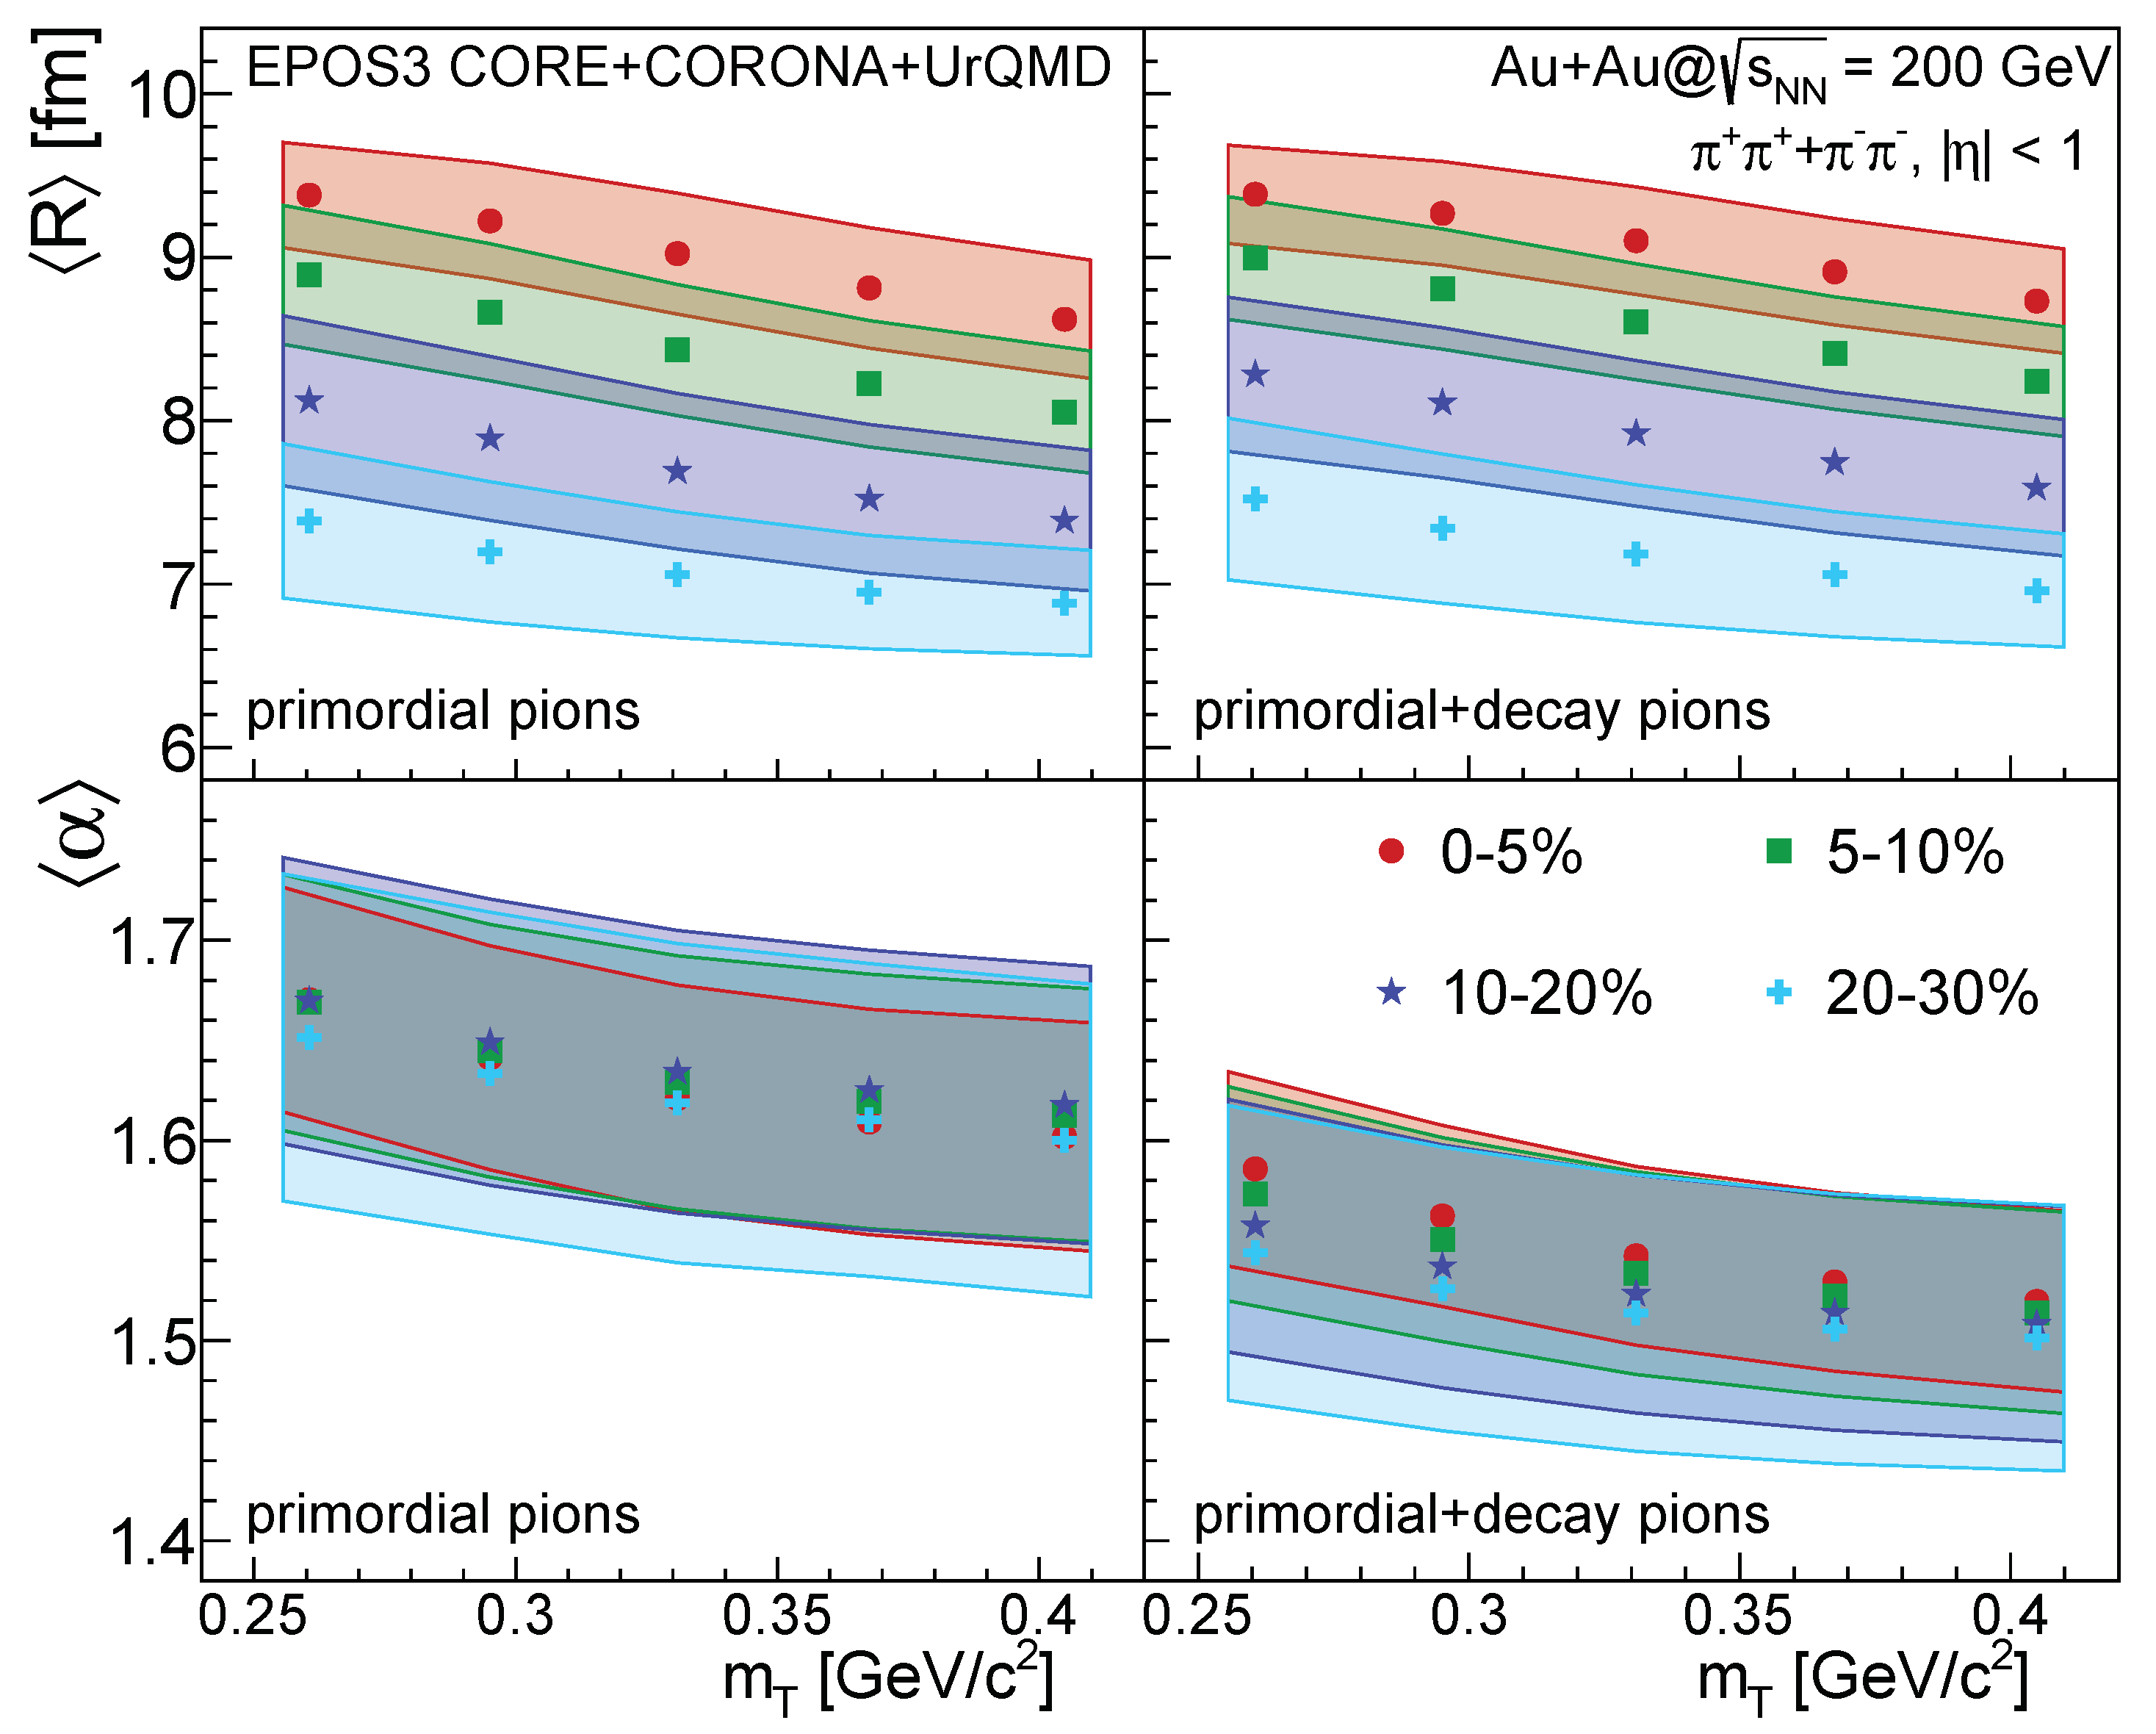
| 0–5% | 0.20–0.24 | 0.261 | 9.381 | 0.322 | 1.670 | 0.056 | −0.225 | −0.004 |
| 0.24–0.28 | 0.295 | 9.222 | 0.353 | 1.641 | 0.056 | −0.273 | −0.005 | |
| 0.28–0.32 | 0.331 | 9.021 | 0.370 | 1.621 | 0.056 | −0.305 | −0.006 | |
| 0.32–0.36 | 0.368 | 8.811 | 0.368 | 1.610 | 0.056 | −0.319 | −0.007 | |
| 0.36–0.40 | 0.405 | 8.619 | 0.361 | 1.603 | 0.056 | −0.324 | −0.007 | |
| 5–10% | 0.20–0.24 | 0.261 | 8.892 | 0.425 | 1.669 | 0.064 | −0.328 | −0.009 |
| 0.24–0.28 | 0.295 | 8.663 | 0.419 | 1.645 | 0.063 | −0.326 | −0.009 | |
| 0.28–0.32 | 0.331 | 8.431 | 0.401 | 1.630 | 0.062 | −0.329 | −0.008 | |
| 0.32–0.36 | 0.368 | 8.223 | 0.385 | 1.621 | 0.062 | −0.332 | −0.008 | |
| 0.36–0.40 | 0.405 | 8.049 | 0.372 | 1.614 | 0.061 | −0.316 | −0.007 | |
| 10–20% | 0.20-0.24 | 0.261 | 8.121 | 0.521 | 1.671 | 0.071 | −0.229 | −0.008 |
| 0.24–0.28 | 0.295 | 7.888 | 0.504 | 1.650 | 0.070 | −0.235 | −0.008 | |
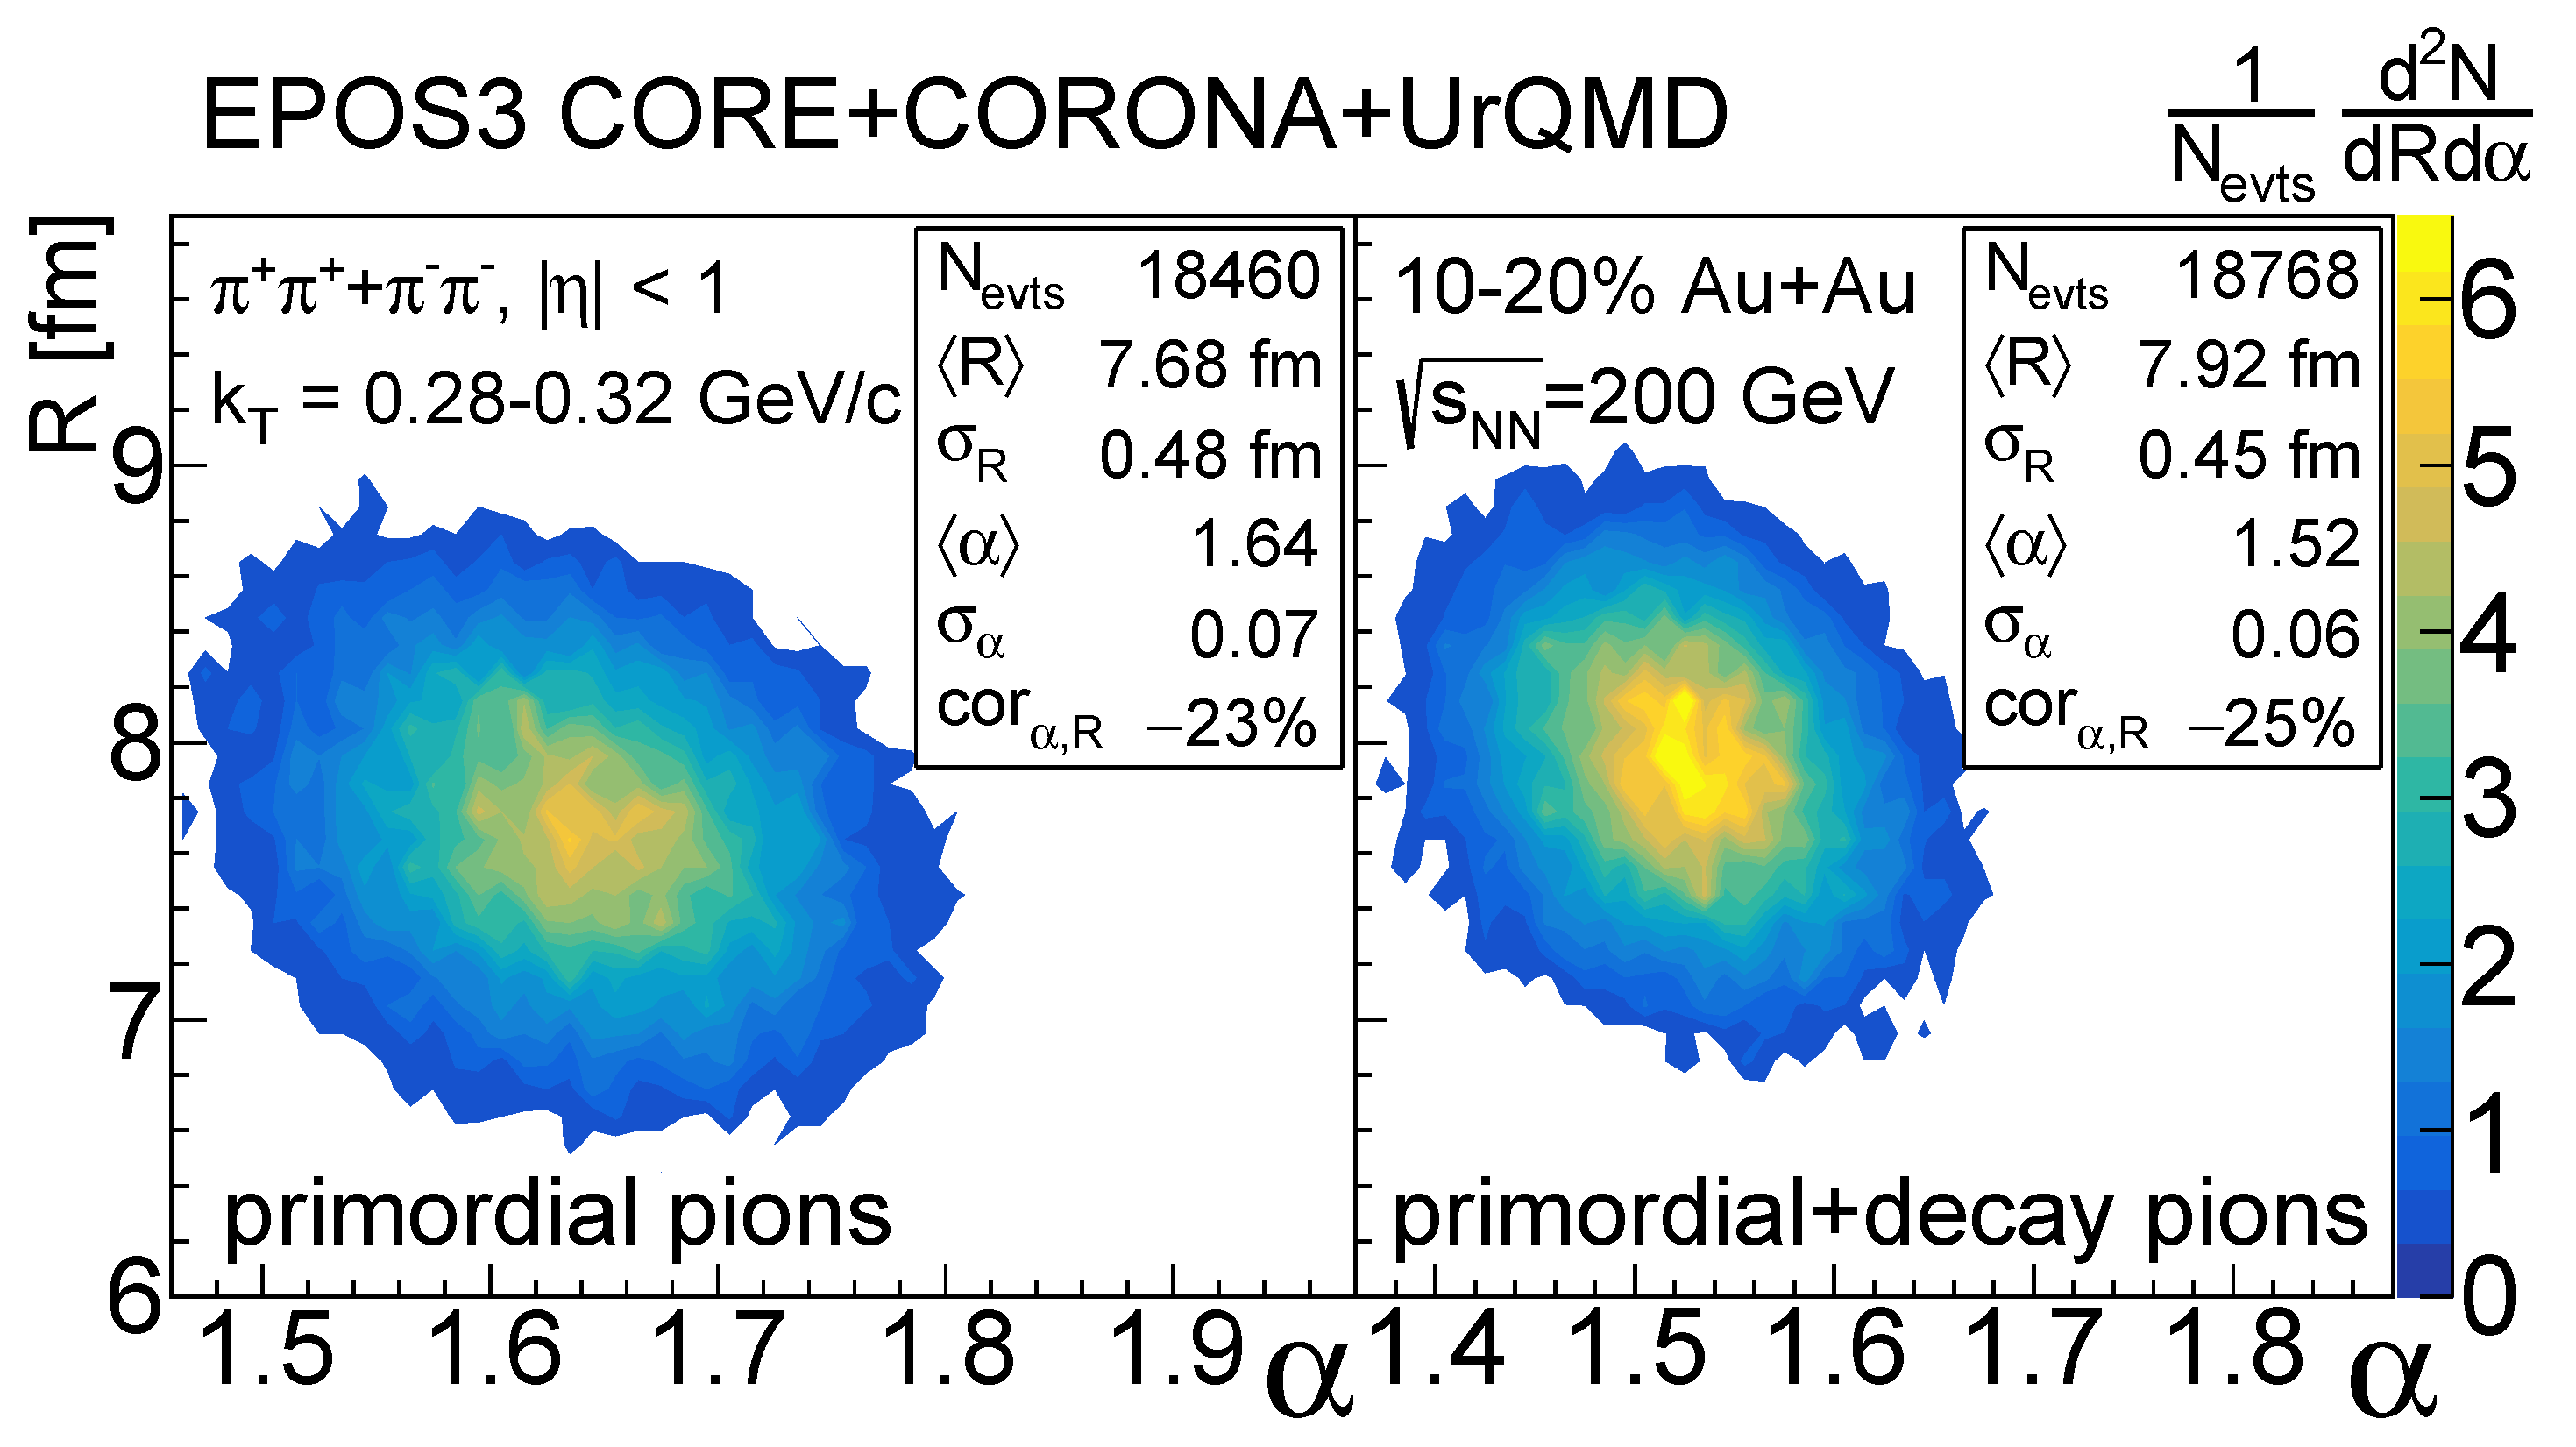
| 0.28–0.32 | 0.331 | 7.683 | 0.480 | 1.636 | 0.068 | −0.230 | −0.008 | |
| 0.32–0.36 | 0.368 | 7.510 | 0.463 | 1.627 | 0.067 | −0.224 | −0.007 | |
| 0.36–0.40 | 0.405 | 7.370 | 0.444 | 1.620 | 0.066 | −0.208 | −0.006 | |
| 20–30% | 0.20-0.24 | 0.261 | 7.350 | 0.502 | 1.655 | 0.078 | −0.142 | −0.006 |
| 0.24–0.28 | 0.295 | 7.135 | 0.471 | 1.639 | 0.076 | −0.128 | −0.005 | |
| 0.28–0.32 | 0.331 | 6.971 | 0.438 | 1.627 | 0.073 | −0.137 | −0.004 | |
| 0.32–0.36 | 0.368 | 6.844 | 0.407 | 1.619 | 0.072 | −0.119 | −0.003 | |
| 0.36–0.40 | 0.405 | 6.749 | 0.390 | 1.610 | 0.071 | −0.114 | −0.003 | |
| Primordial + Decay Pions | ||||||||
| Centr. | [GeV/] | [GeV/] | [fm] | [fm] | cor() | cov() [fm] | ||
| 0–5% | 0.20–0.24 | 0.261 | 9.385 | 0.301 | 1.586 | 0.049 | −0.287 | −0.004 |
| 0.24–0.28 | 0.295 | 9.269 | 0.318 | 1.562 | 0.045 | −0.224 | −0.003 | |
| 0.28–0.32 | 0.331 | 9.101 | 0.329 | 1.542 | 0.045 | −0.265 | −0.004 | |
| 0.32–0.36 | 0.368 | 8.911 | 0.326 | 1.529 | 0.045 | −0.277 | −0.004 | |
| 0.36–0.40 | 0.405 | 8.732 | 0.320 | 1.520 | 0.045 | −0.309 | −0.004 | |
| 5–10% | 0.20–0.24 | 0.261 | 8.995 | 0.375 | 1.573 | 0.054 | −0.311 | −0.006 |
| 0.24–0.28 | 0.295 | 8.805 | 0.368 | 1.550 | 0.051 | −0.292 | −0.005 | |
| 0.28–0.32 | 0.331 | 8.605 | 0.355 | 1.534 | 0.051 | −0.305 | −0.005 | |
| 0.32–0.36 | 0.368 | 8.413 | 0.344 | 1.522 | 0.050 | −0.309 | −0.005 | |
| 0.36–0.40 | 0.405 | 8.240 | 0.336 | 1.514 | 0.050 | −0.313 | −0.005 | |
| 10–20% | 0.20–0.24 | 0.261 | 8.284 | 0.472 | 1.557 | 0.063 | −0.236 | −0.007 |
| 0.24–0.28 | 0.295 | 8.109 | 0.460 | 1.537 | 0.061 | −0.237 | −0.007 | |
| 0.28–0.32 | 0.331 | 7.922 | 0.446 | 1.523 | 0.059 | −0.250 | −0.007 | |
| 0.32–0.36 | 0.368 | 7.744 | 0.433 | 1.514 | 0.059 | −0.253 | −0.006 | |
| 0.36–0.40 | 0.405 | 7.586 | 0.421 | 1.508 | 0.059 | −0.263 | −0.007 | |
| 20–30% | 0.20–0.24 | 0.261 | 7.500 | 0.517 | 1.544 | 0.074 | −0.252 | −0.010 |
| 0.24–0.28 | 0.295 | 7.305 | 0.489 | 1.527 | 0.071 | −0.256 | −0.009 | |
| 0.28–0.32 | 0.331 | 7.132 | 0.465 | 1.516 | 0.070 | −0.261 | −0.008 | |
| 0.32–0.36 | 0.368 | 6.982 | 0.437 | 1.509 | 0.068 | −0.256 | −0.008 | |
| 0.36–0.40 | 0.405 | 6.856 | 0.411 | 1.505 | 0.067 | −0.242 | −0.007 | |
References
- Lisa, M.A.; Pratt, S.; Soltz, R.; Wiedemann, U. Femtoscopy in relativistic heavy ion collisions. Ann. Rev. Nucl. Part. Sci. 2005, 55, 357–402. [Google Scholar] [CrossRef]
- Lednicky, R. Femtoscopy with Unlike Particles; International Workshop on the Physics of the Quark Gluon Plasma, 2001; Available online: https://arxiv.org/abs/nucl-th/0112011 (accessed on 17 February 2022).
- Goldhaber, G.; Fowler, W.B.; Goldhaber, S.; Hoang, T.F. Pion-pion correlations in antiproton annihilation events. Phys. Rev. Lett. 1959, 3, 181–183. [Google Scholar] [CrossRef]
- Goldhaber, G.; Goldhaber, S.; Lee, W.Y.; Pais, A. Influence of Bose-Einstein statistics on the anti-proton proton annihilation process. Phys. Rev. 1960, 120, 300–312. [Google Scholar] [CrossRef]
- Akkelin, S.V.; Sinyukov, Y.M. The HBT-interferometry of expanding inhomogeneous sources. Z. Phys. C 1996, 72, 501–507. [Google Scholar] [CrossRef]
- Akkelin, S.V.; Sinyukov, Y.M. The HBT interferometry of expanding sources. Phys. Lett. B 1995, 356, 525–530. [Google Scholar] [CrossRef]
- Csörgo, T.; Lorstad, B.; Zimányi, J. Quantum statistical correlations for slowly expanding systems. Phys. Lett. B 1994, 338, 134–140. [Google Scholar] [CrossRef]
- Csizmadia, P.; Csörgo, T.; Lukacs, B. New analytic solutions of the nonrelativistic hydrodynamical equations. Phys. Lett. B 1998, 443, 21–25. [Google Scholar] [CrossRef]
- Csörgo, T.; Lorstad, B. Bose-Einstein correlations for three-dimensionally expanding, cylindrically symmetric, finite systems. Phys. Rev. C 1996, 54, 1390–1403. [Google Scholar] [CrossRef]
- Csanád, M.; Vargyas, M. Observables from a solution of 1+3 dimensional relativistic hydrodynamics. Eur. Phys. J. A 2010, 44, 473–478. [Google Scholar] [CrossRef]
- PHENIX Collaboration; Adler, S.S.; Afanasiev, S.; Aidala, C.; Ajitanand, N.N.; Akiba, Y.; Alexander, J.; Amirikas, R.; Aphecetche, L.; Aronson, S.H.; et al. Bose-Einstein correlations of charged pion pairs in Au + Au collisions at s(NN)**(1/2) = 200-GeV. Phys. Rev. Lett. 2004, 93, 152302. [Google Scholar] [CrossRef]
- STAR Collaboration; Adams, J.; Aggarwal, M.M.; Ahammed, Z.; Amonett, J.; Anderson, B.D.; Arkhipkin, D.; Averichev, G.S.; Badyal, S.K.; Bai, Y.; et al. Pion interferometry in Au+Au collisions at S(NN)**(1/2) = 200-GeV. Phys. Rev. C 2005, 71, 044906. [Google Scholar] [CrossRef]
- PHENIX Collaboration; Afanasiev, S.; Aidala, C.; Ajitanand, N.N.; Akiba, Y.; Alexander, J.; Al-Jamel, A.; Aoki, K.; Aphe-cetche, L.; Armendariz, R.; et al. Source breakup dynamics in Au+Au Collisions at s(NN)**(1/2) = 200-GeV via three-dimensional two-pion source imaging. Phys. Rev. Lett. 2008, 100, 232301. [Google Scholar] [CrossRef] [PubMed]
- PHENIX Collaboration; Adler, S.S.; Afanasiev, S.; Aidala, C.; Ajitanand, N.N.; Akiba, Y.; Alexander, J.; Amirikas, R.; Aphecetche, L.; Aronson, S.H.; et al. Evidence for a long-range component in the pion emission source in Au + Au collisions at s(NN)**(1/2) = 200-GeV. Phys. Rev. Lett. 2007, 98, 132301. [Google Scholar] [CrossRef]
- PHENIX Collaboration; Adare, A.; Aidala, C.; Ajitanand, N.N.; Akiba, Y.; Akimoto, R.; Alexander, J.; Alfred, M.; Al-Ta’ani, H.; Angerami, A.; et al. Lévy-stable two-pion Bose-Einstein correlations in sNN=200 GeV Au+Au collisions. Phys. Rev. C 2018, 97, 064911. [Google Scholar] [CrossRef]
- Pórfy, B. Lévy HBT Results at NA61/SHINE. Universe 2019, 5, 154. [Google Scholar] [CrossRef]
- Csörgo, T.; Hegyi, S.; Zajc, W.A. Bose-Einstein correlations for Levy stable source distributions. Eur. Phys. J. C 2004, 36, 67–78. [Google Scholar] [CrossRef]
- Csanád, M.; Csörgo, T.; Nagy, M. Anomalous diffusion of pions at RHIC. Braz. J. Phys. 2007, 37, 1002–1013. [Google Scholar] [CrossRef]
- Csörgo, T.; Hegyi, S.; Novak, T.; Zajc, W.A. Bose-Einstein or HBT correlations and the anomalous dimension of QCD. Acta Phys. Polon. B 2005, 36, 329–337. [Google Scholar]
- Csörgo, T.; Hegyi, S.; Novák, T.; Zajc, W.A. Bose-Einstein or HBT correlation signature of a second order QCD phase transition. AIP Conf. Proc. 2006, 828, 525–532. [Google Scholar] [CrossRef]
- Cimermaň, J.; Plumberg, C.; Tomášik, B. The Shape of the Correlation Function. Phys. Part. Nucl. 2020, 51, 282–287. [Google Scholar] [CrossRef]
- Cimerman, J.; Plumberg, C.; Tomášik, B. The Shape of the Correlation Function. POS 2021, ICHEP2020, 538. [Google Scholar] [CrossRef]
- Werner, K.; Karpenko, I.; Pierog, T.; Bleicher, M.; Mikhailov, K. Event-by-Event Simulation of the Three-Dimensional Hydrodynamic Evolution from Flux Tube Initial Conditions in Ultrarelativistic Heavy Ion Collisions. Phys. Rev. C 2010, 82, 044904. [Google Scholar] [CrossRef]
- Drescher, H.J.; Hladik, M.; Ostapchenko, S.; Pierog, T.; Werner, K. Parton based Gribov-Regge theory. Phys. Rep. 2001, 350, 93–289. [Google Scholar] [CrossRef]
- Stefaniak, M. Beam Energy Scan Dependence of Elliptic and Triangular Flow of Identified Hadrons in the STAR Experiment and the EPOS Model. Ph.D. Thesis, Warsaw University of Technology, Warsaw, Poland, 2021. [Google Scholar]
- Andersson, B. The lund string model. In Proceedings of the 7th European Symposium on Antiproton Interactions: From LEAR to the Collider and Beyond, Durham, UK, 9–13 July 1984. [Google Scholar]
- Ferreres-Solé, S.; Sjöstrand, T. The space–time structure of hadronization in the Lund model. Eur. Phys. J. C 2018, 78, 983. [Google Scholar] [CrossRef] [PubMed]
- Werner, K.; Guiot, B.; Karpenko, I.; Pierog, T. Analysing radial flow features in p-Pb and p-p collisions at several TeV by studying identified particle production in EPOS3. Phys. Rev. C 2014, 89, 064903. [Google Scholar] [CrossRef]
- Werner, K. Core-corona separation in ultra-relativistic heavy ion collisions. Phys. Rev. Lett. 2007, 98, 152301. [Google Scholar] [CrossRef]
- Borsanyi, S.; Endrodi, G.; Fodor, Z.; Jakovac, A.; Katz, S.D.; Krieg, S.; Ratti, C.; Szabo, K.K. The QCD equation of state with dynamical quarks. JHEP 2010, 11, 077. [Google Scholar] [CrossRef]
- Cooper, F.; Frye, G. Comment on the Single Particle Distribution in the Hydrodynamic and Statistical Thermodynamic Models of Multiparticle Production. Phys. Rev. D 1974, 10, 186. [Google Scholar] [CrossRef]
- Bleicher, M.; Zabrodin, E.; Spieles, C.; Bass, S.A.; Ernst, C.; Soff, S.; Bravina, L.; Belkacem, M.; Weber, H.; Stöcker, H.; et al. Relativistic hadron hadron collisions in the ultrarelativistic quantum molecular dynamics model. J. Phys. G 1999, 25, 1859–1896. [Google Scholar] [CrossRef]
- Bass, S.A.; Belkacem, M.; Bleicher, M.; Brandstetter, M.; Bravina, L.; Ernst, C.; Gerland, L.; Hofmann, M.; Hofmann, S.; Konopka, J.; et al. Microscopic models for ultrarelativistic heavy ion collisions. Prog. Part. Nucl. Phys. 1998, 41, 255–369. [Google Scholar] [CrossRef]
- Stefaniak, M. Examination of Heavy-ion Collisions Using EPOS Model in the Frame of BES Program. Acta Phys. Polon. Supp. 2018, 11, 695. [Google Scholar] [CrossRef]
- PHENIX Collaboration; Afanasiev, S.; Aidala, C.; Ajitanand, N.N.; Akiba, Y.; Alexander, J.; Al-Jamel, A.; Aoki, K.; Aphecetche, L.; Armendariz, R.; et al. Kaon interferometric probes of space-time evolution in Au+Au collisions at s(NN)**(1/2) = 200-GeV. Phys. Rev. Lett. 2009, 103, 142301. [Google Scholar] [CrossRef] [PubMed]
- Lökös, S. Centrality dependent Lévy-stable two-pion Bose-Einstein correlations in = 200 GeV Au+Au collisions at the PHENIX experiment. Universe 2018, 4, 31. [Google Scholar] [CrossRef]


Publisher’s Note: MDPI stays neutral with regard to jurisdictional claims in published maps and institutional affiliations. |
© 2022 by the authors. Licensee MDPI, Basel, Switzerland. This article is an open access article distributed under the terms and conditions of the Creative Commons Attribution (CC BY) license (https://creativecommons.org/licenses/by/4.0/).
Share and Cite
Kincses, D.; Stefaniak, M.; Csanád, M. Event-by-Event Investigation of the Two-Particle Source Function in Heavy-Ion Collisions with EPOS. Entropy 2022, 24, 308. https://doi.org/10.3390/e24030308
Kincses D, Stefaniak M, Csanád M. Event-by-Event Investigation of the Two-Particle Source Function in Heavy-Ion Collisions with EPOS. Entropy. 2022; 24(3):308. https://doi.org/10.3390/e24030308
Chicago/Turabian StyleKincses, Dániel, Maria Stefaniak, and Máté Csanád. 2022. "Event-by-Event Investigation of the Two-Particle Source Function in Heavy-Ion Collisions with EPOS" Entropy 24, no. 3: 308. https://doi.org/10.3390/e24030308