
A Theoretical Comparative Study of Vapor-Compression Refrigeration Cycle using Al2O3 Nanoparticle with Low-GWP Refrigerants


School of Civil Engineering, Chongqing University, Chongqing 400045, China
*
Author to whom correspondence should be addressed.
Entropy 2022, 24(12), 1820; https://doi.org/10.3390/e24121820
Submission received: 17 November 2022
/
Revised: 5 December 2022
/
Accepted: 12 December 2022
/
Published: 13 December 2022
(This article belongs to the Special Issue Applied Thermodynamics and Heat Transfer)
Abstract
:Nanorefrigerant is a mixture of nanoparticles and pure refrigerant, which can increase heat transfer characteristics in refrigeration and air conditioning equipment. The performance of four different Al2O3 nanorefrigerants and their pure fluids (R600a, R134a, R1234yf, and R1233zd(E)) is analyzed in a vapor-compression refrigeration cycle. The enthalpy of a nanorefrigerant in the refrigeration cycle is calculated by using the prediction method based on the density of nanorefrigerant. A numerical model is established for the thermodynamic analysis, and the results show that adding nanoparticles to the pure refrigerant enhances heat transfer in heat exchangers, increases cooling capacity, reduces compressor power consumption, and finally improves the performance of the refrigeration system. The COP improvement of R1233zd(E) + Al2O3 nanorefrigerant is the highest, and the COP improvement of R134a + Al2O3 and R1234yf + Al2O3 are close to each other. When the mass fraction of Al2O3 nanoparticles increases to 0.30%, the COP of R1233zd(E) and R600a increases by more than 20%; the maximum exergy efficiency is 38.46% for R1233zd(E) + Al2O3, and the minimum exergy efficiency is 27.06% for pure R1234yf. The results provide a basis for the application of nanorefrigerants in the vapor compression refrigeration cycle.
1. Introduction
One of the most important utilities for people’s daily lives is refrigeration systems. The vapor-compression refrigeration cycle (VCRC) is widely used in domestic and industrial sectors due to its higher Coefficient of Performance (COP) [1,2,3]. VCRCs have a share of about 30% of the total world energy consumption, and this ratio may increase due to refrigerant leakage [4,5]. The performance of the refrigeration system can be improved either by increasing the rate of heat absorption in the evaporator or by reducing the compressor power.
In 1995, Choi of the Argonne National Laboratory observed that mixing nanoparticles in a base fluid produces a thermally enhanced fluid called a nanofluid [6]. Since then, nanofluids have received the attention of many researchers around the world. Research on the enhanced heat transfer capacity provided by some nanoparticles dispersed in the base fluid has attracted interest among nanotechnology researchers. Nanoparticles can be synthesized by many methods, including chemical, physical, and biological approaches [7]. The use of metallic and semiconductor nanoparticles has been proven to enhance the heat transfer properties since the surface area and specific heat increase. In summary, for the nanorefrigerants, the specific heat increases with the temperature and decreases with the concentration; the thermal conductivity increases with the increase of concentration and temperature; the viscosity and density increase with the augmentation of concentration and decrease with the increment of temperature [8,9,10]. For more information on the preparation methods (single-step and two-step), thermophysical properties, heat transport mechanism, tribological behavior and stabilities of these nanorefrigerants, please refer to review publications of Table 1.
The performance of the refrigeration system is directly related to the thermophysical properties of the refrigerant. Improving the thermophysical properties of the refrigerant can improve the system’s performance. Besides, the performance of VCRCs can be improved by ejector application, suitable refrigerant selection, operating conditions optimization, recovering the waste heat, and cycle configuration [16,17,18].
The emphasis of this study is to analyze the impact of the use of nanorefrigerants on the overall system performance. Studies on the performance of nanorefrigerants in VCRC are presented in Table 2. It is found that the most preferred nanoparticle is Al2O3, and it is followed by TiO2, SiO2, and CuO nanoparticles because of their stability characteristics in the base refrigerant; the most preferred refrigerant is R134a, followed by R600a.
Furthermore, Bellos and Tzivanidis [29] studied an absorption refrigeration system operating with the LiBr-H2O working pair driven by a solar collector. Pure water and water + Cu nanofluid (2 vol.%) are the examined working fluids on the solar field. The results showed that the mean thermal efficiency has an increase of nearly 2.5%. The daily exergetic performance and refrigeration production is increased to 4.0% and 0.84%, respectively, with the use of nanofluids in the solar collector. Hamrahi et al. [30] studied the influence of nanoactivated carbon on the property of solar adsorption chillers with two beds adsorption refrigerators. Adding nanoactivated carbon with concentrations of 4.7 wt.%, 11.1 wt.%, and 18.3 wt.% to the adsorption bed under 30 °C and 34 °C can increase COP by 11% and 21%, 33% and 17%, 23%, and 25%, respectively. Tashtoush et al. [31] studied the effect of nanoparticles on the COP of the ejector refrigeration cycle. The results showed that the improvement in COP reaches 24.7% and 12.61% for R134a with 2 wt.% CuO and Al2O3, respectively, while the refrigerant vapor mass at evaporator exit increases from 0.7616 for pure R134a to 0.8212 for R134a + 0.2 wt.% CuO nanorefrigerant. Moreover, Azmi et al. [32] reviewed the impact of nanorefrigerant and nanolubricant on energy saving in refrigeration systems. Sharif et al. [33] reviewed the mechanism for improvement in VCRC performance with nanorefrigerants and nanolubricants. Bhattad et al. [34] summarized the applications of nanofluids as refrigerants, lubricants, and secondary fluids in refrigeration systems. Jiang et al. [35] discussed the nanofluid advantages in absorption refrigeration systems.
Although a large number of numerical and experimental studies on nanofluids have been conducted, most of the investigations focus on the fundamental properties and heat transfer characteristics of nanorefrigerants. There are limited studies on the evaluation of the refrigeration cycle efficiency with nanorefrigerants, especially few reports on the applicability of a nanoparticle-enhanced vapor-compression refrigeration cycle. Also, nanorefrigerant studies are typically experimental due to the absence of nanorefrigerant state equations. In the present analysis, the feasibility of four refrigerants, R600a, R134a, R1234yf, and R1233zd(E), containing Al2O3 nanoparticles for the vapor-compression refrigeration cycle is carried out numerically. With a mass fraction of 0.1% Al2O3 nanoparticles, the performance of these four nanorefrigerants is evaluated for various evaporation and condensation temperatures. The system performance is mainly presented in terms of COP and exergy efficiency. In addition, the effect of different mass fractions of nanoparticles is investigated. It provides a reference for the application of nanorefrigerant in refrigeration equipment such as domestic refrigerators and air conditioners.
2. Methodology
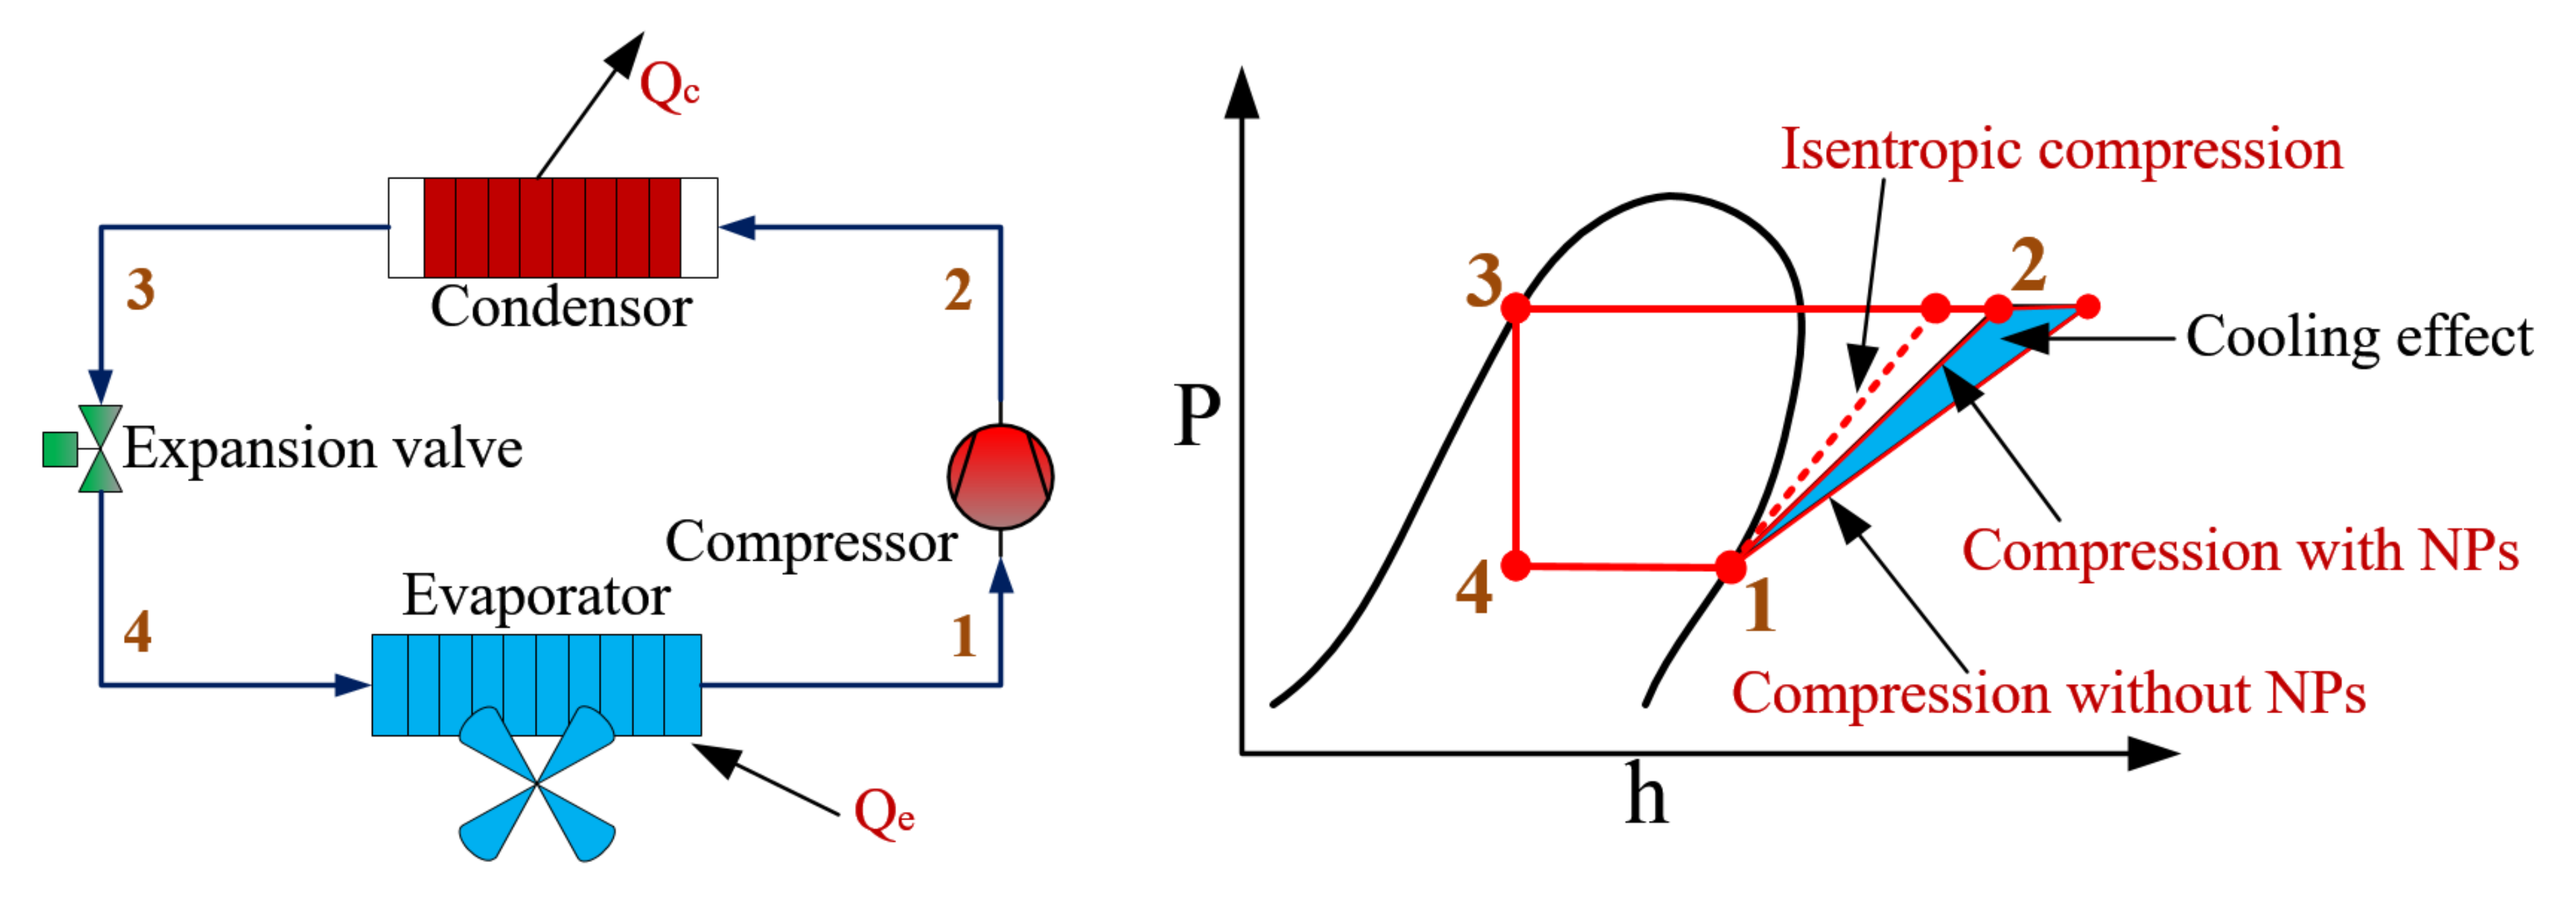
The principles of a refrigeration cycle are no different from standard VCRC. The simulation is mainly to calculate the effect of nanoparticles (NPs) on the refrigerant’s physical parameters and to correct the compression process model. The refrigeration system schematic and the corresponding P-h diagram are shown in Figure 1. In this study, the nanorefrigerant model is based on the work of Aktemur et al. [36], Aktas et al. [37], and Javadi [28], and several assumptions from the work of Tashtoush et al. [31] and Bellos et al. [29] are made to simplify the model: (1) Heat loss and pressure drop of the working fluid during heat transfer are not considered. (2) The working fluid is saturated at the evaporator and the condenser outlet. (3) The NPs are uniformly distributed in the gas and liquid phases of the working fluid without aggregation and sedimentation effects. (4) The refrigerant and NPs are at the same temperature in each component.
2.1. Nanorefrigerant Model
The properties of the four preliminary selected refrigerants are shown in Table 3. International protocols such as Kyoto (1997) and Montreal (1987) restrict the usage of chlorofluorocarbons (CFCs) and hydrochlorofluorocarbons (HCFCs) in VCRCs despite their lower price. Most developed countries ruled out the options of CFCs in refrigeration. While HCFCs are considered for short-term (transitional) use, hydrofluorocarbons (HFCs) are preferred for long-term applications. HCFC refrigerants are expected to be phased out in developing countries (by 2040) and developed countries (by 2030). HFCs are phased down due to the F-Gas regulation. As a result, CFCs, HCFCs, and HFCs will be phased out in the near future due to their adverse effects on the environment. After 2010, the fourth generation of refrigerants (hydrofluoroolefins HFOs) was introduced with the main purpose of focusing on low GWP, low ODP, and short lifetime [38]. In addition to HFOs, hydrochlorofluorocarbon olefins (HCFOs) are also thought to have low ODP and extremely short life spans, as well as very low GWP. From an environmental and economic sustainability perspective, hydrocarbons (HCs) are considered to be the best choice of refrigerant.
The HFC-134a currently remains the most commonly used refrigerant in vehicle air conditioning, large air/water cooling units, or high-temperature heat pump systems because of its excellent thermal-physical properties and low cost. After 2022, R134a will be banned in automotive air conditioners because the GWP value is as high as 1430. Eco-friendly refrigerants, such as R1234yf, R1234ze, and R152a, have the possibility of directly replacing R134a due to similar thermodynamic properties [42]. The HC-290 and HC-600a can be used as alternatives to the R134a in household refrigerators. HFO-1234yf is the best alternative to R134a in automobile air conditioning systems. R-1233zd(E) is expected to replace R134a as a low-temperature heat pump cycle refrigerant due to its similar physical properties.
Nanorefrigerants (NRs) can be prepared by adding carbonaceous material, metal, metal oxides, conducting polymers, nanocomposite, or hybrid nanoparticles into the pure refrigerant. The thermophysical properties of the NR depend on the thermophysical properties of the pure refrigerant and NPs, such as density, specific heat, thermal conductivity, viscosity, mixture ratio, and concentration. The percentage of the most preferred NPs is summarized in Table 4 [43]. The preferred NP is by far Al2O3, with 36.84% of research work; other commonly used NPs include CuO, TiO2, and SiO2. The thermal conductivity, density, and specific heat of NPs are not dependent on their size. As shown in Table 5, volume fraction () is commonly used to calculate the thermophysical properties of NPs. Due to the difficulty of measuring the exact volume of NPs, the volume fraction () can be corrected by the mass fraction ().
The density of the NR can be used as a metric to calculate the enthalpy because there are no characteristic correlations of the NRs. The parameter in the thermal conductivity expression () depends on the shape of the particles. The density () of the NR is higher than that of the single refrigerant, while the specific heat capacity () is lower. In addition, effective dynamic () and thermal conductivity () are slightly increased but not constant at different components [47].
2.2. Energy Model
The general energy balance equation can be defined as:
Based on the first law of thermodynamics, the thermodynamic equations of each component are obtained, as shown in Table 6. The compressor isentropic efficiency () adopts the pressure ratio () correlation formula, which obtains the exhaust temperature and the compressor power consumption (). The NPs absorb heat from the refrigerant during the compression process, with the aim of achieving approximately isentropic compression. This effect is similar to the injection of oil or water in the compressor cylinder, which can reduce the discharge temperature and improve the compressor’s performance.
2.3. Exergy Model
When the kinetic and potential energy changes are neglected, the exergy at each state point can be defined as:
The general exergy balance can be expressed as:
Based on the second law of thermodynamics, the exergy destruction () and exergy efficiency () of each component is listed in Table 7. The dead state of the working fluid is at pressure and temperature .
2.4. Performance Evaluation
The COP for the system is calculated by:
The total exergy destruction is expressed by:
Also, the exergy efficiency can be described by:
Relative irreversibility (RI) can be defined for the component:
In addition, improvements in the and of the nanorefrigerant system over the pure refrigerant system are evaluated:
3. Model Validation
To verify the accuracy of the proposed model, the COP for the pure R134a and R134a + SiO2 nanorefrigerants are calculated with the same operating conditions in [50] (evaporation and condensation temperatures of −7 °C and 42 °C, respectively). It should be noted that the is calculated as follows: Firstly, evaporation temperature () and saturation pressure () are set to −7 °C and 225 kPa, respectively. Then, the density of pure refrigerant () is calculated from the CoolProp database. Based on the density of and the and the mixture ratio, the density of nanorefrigerant () can be estimated. Last, the enthalpy, entropy, temperature, and pressure can be determined for point 1. The condensation temperature () and saturation pressure () are specified as 42 °C and 1072 kPa, respectively, for point 3, and the thermophysical parameters at point 3 are determined in similar methods as point 1. The at the evaporator inlet is equal to due to adiabatic expansion in the expansion valve. The thermophysical parameters at point 2 are determined by and . The and are summarized in Table 8. It can be found that the simulated COP and Akhayere et al. [51] data show the same trend: an increase in the COP with the SiO2 nanoparticles. A rise of 23.46% in COP is obtained by Hussin et al. [50], while an increase of 20.32% is recorded in this study. The deviation of the theoretical COP is not greater than ±5%, and the average deviation is −1.21%. Although small deviations exist, it still proves that the model works well enough to make accurate predictions. Moreover, according to the conclusion of Hussin et al. [50], by increasing NP mass fraction up to 0.5%, the COP value is increased and later decreased as compared to the pure R134a. Increasing the amount of NPs can improve the heat transfer performance of the cooling system. A high number of NPs increases the pressure drop of the refrigerant and correspondingly increases the required pumping power.
4. Results and Discussion
4.1. Comparative Study under Typical Operating Conditions
Table 9 provides related properties and results for the cycle working with four selected pure refrigerants and NRs under typical operating conditions of , (the mass fraction of the NP is 0.1%). Thermophysical properties like density, pressure, enthalpy, and entropy of refrigerants can be predicted by general form-state equations. The enthalpy of NR at point 1 is slightly higher than that of pure refrigerant. Enthalpy at point 3 for the NR is slightly below that of pure refrigerant. Enthalpy and temperature at point 2 are slightly lower than those in the pure refrigerant system, mainly attributed to the cooling effect of the Al2O3 NPs during the compression process. The obtained NR density is slightly increased compared to the pure refrigerant density. It is also discovered that adding Al2O3 NPs to the pure refrigerants enhances the evaporator heat per unit mass () and evaporator heat per unit volume (). The of R600a is observed to be the highest, and the lowest values are obtained in the case of R1234yf. The of R1233zd(E) is the smallest, while R134a is the highest. A high indicates that a small compressor is required, reducing the initial investment costs of the refrigeration system. The discharge temperature of R134a is higher than that of R600a, R1234yf, and R1233zd(E). A lower discharge temperature increases the longevity of the compressor and reduces oil aging. R134a has the lowest compressor efficiency, while R1233zd(E) has the highest compressor efficiency.
Compared with the pure refrigerants R600a, R134a, R1234yf, and R1233zd(E), the compressor work per unit mass () with 0.1% Al2O3 nanoparticles is decreased by 2.96%, 2.80%, 2.89%, and 6.13%, respectively; and the corresponding COP is increased by 6.36%, 3.10%, 3.32%, and 6.92%, respectively. The COP of R1233zd(E) decreases to a larger extent than the other refrigerant. An increase in COP is caused by an increase in and a decrease in . The COP values of R600a and R1233zd(E) are greater than that of R134a, while the COP value of R1234yf is smaller than that of R134a. Among the NRs studied, the R1233zd(E) + Al2O3 has the highest COP value, while the R1234yf + Al2O3 has the lowest COP value. In the case of R134a + Al2O3, the COP is 11.41% less than that of R1233zd(E) + Al2O3, it is 5.41% lower than that of R600a + Al2O3, and it is 0.60% higher than that of R1234yf + Al2O3. The R1233zd(E) with Al2O3 nanoparticles may be used as a replacement for R134a because of zero ODP, low GWP, and the most appropriate thermodynamic characteristics.
4.2. Performance Analysis under Variable Operating Conditions
It should be noted that the problem of maximizing cycle performance and the constraints can be described as follows: The evaporation temperature ranges from −10 °C to 20 °C, the condensation temperature varies from 25 °C to 55 °C, the mass fraction of Al2O3 nanoparticles ranges from 0 to 0.3%.
4.2.1. Evaporator Temperature
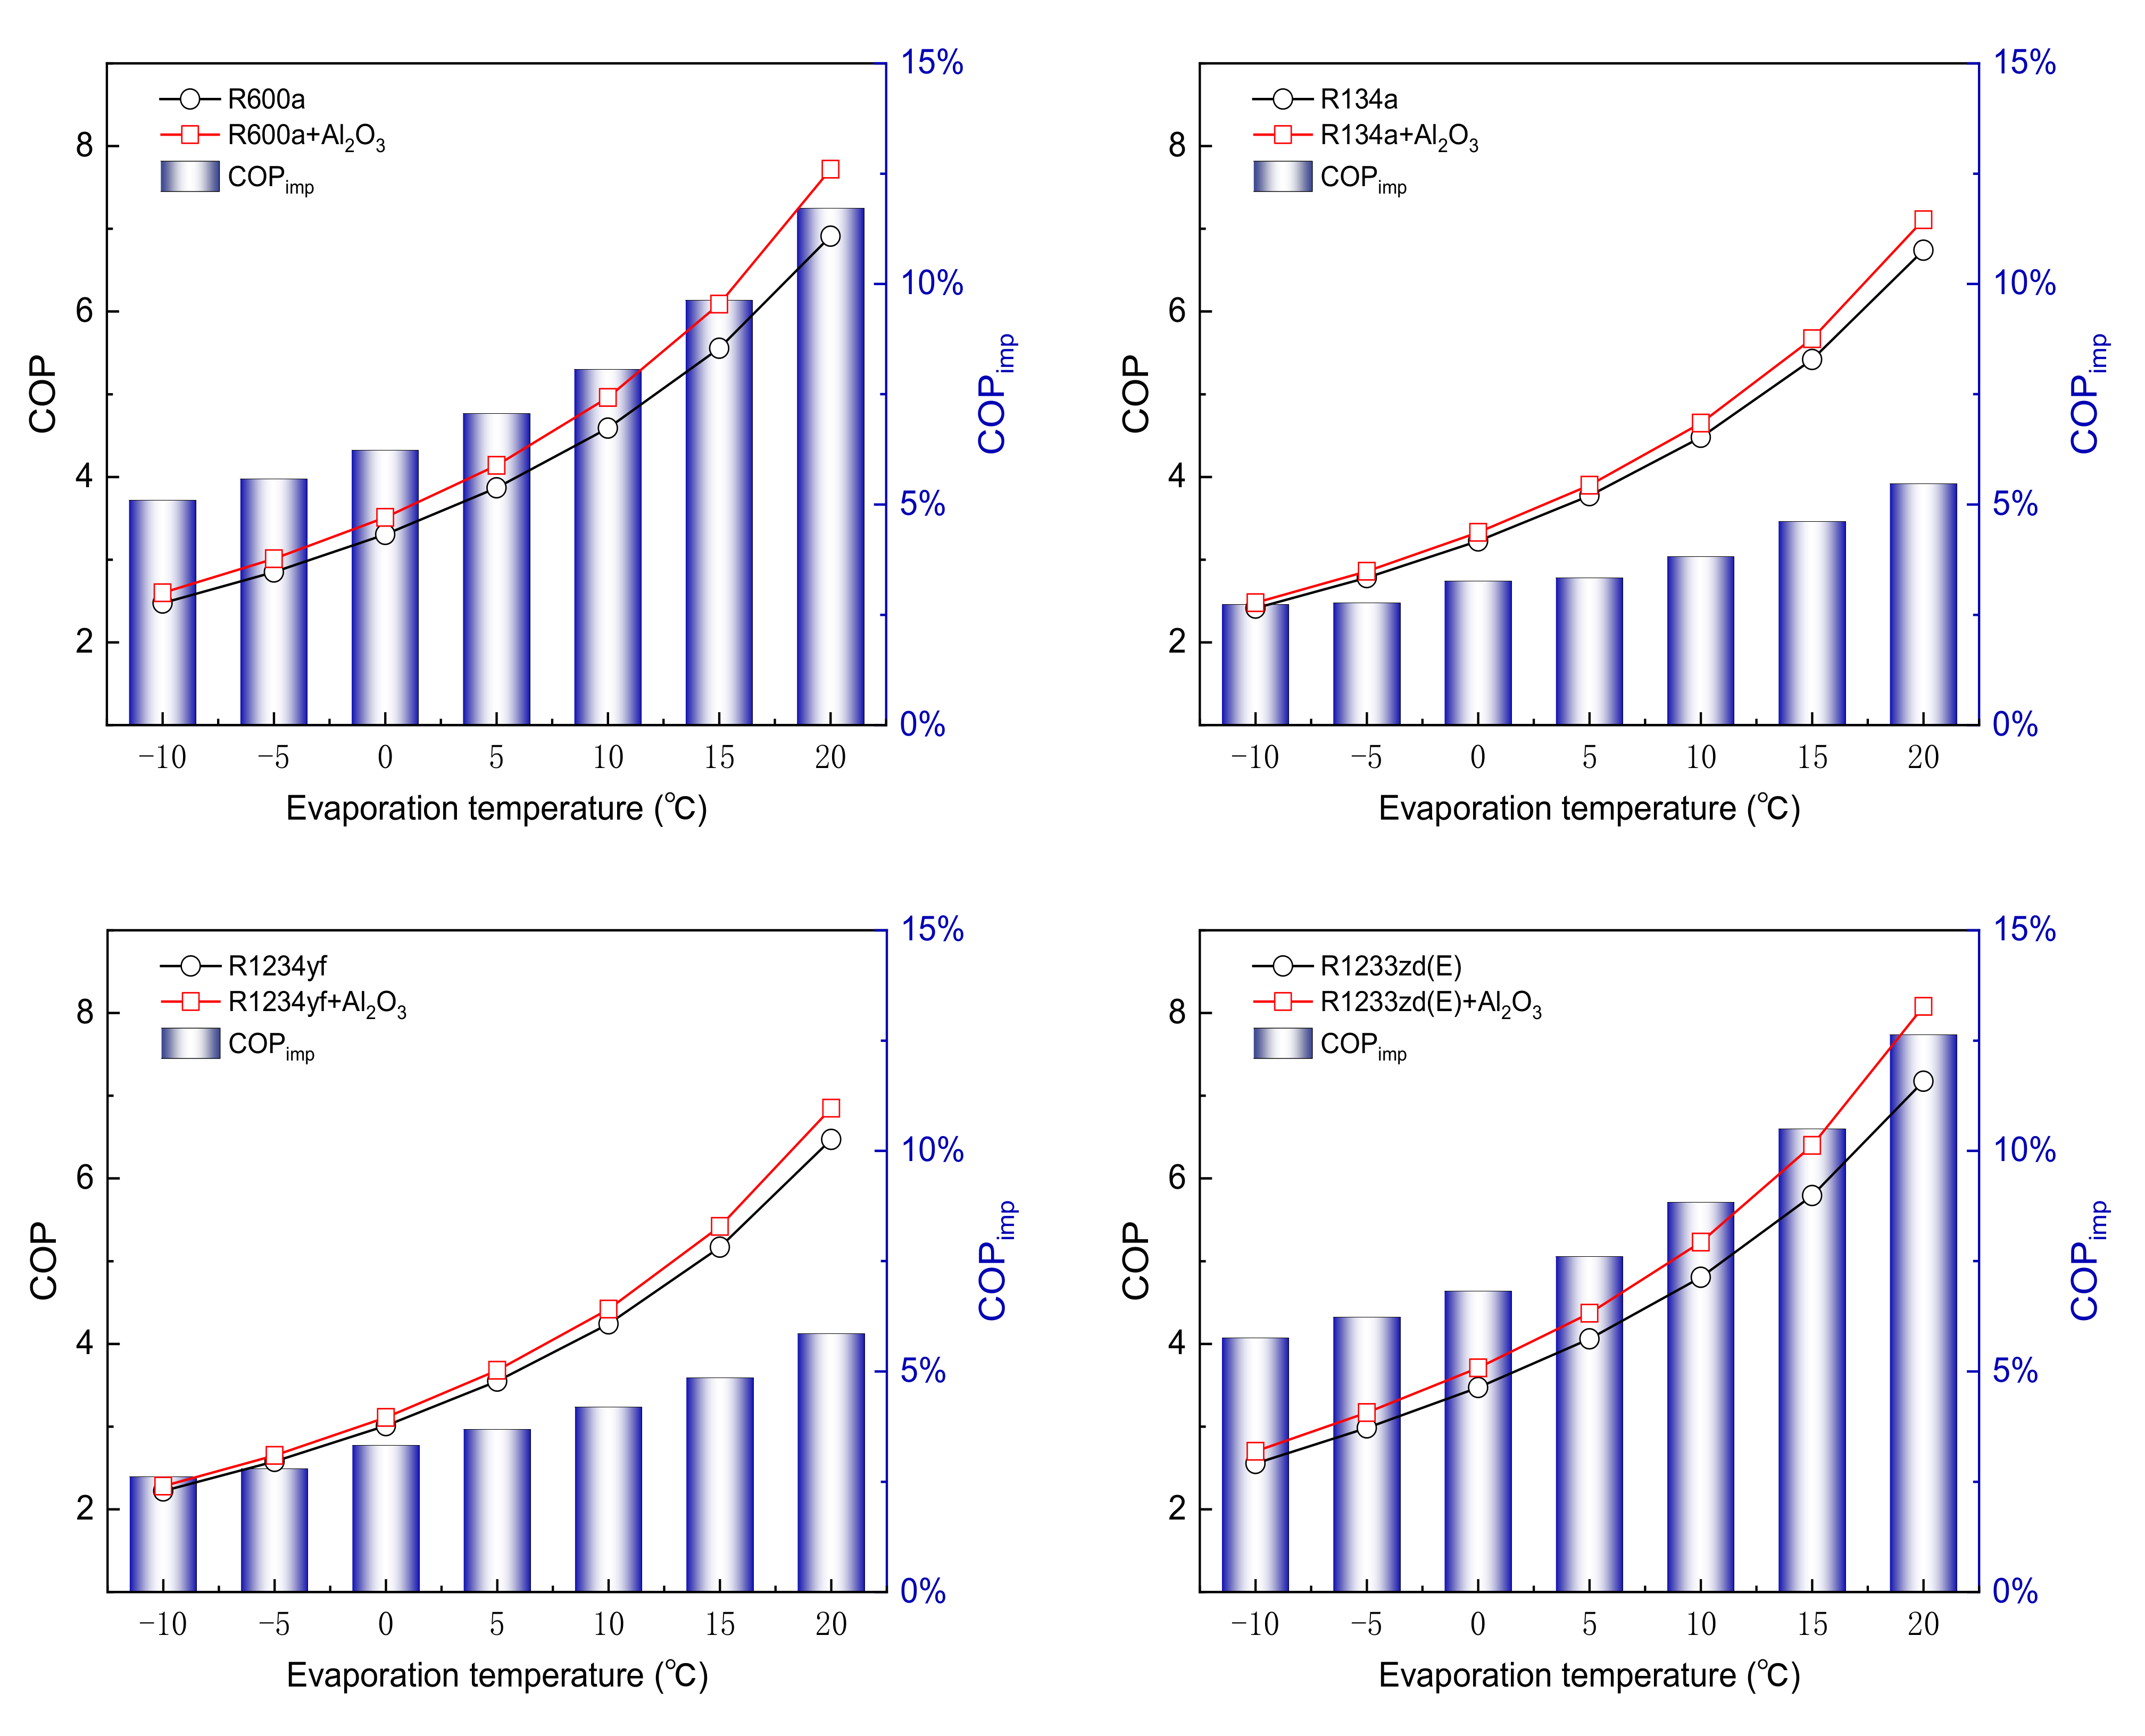
Figure 2 shows the effects of evaporation temperature () on the COP at 45 °C condensation temperature (). With varying from −10 °C to 20 °C, the COP for the pure refrigerants R600a, R134a, R1234yf, and R1233zd(E) increases from 2.47 to 6.91, 2.41 to 6.74, 2.22 to 6.47, and 2.55 to 7.17, respectively; the incremental values of COP are approximately 0.148, 0.144, 0.142, and 0.154 , respectively. For the NR system, the corresponding COP increases from 2.6 to 7.72, 2.48 to 7.11, 2.28 to 6.85, and 2.7 to 8.08, respectively; the COP increase by 0.171, 0.154, 0.152, and 0.179 for every 1 °C increase in , respectively. It can be found that the rate of COP increment for the NR system is more sensitive to than that of a pure refrigerant system. The lowest increase in the COP is observed for R1234yf, and the largest increase is found for R1233zd(E). The rise in evaporator temperature decreases the pressure ratio, and hence less compressor work input. The trend of COP remains the same as NPs added to the pure refrigerant. In addition, the minimum value of COP is found for R1234yf and R1234yf + Al2O3 at of −10 °C, and the maximum value is found when is 20 °C for R1233zd(E) and R1233zd(E) + Al2O3. It shows that the use of NP does not change the inherent characteristics of the pure refrigerant. Furthermore, the improvement ratio of COP increases with the . Compared with the pure refrigerants R600a, R134a, R1234yf, and R1233zd(E), the for the NPs is increased by 5.09–11.72%, 2.73–5.47%, 2.61–5.86%, and 5.76–12.63%, respectively; the minimum value of is observed when is −10 °C for R1234yf, and the maximum value of is found when is 20 °C for R1233zd(E). The increase is lowest for R134a and highest for R1233zd(E) at various evaporation temperatures.
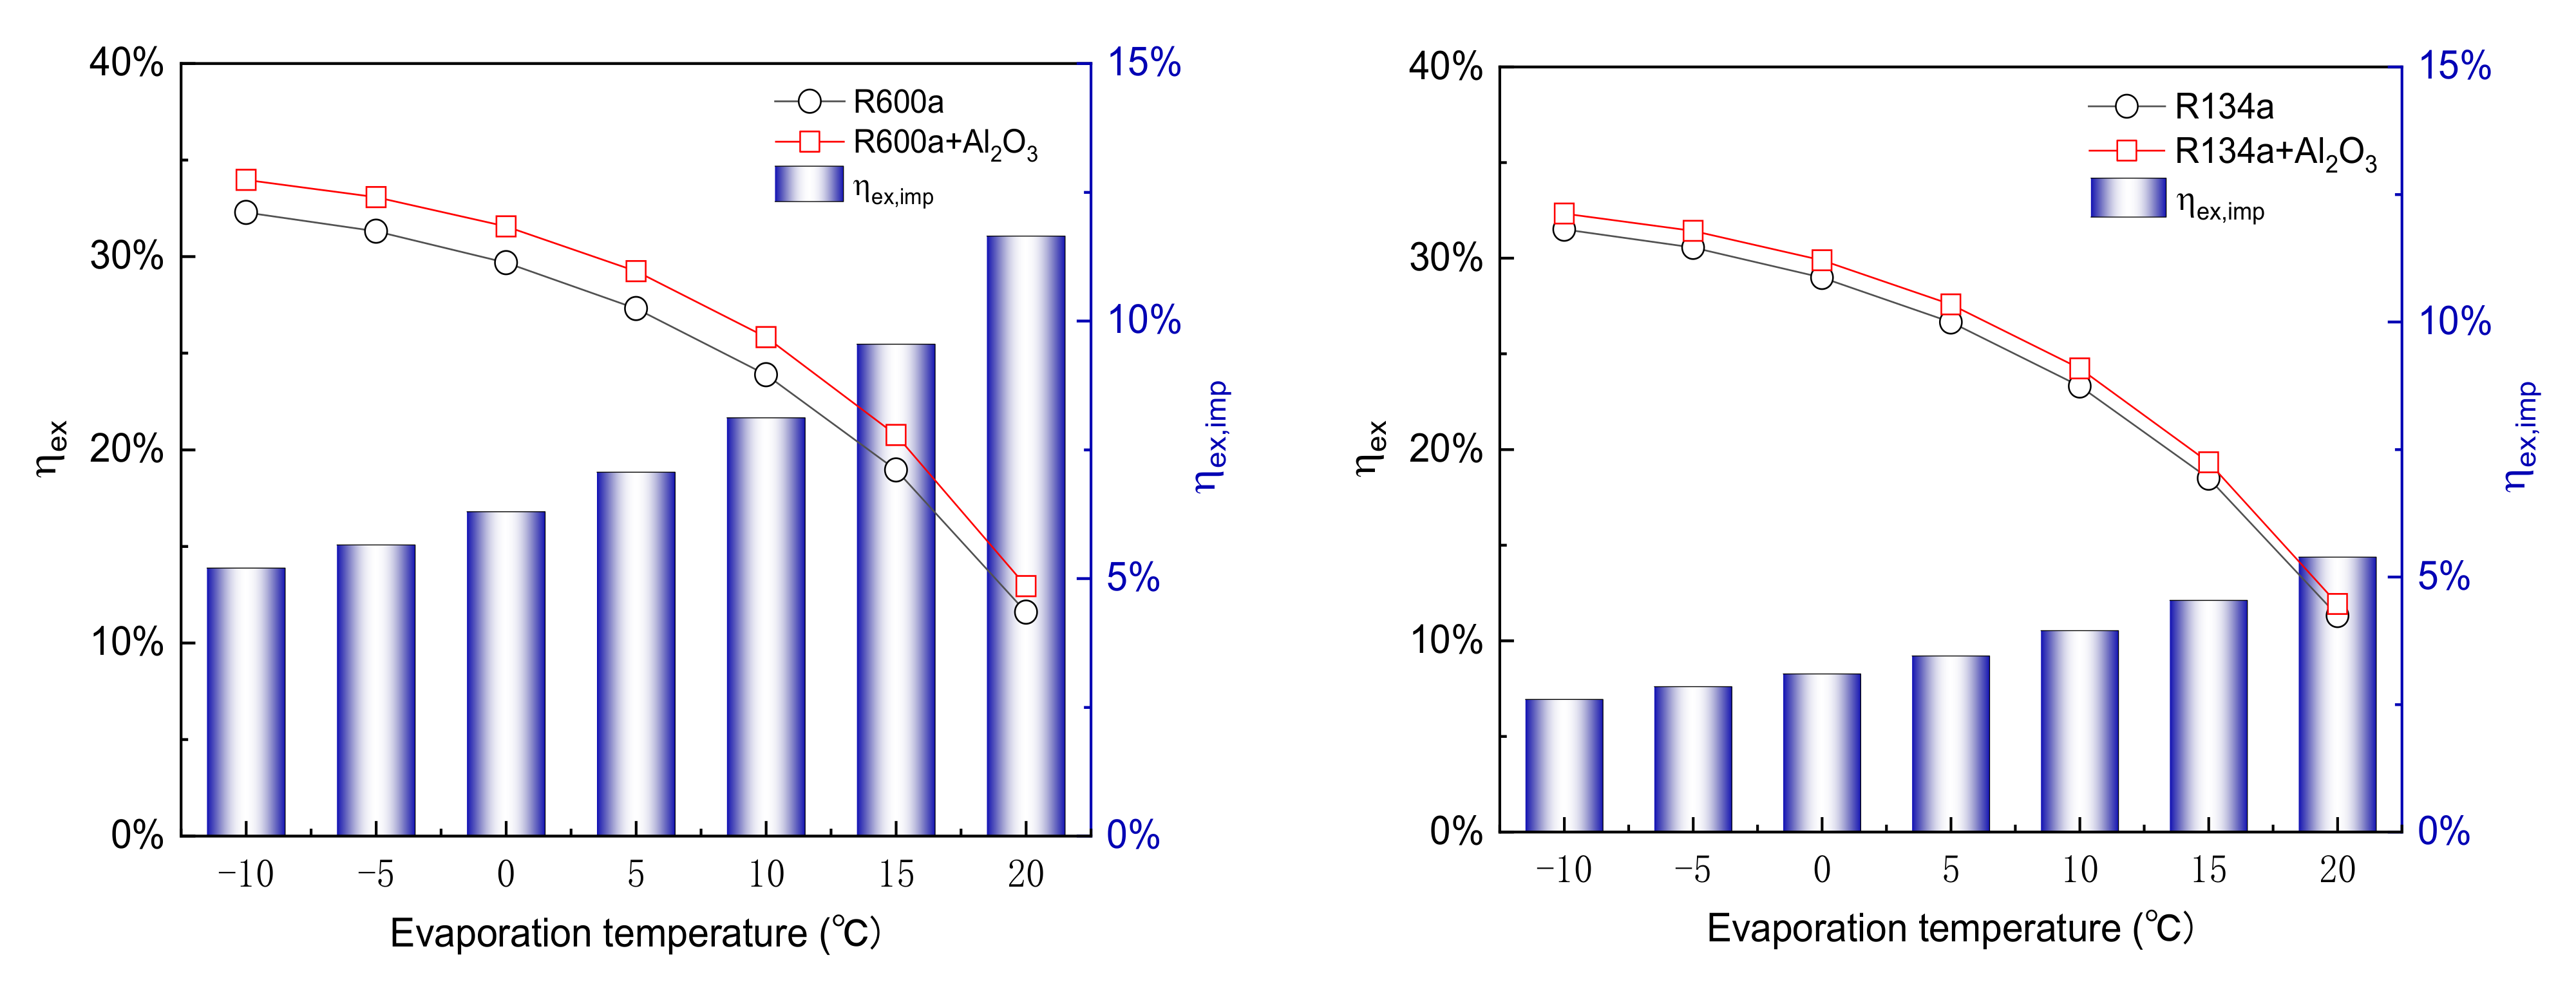
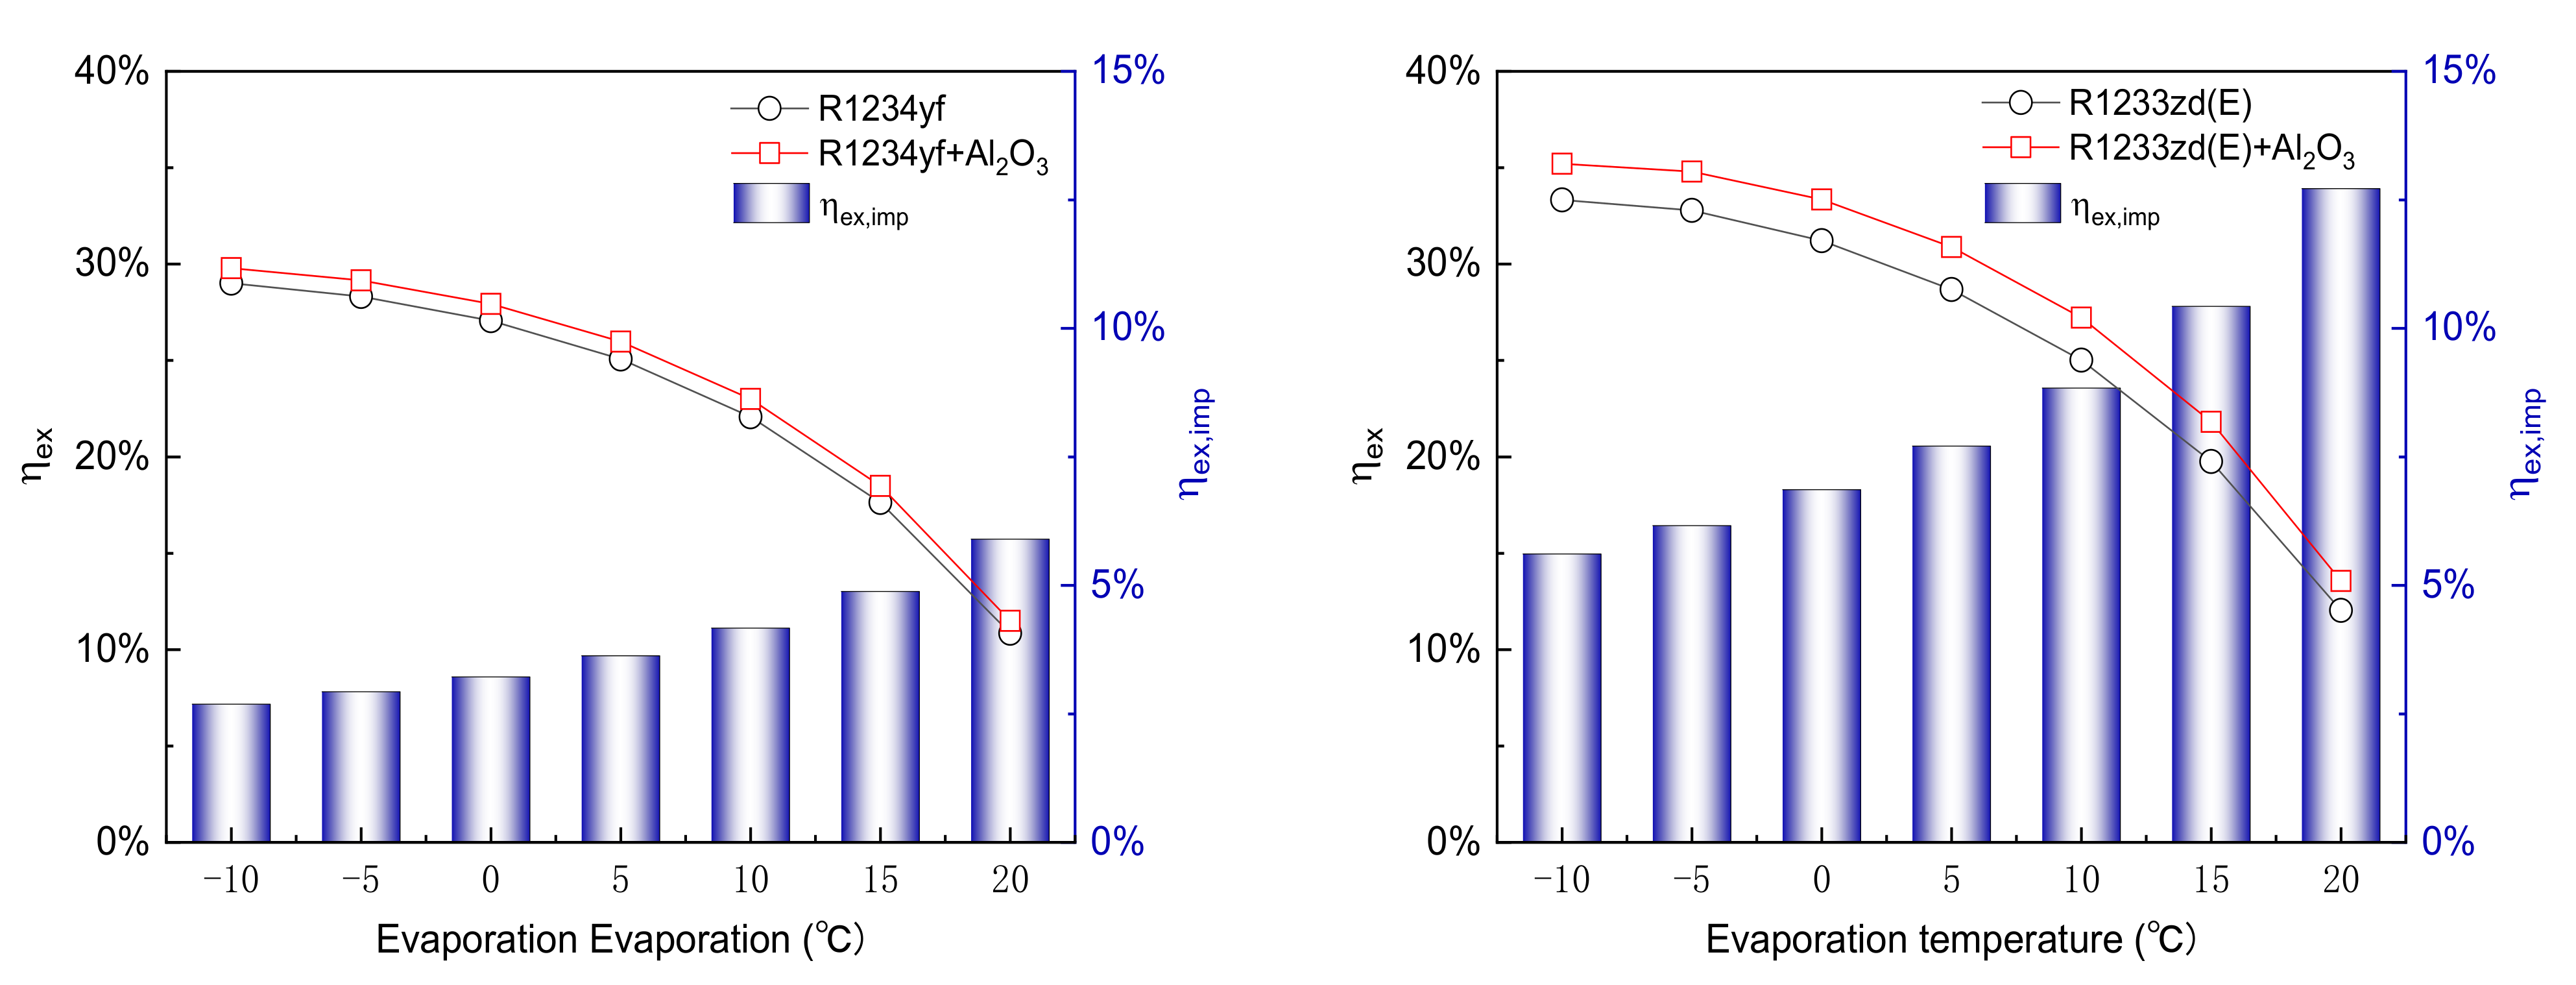
Figure 3 shows the variation in exergy efficiency () with varying from −10 °C to 20 °C at of 45 °C. The range of changes in for the pure refrigerants R600a, R134a, R1234yf, and R1233zd(E) is 32.29% to 11.59%, 31.51% to 11.31%, 29.01% to 10.85%, and 33.33% to 12.03%, respectively. For the NR system, the maximum values of are 33.97%, 32.33%, 29.79%, and 35.20%, respectively; the corresponding minimum values of are 12.94%, 11.92%, 11.49%, and 13.56%, respectively. It can be seen that the of the NR system is higher than that of the pure refrigerant system. The is highest for R1233zd(E), while it is lowest for R1234yf. With an increase in , the total exergy destruction and the compressor power consumption decrease. However, the amount of input compressor power decreases more than the exergy destruction, resulting in a decrease in the . Furthermore, the exergy efficiency improvement is 2.60–12.72% for different refrigerants. Comparing various refrigerants shows that the maximum corresponds to R1233zd(E) + Al2O3 at of 20 °C, while the minimum is for R134a + Al2O3 at of −10 °C.
4.2.2. Condenser Temperature
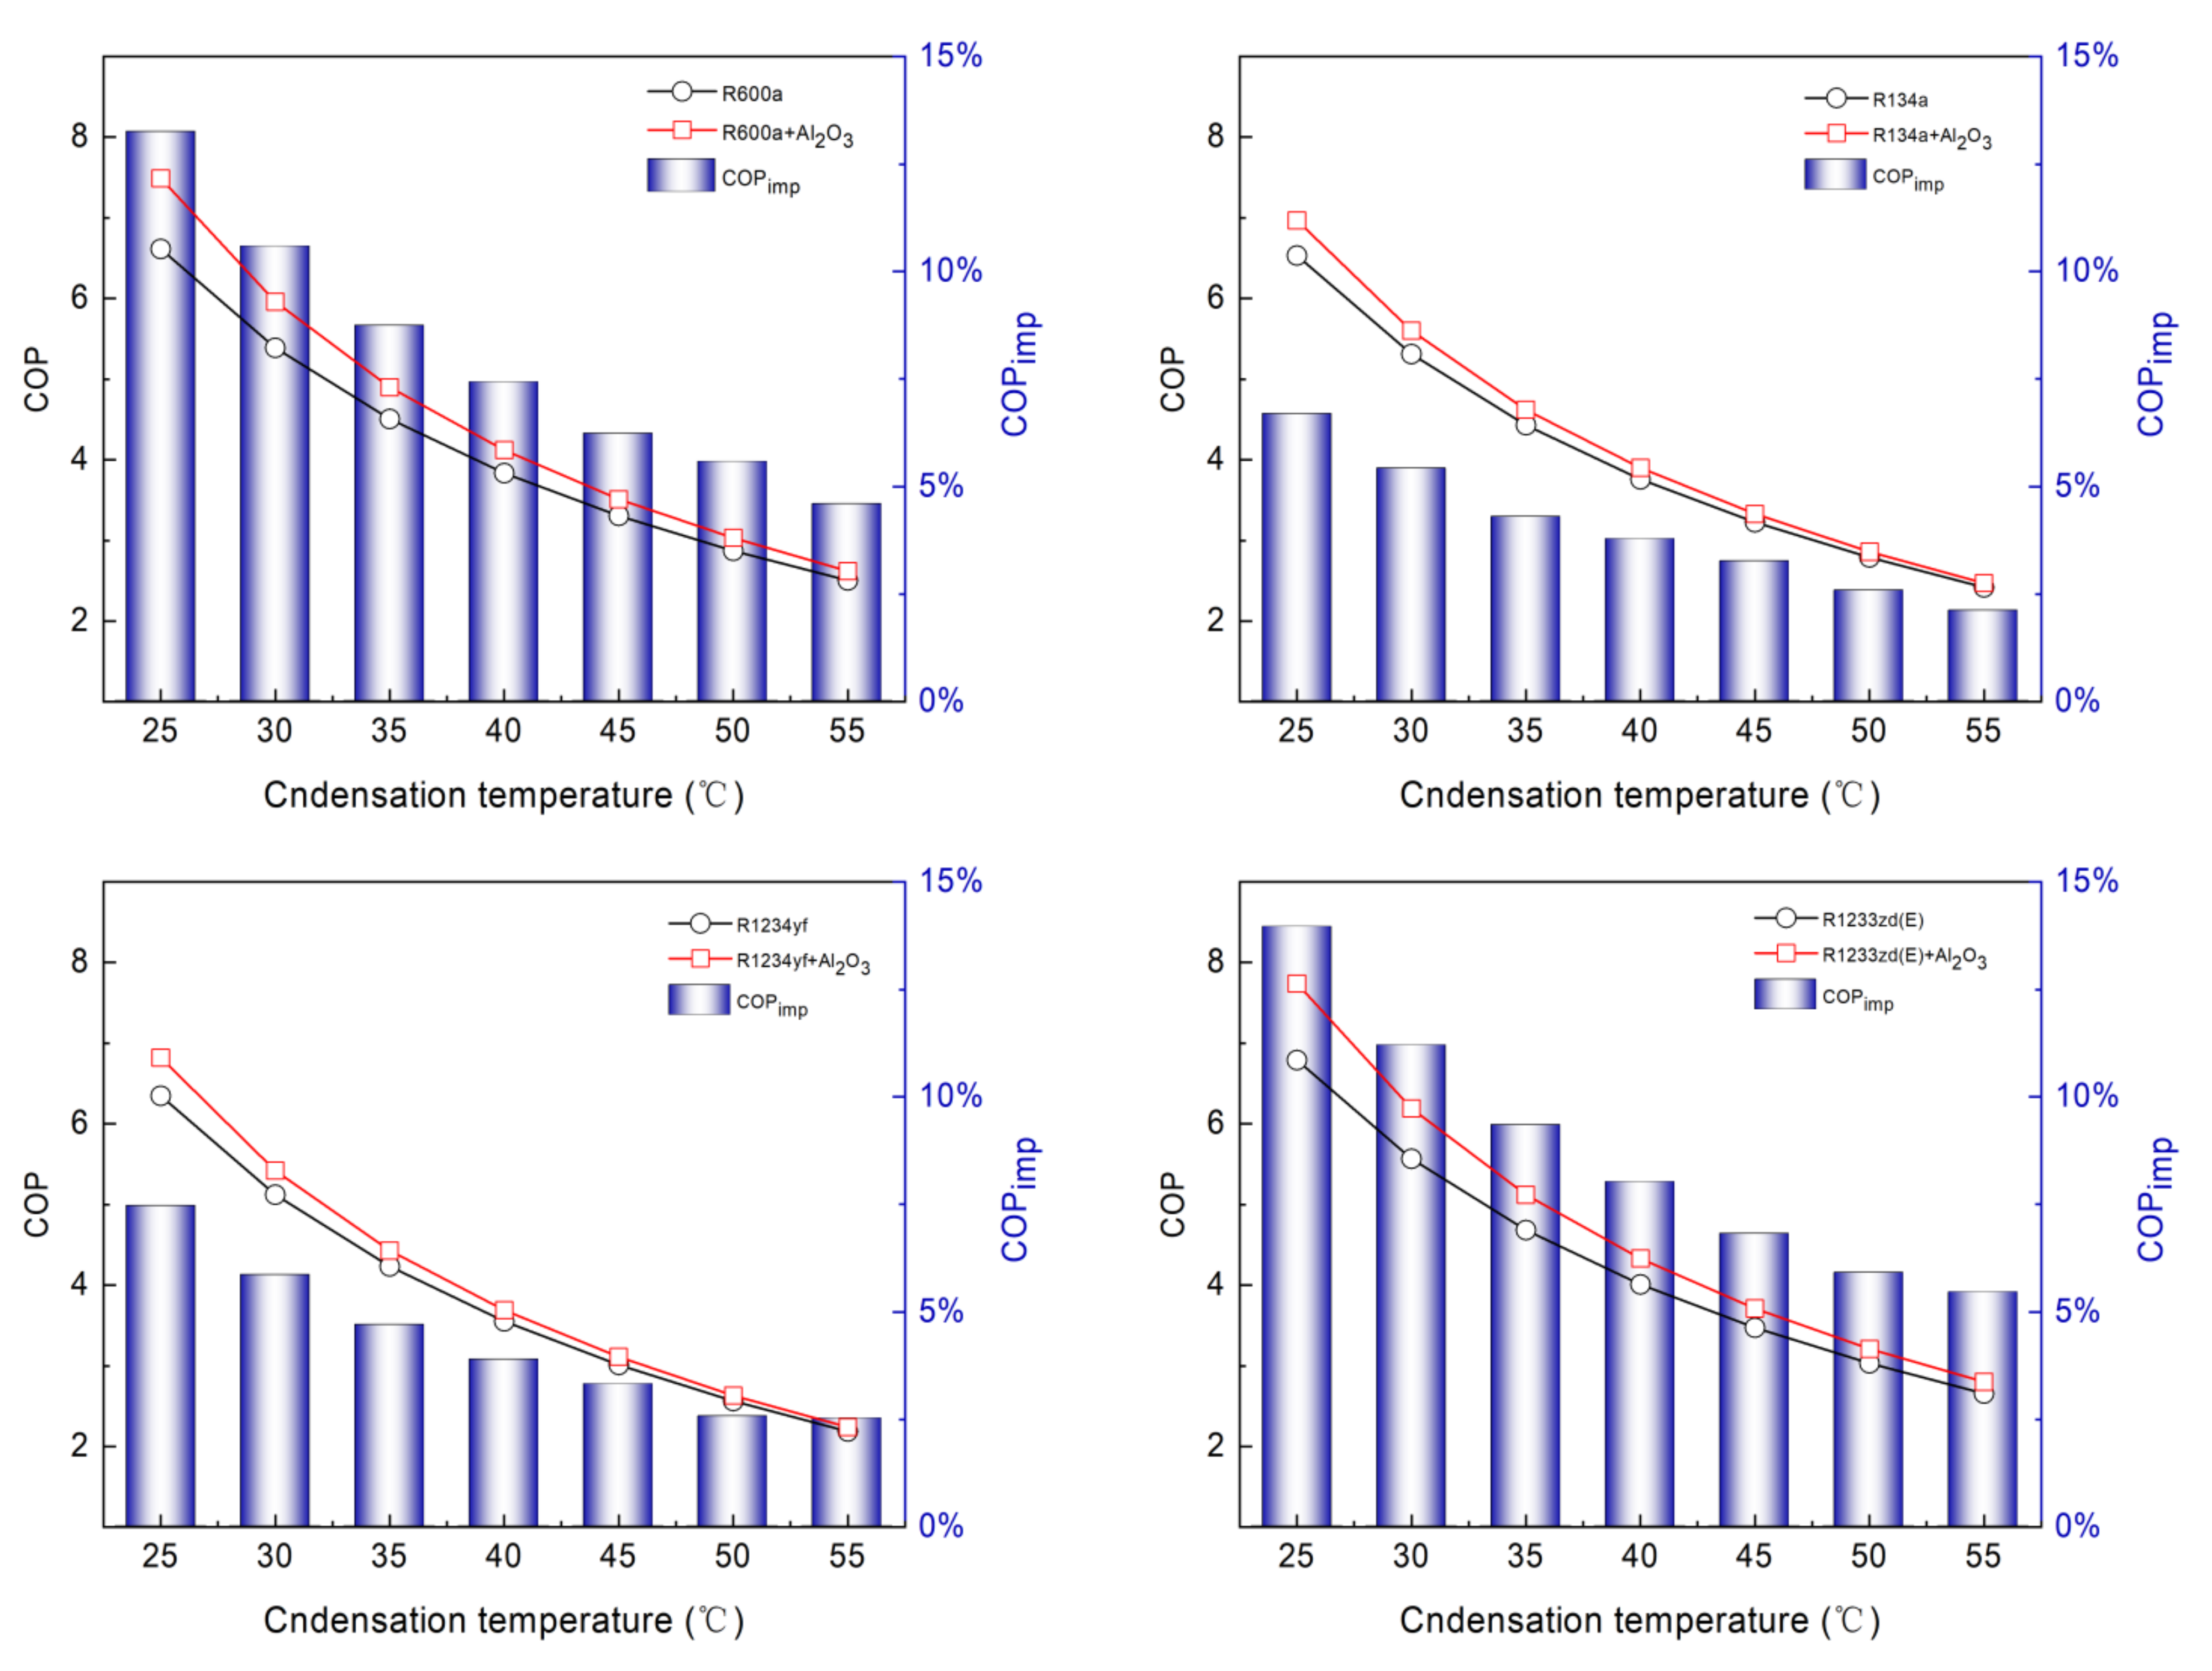
Similarly, Figure 4 demonstrates the variation of COP with varying at of 0 °C. When the is 25 °C, the COP values of pure refrigerants R600a, R134a, R1234yf, and R1233zd(E) are 6.61, 6.53, 6.35, and 6.79, respectively. When the increases to 55 °C, the COP of pure refrigerants decreases to 2.51, 2.42, 2.19, and 2.66, respectively. The COP of pure refrigerants decreases by 0.137, 0.137, 0.139, and 0.138 for every 1 °C increase in . For the nanorefrigerant system, the COP decreases significantly (from 7.49 to 2.62, 6.97 to 2.47, 6.82 to 2.24, and 7.74 to 2.80, respectively) when increases from 25 °C to 55 °C. When the increases by 1 °C, the COP decreases by about 0.162, 0.150, 0.153, and 0.165, respectively. The NR system is seen to be more sensitive to than the pure refrigerant system. The COP is highest for R1233zd(E), followed by those of R600a, R134a, and R1234yf. Compared with the pure refrigerants R600a, R134a, R1234yf and R1233zd(E), the for the NRs is increased by 4.59–13.26%, 2.11–6.69%, 2.52–7.47%, and 5.46–13.97%, respectively. This decrease is sharp for R1233zd(E) and lower for R134a. The lowest corresponds to R134a + Al2O3 at of 55 °C, whereas the highest is found with of 25 °C for R1233zd(E) + Al2O3.
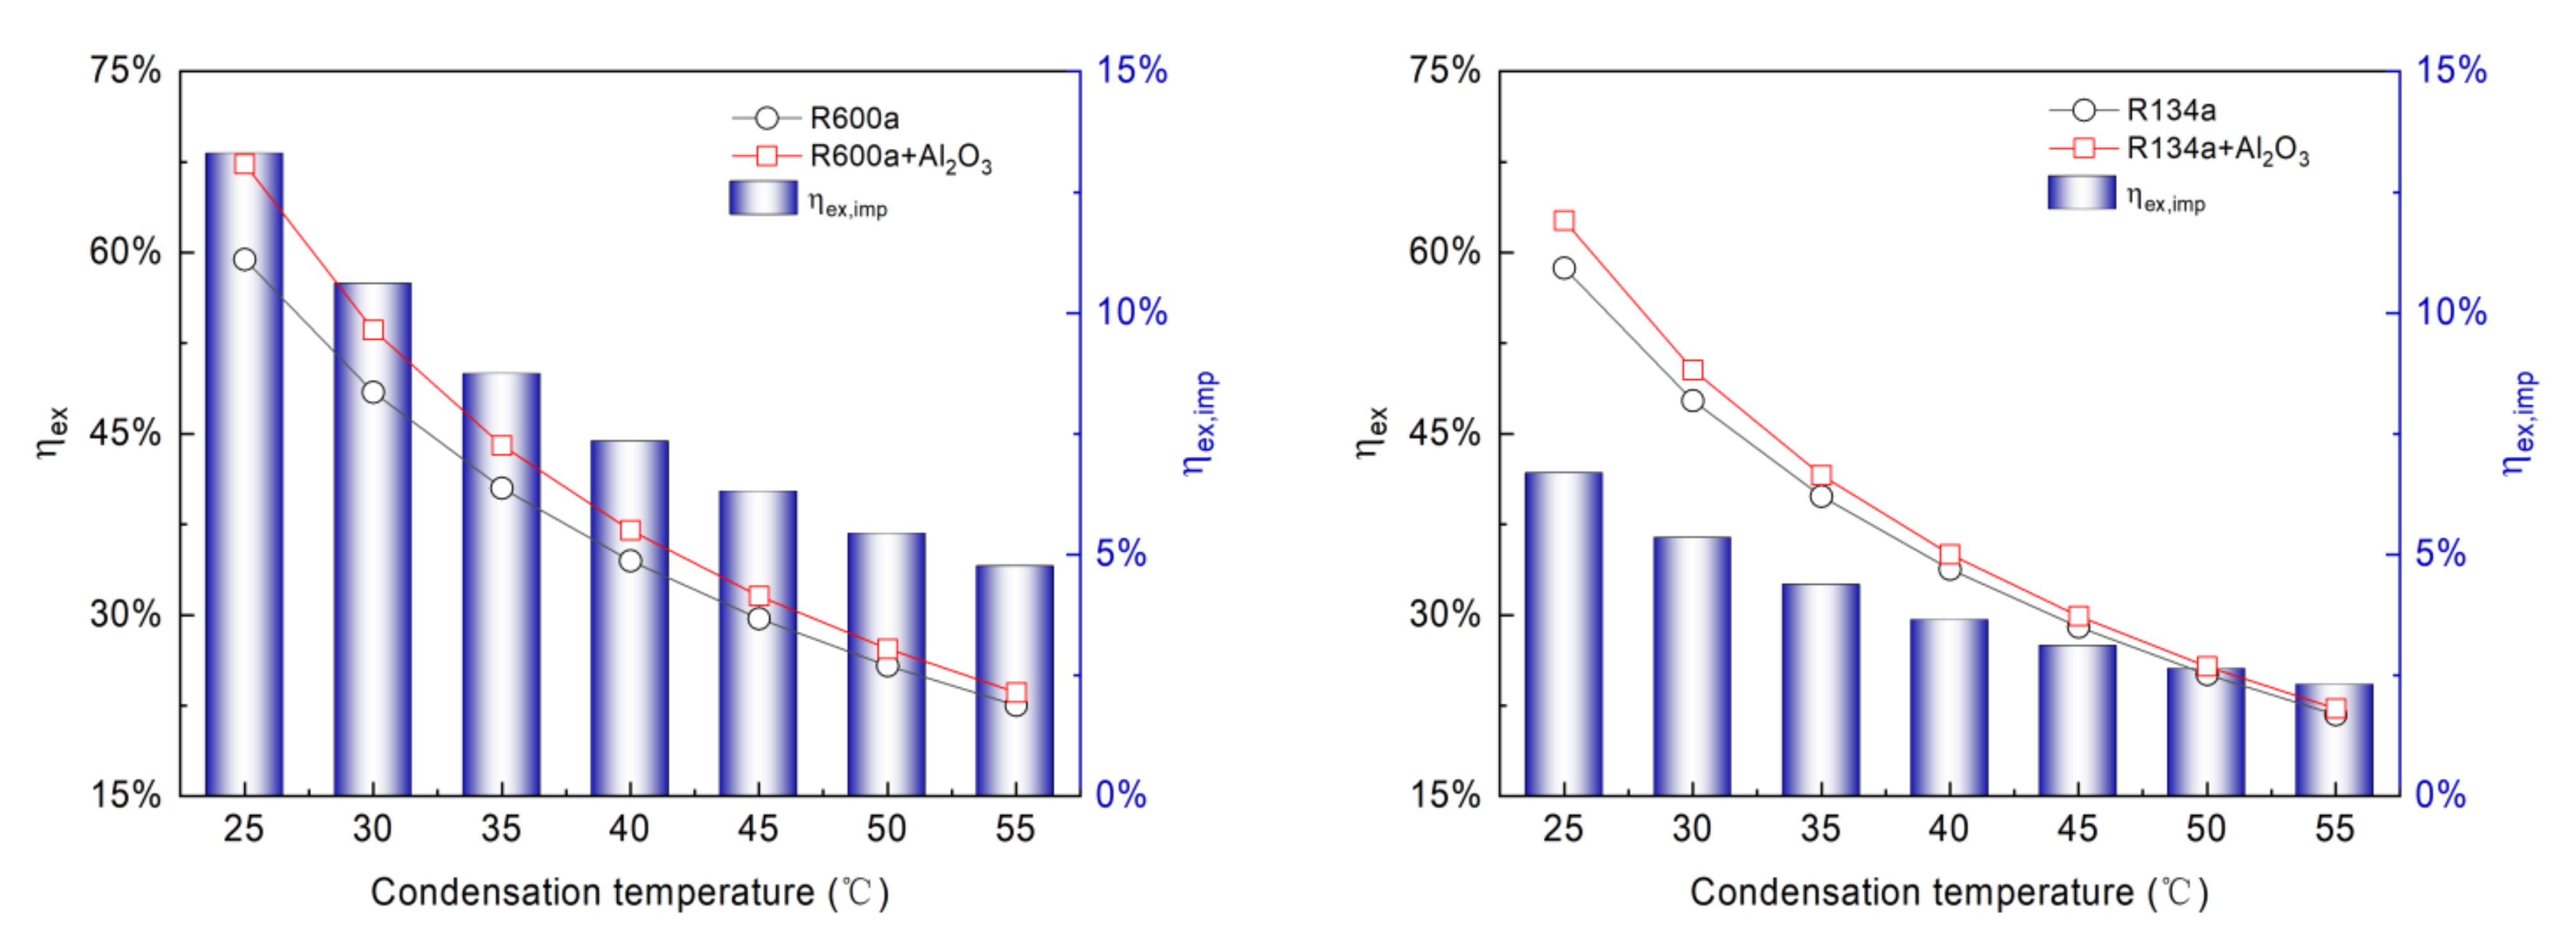
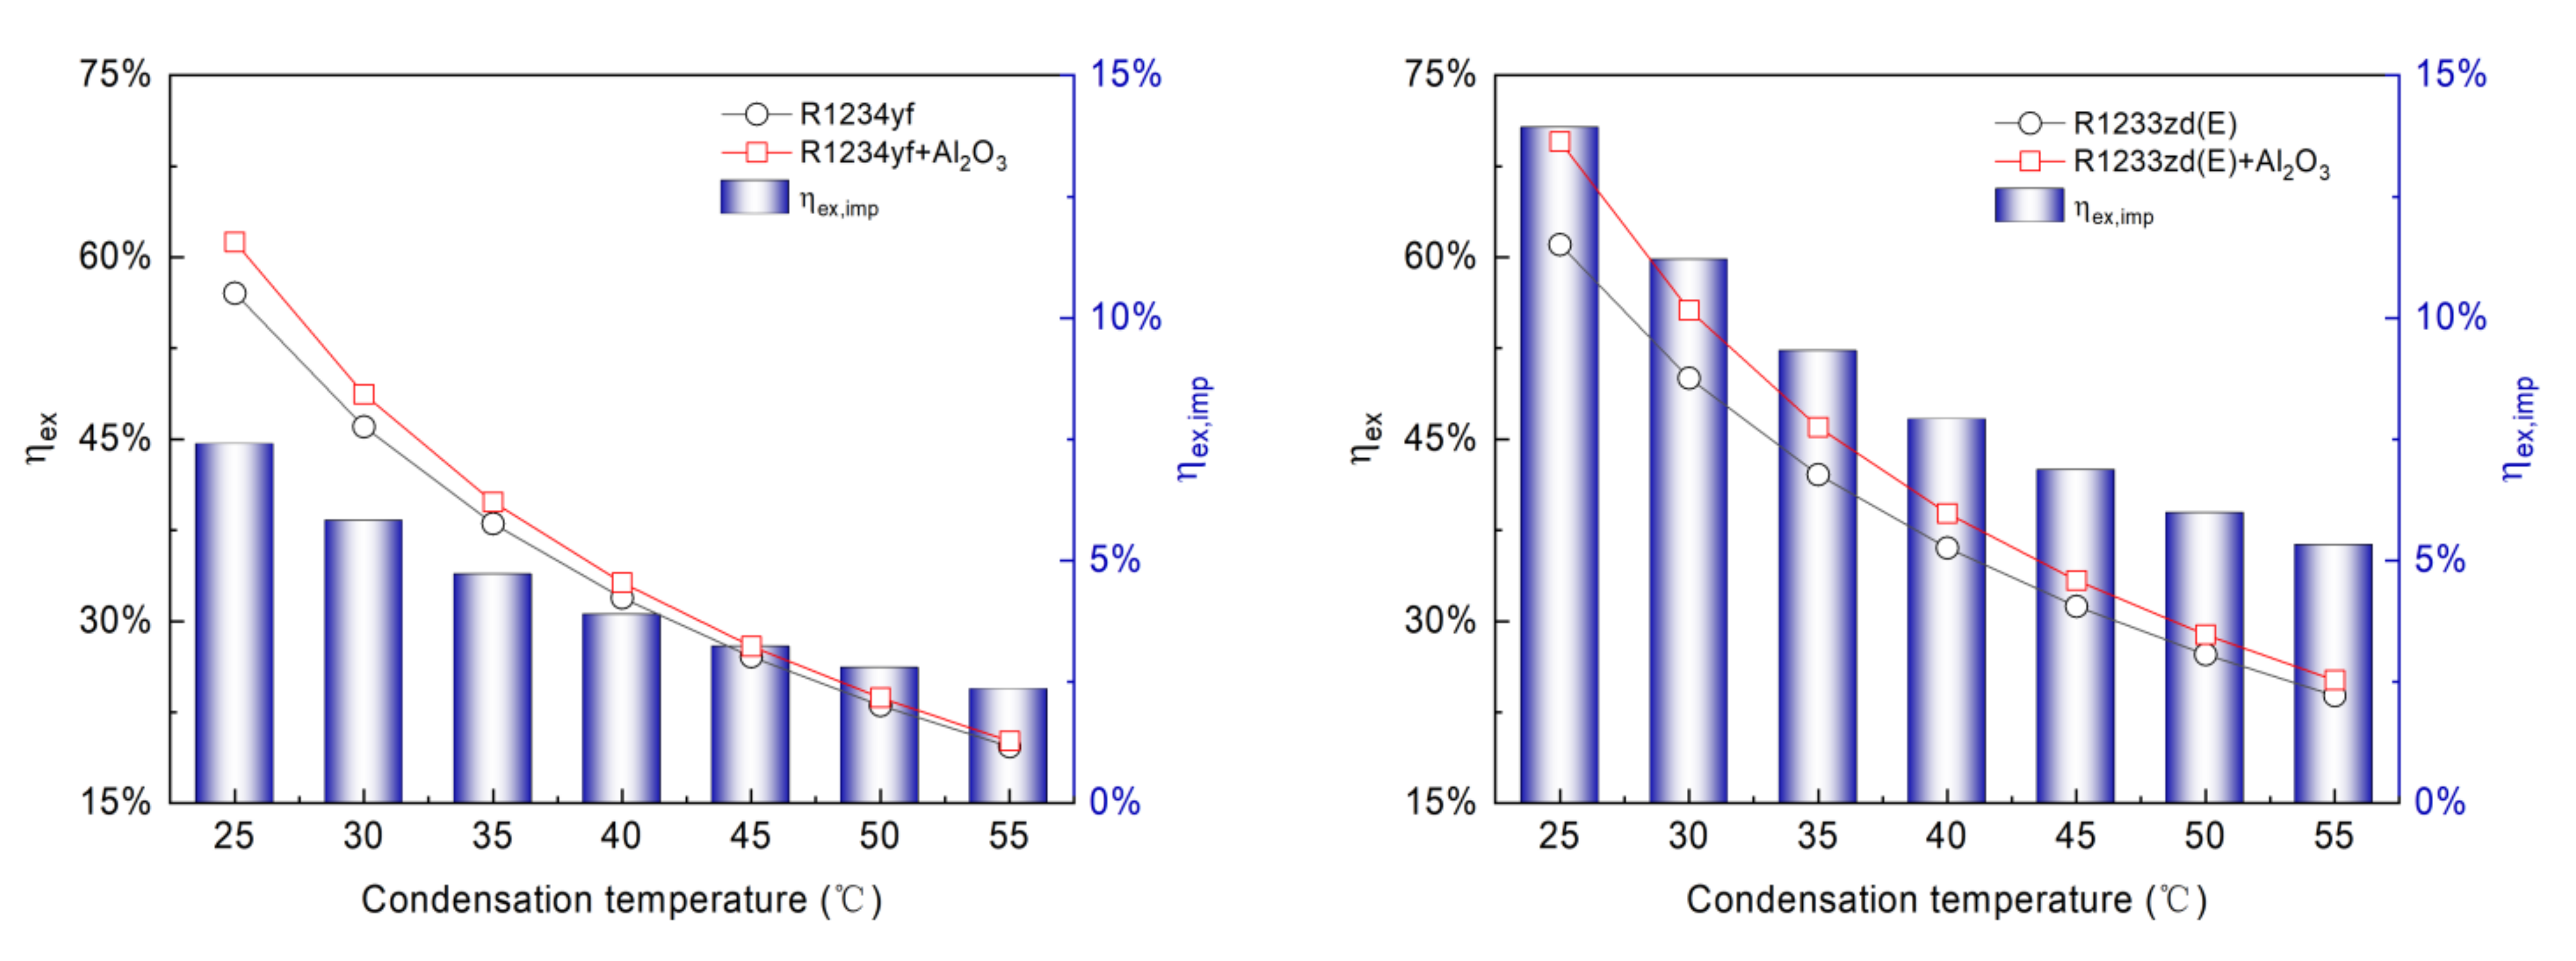
The is shown for a range of from 25 °C to 55 °C in Figure 5. The decreases from 59.43% to 22.51% for R600a, from 58.71% to 21.74% for R134a, from 57.04% to 19.64% for R1234yf, and from 61.04% to 23.86% for R1233zd(E), respectively. Similarly, for the NRs, when the is 25 °C, the is 67.34%, 62.23%, 62.26%, and 68.54%, respectively; when the is increased to 55 °C, the decreases to 23.58%, 22.24%, 20.01%, and 25.13%, respectively. This is mainly because the total exergy destruction and compressor power consumption increase with an increase in , and the compressor power consumption is greater than the increased exergy destruction. A similar observation like the influence of evaporator temperature. It can be seen that of the NR system can be increased by 4.75–13.31%, 2.30–6.68%, 2.34–7.40%, and 5.32–13.98%, respectively, compared to the pure refrigerant system. Comparing different refrigerants shows that the greatest improvement in for R1233zd(E) occurs at of 25 °C, while the lowest corresponds to R134a at of 55 °C.
4.2.3. Nanoparticle Mass Fraction
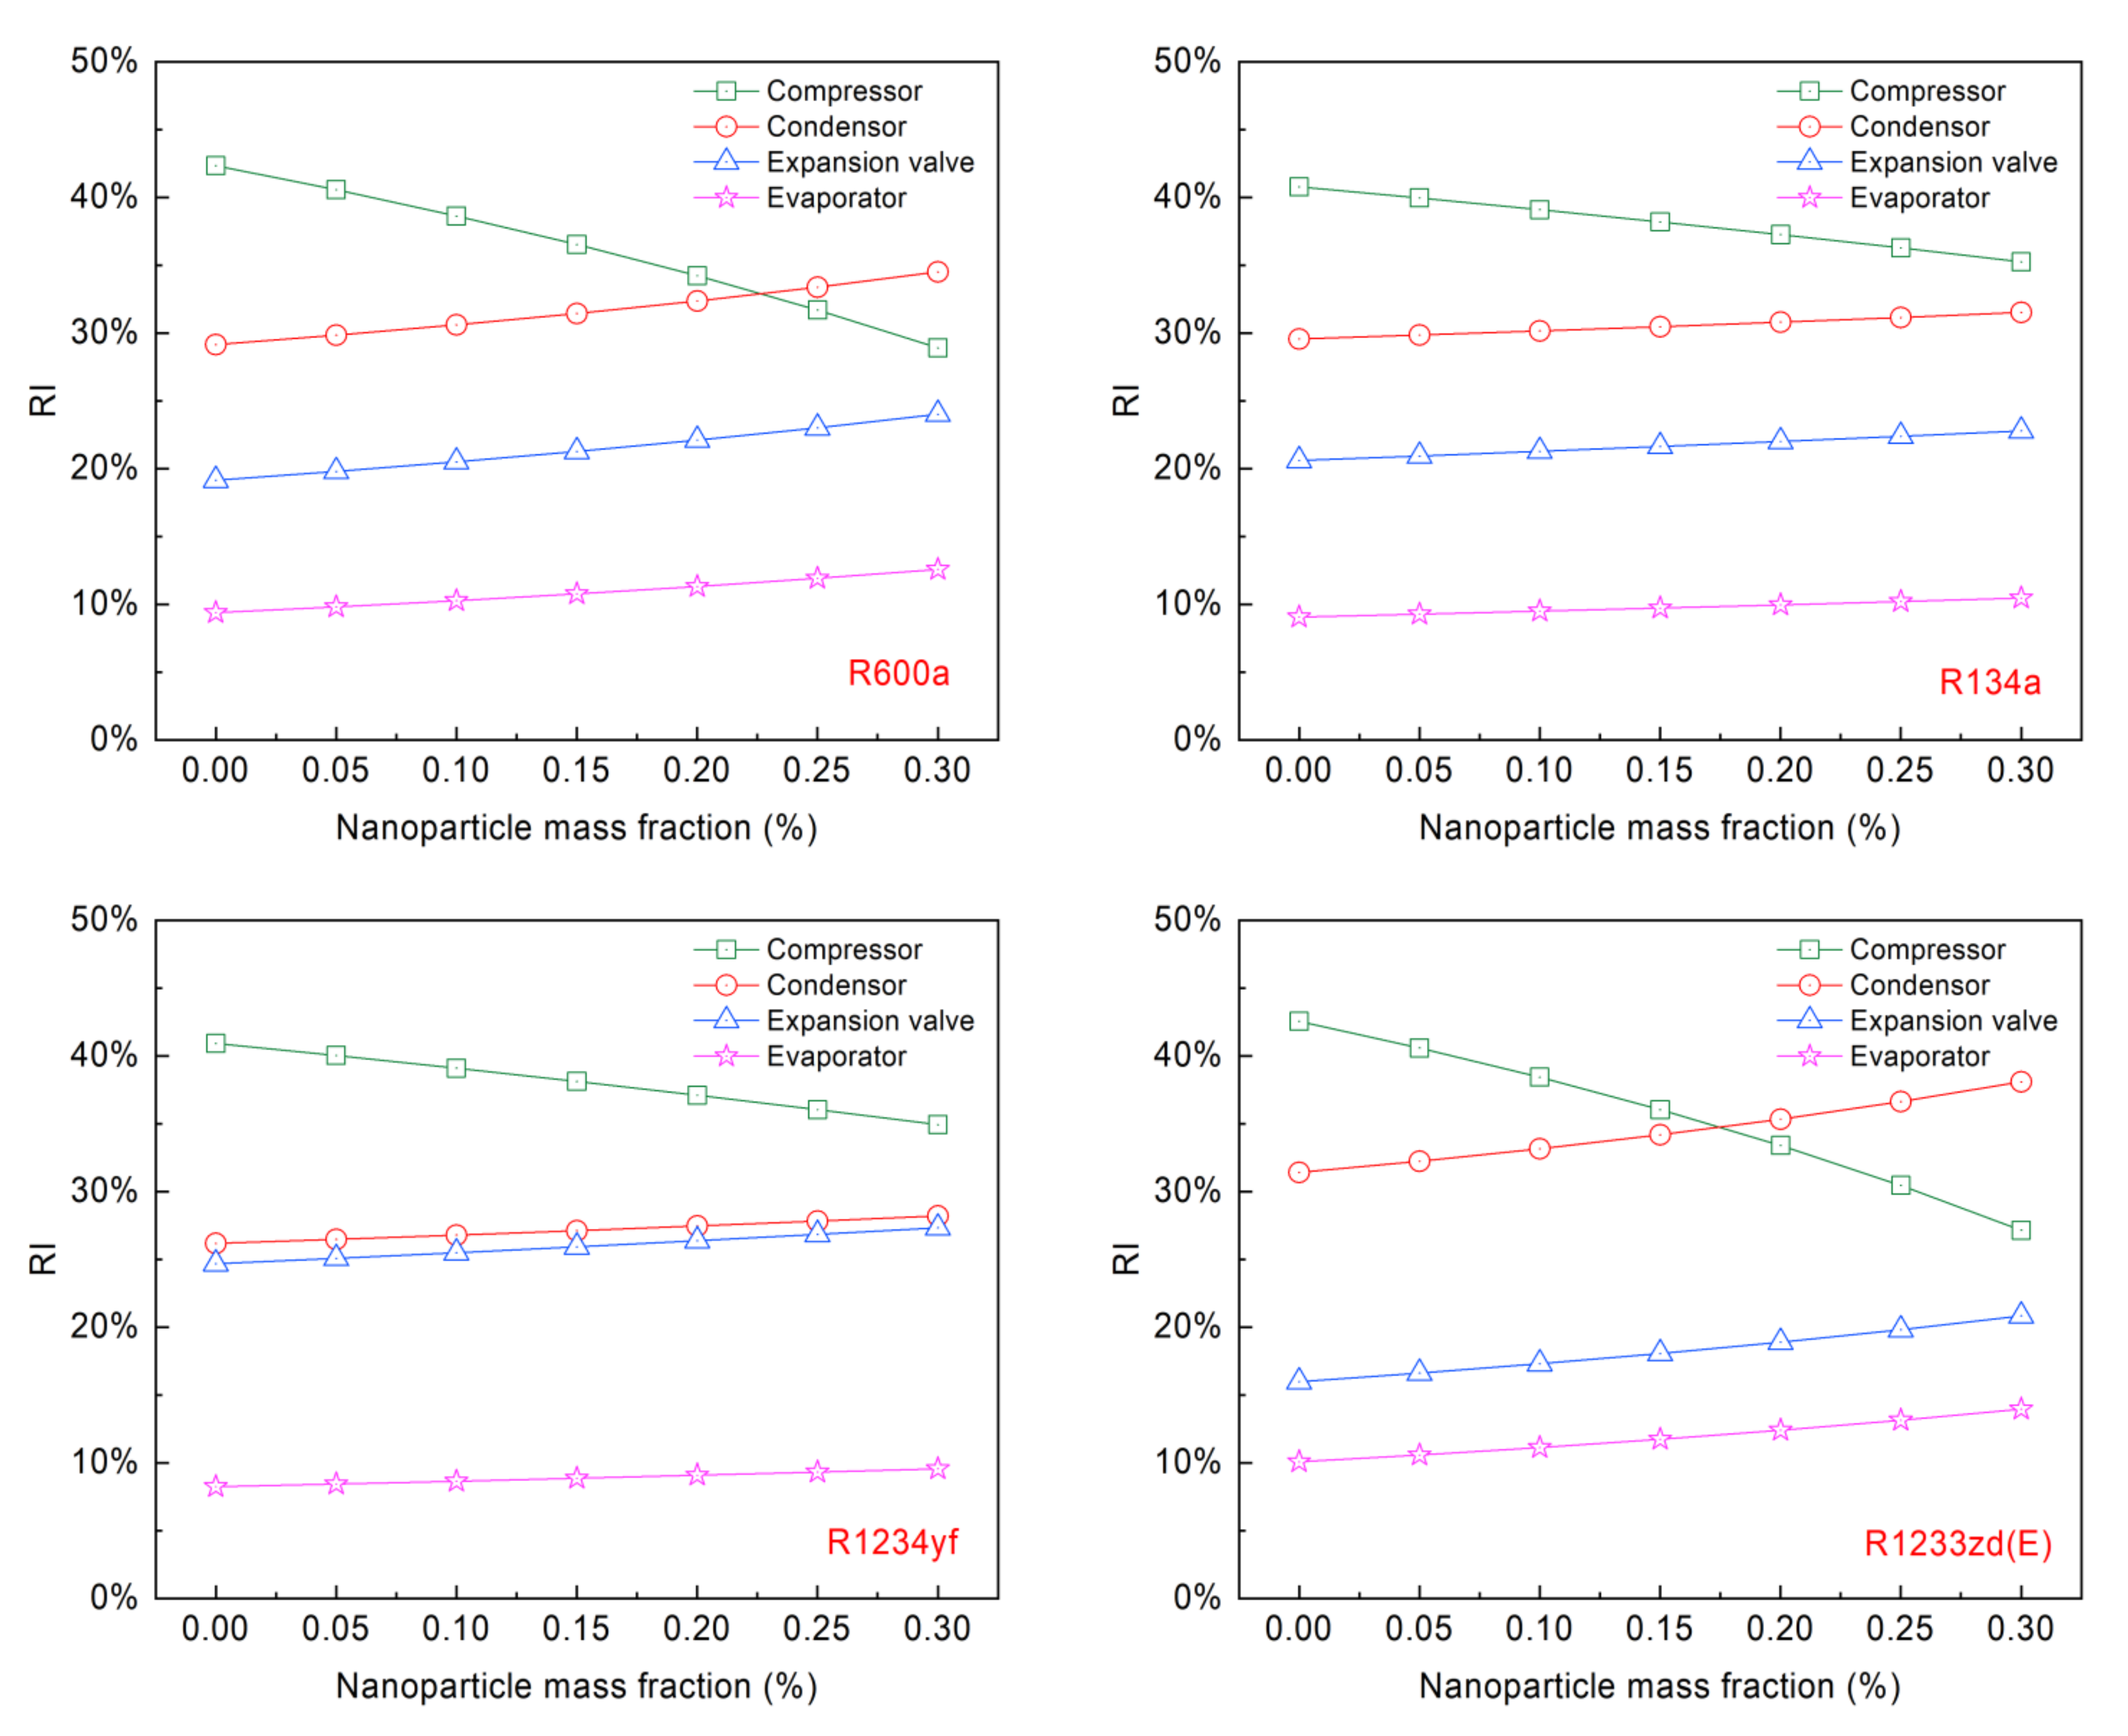
The relative irreversibility (RI) of each component with different refrigerants is presented in Figure 6. The results show that the highest exergy destruction is the compressor, associated with 42.54% to 40.78% irreversibility with different pure refrigerants, while the lowest destruction is the evaporator, associated with 10.07% to 8.23% irreversibility. The reason for the compressor’s relatively higher RI value may be because of the highest compressor input power and isentropic losses. The compressor with a higher RI has greater potential to improve the system efficiency. With increasing the mass fraction of Al2O3 NPs, the exergy destruction of the compressor decreases, causing a descending trend in the compressor RI. When the NP increases to 0.20% wt.%, the compressor RI is less than condenser RI for the R1233zd(E) + Al2O3; and when the NP increases to 0.25% wt.%, the condenser RI is greater than compressor RI for R600a + Al2O3.
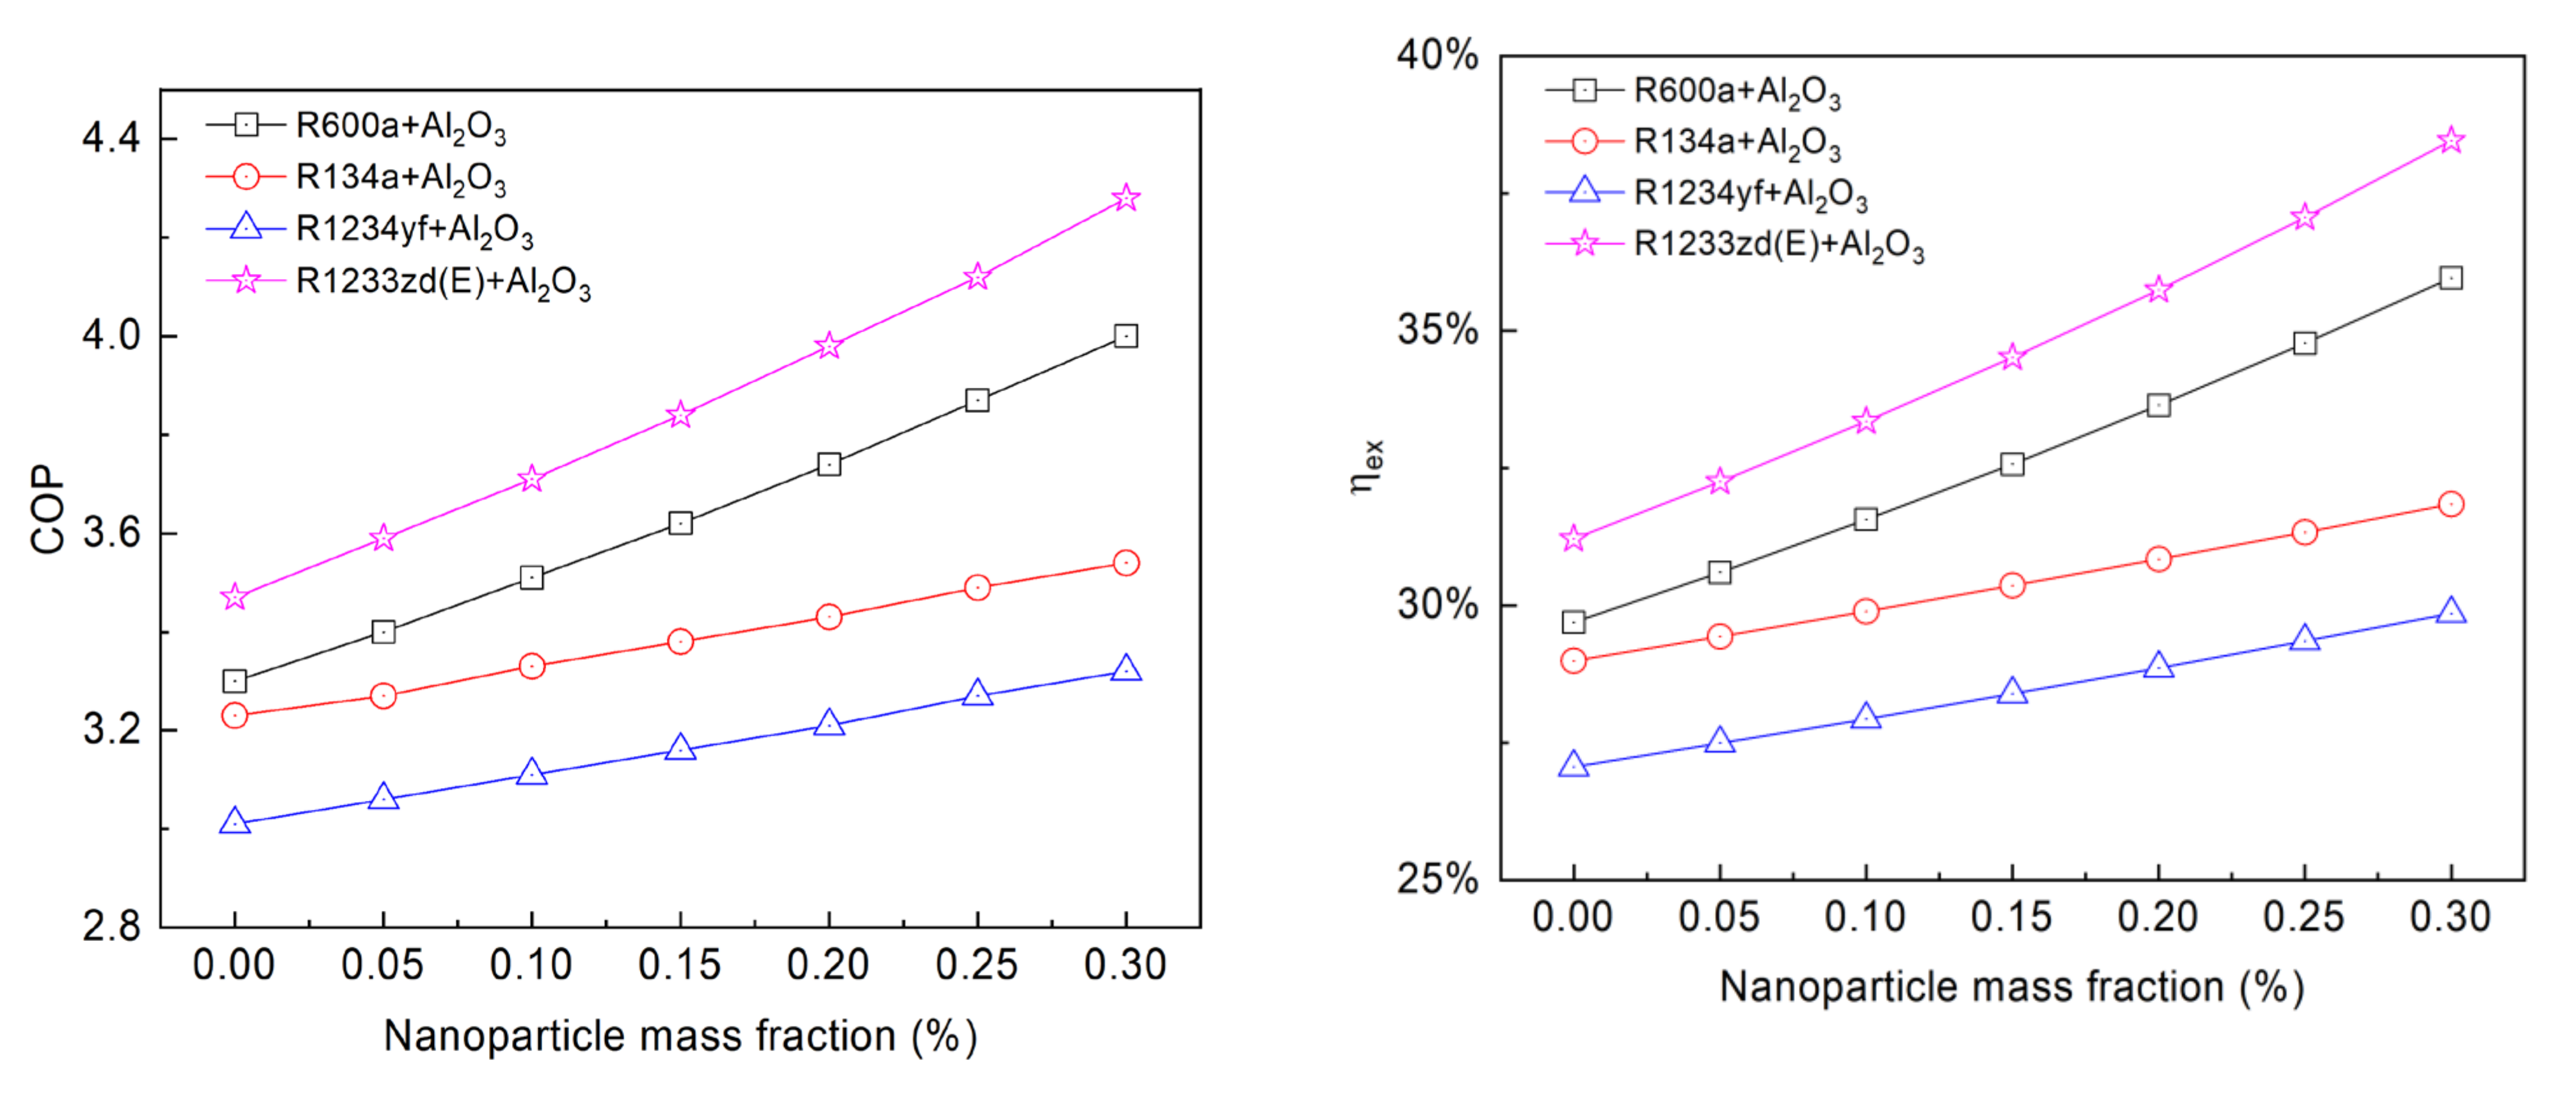
Figure 7 shows the influence of the mass fraction of Al2O3 NPs on COP and employing four different NRs at of 0 °C and of 45 °C. R1233zd(E) clearly shows the highest COP, followed by R600a, R134a, and R1234yf. The COP values of the pure refrigerants are 3.47, 3.30, 3.23, and 3.01, respectively; when the NP mass fraction increases to 0.30%, the COP values increase to 4.28, 4.0, 3.54, and 3.32, respectively. This is because more NPs per unit mass of refrigerant can increase the heat transfer capacity. R1233zd(E) + Al2O3 system has the largest COP enhancement of 23.24%, followed by the R600a + Al2O3 system with a COP enhancement of 21.07%, and followed by the R1234yf + Al2O3 system and R134a + Al2O3 system with COP enhancements of 10.30% and 9.77%, respectively. With a mass fraction of 0.30% Al2O3 NPs, the COP of R1233zd(E) + Al2O3 is 7.0% higher than that of R600a + Al2O3, it is 20.90% higher than that of R134a + Al2O3, and it is 28.92% higher than that of R1234yf + Al2O3. This trend remains the same as the mass fraction of Al2O3 NP varies.
Moreover, the increases linearly with the amount of Al2O3 NPs added. The maximum is 38.46% for R1233zd(E) + 0.3% Al2O3, and the minimum is 27.06% for pure R1234yf. The for R134a and R1234yf increases steadily, while it increases rapidly for R1233zd(E) and R600a. With an increase in the mass fraction of Al2O3 NPs, the total exergy destruction and compressor power consumption decrease, but the reduced total exergy destruction is greater than the compressor power consumption, resulting in a rise in . The study shows that the R1233zd(E) with Al2O3 NPs may be used as a replacement for R134a because of zero ODP and low GWP.
4.3. Optimization Analysis
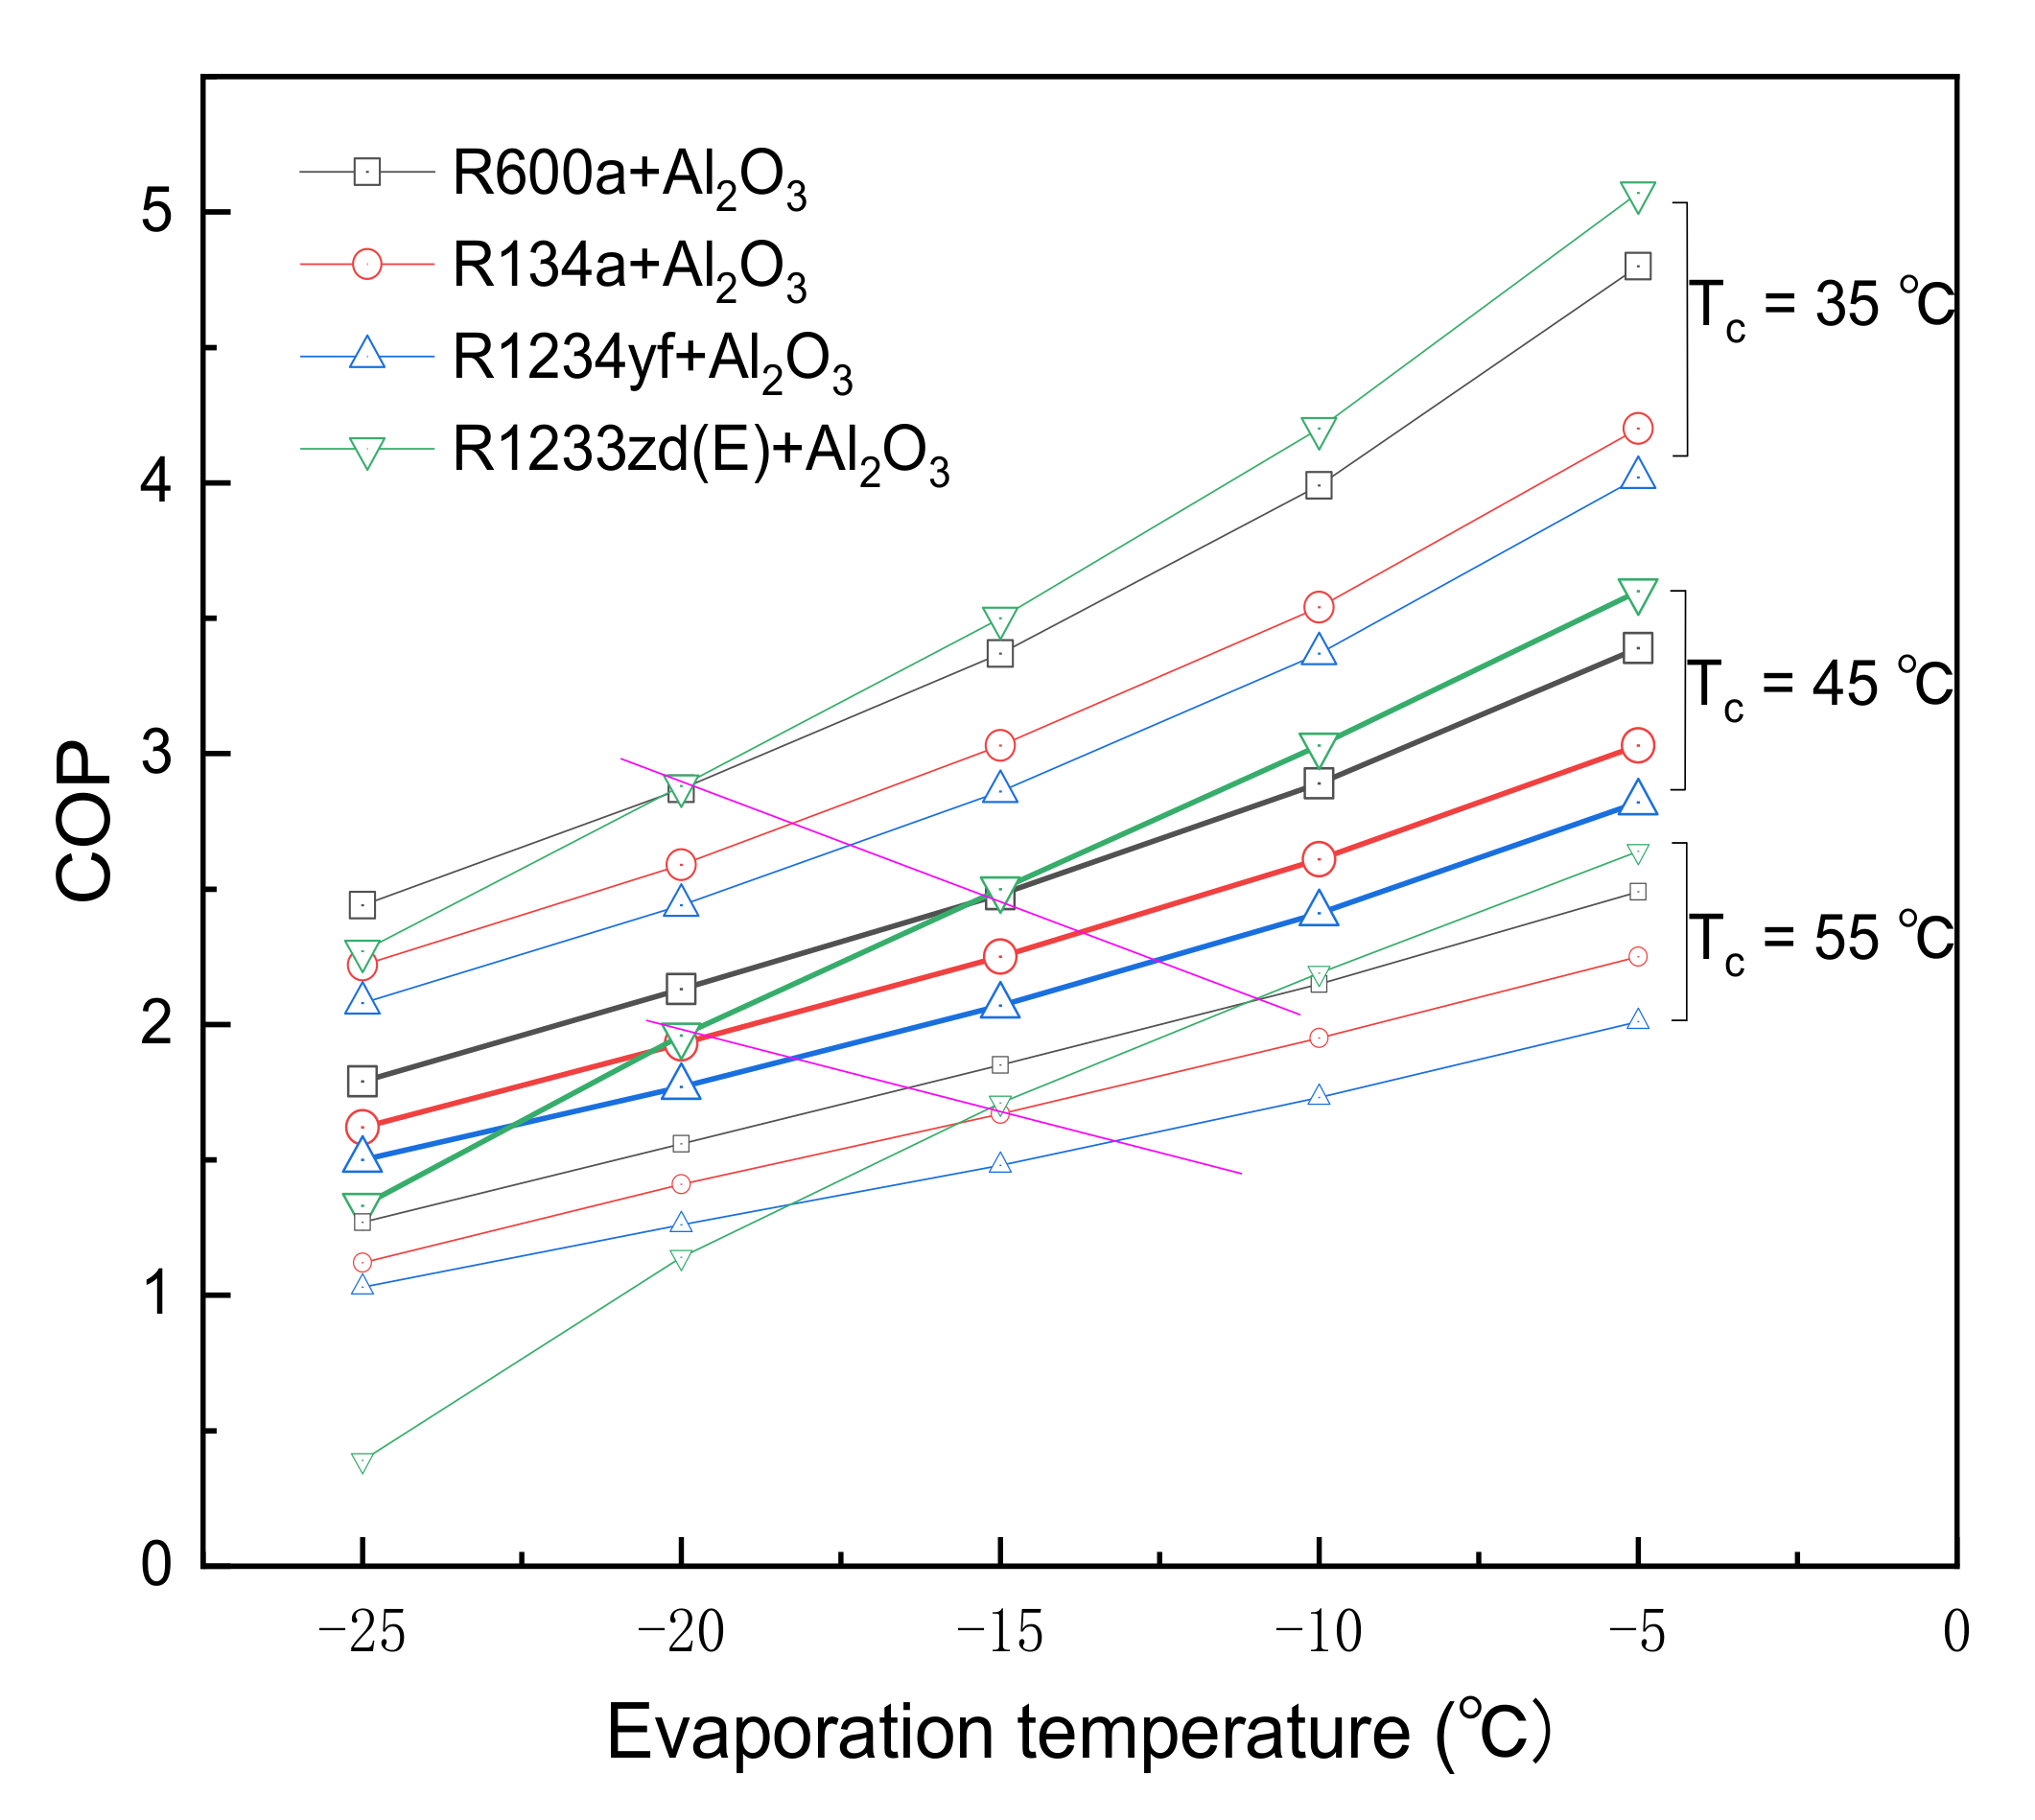
Figure 8 presents the COP variations with the evaporation temperature for three different condensing temperatures (the mass fraction of the NP is 0.3%). COP value increases more rapidly with increasing evaporation temperature for of 35 °C than the other condensation temperatures (45 °C and 55 °C). As the decreases and the increases, the COP of R600a + 0.3% Al2O3 may outperform R1233zd(E) + 0.3% Al2O3. Especially at of 20 °C and of 55 °C, the order of the COP is R600a + Al2O3, R134a + Al2O3, R1234yf + Al2O3, and R1233zd(E) + Al2O3, reaching 1.56, 1.41, 1.26, and 1.14, respectively. It could be said that R1233zd(E) is the worst alternative refrigerant for R134a under low-temperature refrigeration conditions.
5. Conclusions
Thermodynamic modeling using the energetic and exergetic analysis method is used to compare the effects of adding Al2O3 nanoparticles with different eco-friendly refrigerants (R600a, R134a, R1234yf, and R1233zd(E)) under different operation conditions. Therefore, the enthalpy of nanorefrigerants in the refrigeration cycle is calculated by the density prediction method in this study. Findings show that the thermal performance of a pure refrigerant system can be improved by adding nanoparticles. The main conclusions are obtained as follows:
- (1)
- Compared with the pure refrigerants R600a, R134a, R1234yf, and R1233zd (E), the compressor work per unit mass with 0.1% Al2O3 nanoparticles is decreased by 2.96%, 2.80%, 2.89%, and 6.13%, respectively; and the corresponding COP is increased by 6.36%, 3.10%, 3.32%, and 6.92%, respectively. The performance of the nanorefrigerant cycle is enhanced by improving the heat transfer efficiency and lowering the compressor power consumption;
- (2)
- The COPs and exergy efficiencies of R600a and R1233zd(E) are higher than that of R134a, while R1234yf is the lowest. R1233zd(E) + Al2O3 has the highest COP, followed by the R600a + Al2O3, R134a + Al2O3, and R1234yf + Al2O3 under the evaporation temperature ranges from −10 °C to 20 °C, the condensation temperature varies from 25 °C to 55 °C;
- (3)
- Highest COP of 4.28 is obtained for R1233zd(E) + 0.3% Al2O3 at a condensation temperature of 45 °C and evaporation temperature of 0 °C. With a mass fraction of 0.3% Al2O3 nanoparticles, the COP of R1233zd(E) + Al2O3 is 7.0% higher than that of R600a + Al2O3, it is 20.90% higher than that of R134a + Al2O3, and it is 28.92% higher than that of R1234yf + Al2O3;
- (4)
- The exergy efficiency increases linearly with the amount of Al2O3 nanoparticles added. The maximum exergy efficiency is 38.46% for R1233zd(E) + 0.3% Al2O3, and the minimum exergy efficiency is 27.06% for pure R1234yf;
- (5)
- As the decreases and the increases, the COP of R600a + 0.3% Al2O3 may outperform R1233zd(E) + 0.3% Al2O3. Especially at of 20 °C and of 55 °C, the order of the COP is R600a + Al2O3, R134a + Al2O3, R1234yf + Al2O3, and R1233zd(E) + Al2O3, reaching 1.56, 1.41, 1.26, and 1.14, respectively.
The stability of nanofluids is, unfortunately, the greatest challenge for researchers in current technology. Namely, the nanorefrigerant system performance may decrease over time. Studies on equipment life cycle analysis with nanorefrigerants are necessary. More investigation is needed to investigate the application of nanoparticles in heat pumps. Additionally, researchers are advised to focus on hybrid nanoparticles (mixing two different nanoparticles or a composite nanoparticle into pure refrigerants).
Author Contributions
S.L.: Conceptualization, Methodology, Software, Formal analysis, Writing—original draft preparation. J.L.: Funding acquisition, Supervision, Writing—review and editing. All authors have read and agreed to the published version of the manuscript.
Funding
The APC was funded by Scientific Research Project of Prof. Dr. Jun Lu from Chongqing University (02180026051454).
Institutional Review Board Statement
Not applicable.
Informed Consent Statement
Not applicable.
Data Availability Statement
Not applicable.
Conflicts of Interest
The authors declare no conflict of interest.
Nomenclature
| Symbols | |
| c | Specific heat, |
| E | Exergy rate, kW |
| Specific enthalpy, | |
| k | Thermal conductivity, |
| Mass flow rate, | |
| P | Pressure, kPa |
| Q | Thermal capacity, kW |
| Specific entropy, | |
| T | temperature, K or °C |
| W | Power, kW |
| Greek | |
| Efficiency | |
| Dynamic viscosity, Pa | |
| Density, | |
| Volume fraction | |
| Mass fraction | |
| Abbreviations | |
| COP | Coefficient of performance |
| GWP | Global Warming Potential |
| HCs | Hydrocarbons |
| HCFOs | Hydrochlorofluoroolefins |
| HFCs | Hydrofluorocarbons |
| HFOs | Hydrofluoroolefins |
| NP | Nanoparticle |
| NR | Nanorefrigerant |
| ODP | Ozone Depletion Potential |
| RI | Relative irreversibility |
| VCRC | Vapor-compression refrigeration cycle |
| Subscripts | |
| 1, 2, 3.. | State point |
| con | Condenser |
| comp | Compressor |
| des | destruction |
| eva | Evaporator |
| exp | Expansion valve |
| imp | Improvement of energy efficiency |
| is | Isentropic process |
| NR | Nanorefrigerant |
| R | Refrigerant |
References
- Aized, T.; Rashid, M.; Riaz, F.; Hamza, A.; Nabi, H.Z.; Sultan, M.; Ashraf, W.M.; Krzywanski, J. Energy and Exergy Analysis of Vapor Compression Refrigeration System with Low-GWP Refrigerants. Energies 2022, 15, 7246. [Google Scholar] [CrossRef]
- Li, S.; Lu, J.; Li, W.; Zhang, Y.; Huang, S.; Tian, L.; Lv, Y.; Hu, Y.; Zeng, Y. Thermodynamic analyses of a novel ejector enhanced dual-temperature air source heat pump cycle with self-defrosting. Appl. Therm. Eng. 2022, 215, 118944. [Google Scholar] [CrossRef]
- Li, S.; Lu, J.; Yan, J.; Hu, Y. Performance analysis of auxiliary entrainment ejector used in multi-evaporator refrigeration system. Therm. Sci. Eng. Prog. 2022, 32, 101307. [Google Scholar] [CrossRef]
- Ghanbarpour, M.; Mota-Babiloni, A.; Badran, B.E.; Khodabandeh, R. Energy, Exergy, and Environmental (3E) Analysis of Hydrocarbons as Low GWP Alternatives to R134a in Vapor Compression Refrigeration Configurations. Appl. Sci. 2021, 11, 6226. [Google Scholar] [CrossRef]
- Li, S.; Lu, J.; Li, W.; Huang, S.; Tian, L. Comparative performance of ternary azeotropic mixtures as substitutes for R134a in dual-temperature air source heat pump combined ejector. Therm. Sci. Eng. Prog. 2022, 37, 101577. [Google Scholar] [CrossRef]
- Xing, M.; Zhang, H.; Zhang, C. An update review on performance enhancement of refrigeration systems using nano-fluids. J. Therm. Sci. 2022, 31, 1236–1251. [Google Scholar] [CrossRef]
- Yang, D.; Sun, B.; Li, H.; Fan, X. Experimental study on the heat transfer and flow characteristics of nanorefrigerants inside a corrugated tube. Int. J. Refrig. 2015, 56, 213–223. [Google Scholar] [CrossRef]
- Zawawi, N.N.M.; Azmi, W.H.; Redhwan, A.A.M.; Sharif, M.Z.; Samykano, M. Experimental investigation on thermo-physical properties of metal oxide composite nanolubricants. Int. J. Refrig. 2018, 89, 11–21. [Google Scholar] [CrossRef]
- Jaffri, A.J.; Dondapati, R.S.; Bhat, M.W.; Vyas, G. Investigation on Thermo-Physical Properties of Mixed Nano-Refrigerant with CuO based nanoparticles. Mater. Today Proc. 2018, 5, 27795–27800. [Google Scholar] [CrossRef]
- Alawi, O.A.; Sidik, N.A.C. Influence of particle concentration and temperature on the thermophysical properties of CuO/R134a nanorefrigerant. Int. Commun. Heat Mass Transf. 2014, 58, 79–84. [Google Scholar] [CrossRef]
- Senthilkumar, A.; Anderson, A.; Praveen, R. Prospective of nanolubricants and nano refrigerants on energy saving in vapour compression refrigeration system—A review. Mater. Today Proc. 2020, 33, 886–889. [Google Scholar] [CrossRef]
- Yıldız, G.; Ağbulut, Ü.; Gürel, A.E. A review of stability, thermophysical properties and impact of using nanofluids on the performance of refrigeration systems. Int. J. Refrig. 2021, 129, 342–364. [Google Scholar] [CrossRef]
- Sai Pinni, K.; Katarkar, A.S.; Bhaumik, S. A review on the heat transfer characteristics of nanomaterials suspended with refrigerants in refrigeration systems. Mater. Today Proc. 2021, 44, 1331–1335. [Google Scholar] [CrossRef]
- Praveen Bharathwaj, R.; Javeed, S.; Raju, J.J.; Padmanathan, P.; Satheesh, A. A critical review on nanorefrigerants: Boiling, condensation and tribological properties. Int. J. Refrig. 2021, 128, 139–152. [Google Scholar]
- Bilen, K.; Dağidir, K.; Arcaklioğlu, E. The effect of nanorefrigerants on performance of the vapor compression refrigeration system: A comprehensive review. Energy Sources Part A Recovery Util. Environ. Eff. 2022, 44, 3178–3204. [Google Scholar] [CrossRef]
- Li, W.; Li, Y.; Shi, W.; Lu, J. Energy and exergy study on indirect evaporative cooler used in exhaust air heat recovery. Energy 2021, 235, 121319. [Google Scholar] [CrossRef]
- Liu, B.; Guo, X.; Xi, X.; Sun, J.; Zhang, B.; Yang, Z. Thermodynamic analyses of ejector refrigeration cycle with zeotropic mixture. Energy 2023, 263, 125989. [Google Scholar] [CrossRef]
- Carroll, P.; Chesser, M.; Lyons, P. Air Source Heat Pumps field studies: A systematic literature review. Renew. Sustain. Energy Rev. 2020, 134, 110275. [Google Scholar] [CrossRef]
- Bi, S.; Guo, K.; Liu, Z.; Wu, J. Performance of a domestic refrigerator using TiO2-R600a nano-refrigerant as working fluid. Energy Convers. Manag. 2011, 52, 733–737. [Google Scholar] [CrossRef]
- Javadi, F.S.; Saidur, R. Energetic, economic and environmental impacts of using nanorefrigerant in domestic refrigerators in Malaysia. Energy Convers. Manag. 2013, 73, 335–359. [Google Scholar] [CrossRef]
- Singh, K.; Lal, K. An investigation into the performance of a nanorefrigerant (R134a+Al2O3) based refrigeration system. Int. J. Res. Mech. Eng. Technol. 2014, 4, 158–162. [Google Scholar]
- Mahbubul, I.M.; Saadah, A.; Saidur, R.; Khairul, M.A.; Kamyar, A. Thermal performance analysis of Al2O3/R-134a nanorefrigerant. Int. J. Heat Mass Transf. 2015, 85, 1034–1040. [Google Scholar] [CrossRef]
- Qasim, S.M.; Maathe, A.T.; Hisham, S. Enhancement on the performance of refrigeration system using the nano-refrigerant. J. Energy Power Eng. 2017, 11, 237–243. [Google Scholar]
- Sharif, M.Z.; Azmi, W.H.; Redhwan, A.A.M.; Mamat, R.; Yusof, T.M. Performance analysis of SiO2/PAG nanolubricant in automotive air conditioning system. Int. J. Refrig. 2017, 75, 204–216. [Google Scholar] [CrossRef] [Green Version]
- Ande, R.; Koppala, R.S.; Hadi, M. Experimental investigation on VCR system using nano-refrigerant for COP enhancement. Chem. Eng. Trans. 2018, 71, 967–972. [Google Scholar]
- Dhamneya, A.K.; Rajput, S.P.S.; Singh, A. Comparative performance analysis of ice plant test rig with TiO2-R134a nano refrigerant and evaporative cooled condenser. Case Stud. Therm. Eng. 2018, 11, 55–61. [Google Scholar] [CrossRef]
- Alawi, O.A.; Salih, J.M.; Mallah, A.R. Thermo-physical properties effectiveness on the coefficient of performance of Al2O3/R141b nano-refrigerant. Int. Commun. Heat Mass Transf. 2019, 103, 54–61. [Google Scholar] [CrossRef]
- Sarrafzadeh Javadi, F.; Saidur, R. Thermodynamic and energy efficiency analysis of a domestic refrigerator using Al2O3 nano-refrigerant. Sustainability 2021, 13, 5659. [Google Scholar] [CrossRef]
- Bellos, E.; Tzivanidis, C. Performance analysis and optimization of an absorption chiller driven by nanofluid based solar flat plate collector. J. Clean. Prod. 2018, 174, 256–272. [Google Scholar] [CrossRef]
- Edin Hamrahi, S.; Goudarzi, K.; Yaghoubi, M. Experimental study of the performance of a continues solar adsorption chiller using Nano-activated carbon/methanol as working pair. Sol. Energy 2018, 173, 920–927. [Google Scholar] [CrossRef]
- Tashtoush, B.M.; Al-Nimr, M.d.A.; Khasawneh, M.A. Investigation of the use of nano-refrigerants to enhance the performance of an ejector refrigeration system. Appl. Energy 2017, 206, 1446–1463. [Google Scholar] [CrossRef]
- Azmi, W.H.; Sharif, M.Z.; Yusof, T.M.; Mamat, R.; Redhwan, A.A.M. Potential of nanorefrigerant and nanolubricant on energy saving in refrigeration system—A review. Renew. Sustain. Energy Rev. 2017, 69, 415–428. [Google Scholar] [CrossRef] [Green Version]
- Sharif, M.Z.; Azmi, W.H.; Mamat, R.; Shaiful, A.I.M. Mechanism for improvement in refrigeration system performance by using nanorefrigerants and nanolubricants—A review. Int. Commun. Heat Mass Transf. 2018, 92, 56–63. [Google Scholar] [CrossRef]
- Bhattad, A.; Sarkar, J.; Ghosh, P. Improving the performance of refrigeration systems by using nanofluids: A comprehensive review. Renew. Sustain. Energy Rev. 2018, 82, 3656–3669. [Google Scholar] [CrossRef]
- Jiang, W.; Song, J.; Jia, T.; Yang, L.; Li, S.; Li, Y.; Du, K. A comprehensive review on the pre-research of nanofluids in absorption refrigeration systems. Energy Rep. 2022, 8, 3437–3464. [Google Scholar] [CrossRef]
- Aktemur, C.; Tekin Öztürk, İ. Thermodynamic performance enhancement of booster assisted ejector expansion refrigeration systems with R1270/CuO nano-refrigerant. Energy Convers. Manag. 2022, 253, 115191. [Google Scholar] [CrossRef]
- Aktas, M.; Dalkilic, A.S.; Celen, A.; Cebi, A.; Mahian, O.; Wongwises, S. A theoretical comparative study on nanorefrigerant performance in a single-stage vapor-compression refrigeration cycle. Adv. Mech. Eng. 2015, 7, 138725. [Google Scholar] [CrossRef] [Green Version]
- Vuppaladadiyam, A.K.; Antunes, E.; Vuppaladadiyam, S.S.V.; Baig, Z.T.; Subiantoro, A.; Lei, G.; Leu, S.Y.; Sarmah, A.K.; Duan, H. Progress in the development and use of refrigerants and unintended environmental consequences. Sci. Total Environ. 2022, 823, 153670. [Google Scholar] [CrossRef] [PubMed]
- Mwesigye, A.; Kiamari, A.; Dworkin, S.B. Energetic optimization and exergetic performance investigation of an ejector refrigeration system using HCFO-1233zd(E) as a refrigerant. Int. J. Refrig. 2020, 112, 155–171. [Google Scholar] [CrossRef]
- Zarei, A.; Elahi, S.; Pahangeh, H. Design and analysis of a novel solar compression-ejector cooling system with eco-friendly refrigerants using hybrid photovoltaic thermal (PVT) collector. Therm. Sci. Eng. Prog. 2022, 32, 101311. [Google Scholar] [CrossRef]
- Yu, M.; Wang, C.; Wang, L.; Zhao, H. Optimization Design and Performance Evaluation of R1234yf Ejectors for Ejector-Based Refrigeration Systems. Entropy 2022, 24, 1632. [Google Scholar] [CrossRef] [PubMed]
- Chen, X.; Liang, K.; Li, Z.; Zhao, Y.; Xu, J.; Jiang, H. Experimental assessment of alternative low global warming potential refrigerants for automotive air conditioners application. Case Stud. Therm. Eng. 2020, 22, 100800. [Google Scholar] [CrossRef]
- Zhang, Y.; Xu, X. Predicting the thermal conductivity enhancement of nanofluids using computational intelligence. Phys. Lett. A 2020, 384, 126500. [Google Scholar] [CrossRef]
- Kosmadakis, G.; Neofytou, P. Investigating the effect of nanorefrigerants on a heat pump performance and cost-effectiveness. Therm. Sci. Eng. Prog. 2019, 13, 100371. [Google Scholar] [CrossRef]
- Maïga, S.E.B.; Palm, S.J.; Nguyen, C.T.; Roy, G.; Galanis, N. Heat transfer enhancement by using nanofluids in forced convection flows. Int. J. Heat Fluid Flow 2005, 26, 530–546. [Google Scholar] [CrossRef]
- Hamilton, R.L.; Crosser, O.K. Thermal conductivity of heterogeneous two-component systems. J. Ind. Eng. Chem. 1962, 1, 187–191. [Google Scholar] [CrossRef]
- Deriszadeh, A.; de Monte, F. On heat transfer performance of cooling systems using nanofluid for electric motor applications. Entropy 2020, 22, 99. [Google Scholar] [CrossRef] [PubMed] [Green Version]
- Kosmadakis, G.; Neofytou, P. Investigating the performance and cost effects of nanorefrigerants in a low-temperature ORC unit for waste heat recovery. Energy 2020, 204, 117966. [Google Scholar] [CrossRef]
- Tang, Y.; Yuan, J.; Liu, Z.; Feng, Q.; Gong, X.; Lu, L.; Chua, K.L. Study on evolution laws of two-phase choking flow and entrainment performance of steam ejector oriented towards MED-TVC desalination system. Energy 2022, 242, 122967. [Google Scholar] [CrossRef]
- Che Hussin, M.H.; Sowi, S.A.A.; Mahadi, M.A.S.; Sanuddin, A.; Mohd Khalil, A.N.; Abdul Rahim, Y. Experimental Performance of R134a/SiO2 in Refrigeration System for Domestic Use. J. Adv. Res. Fluid Mech. Therm. Sci. 2022, 95, 145–163. [Google Scholar] [CrossRef]
- Akhayere, E.; Adebayo, V.; Adedeji, M.; Abid, M.; Kavaz, D.; Dagbasi, M. Investigating the effects of nanorefrigerants in a cascaded vapor compression refrigeration cycle. Int. J. Energy Environ. Eng. 2022, 1–12. [Google Scholar] [CrossRef]
Figure 1.
Schematic and P-h diagram of the refrigeration cycle.

Figure 2.
Variation of COP with evaporation temperature at condensation temperature of 45 °C.

Figure 3.
Variation of exergy efficiency with evaporation temperature at condensation temperature of 45 °C.
Figure 3.
Variation of exergy efficiency with evaporation temperature at condensation temperature of 45 °C.


Figure 4.
Variation of COP with condensation temperature at evaporation temperature of 0 °C.

Figure 5.
Variation of exergy efficiency with condensation temperature at evaporation temperature of 0 °C.
Figure 5.
Variation of exergy efficiency with condensation temperature at evaporation temperature of 0 °C.


Figure 6.
Nanoparticle mass fraction on relative irreversibility for cycle components.

Figure 7.
Variation of COP and exergy efficiency with nanoparticle mass fraction at condensation temperature of 45 °C and evaporation temperature of 0 °C.
Figure 7.
Variation of COP and exergy efficiency with nanoparticle mass fraction at condensation temperature of 45 °C and evaporation temperature of 0 °C.

Figure 8.
The COP variations of the nanorefrigerants with the evaporation temperature for three different condensation temperatures.
Figure 8.
The COP variations of the nanorefrigerants with the evaporation temperature for three different condensation temperatures.


Table 1.
Overview of recent review articles on nanofluid study.
| Authors | Remarks |
|---|---|
| Senthilkumar et al. (2020) [11] | Study the consequences of nanolubricants and nanorefrigerants and summarizes the methods to increase the heat transfer, enhancing the coefficient of performance and reduction in power consumption. |
| Yıldız et al. (2021) [12] | Summarize the preparation of nanofluids, the variation of thermophysical properties, the stability of nanofluids, impacts on the system performances of nanofluid usage, limitations, and challenges of nanoparticle usage, particularly in refrigeration systems. |
| Pinni et al. (2021) [13] | Study the thermal performance, improvement potentials, technical applications, and future challenges of various nanorefrigerants at different nanoparticle concentrations. |
| Praveen et al. (2021) [14] | An evolutionary timeline of nanorefrigerants and energy savings on compressor work by the addition of nanolubricants is discussed. Presents the dispersion techniques, stability, properties of boiling and condensation, migration phenomenon of nanoparticles, and various novel techniques to improve the performance of refrigeration systems. |
| Bilen et al. (2022) [15] | The effect of nanorefrigerants on the vapor compression refrigeration system performance is presented. The use of nanorefrigerants in vapor compression refrigeration systems improves the coefficient of performance up to 43.93% and 56.32% in the theoretical and experimental studies, respectively. |
Table 2.
Studies on the performance of nanorefrigerants in vapor-compression refrigeration systems.
| Authors | Nanorefrigerant | Fraction | Evaluation |
|---|---|---|---|
| Bi et al. (2011) [19] | R600a with TiO2 | 0.1 & 0.5 | The energy consumption of R600a + TiO2 is reduced by 9.6%. |
| Javadi et al. (2013) [20] | R134a with TiO2 and Al2O3 | 0.06 and 0.1 wt.% | Energy saving of 25% using 0.1% TiO2 nanoparticle. |
| Singh and Lal (2014) [21] | R134a with Al2O3 | 0.5 wt.% | The improvement in COP is maximum (7.2 to 8.5%). When Al2O3 nanoparticles are increased to 1 wt.%, COP has been found to be lower than that of pure R134a. |
| Mahbubul et al. (2015) [22] | R134a with Al2O3 | 5 vol.% | COP is 3.2% higher than pure R134a. |
| Mahdi et al. (2017) [23] | R134a with Al2O3 | 0.01 & 0.02 vol.% | The coefficient of heat transfer is enhanced by 0.54% and 1.1%, and COP is improved by 3.33% and 12%, respectively. |
| Sharif et al. (2017) [24] | R134a with SiO2 | 0–0.7 vol.% | Maximum and average COP enhancements are 24% and 10.5% with the addition of nanoparticles, respectively. The optimum volumetric fraction of nanoparticles is 0.05%. |
| Ande et al. (2018) [25] | R134a with CuO | 1.6 wt.% | COP increased by 16.66%, and energy consumption decreased by 13.79%. |
| Dhamneya et al. (2018) [26] | R134a with TiO2 | 0.2 & 0.6 | COP increased by 34.39% and 55.14%, respectively. |
| Alawi et al. (2019) [27] | R141b with Al2O3 | 1–4 vol.% | COP is increased by 15.13% in comparison to pure R141b. |
| Javadi et al. (2021) [28] | R134a with Al2O3 | 0.1 wt.% | The electricity consumption is 2.69% lower than that of the base fluid. |
| Refrigerant | Molecular Weight | Critical Temperature (°C) | Critical Pressure (MPa) | Boiling Point (°C) | Safety Group | ODP | GWP | Class |
|---|---|---|---|---|---|---|---|---|
| R600a | 58.1 | 134.7 | 3.629 | −11.75 | A3 | 0 | 4 | HC |
| R134a | 102.0 | 101.1 | 4.06 | −26.07 | A1 | 0 | 1430 | HFC |
| R1234yf | 114.4 | 94.7 | 3.38 | −29.49 | A2L | 0 | 4 | HFO |
| R1233zd(E) | 130.5 | 166.4 | 3.62 | 18.26 | A1 | <0.0004 | 4 | HCFO |
Table 4.
Properties of the selected nanoparticles at a temperature of 25 °C [44].
Table 4.
Properties of the selected nanoparticles at a temperature of 25 °C [44].
| Nanoparticle | Thermal Conductivity | Density | Specific Heat | Particle Size (nm) | Average Price | Percentage Distribution |
|---|---|---|---|---|---|---|
| Cu | 396.5 | 8958 | 0.239 | 50 | 0.60 | 3.16% |
| Al2O3 | 38.7 | 3970 | 0.765 | 48 | 0.69 | 36.84% |
| CuO | 33.0 | 6315 | 0.530 | 77 | 0.41 | 12.63% |
| ZnO | 27.2 | 5630 | 0.494 | 30–50 | 0.60 | 3.16% |
| TiO2 | 8.4 | 3900 | 0.692 | 28 | 0.94 | 16.84% |
| SiO2 | 1.38 | 2400 | 0.968 | 55–75 | 0.41 | 9.47% |
Table 5.
Correlations of thermophysical properties of nanorefrigerants.
| Nanorefrigerants Property | Correlation | Reference |
|---|---|---|
| Density () | Bhattad (2018) [34] | |
| Specific enthalpy () | Kosmadakis et al. (2019) [44] | |
| Specific heat () | Mahbubul et al. (2015 [22]) | |
| Dynamic viscosity () | Maïga (2005) [45] | |
| Thermal conductivity () | Hamilton and Crosser (1962) [46] |
Table 6.
Thermodynamic equations for the components of the refrigeration system [48].
Table 6.
Thermodynamic equations for the components of the refrigeration system [48].
| Component | Thermodynamic Balance Equation |
|---|---|
| Compressor | |
| Condenser | |
| Expansion valve | |
| Evaporator |
Table 7.
The exergy destruction and exergy efficiency for the components of the refrigeration system [2,49].
| Component | Exergy Destruction | Exergy Efficiency |
|---|---|---|
| Compressor | ||
| Condenser | ||
| Expansion valve | ||
| Evaporator |
Table 8.
Validation of the model.
| COP | ||||||
|---|---|---|---|---|---|---|
| Hussin et al. [50] | Model | Hussin et al. [50] | Model | Hussin et al. [50] | Model | |
| R134a | 394 | 394.37 | 258 | 259.40 | 3.24 | 3.20 |
| R134a + 0.1%SiO2 | 393 | 394.48 | 249 | 259.21 | 3.43 | 3.49 |
| R134a + 0.3%SiO2 | 395 | 394.52 | 250 | 258.83 | 3.72 | 3.66 |
| R134a + 0.5%SiO2 | 395 | 394.55 | 243 | 258.45 | 4.00 | 3.85 |
| Average deviation | 0.06% | 3.63% | −1.21% | |||
Table 9.
Cycle parameters and calculated values.
| Parameters | R600a-Al2O3 | R134a-Al2O3 | R1234yf-Al2O3 | R1233zd(E)-Al2O3 | ||||
|---|---|---|---|---|---|---|---|---|
| 0 | 0.1% | 0 | 0.1% | 0 | 0.1% | 0 | 0.1% | |
| (°C) | 0 | 0.03 | 0 | 0.028 | 0 | 0.03 | 0 | 0.024 |
| (°C) | 52.22 | 50.04 | 61.63. | 60.48 | 50.99 | 50.10 | 58.14 | 55.14 |
| (°C) | 45 | 44.67 | 45 | 44.82 | 45 | 44.83 | 45 | 44.67 |
| (kPa) | 157.96 | 159.12 | 292.80 | 293.11 | 315.82 | 316.15 | 48.11 | 48.16 |
| (kPa) | 604.45 | 599.39 | 1159.92 | 1154.46 | 1153.83 | 1148.90 | 252.14 | 249.62 |
| () | 554.34 | 554.38 | 396.60 | 398.62 | 363.29 | 363.31 | 435.17 | 435.19 |
| () | 628.58 | 624.48 | 440.36 | 439.20 | 396.84 | 395.89 | 478.07 | 475.45 |
| () | 309.07 | 308.22 | 263.94 | 263.67 | 262.30 | 262.04 | 286.20 | 285.79 |
| 0 | 0.0001 | 0 | 0.0004 | 0 | 0.0004 | 0 | 0.0001 | |
| 0 | 0.0132 | 0 | 0.0284 | 0 | 0.0255 | 0 | 0.0306 | |
| () | 4.26 | 4.26 | 14.43 | 14.44 | 17.65 | 17.66 | 2.84 | 2.84 |
| () | 524.37 | 524.83 | 1125.05 | 1125.86 | 1012.65 | 1013.40 | 1212.77 | 1213.62 |
| () | 245.26 | 246.16 | 134.66 | 134.95 | 100.99 | 101.27 | 148.97 | 149.39 |
| () | 1044.08 | 1048.92 | 1942.91 | 1949.08 | 1782.17 | 1788.90 | 422.52 | 424.15 |
| () | 72.24 | 70.10 | 41.75 | 40.58 | 33.55 | 32.58 | 42.90 | 40.27 |
| COP | 3.30 | 3.51 | 3.23 | 3.33 | 3.01 | 3.11 | 3.47 | 3.71 |
| 29.69% | 31.56% | 28.99% | 29.89% | 27.06% | 27.93% | 31.21% | 33.35% | |
Publisher’s Note: MDPI stays neutral with regard to jurisdictional claims in published maps and institutional affiliations. |
© 2022 by the authors. Licensee MDPI, Basel, Switzerland. This article is an open access article distributed under the terms and conditions of the Creative Commons Attribution (CC BY) license (https://creativecommons.org/licenses/by/4.0/).
Share and Cite
MDPI and ACS Style
Li, S.; Lu, J. A Theoretical Comparative Study of Vapor-Compression Refrigeration Cycle using Al2O3 Nanoparticle with Low-GWP Refrigerants. Entropy 2022, 24, 1820. https://doi.org/10.3390/e24121820
AMA Style
Li S, Lu J. A Theoretical Comparative Study of Vapor-Compression Refrigeration Cycle using Al2O3 Nanoparticle with Low-GWP Refrigerants. Entropy. 2022; 24(12):1820. https://doi.org/10.3390/e24121820
Chicago/Turabian StyleLi, Shengyu, and Jun Lu. 2022. "A Theoretical Comparative Study of Vapor-Compression Refrigeration Cycle using Al2O3 Nanoparticle with Low-GWP Refrigerants" Entropy 24, no. 12: 1820. https://doi.org/10.3390/e24121820
Note that from the first issue of 2016, this journal uses article numbers instead of page numbers. See further details here.