Stock Market Volatility and Return Analysis: A Systematic Literature Review


Abstract
:1. Introduction
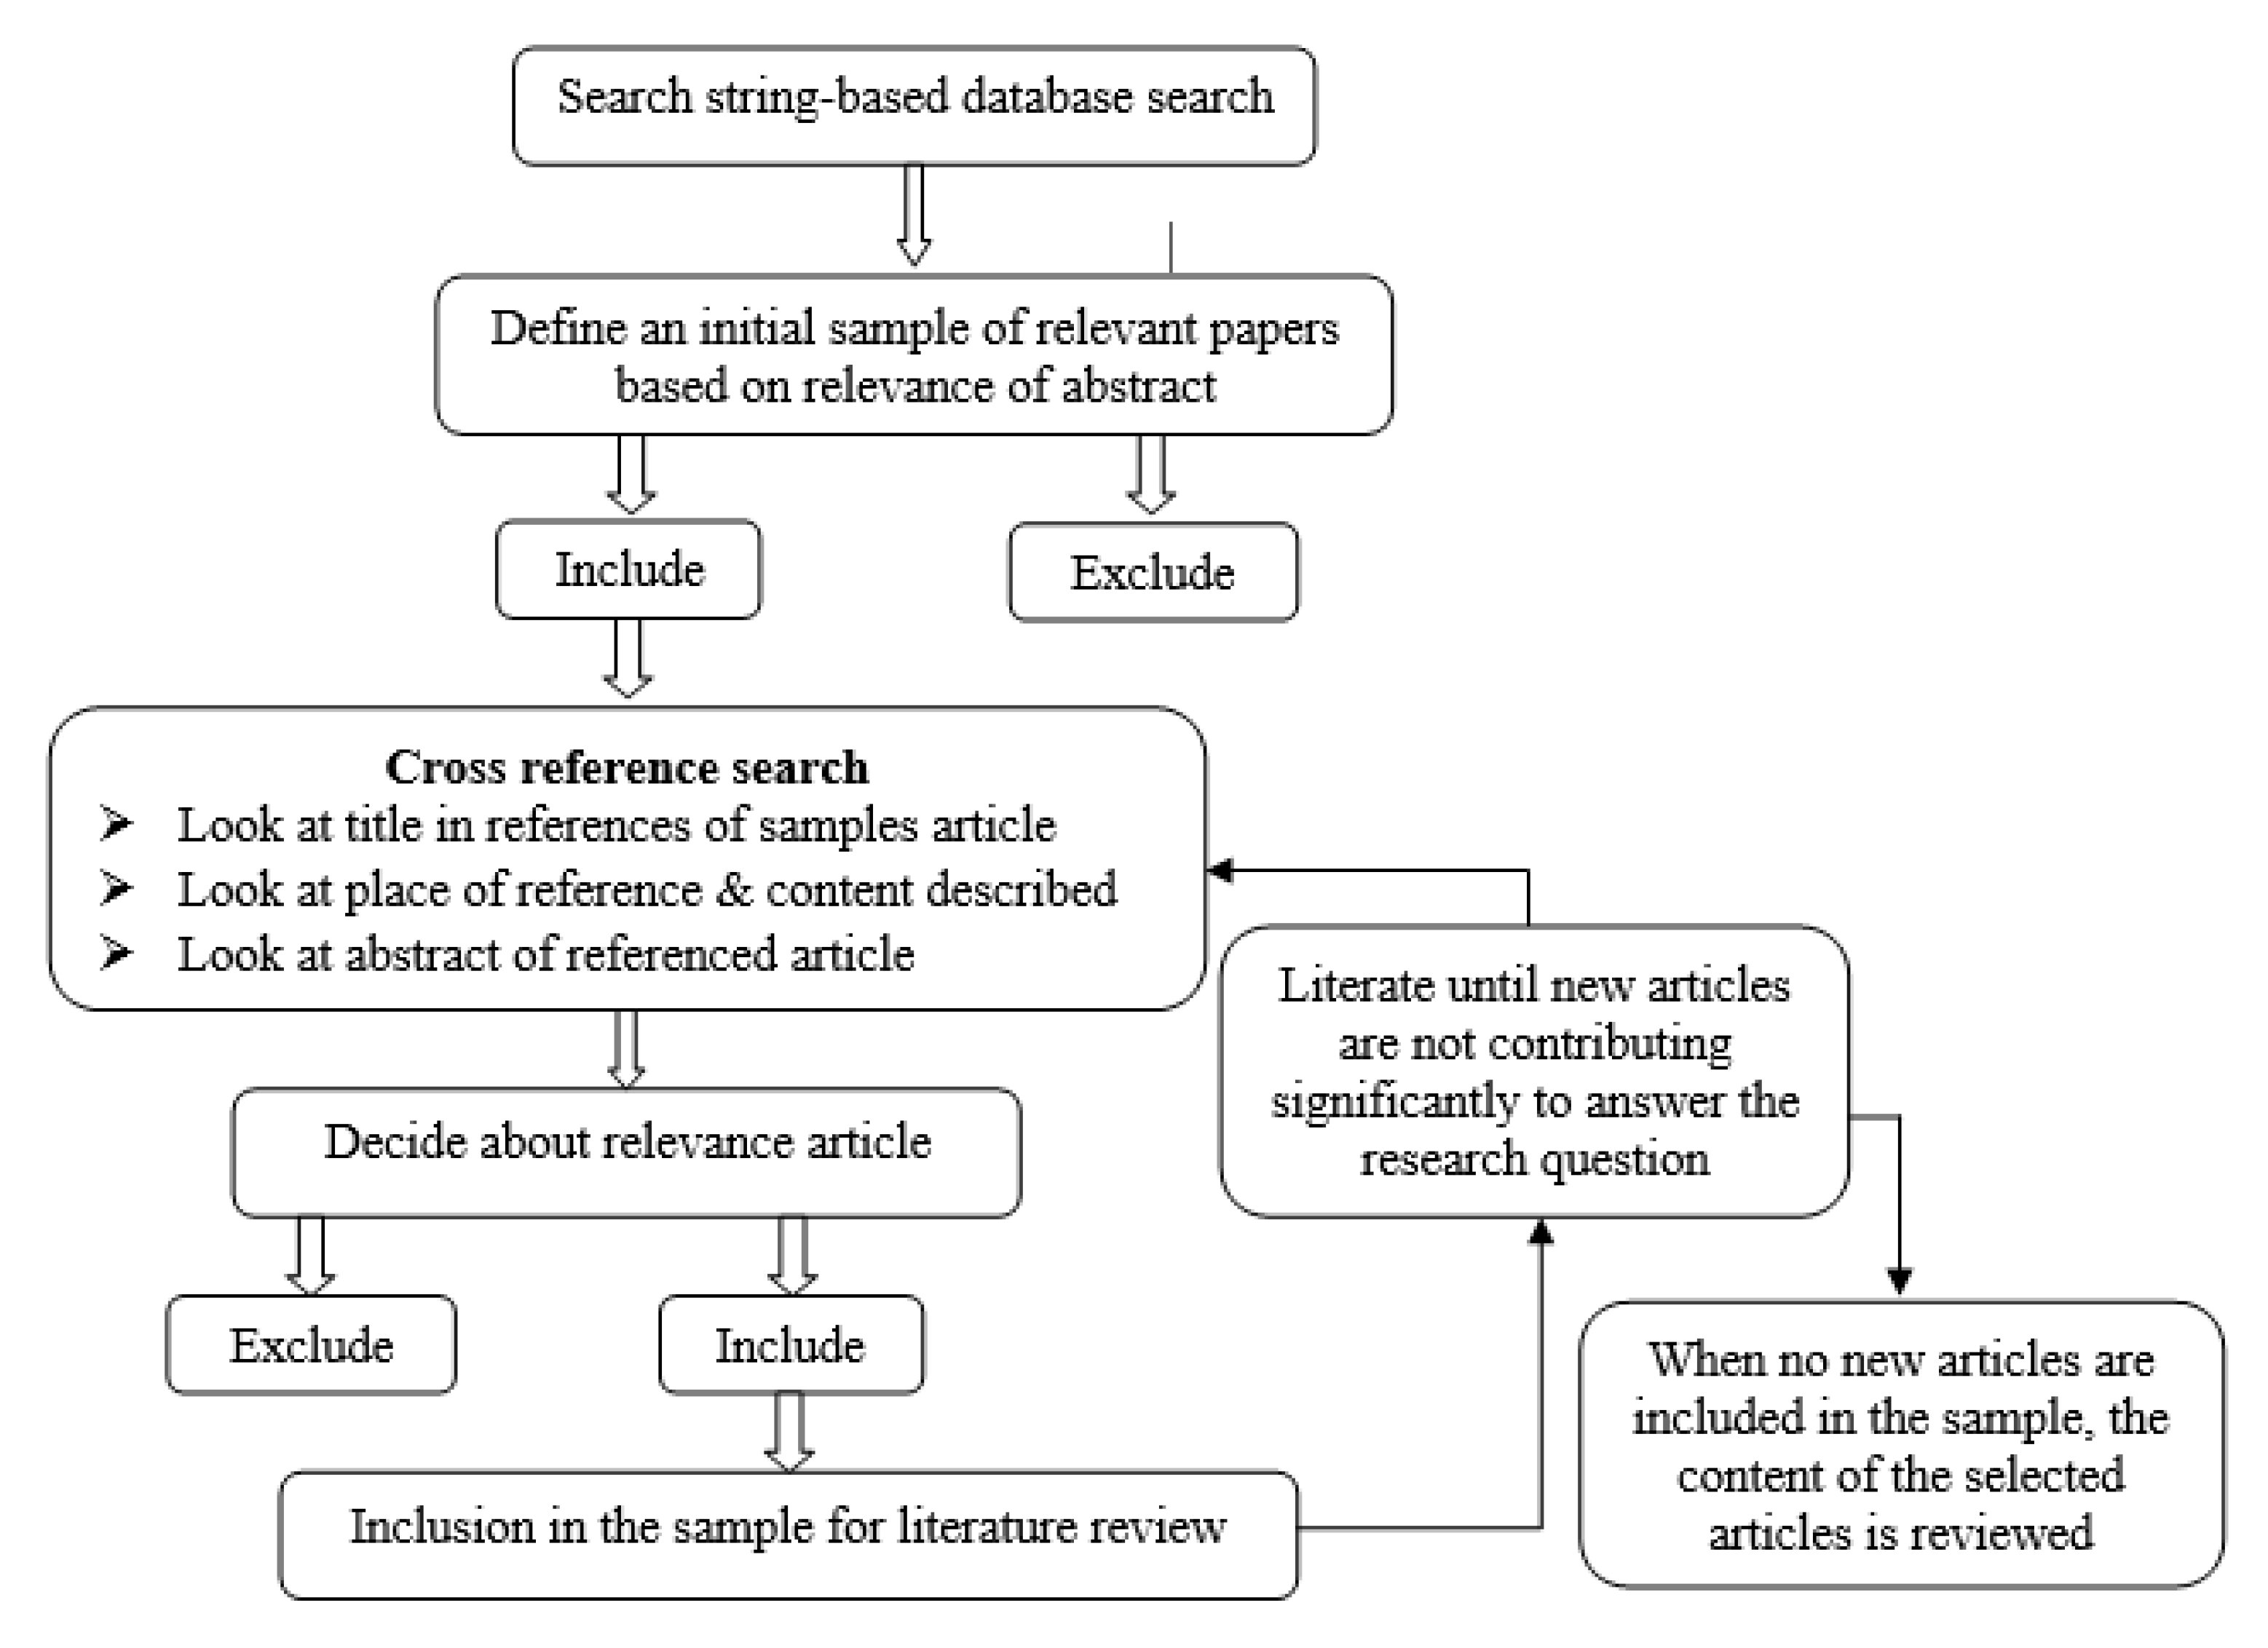
2. Methodology
3. Review of Different Studies

| Authors | Data Set | Econometric Models | Study Results |
|---|---|---|---|
| Alberg et al. [27] | Daily returns data, TASE indices, the TA25 index period October 1992 to May 2005 and TA100 index period July 1997 to May 2005 | GARCH, EGARCH, and APARCH model | Findings suggest that one can improve overall estimation by using the asymmetric GARCH model and the EGARCH model is a better predictor than the other asymmetric models. |
| Olowe [28] | Daily returns over the period January 2004 to March 2009 | EGARCH in mean model | Nigerian stock market returns show that volatility is persistent and there is a leverage effect. The study found little evidence open the relationship between stock returns and risk as measures by its aim volatility. |
| Girard & Omran [29] | Examine the interaction of volatility and volume in 79 traded companies in Cairo and Alexandria Stock Exchange | GARCH model | They found that information size and direction have a negligible effect on conditional volatility and, as a result, the presence of noise trading and speculative bubbles is suspected. |
| Neokosmidis [30] | Six years’ data from March 2003 to March 2009 for four US stock indices i.e., Dow Jones, Nasdaq, NYSE, S&P500 | ARCH, GARCH (1,1), EGARCH (1,1) Multivariate volatility models | The study concludes that EGARCH model is that best fitted process for all the sample data based on AIC minimum criterion. It is observed that there are high volatility periods at the beginning and at the end of our estimation period for all stock indices. |
| Tripathy & Alana [31] | Daily OHLC values of NSE index returns from 2005–2008 | Rolling window moving average estimator, EWMA, GARCH models, Extreme value indicators, and Volatility index (VIX) | A GARCH and VIX models, proved to be the best methods. Extreme value models fail to perform because of low frequency data. |
| Liu & Hung [32] | Taiwanese stock index futures prices, daily data April 2001 to December 2008 | GARCH type models: GARCH, GJR-GARCH, QGARCH, EGARCH, IGARCH, CGARCH | They demonstrate that the EGARCH model provides the most accurate daily volatility forecasts, while the performances of the standard GARCH model and the GARCH models with highly persistent and long-memory characteristics are relatively poor. |
| Joshi [33] | Daily closing price from January 2005 to May 2009 | BDS Test, ARCH-LM test, and GARCH (1,1) model | Persistence of volatility is more than Indian stock market |
| Wong & Cheung [34] | Hong Kong stock market from 1984 to 2009 | GARCH family models | The EGARCH and AGARCH models can detect the asymmetric effect well in response to both good news and bad news. By comparing different GARCH models, they find that it is the EGARCH model that best fits the Hong Kong case. |
| Chang et al. [35] | Taiwan Stock Exchange (TAIEX), the S&P 500 Index, and the Nasdaq Composite Index for the period of January, 2000 to January, 2004 | GJR-GARCH model (1,1) | There is a significant price transmission effect and volatility asymmetry among the TAIEX, the US spot index, and US index futures. |
| Koutmos [36] | Shanghai stock exchange Ten industries sector indices daily data ranging from January 2009 to June 2012 | Volatility estimation AR (1), EGARCH (1,1) | Time varying beta risk of industry sector indices in Shanghai stock results industries respond positively to rises in such non-diversifiable risk. Reports on the volatility persistence of the various industry sectors and identifies which industries have high and low persistence. |
| Chen [37] | New York, London and Tokyo as well as those of Hong Kong, Shanghai and Shenzen the period of January 1993 to March 2010 | Granger causality test, VAR model, VEC model, variance decomposition, impulse response function, co-integration and GARCH models | Evidence shows that five stock markets are in the process of increasing integration. The periodic break down of co-integrating relationship is advantageous to foreign investors. |
| Abdalla & Suliman [38] | Saudi stock market by using (Tadawul All Share Index; TASI) over the period of January 2007 to November 2011 | GARCH (1,1) model, including both symmetric and asymmetric models | The results provide evidence of the existence of a positive risk premium, which supports the positive correlation hypothesis between volatility and the expected stock returns. |
| Maheshchandra [39] | Daily closing price of BSE and NSE stock indices period of January 2008 to August 2011 | ARFIMA and FIGARCH models | Absence of long memory in return series of the Indian stock market. Strong evidence of long memory in conditional variance of stock indices. |
| Li & Wang [40] | China stock indices, six industry indexes, January 2006 to June 2012 | ARMA and GARCH family model, GARCH (1,1), TGARCH (1,1), EGARCH (1,1) | The paper examined the leverage effect and information symmetry. Both ARCH and GARCH models can explain volatility clustering phenomena and have been quite successful in modeling real data in various applications. |
| Hou [41] | Daily closing prices of the SHCI and SZCI indices from January 1997 to August 2007 | GARCH family models | An asymmetric effect of negative news exists in the Chinese stock markets. The EGARCH and the GJR models tend to overestimate the volatility and returns in the high-volatility periods. |
| Purohit et al. [42] | Daily closing data for November 2009 to March 2013, NIFTY and NIFTY Junior indices | ADF Test, Johansen’s co-integration test, and GARCH (1,1) model | Empirical results found that one-month futures do not bring volatility in the VIX. |
| Shalini [43] | Daily data of sectoral indices for the period of January 2001 to June 2014 | ARMA (1,1), and GARCH (1,1) models | Return of the BSE sectoral indices exhibit characteristics of normality, stationarity, and heteroscedasticity. |
| Ghorbel & Attafi [44] | MENA stock market indices of daily observations for the period January 2007 to March 2012 | GARCH family models | MENA region’s markets are higher between extremes than between ordinary observations registered during normal periods, but they offer many opportunities to investors to diversify their portfolio and reduce their degree of risk aversion. Dependence between markets increases during volatile periods. |
| Gupta et al. [45] | The daily closing prices of S&P CNX500 of National Stock Exchange for the period from January 2003 to December 2012 | GARCH, TGARCH, and EGARCH models | The result of that volatility varies over time and constant variance assumption is inconsistent. The empirical evidence indicated the presence of time varying volatility. |
| Nadhem et al. [46] | S&P500 market daily returns the sample period from July 1996 to May 2006 | GARCH family models | Results of ANN models will be compared with time series model using GARCH family models. The use of the novel model for conditional stock markets returns volatility can handle the vast amount of nonlinear data, simulate their relationship, and give a moderate solution for the hard problem. |
| Banumathy & Azhagaiah [47] | The daily closing prices of S&P CNX Nifty Index for the period from January 2003 to December 2012 | Both symmetric and asymmetric models GARCH (1,1) | The result proves that GARCH and TGARCH estimations are found to be the most appropriate model to capture symmetric and asymmetric volatility respectively. |
| Okičić [48] | Central and Eastern Europe region for the period from October 2005 to December 2013 | Both symmetric and asymmetric GARCH models, i.e.,; GARCH, IGARCH, EGARCH, GJR, and PGARCH | Study indicate that existence of the leverage effect in case of stock markets from the CEE region, which indicates that negative shocks increase the volatility more than positive shocks. |
| Lum & Islam [49] | Australian share markets data for the period of January 1988 to December 2004 | GARCH family models | Findings support asymmetric effects in the Australian share markets, and by incorporating them into the GARCH-M models yield better results in both financial and econometric terms. |
| Jebran & Iqbal [50] | Asian countries, i.e., Pakistan, India, Sri Lanka, China, Japan, and Hong Kong. The daily data was considered from the period January 1999 to January 2014 | GARCH model | Result revealed absence of any spillover effect of volatility across Indian and Chinese stock markets. However, bidirectional and unidirectional spillover effects have been established across other Asian markets. |
| Yang et al. [51] | CSI 300 index consider for the period of July 2013 to January 2016 | GARCH, EGARCH, APARCH, and PTTGARCH models | The PTTGARCH models both with single regime and Markov regime switching outperform other models in estimation and prediction of the volatilities of the return series within the sample and out-of-sample. |
| Varughese & Mathew [52] | India stock market daily data for the period of April 2003 to March 2015 | GARCH, EGARCH, and TARCH models | The existence of volatility clustering and leverage effect in the market and the investment activities of foreign portfolio investment have had a significant impact on the volatility of stock market. |
| Pati et al. [53] | India NIFTY Volatility Index (IVIX) and CNX NIFTY Index (NIFTY), Australia S&P/ASX 200 Volatility Index (AVIX) and S&P/ASX 200 Index (ASX), and Hong Kong Hang Seng Volatility Index (VHSI) and HSI, consider the period of January 2008 to July 2016 | GARCH family models | The study finds that volatility index is a biased forecast but possesses relevant information in explaining future realized volatility. GARCH family models suggest that it contains relevant information in describing the volatility process. |
| Pele et al. [54] | The EUR/JPY exchange rate of daily prices and time period considered from 1999 to 2005 | GARCH model, Entropy, and VAR model | GARCH-based forecast is more stable whilst the entropy-based forecast reacts faster to new information. VAR model performs the worst failing the tests, whilst the normal GARCH model passes all tests. But the best results overall are obtained by the entropy-based forecast model. |
| Bhowmik et al. [55] | Emerging six Asian stock markets daily stock market index data from January 2002 to December 2016 | GARCH model, Granger Causality Tests, and VAR model | The volatility and return spillovers behave very differently over time, during the pre-crisis, crisis, and post crisis periods. Importantly, the Asian emerging stock markets interaction was less before the global financial crisis period. |
| Kim & Lee [56] | Daily negative returns of the Google’s stock price and Dow Jones index, November 2004 to November 2016 | PTTGARCH model | Article demonstrates its validity through a simulation study and real data analysis. The result indicates that for practical applications, the underlying innovation distribution should be modeled in a more refined manner. |
| Amudha & Muthukamu [57] | NSE from the period of April 2003 to September 2015 | GARCH family models | The findings reported an evidence of volatility, which exhibited the clustering and persistence of stocks. The return series of the stocks selected for the study were found to react on good and bad news asymmetrically. |
| Chronopoulos et al. [58] | US stock return a daily frequency S&P500 index covering the period from January 2004 to December 2016 | GARCH family models | The SVI variable exhibits the best performance among all considered models and SVI variable offers the highest gains for investors. |
| Bhowmik & Wang [59] | BSE 30, SSE composite, DSEX, FBMKLCI, PSEi, KOSPI indices data of daily closing prices for the period of January 2007 to 2016 | GARCH family models and VAR model | The returns and volatility linkages exist between the emerging Asian markets and the developed stock markets. The volatilities to unexpected shocks in various markets, especially, come from neighboring country markets and more developed country markets. |
| Kapusuzoglu & Ceylan [60] | Borsa Istanbul sector indices of daily data over the period of October 1987 to January 2017 | GARCH model | Model shows the existence of a positive and statistically significant relationships between trading volume and the number of information events makes the variability of the sector indices to increase. |
| Wang et al. [61] | High frequency data, stock market policies issued related news, January 2014 to August 2015 | GARCH-M and EGARCH-M models | The results show that China’s stock market was mainly driven by government policies rather than economic fundamentals, as measured by GDP, PPI, and PMI. |
| Shanthi & Thamilselvan [62] | Nifty 50 and BSE Sensex daily data from both indices over the period of January 1995 to December 2015 | GARCH, TGARCH, and EGARCH models | The study indicates that symmetric information is not suitable for a certain period considered in this study. The TGARCH model outperformed all the models due to the availability of information. |
| Bhowmik & Wang [63] | The data consists of daily, weekly, and monthly closing prices of six emerging stock market indexes in Asian countries from the period of 2007 to 2016 | Unit root tests, serial correlation test, runs test, VR tests, ARMA, GARCH model, and BDS test | Study suggests that none of the sample Asian emerging stock markets follow Random-walk and hence all are weak-form efficient markets except South Korean Markets. Additionally, short-term variants of the technical trading rules have better predictive ability than long-term variants. |
| Dixit & Agrawal [64] | BSE and NSE daily data of the closing value from April 2011 to March 2017 | GARCH family models | The study suggested that the P-GARCH model is most suitable to predict and forecast the stock market volatility for BSE and NSE markets. |
| Kumar & Biswal [65] | Brazil, India, Indonesia and Pakistan stock markets return of the average price (open, close, high, and low) for January 2014 to October 2018 | GARCH family models | The result confirms the presence of volatility clustering and leverage effect that is that good news affects the future stock market than bad news. |
| Authors | Data Set | Econometric Models | Study Results |
|---|---|---|---|
| Singh et al. [74] | 15 world indices for the period of January 2000 to February 2008 have been considered | AR-GARCH, bivariate VAR, Multivariate GARCH (BEKK) model | There is significant positive volatility spillover from other markets to Indian market, mainly from Hong Kong, Korea, Japan, and Singapore and US market. Indian market affects negatively the volatility of US and Pakistan. |
| Rao [75] | Daily returns data from February 2003 to January 2006, Arabian Gulf Cooperation Council equity markets data | MGARCH and VAR models | Arabian Gulf Cooperation Council markets exhibit significant own and cross spillover of innovations and volatility spillover and persistence in these markets. |
| Maniya & Magnnsson [76] | S&P 500, NIKKE 225, KSE 100, BSE 30, Hang Seng indices. Daily closing Index and data from January 1989 to December 2009 | ARCH, GARCH models, GARCH-BEKK model correlation, unit root tests, granger-causality test | Time varying correlation increases in bearish spells whereas bullish periods do not have a big “Statistical” impact on correlation. |
| Princ [77] | Daily returns of Prague stock exchange index and other 11 major stock indices during 1994 to 2009 | DCC-MVGARCH model | The study found the existence of an increasing trend in conditional correlations among a whole European region. Results show the unidirectional influence of foreign markets affecting Czech market. |
| Yong et al. [78] | Daily data of Japanese stock over the study period 1994–2007 | BEKK-GARCH model | They found that news shocks in the Japanese currency market account for volatility transmission in eight of the 10 industrial sectors considered. They also found that significant asymmetric effects in five of these industries. |
| Athukoralalage [79] | Weekly stock market data of Australia, Singapore, UK, and the US for the period from Jan 1992 to June 2010 | M-GARCH Model, Diagonal BEKK model ARCH, and GARCH techniques | Positive return spillover effects are only unidirectional and run from both US and UK (the bigger markets) to Australia and Singapore (the smaller markets). Shocks arising from the US market can impact on all of the other markets in the sample. |
| Kouki et al. [80] | Five sectors daily data covering period from January 2002 to October 2009 | VAR Framework one lag, BEKK (1,1) model | International financial markets are not integrated in all the sectors. Results find that the three highly integrated sectors are bank, real estate, and oil. |
| Walid et al. [81] | The weekly closing stock indexes and local currency and exchange rates used for four emerging markets, data from December 1994 to March 2009 | Markov-Switching-EGARCH model | Results provide strong evidence that the relationship between stock and foreign exchange market is regime dependent and stock price volatility responds asymmetrically to events in the foreign exchange market. |
| Katzke [82] | Daily closing prices of six largest industrial sector composite total return indices during January 2002 to April 2013 | AR (1) model, MV-GARCH models, DCC models, VECH, and BEKK techniques, and GJR-GARCH model | The results show that global and domestic economic uncertainty as well as local asset market segment significantly influences both the short run dynamics and the aggregate level of co-movement between local sector pairs. |
| Peng et al. [83] | TAIEX and Nikkei from both indices over the period of January, 2000 to March, 2016 | Bi-EGARCH model | The past returns on NIKKEI influenced significantly current period returns of TAIEX, yet there was no such influence flowing from past returns of TAIEX to the current returns on NIKKEI index. Furthermore, the two stock markets are more sensitive to falling rather than rising trends of each other, implying that there is a mutual tendency between these markets to crash due to a retreat in the counterpart market. |
| Lv et al. [84] | GEM index china, daily return data over the period of January 2014 to June 2018 | DCC-MV-GARCH model, bivariate EGARCH model and VECM model | The network entropy indices increased in the period of the market crash. Equity market-trading activity and network entropy were informationally efficient in the long run and the more heterogeneous the stock network is, the higher market returns. |
4. Conclusions
Author Contributions
Funding
Conflicts of Interest
References
- Snyder, H. Literature review as a research methodology: An overview and guidelines. J. Bus. Res. 2019, 104, 333–339. [Google Scholar] [CrossRef]
- Harris, L. Trading and Exchanges: Market Microstructure for Practitioners; Oxford University Press: Hong Kong, China, 2003. [Google Scholar]
- Engle, R.F. Autoregressive conditional heteroskedasticity with estimates of the variance of U.K. Inflation. Economics 1982, 50, 987–1008. [Google Scholar] [CrossRef]
- Bollerslev, T. Generalized autoregressive conditional heteroskedasticity. J. Econ. 1986, 31, 307–327. [Google Scholar] [CrossRef] [Green Version]
- Nelson, D.B. Conditional heteroskedasticity in asset returns: A new approach. Economics 1991, 59, 347–370. [Google Scholar] [CrossRef]
- Leung, M.T.; Daouk, H.; Chen, A.S. Forecasting stock indices: A comparison of classification and level estimation models. Int. J. Forecast. 2000, 16, 173–190. [Google Scholar] [CrossRef]
- Bhowmik, R.; Wu, C.; Kumar, J.R.; Wang, S. A study on the volatility of the Bangladesh stock market—Based on GARCH type models. J. Syst. Sci. Inf. 2017, 5, 193–215. [Google Scholar]
- Yao, J.; Tan, C.L. A case study on using neural networks to perform technical forecasting of forex. Neurocomputing 2000, 34, 79–98. [Google Scholar] [CrossRef] [Green Version]
- Hussain, S.; Murthy, K.V.B.; Singh, A.K. Stock market volatility: A review of the empirical literature. IUJ J. Manag. 2019, 7, 96–105. [Google Scholar]
- Dhanaiah, G.; Prasad, S.R. Volatility and co-movement models: A literature review and synthesis. Int. J. Eng. Manag. Res. 2017, 7, 1–25. [Google Scholar]
- Reddy, Y.V.; Narayan, P. Literature on stock returns: A content analysis. Amity J. Financ. 2016, 1, 194–207. [Google Scholar]
- Mamtha, D.; Srinivasan, K.S. Stock market volatility: Conceptual perspective through literature survey. Mediterr. J. Soc. Sci. 2016, 7, 208–212. [Google Scholar] [CrossRef] [Green Version]
- Scott, L.O. Financial market volatility: A survey. Staff Pap. Int. Monet. Fund 1991, 38, 582–625. [Google Scholar] [CrossRef]
- Easterby-Smith, M.; Thorpe, R.; Jackson, P. Management and Business Research; Sage: Thousand Oaks, CA, USA, 2015. [Google Scholar]
- Tranfield, D.; Denyer, D.; Smart, P. Towards a methodology for developing evidence-informed management knowledge by means of systematic review. Br. J. Manag. 2003, 14, 207–222. [Google Scholar] [CrossRef]
- Geissdoerfer, M.; Savaget, P.; Bocken, N.M.P.; Hultink, E.J. The circular economy—A new sustainability paradigm? J. Clean. Prod. 2017, 143, 757–768. [Google Scholar] [CrossRef] [Green Version]
- Hopp, W.J. Ten most influential papers of Management Science’s first fifty years. Manag. Sci. 2004, 50, 1763–1893. [Google Scholar] [CrossRef] [Green Version]
- Engle, R.F.; Ng, V.K. Measuring and testing the impact of news on volatility. J. Financ. 1993, 48, 1749–1778. [Google Scholar] [CrossRef]
- Engle, R.F.; Bollerslev, T. Modelling the persistence of conditional variances. Econ. Rev. 1986, 5, 1–50. [Google Scholar] [CrossRef]
- Engle, R.F.; Lilien, D.; Robins, R. Estimating time varying risk premia in the term structure: The ARCH-M model. Economics 1987, 55, 391–408. [Google Scholar] [CrossRef]
- Sentana, E. Quadratic ARCH models. Rev. Econ. Stud. 1995, 62, 639–661. [Google Scholar] [CrossRef]
- Glosten, L.; Jagannathan, R.; Runkle, D. Relationship between the expected value and the volatility of the nominal excess return on stocks. J. Financ. 1993, 48, 1779–1801. [Google Scholar] [CrossRef]
- Zakoian, J.M. Threshold heteroskedastic models. J. Econ. Dyn. Control 1994, 18, 931–955. [Google Scholar] [CrossRef]
- Hentschel, L. All in the family: Nesting symmetric and asymmetric GARCH models. J. Financ. Econ. 1995, 39, 71–104. [Google Scholar] [CrossRef]
- Klüppelberg, C.; Lindner, A.; Maller, R. A continuous-time GARCH process driven by a Lévy process: Stationarity and second-order behaviour. J. Appl. Probab. 2004, 41, 601–622. [Google Scholar] [CrossRef] [Green Version]
- Pan, J.; Wang, H.; Tong, H. Estimation and tests for power-transformed and threshold GARCH models. J. Econ. 2008, 142, 352–378. [Google Scholar] [CrossRef] [Green Version]
- Alberg, D.; Shalit, H.; Yosef, R. Estimating stock market volatility using asymmetric GARCH models. App. Financ. Econ. 2008, 18, 1201–1208. [Google Scholar] [CrossRef] [Green Version]
- Olowe, R.A. Stock return volatility, global financial crisis and the monthly seasonal effect on the Nigerian stock exchange. Afr. Rev. Money Financ. Bank. 2009, 73–107. [Google Scholar]
- Girard, E.; Omran, M. On the relationship between trading volume and stock price volatility in CASE. Int. J. Manag. Financ. 2009, 5, 110–134. [Google Scholar] [CrossRef]
- Neokosmidis, I. Econometric Analysis of Realized Volatility: Evidence of Financial Crisis. 2009, pp. 1–22. Available online: http://www.lse.ac.uk/europeanInstitute/research/hellenicObservatory/pdf/4th_%20Symposium/PAPERS_PPS/APPLIED_ECONOMICS/NEOKOSMIDIS.pdf (accessed on 12 January 2020).
- Tripathy, T.; Gil-Alana, L.A. Suitability of volatility models for forecasting stock market returns: A study on the Indian National Stock Exchange. Am. J. Appl. Sci. 2010, 7, 1487–1494. [Google Scholar]
- Liu, H.C.; Hung, J.C. Forecasting S&P-100 stock index volatility: The role of volatility asymmetry and distributional assumption in GARCH models. Expert Syst. Appl. 2010, 37, 4928–4934. [Google Scholar]
- Joshi, P. Modeling volatility in emerging stock markets of India and China. J. Q. Econ. 2010, 8, 86–94. [Google Scholar]
- Wong, A.; Cheung, K.Y. Measuring and visualizing the asymmetries in stock market volatility: Case of Hong Kong. Int. Res. J. Appl. Financ. 2011, 2, 1–26. [Google Scholar]
- Chang, C.H.; Cheng, H.I.; Huang, I.H.; Huang, H.H. Lead-lag relationship, volatility asymmetry, and overreaction phenomenon. Manag. Financ. 2011, 37, 47–71. [Google Scholar] [CrossRef]
- Koutmos, D. Time-varying behavior of stock prices, volatility dynamics and beta risk in industry sector indices of the Shanghai Stock Exchange. Account. Financ. Res. 2012, 1, 109–125. [Google Scholar] [CrossRef]
- Chen, X. Empirical Investigations into Stock Market Integration and Risk Monitoring of the Emerging Chinese Stock Markets; University of St Andrews: St Andrews, UK, 2012; pp. 1–314. Available online: https://research-repository.st-andrews.ac.uk/handle/10023/3208 (accessed on 25 January 2020).
- Abdalla, S.Z.S.; Suliman, Z. Modelling stock returns volatility: Empirical evidence from Saudi Stock Exchange. Int. Res. J. Financ. Econ. 2012, 85, 166–179. [Google Scholar]
- Maheshchandra, J.P. Long memory property in return and volatility: Evidence from the Indian stock markets. Asian J. Financ. Account. 2012, 4, 218–230. [Google Scholar] [CrossRef] [Green Version]
- Li, W.; Wang, S.S. Empirical studies of the effect of leverage industry characteristics. WSEAS Trans. Bus. Econ. 2013, 10, 306–315. [Google Scholar]
- Hou, A.J. Asymmetry effects of shocks in Chinese stock markets volatility: A generalized additive nonparametric approach. J. Int. Financ. Mark. Inst. Money 2013, 23, 12–32. [Google Scholar] [CrossRef]
- Purohit, H.; Chhatwal, H.; Puri, H. An empirical investigation of volatility of the stock market in India. Pac. Bus. Rev. Int. 2014, 7, 64–73. [Google Scholar]
- Shalini, A.P. An emperical study of volatility of sectoral indices (India). Indian Res. J. 2014, 1, 78–95. [Google Scholar]
- Ghorbel, A.; Attafi, Z. Dependence between stock markets of MENA countries after sub-prime crisis using bivariate extreme value theory. Int. J. Appl. Manag. Sci. 2014, 6, 343–364. [Google Scholar] [CrossRef]
- Gupta, R.K.; Jindal, N.; Gupta, A. Conditional volatility and stock market behavior in NSE. Int. J. Innov. Eng. Manag. 2014, 3, 16–20. [Google Scholar]
- Nadhem, S.; Samira, C.; Nejib, H. Forecasting returns on a stock market using Artificial Neural Networks and GARCH family models: Evidence of stock market S&P 500. Decis. Sci. Lett. 2015, 4, 203–210. [Google Scholar]
- Banumathy, K.; Azhagaiah, R. Modelling stock market volatility: Evidence from India. Managing global transitions. Int. Res. J. 2015, 13, 27–42. [Google Scholar]
- Okičić, J. An empirical analysis of stock returns and volatility: The case of stock markets from Central and Eastern Europe. South East Eur. J. Econ. Bus. 2015, 9, 7–15. [Google Scholar] [CrossRef] [Green Version]
- Lum, Y.C.; Islam, S.M.N. Time varying behavior of share returns in Australia: 1988–2004. Rev. Pac. Basin Financ. Mark. Policies 2016, 19, 1650004. [Google Scholar] [CrossRef]
- Jebran, K.; Iqbal, A. Examining volatility spillover between Asian countries’ stock markets. China Financ. Econ. Rev. 2016, 4, 1–13. [Google Scholar] [CrossRef] [Green Version]
- Yang, J.; Feng, Y.; Wang, H. Estimation of volatility of CSI 300 index based on regime switching PTTGARCH model. Xitong Gongcheng Lilun yu Shijian/Sys. Eng. Theory Prac. 2016, 36, 2205–2215. [Google Scholar]
- Varughese, A.; Mathew, T. Asymmetric volatility of the Indian stock market and foreign portfolio investments: An empirical study. Indian J. Financ. 2017, 11, 36–49. [Google Scholar] [CrossRef]
- Pati, P.C.; Barai, P.; Rajib, P. Forecasting stock market volatility and information content of implied volatility index. Appl. Econ. 2017, 50, 2552–2568. [Google Scholar] [CrossRef]
- Pele, D.T.; Lazar, E.; Dufour, A. Information entropy and measures of market risk. Entropy 2017, 19, 226. [Google Scholar] [CrossRef] [Green Version]
- Bhowmik, R.; Ghulam, A.; Wang, S. Return and volatility spillovers effects: Study of Asian emerging stock markets. J. Syst. Sci. Inf. 2018, 6, 97–119. [Google Scholar]
- Kim, M.; Lee, S. Test for tail index constancy of GARCH innovations based on conditional volatility. Ann. Inst. Stat. Math. 2018, 71, 947–981. [Google Scholar] [CrossRef]
- Amudha, R.; Muthukamu, M. Modeling symmetric and asymmetric volatility in the Indian stock market. Indian J. Financ. 2018, 12, 23–36. [Google Scholar] [CrossRef]
- Chronopoulos, D.K.; Papadimitriou, F.I.; Vlastakis, N. Information demand and stock return predictability. J. Int. Money Financ. 2018, 80, 59–74. [Google Scholar] [CrossRef] [Green Version]
- Bhowmik, R.; Wang, S. An investigation of return and volatility linkages among stock markets: A study of emerging Asian and selected developed countries. J. Int. Trad. Com. 2018, 14, 1–29. [Google Scholar] [CrossRef]
- Kapusuzoglu, A.; Ceylan, N.B. Trading volume, volatility and GARCH effects in Borsa Istanbul. In Strategic Design and Innovative Thinking in Business Operations; Springer: Cham, Switzerland, 2018; pp. 333–347. [Google Scholar]
- Wang, Y.C.; Tsai, J.J.; Li, X. What drives China’s 2015 stock market Surges and Turmoil? Asian Pac. J. Financ. Stud. 2019, 48, 410–436. [Google Scholar] [CrossRef]
- Shanthi, A.; Thamilselvan, R. Univariate GARCH models applied to the bombay stock exchange and national stock exchange stock indices. Int. J. Manag. Bus. Res. 2019, 9, 22–33. [Google Scholar]
- Bhowmik, R.; Wang, S. Is the emerging Asian stock markets really predictable- based on the Operations and Information Management. Int. J. Supply Chain Manag. 2019, 8, 600–621. [Google Scholar]
- Dixit, J.; Agrawal, V. Foresight for stock market volatility: A study in the Indian perspective. Foresight 2019, 22, 1–13. [Google Scholar] [CrossRef]
- Kumar, A.; Biswal, S.K. Impulsive clustering and leverage effect of emerging stock market with special reference to Brazil, India, Indonesia, and Pakistan. J. Adv. Res. Dyn. Control Syst. 2019, 11, 33–37. [Google Scholar] [CrossRef]
- Bollerslev, T.; Engle, R.F.; Wooldridge, J.M. A capital asset pricing model with time-varying covariances. J. Politic Econ. 1988, 96, 116–131. [Google Scholar] [CrossRef]
- Baba, Y.; Engle, R.F.; Kraft, D.F.; Kroner, K.F. Multivariate Simultaneous Generalized ARCH. Manuscript; University of California, Department of Economics: San Diego, CA, USA, 1990. [Google Scholar]
- Bollerslev, T. Modeling the coherence in short-run nominal exchange rates: A multivariate generalized ARCH model. Rev. Econ. Stat. 1990, 72, 498–505. [Google Scholar] [CrossRef]
- Engle, R.F. Dynamic conditional correlation—A simple class of multivariate GARCH models. J. Bus. Econ. Stat. 2002, 20, 339–350. [Google Scholar] [CrossRef]
- Alexander, C.O.; Chibumba, A. Multivariate Orthogonal Factor GARCH; University of Sussex Discussion Papers in Mathematics: Brighton, UK, 1996. [Google Scholar]
- Alexander, C.O. Orthogonal methods for generating large positive semi-definite covariance matrices. ISMA Cent. Discuss. Pap. Financ. 2000. Available online: https://core.ac.uk/download/pdf/7056485.pdf (accessed on 3 February 2020). [CrossRef]
- Alexander, C.O. (Ed.) Orthogonal GARCH in C.O. In Mastering Risk; Financial Times Prentice Hall: London, UK, 2001; Volume 2, pp. 21–38. [Google Scholar]
- Bauwens, L.; Laurent, S.; Rombouts, J.V.K. Multivariate GARCH models: A survey. J. Appl. Econ. 2006, 21, 79–109. [Google Scholar] [CrossRef] [Green Version]
- Singh, P.; Kumar, B.; Pandey, A. Price and Volatility Spillovers across North American, European and Asian Stock Markets: With Special Focus on Indian Stock Marke; Indian Institute of Management Ahmedabad: Ahmedabad, India, 2008; pp. 1–45. Available online: http://vslir.iima.ac.in:8080/jspui/handle/11718/17115 (accessed on 15 January 2020).
- Rao, A. Analysis of volatility persistence in Middle East emerging equity markets. Stud. Econ. Financ. 2008, 25, 93–111. [Google Scholar] [CrossRef]
- Maniya, R.S.; Magnusson, F. Bear Periods Amplify Correlation: A GARCH BEKK Approach. rapport nr., Master Degree Project, University of Gothenburg, Gothenburg, Sweden, 2010; pp. 1–55. Available online: https://gupea.ub.gu.se/bitstream/2077/22675/1/gupea_2077_22675_1.pdf (accessed on 12 November 2019).
- Princ, M. Relationship between Czech and European Developed Stock Markets: DCC MVGARCH Analysis; Working Papers IES; Charles University Prague, Faculty of Social Sciences, Institute of Economic Studies: Prague, Czech, September 2010; pp. 1–35. [Google Scholar]
- Yong, F.T.; Holmes, M.; Choi, D. Volatility transmission and asymmetric linkages between the stock and foreign exchange markets: A sectoral analysis. Stud. Econ. Financ. 2011, 28, 36–50. [Google Scholar] [CrossRef]
- Athukoralalage, K.P.I. Modelling Australian Stock Market Volatility. 2011, pp. 1–161. Available online: https://ro.uow.edu.au/cgi/viewcontent.cgi?referer=https://scholar.google.com/&httpsredir=1&article=4435&context=theses (accessed on 5 October 2019).
- Kouki, I.; Harrathi, N.; Haque, M. A volatility spillover among sector index of international stock markets. J. Money Invest. Bank. 2011, 22, 32–45. [Google Scholar]
- Walid, C.; Chaker, A.; Masood, O.; Fry, J. Stock market volatility and exchange rates in emerging countries: A Markov-state switching approach. Emerg. Mark. Rev. 2011, 12, 272–292. [Google Scholar] [CrossRef]
- Katzke, N. South African Sector Return Correlations: Using DCC and ADCC Multivariate GARCH Techniques to Uncover the Underlying Dynamics; Stellenbosch Economic Working Papers: 17/13; University of Stellenbosch: Stellenbosch, South Africa, 2013; pp. 1–31. [Google Scholar]
- Peng, C.L.; Chung, C.F.; Tsai, C.C.; Wang, C.T. Exploring the returns and volatility spillover effect in Taiwan and Japan stock markets. Asian Econ. Financ. Rev. 2017, 7, 175–187. [Google Scholar] [CrossRef] [Green Version]
- Lv, Q.; Han, L.; Wan, Y.; Yin, L. Stock net Entropy: Evidence from the Chinese growth enterprise market. Entropy 2018, 20, 805. [Google Scholar] [CrossRef] [Green Version]
- Matei, M.; Rovira, X.; Agell, N. Bivariate volatility modeling with high-frequency data. Economics 2019, 7, 41. [Google Scholar] [CrossRef] [Green Version]

| Search String | Search Field | Number of Non-Exclusive Results | ||
|---|---|---|---|---|
| Scopus | Web-of-Science | Last Updated | ||
| Market Return | Title/Article title | 1540 | 1148 | 17 January 2020 |
| Market volatility | Topic/Article title, Abstract, Keywords | 13,892 | 13,767 | 17 January 2020 |
| Stock market return | Topic/Article title, Abstract, Keywords | 11,567 | 13,440 | 17 January 2020 |
| Stock market volatility | Topic/Article title, Abstract, Keywords | 5683 | 6853 | 17 January 2020 |
| Market return and volatility | Topic/Article title, Abstract, Keywords | 3241 | 6632 | 17 January 2020 |
| GARCH family model* for stock return | Topic/Article title, Abstract, Keywords | 53 | 41 | 17 January 2020 |
| Forecasting stock return and GARCH model* | Topic/Article title, Abstract, Keywords | 227 | 349 | 17 January 2020 |
| Financial market return and volatility | Topic/Article title, Abstract, Keywords | 2212 | 2638 | 17 January 2020 |
| Affiliation Criteria | Rational Explanation |
|---|---|
| Abstract must express the stock market and GARCH model as the sharp object of this research work. | Since this kind of research is not restricted to any journals, research on other subjects than stock market maybe appears. |
| Abstract must show clear indication of stock market volatility and return studies through GARCH model robustness. | The focus of the research is to study stock market return and volatility analysis by GARCH family model. |
| Research paper must be written in English language. | English language is the leading research language in the arena of finance. |
© 2020 by the authors. Licensee MDPI, Basel, Switzerland. This article is an open access article distributed under the terms and conditions of the Creative Commons Attribution (CC BY) license (http://creativecommons.org/licenses/by/4.0/).
Share and Cite
Bhowmik, R.; Wang, S. Stock Market Volatility and Return Analysis: A Systematic Literature Review. Entropy 2020, 22, 522. https://doi.org/10.3390/e22050522
Bhowmik R, Wang S. Stock Market Volatility and Return Analysis: A Systematic Literature Review. Entropy. 2020; 22(5):522. https://doi.org/10.3390/e22050522
Chicago/Turabian StyleBhowmik, Roni, and Shouyang Wang. 2020. "Stock Market Volatility and Return Analysis: A Systematic Literature Review" Entropy 22, no. 5: 522. https://doi.org/10.3390/e22050522