Article

Empowering Digital Marketing with Interactive Virtual Reality (IVR) in Interior Design: Effects on Customer Satisfaction and Behaviour Intention

1
Department of Industrial and Systems Engineering, The Hong Kong Polytechnic University, Hong Kong, China
2
Faculty of Business, City University of Macau, Macau, China
3
Division of Business and Hospitality Management, College of Professional and Continuing Education, The Hong Kong Polytechnic University, Hong Kong, China
*
Authors to whom correspondence should be addressed.
J. Theor. Appl. Electron. Commer. Res. 2023, 18(2), 889-907; https://doi.org/10.3390/jtaer18020046
Submission received: 12 March 2023 / Revised: 19 April 2023 / Accepted: 23 April 2023 / Published: 25 April 2023

Abstract

:
Interior design industries have evolved to adopt advanced digital and interactive virtual reality (IVR) technologies for promotion. Marketing using a platform with a virtual interior design feature is an approach that enables not only the building up of a positive image for an interior design firm but also allows customers to experience home design intuitively on the digital platform. This study researched the relationship between the three factors of aesthetics, ease of use, and information quality in digital marketing and consumer satisfaction. Data from 120 respondents were collected via the internet. The results generated from structural equation modelling indicated that the above factors positively influence customer satisfaction with a digital platform empowered with the IVR interior design. It was found that information quality has the most influence among the three factors. Despite numerous scholars having conducted in-depth research on digital marketing, existing research lacks a consumer perspective for examining what factors have the most significant impact on consumers. Moreover, relatively little work has been conducted to determine the customer’s perceptions towards the digital marketing approach using virtual interior design and its interactive features. A theoretical model for interactive virtual interior design features for digital marketing is thus proposed.

1. Introduction

Digitalisation has revolutionised the consumer marketplace over the past 20 years [1], and since the end of 2019, the COVID-19 outbreak has pushed digitalisation to new highs. Due to the closure of stores and the cancellation of public events due to the COVID-19 epidemic, the popularity of digital marketing has further increased. Almost all companies are developing their channels to reach consumers digitally, and some are even devoting all of their marketing budgets to digital marketing [2].
Compared with traditional marketing, namely, radio, billboard, TV, and other printed media, digital marketing provides personalisation, instant tracking and control, and data analysis on the effectiveness of a campaign online [3], as well as digital payment [4]. Digital marketing refers to those marketing activities on the internet that provide knowledge to their potential customers by matching their needs [5]. It is the projection of conventional marketing, tools, and strategies on the internet [6]. With the explosive growth of internet users, digital marketing has developed a wide variety of channels for companies to engage with various consumers. New applets and sub-channels on the market, such as Tik Tok (short video platform) and Bilibili (animation, comics, and the game content community), have become widely popular [2]. Live streaming platforms are also becoming more and more integrated into people’s lives.
Among various industries, marketing for interior design firms is not easy because designers are required to understand the individual preferences of customers face-to-face in order to demonstrate the design concepts. On the other hand, customers looking for interior design usually prefer to visualize the design ideas. As such, most conventional interior design firms adopt traditional brick-and-mortar stores to acquire and retain customers [7]. In the digital era, artificial intelligence (AI), virtual reality (VR), and other related technologies enabled online platforms to demonstrate ideas intuitively and visualize the design interactively. A platform with interactive virtual reality (IVR) features in interior design is an approach that enables designers to illustrate design concepts and ideas to customers, but customers can also experience the design intuitively [8]. In addition, they can change the design concepts such as colour, position, decoration, etc., and visualize the effects immediately on the digital platform. VR is a technology to provide enhanced immersive and interactive digital experiences in real-world settings. It allows digital content to be visualized on the online platform and creates a virtual being to influence the digital marketing strategy. With the virtual interior design features on the online platform, interior design firms can build a positive image with customers and promote a new way of digital marketing. Therefore, it is valuable to further investigate how the digital platform can empower existing digital marketing in the industry.
Most of the existing research on digital marketing is from the company’s perspective, examining how companies can improve their digital marketing capabilities to attract consumers [9,10,11,12], but very little research has investigated the consumer’s perspective. Tang et al. [13] investigated the use of an Internet-of-Things (IoT)-based information system in Logistics 4.0. The paper’s new and significant information was to examine the aspects of the digital information system in customer satisfaction. Certain organisations believe digital marketing is only applicable to B2C organisations [14]. However, the digital marketing success stories of companies such as Cisco and IBM have found that digital marketing can work well in B2B companies [15]. Content in digital marketing plays an important role in supporting consumer decisions [16,17].
Through a practical survey of the interior design industry, we studied consumers’ perspectives to determine which factors are most valued by the consumer in the company’s digital marketing activities with IVR. The findings show that the factors affecting consumer purchase of products and use in digital marketing mainly include the aesthetics of digital marketing, the ease of use of digital marketing platforms, and the quality of digital marketing. Among them, quality is the most important to consumers. This article contributes not only to the investigation of customer satisfaction but also to the investigation of how IVR can affect consumer behaviour towards interior design companies. To the best of the authors’ knowledge, the adoption of digital marketing with IVR to measure customers’ behaviour intention and satisfaction in the interior design industry is under-researched. In addition, this study attempts to enlarge the integrated two common behaviour/intention models of technology, the acceptance model (TAM) and the theory of planned behaviour (TPB), by considering the impact of COVID-19 relevant to the change in customers’ perception and behaviour in interior design. The illustration of digital marketing can truly reflect how technology determines the customers’ behaviour toward IVR in interior design. In particular, we employ technology that produces a positive effect on the attitudes of users concerning the ease of using technology. Such an impact will eventually be indicated in perceived technology advantages and favourable post-COVID-19 attitudes of users’ inclination in using technology. In general, the revised model is the ‘optimal’ model to identify customer behaviour compared to TAM and TPB separately. As such, this study argues that TPB and TAM theories may be fostered in constructing a theoretical framework of IVR in interior design. The combination is credible for improving the scope of knowledge in this discipline, as well as employing the structural equation modelling (SEM) approach to analysis [18]. The current study is vital not only to technology researchers but also to the interior design community, as it enables researchers to understand the key changes in the attitude of customers concerning technology in the post-COVID-19 context and give recommendations to their future research areas and the design of interior design business strategies to exploit such changes [19].

2. Literature Review

2.1. Customer Perception

Perception is the function of the brain in the human body that makes an approximation of reality, a static process of capturing knowledge about the environment and interpreting this external signal according to one’s own needs, desires, and attitudes. Perception is a personal subjective description of an encountered experience. Scholars are more interested in understanding user experience [20], as it is seen as a broader concept than user satisfaction.
Perception theory begins with simple perception, the time we become aware of stimulus through our senses. When people perceive something, they respond with intuition or judgment. The longer the time a customer spends browsing, the higher the possibility he/she will buy; thus, customer centric innovation is important in product design and development [21]. Marketers should strive to improve their experience and provide the right perception [22].
Consumer perception, which is one of the research objects in the field of consumer behaviour, is presented as one of the individual factors determining customer behaviour [23]. Stimulus acceptance and adaptation influencing customer attitude, opinions, and motives eventually affect customer behaviour, whereas perception is one of the main personal factors conditioning behaviour and other variables [24].
Customer perception can be defined as “a process during which an individual acquires knowledge about the environment and interprets the information according to his/her needs, requirements, and attitudes” [25], coining the concept of perceptual filter theory: when a customer encounters a stimulus, it will be filtered, sorted, and modified, and eventually stored in the customer’s memory. Crane et al. [25] believe that humans cannot perceive all stimuli in a sensation phase. In addition, they cannot respond to all stimuli simultaneously nor can they understand the meaning of the stimulus correctly when interpreting the stimulus, and they end up not being able to remember all of the triggers.
Similarly, Boksberger et al. [26] defined customer perception in marketing as “customer’s impression, awareness, or consciousness about a company or its offerings”. The customer perception process begins with the consumer accessing information about a particular product or service, and the process continues until the customer starts making decisions. Everything a company does affects the perception of its customers [22]. A comparative analysis was conducted by [27] to investigate intentions towards IVR adoption.
There are two main schools of thought about customer perception [28]. Organizations can define their targeted customers or define the product image and brand and change customer perception as a personal choice. Thus, to impress customers, the marketer should utilize the power of advertising, customer reviews, public relations, social media, and personal experiences [26].
During the pandemic, the digital customer segment has rapidly increased. The customers, who stay home and keep social distance, depend mainly on digital devices and company websites, which in turn become their gateway to the companies. Everything and anything sent from a company website affects customer perception. A marketer needs to figure out an appropriate digital marketing framework that can impress those internet users who collect information about a product via the website [28].

2.2. Digital Marketing

Digital marketing methods include search engine optimisation (SEO), search engine marketing (SEM), content marketing, influencer marketing, content automation, campaign marketing, data-driven marketing, e-commerce marketing, social media marketing, social media optimisation, direct email marketing, display advertising, e-books, CD-ROMs, and games [29]. The development of digital marketing now extends to non-internet channels that provide digital media, such as cell phones (SMS and MMS), callbacks, and cell phone ringtones. This extension for non-internet channels helps to distinguish digital marketing from online marketing [30].
For most businesses, digital marketing is focused on website marketing, content marketing, and social media marketing. Website marketing mainly uses search engine optimisation to increase the number of website views; content marketing involves a series of content that companies use to attract specific consumers; and social media marketing is the delivery of information to consumers through the popular social media of today. The purpose of all three approaches is for companies to connect with consumers through the internet as a medium. The difference, however, is that the three approaches differ in the channels they use and the consumer groups they target.
Most companies today have created their website for visiting [31]. Search engine optimisation (SEO) is a strategy to increase the website’s visibility in the search engine result. More traffic from free and organic search results can be obtained after using SEO [32]. Gaikwad et al. [33] have indicated that SEO is important in digital marketing and influences the positioning of the site in digital channels. It provides insight into the user’s behaviour [6], indicating that most internet users only consider the top few items in the search results.
Content marketing is a strategic marketing skill involving creating and distributing relevant and valuable content to attract, acquire, and retain a clearly defined and understood target audience intending to drive potential customers’ actions [34]. The content marketing campaign can be in many formats, such as text images, videos on blogging, podcasting, news, eBooks, and social media posts. The content is created to provide consumers with the information they seek [31].
Social media marketing (SMM), which refers to utilizing social networking websites as a marketing tool to deliver content to internet users, allows internet users to share their information in a social network [35], which helps a company to increase its brand awareness and broaden customer reach. The most well-known and regularly-used social media platforms in Hong Kong are Facebook, Twitter, LinkedIn, YouTube, and Instagram [36].

2.3. Consumer Behavior

The theory of reasonable action (TRA) is the most well-known theory used to demonstrate and explain the relationship between attitudes and behaviour in people’s actions. The TRA showed that attitudes and subjective norms are effective and are the main individual behaviour indexes. After the TRA model was launched, this theory found some limitations. The most significant limitation found was that people usually have little power to control their behaviour, even though they may be highly motivated by their attitudes and subjective norms. In 1991, Ajzen proposed the TPB, based on the “rational behaviour theory” created by Fishbein and Ajzen [37]. The main consideration of action is the intention of behaviour in accordance with TPB. TPB presumes that people tend to exhibit behaviour that they suppose they can control. In other words, behaviour with enough confidence in their ability to take action [38].
TPB has enhanced the limitation on TRA, with ‘perceived behavioural control’ added to balance the constraints. ‘Perceived behavioural control’ is defined as how the users perceive that they may limit their behaviour, including the degree of self-efficacy and controllability [39]. In the theory of planned behaviour, ‘intention’ is formed by the individual’s attitudes and subjective norms toward the behaviour and their perceptions about whether they can enact certain behaviour.
Recently, researchers used TPB to examine artificial intelligence. Mohr and Kuhl [40] identified personal attitudes and perceived behavioural control of people as the most crucial impacts of the acceptance of artificial intelligence. Sohn and Kwon [41] also highlighted that the TPB has been widely adopted in analyses of artificial intelligence such as games, learning systems, advertising systems, and healthcare systems. Further, Juliana et al. [42] identified that digital marketing performs a key role in consumer confidence in firm performance in the era of digital technology. In particular, Fazlollahtabar [43] highlighted that digital marketing mainly uses transaction records and customer data to improve the firm’s understanding of customer behaviour and their willingness to market. As such, digital marketing may bring a positive effect on customer engagement in transformative value co-creation [44].

3. Theoretical Model and Hypothesis

3.1. Perceived Digital Marketing Aesthetics

Perceived digital marketing aesthetics refers to the users’ perceived impression of an online platform [45]. The colour, fonts, image, graphics used, and layout design of the platform, illustration of products, and complexity of display influence the beauty of the platform. Online platform design has no second chance after the first impression, which is one of the considerations when assessing the platform’s attractiveness [46,47,48]. Regarding the WebQualTM model and the D&M IS success model, visual appeal is one of the dimensions in evaluating perceived online service quality and satisfaction [49]. The online platform’s design influences consumer emotional responses, attitudes, and purchase intention in e-commerce [50,51]. As such, the following hypothesis is taken:
H1. 
The perceived aesthetics of digital marketing have a positive influence on customer satisfaction.

3.2. Perceived Ease of Use

Perceived ease of use was first proposed in Davis’s [52] original TAM, as explained in the section above. Huang et al. [53] reported that the TAM generates a theoretical grounding to elaborate on VR user behaviour and experiences. Nevertheless, the TAM lacks an understanding of VR applications in the interior design industry. Further, Chi et al. [54] pointed out that trust in interaction with VR is a remarkable higher-order construct that affects the intention of use. Ease of use can also be found in Loiacono’s four dimensions of platform quality, defined as the ease of understanding. Different terms are also used to reflect ease of use; for example, user-friendly, navigability, site organisation, and usability [55]. Therefore, the following hypothesis is proposed:
H2. 
The perceived ease of use of the digital marketing platform has a positive influence on customer satisfaction.

3.3. Perceived Information Quality

Information quality refers to the amount, accuracy, and information about the products and services offered in digital marketing [56]. There are some similar terms used to measure information quality, including currency, ease of understanding, accuracy, usefulness, completeness, and relevance [57,58,59]. Promoting the information and value of a product or service to a potential customer is the purpose of digital marketing. Further, digital marketing information quality was found to be an important factor affecting customer behaviour. Digital marketing can provide consumers with product information through more convenient channels, attracting consumers’ attention and retaining customers. Similarly, the higher the perceived information quality, the higher the user’s satisfaction [58,60]. Based on this finding, a hypothesis is proposed:
H3. 
The perceived information quality of digital marketing has a positive influence on customer satisfaction.

3.4. Customer Satisfaction

Customer satisfaction refers to the emotional status of one individual and is an important marketing concept [61]. Customer satisfaction is an outcome variable of service quality, and it is a significant driver for continued purchase intention. With the emergence of the internet, there have been many research studies on customer satisfaction regarding the e-commerce environment [62]. Satisfied customers will positively affect the online platform and motivate behavioural intentions. Therefore, it is important to determine how to fulfil customer satisfaction through the internet [63]. According to the TRA model, an individual’s behavioural intention is motivated by their beliefs. At the same time, DeLone and McLean [64] have suggested that one system’s information, service, and system quality influence the user’s satisfaction, affecting behavioural intention. User satisfaction refers to individuals’ reactions to the use of information or computer technology. In this paper, customer satisfaction is defined as an individual’s attitude towards the digital marketing quality, whether the user is satisfied, motivating them for behavioural intention such as contacting the company or purchasing the products. A hypothesis is proposed:
H4. 
Customer satisfaction with digital marketing has a positive influence on behavioural intention.

3.5. Behavioral Intention

Behavioural intention is used to describe the attitude and psychology related to a consumer’s behaviour in many theories: for example, the TPB and TRA models which we have discussed before. Behavioural intention is an antecedent of actual behaviour [65] and indicates that individual behaviour can be predicted through behavioural intentions. In other words, a customer purchases a product based on his/her purchase intention. Therefore, marketers value the behavioural intention of the customer. The factors influencing the behavioural intention of a customer can be classified into attitude and subject norms. This means having a good attitude and subject norms positively influence behavioural intention [66].
In this study, the relationship between digital marketing quality and behavioural intention was investigated. Many studies have been conducted to prove that quality is an important factor to support consumer decisions [56,67], but there is a lack of research to detect which factors in digital marketing are of the most concern to consumers from their perspective. Therefore, a hypothesis model is built to identify the factors influencing the customers’ behavioural intention in digital marketing (Figure 1).

4. Methodology

4.1. Sample Selection

In this study, we collected a sample with the support of a virtual interior design platform in the interior design industry in Hong Kong for digital marketing and collected relevant data to analyse the impact of digital marketing on consumer intention. In Hong Kong, only 40% of interior designers have a website [68]. However, there were almost 22 million results from the search result of ‘interior designer Hong Kong’ in Google. There are too many marketing websites related to the interior design industry in Hong Kong. Many consumers in Hong Kong are involved in the interior design industry. The authors used the virtual-interior-design-empowered platform as a study of digital marketing in consumer intent.

4.2. Questionnaire Development

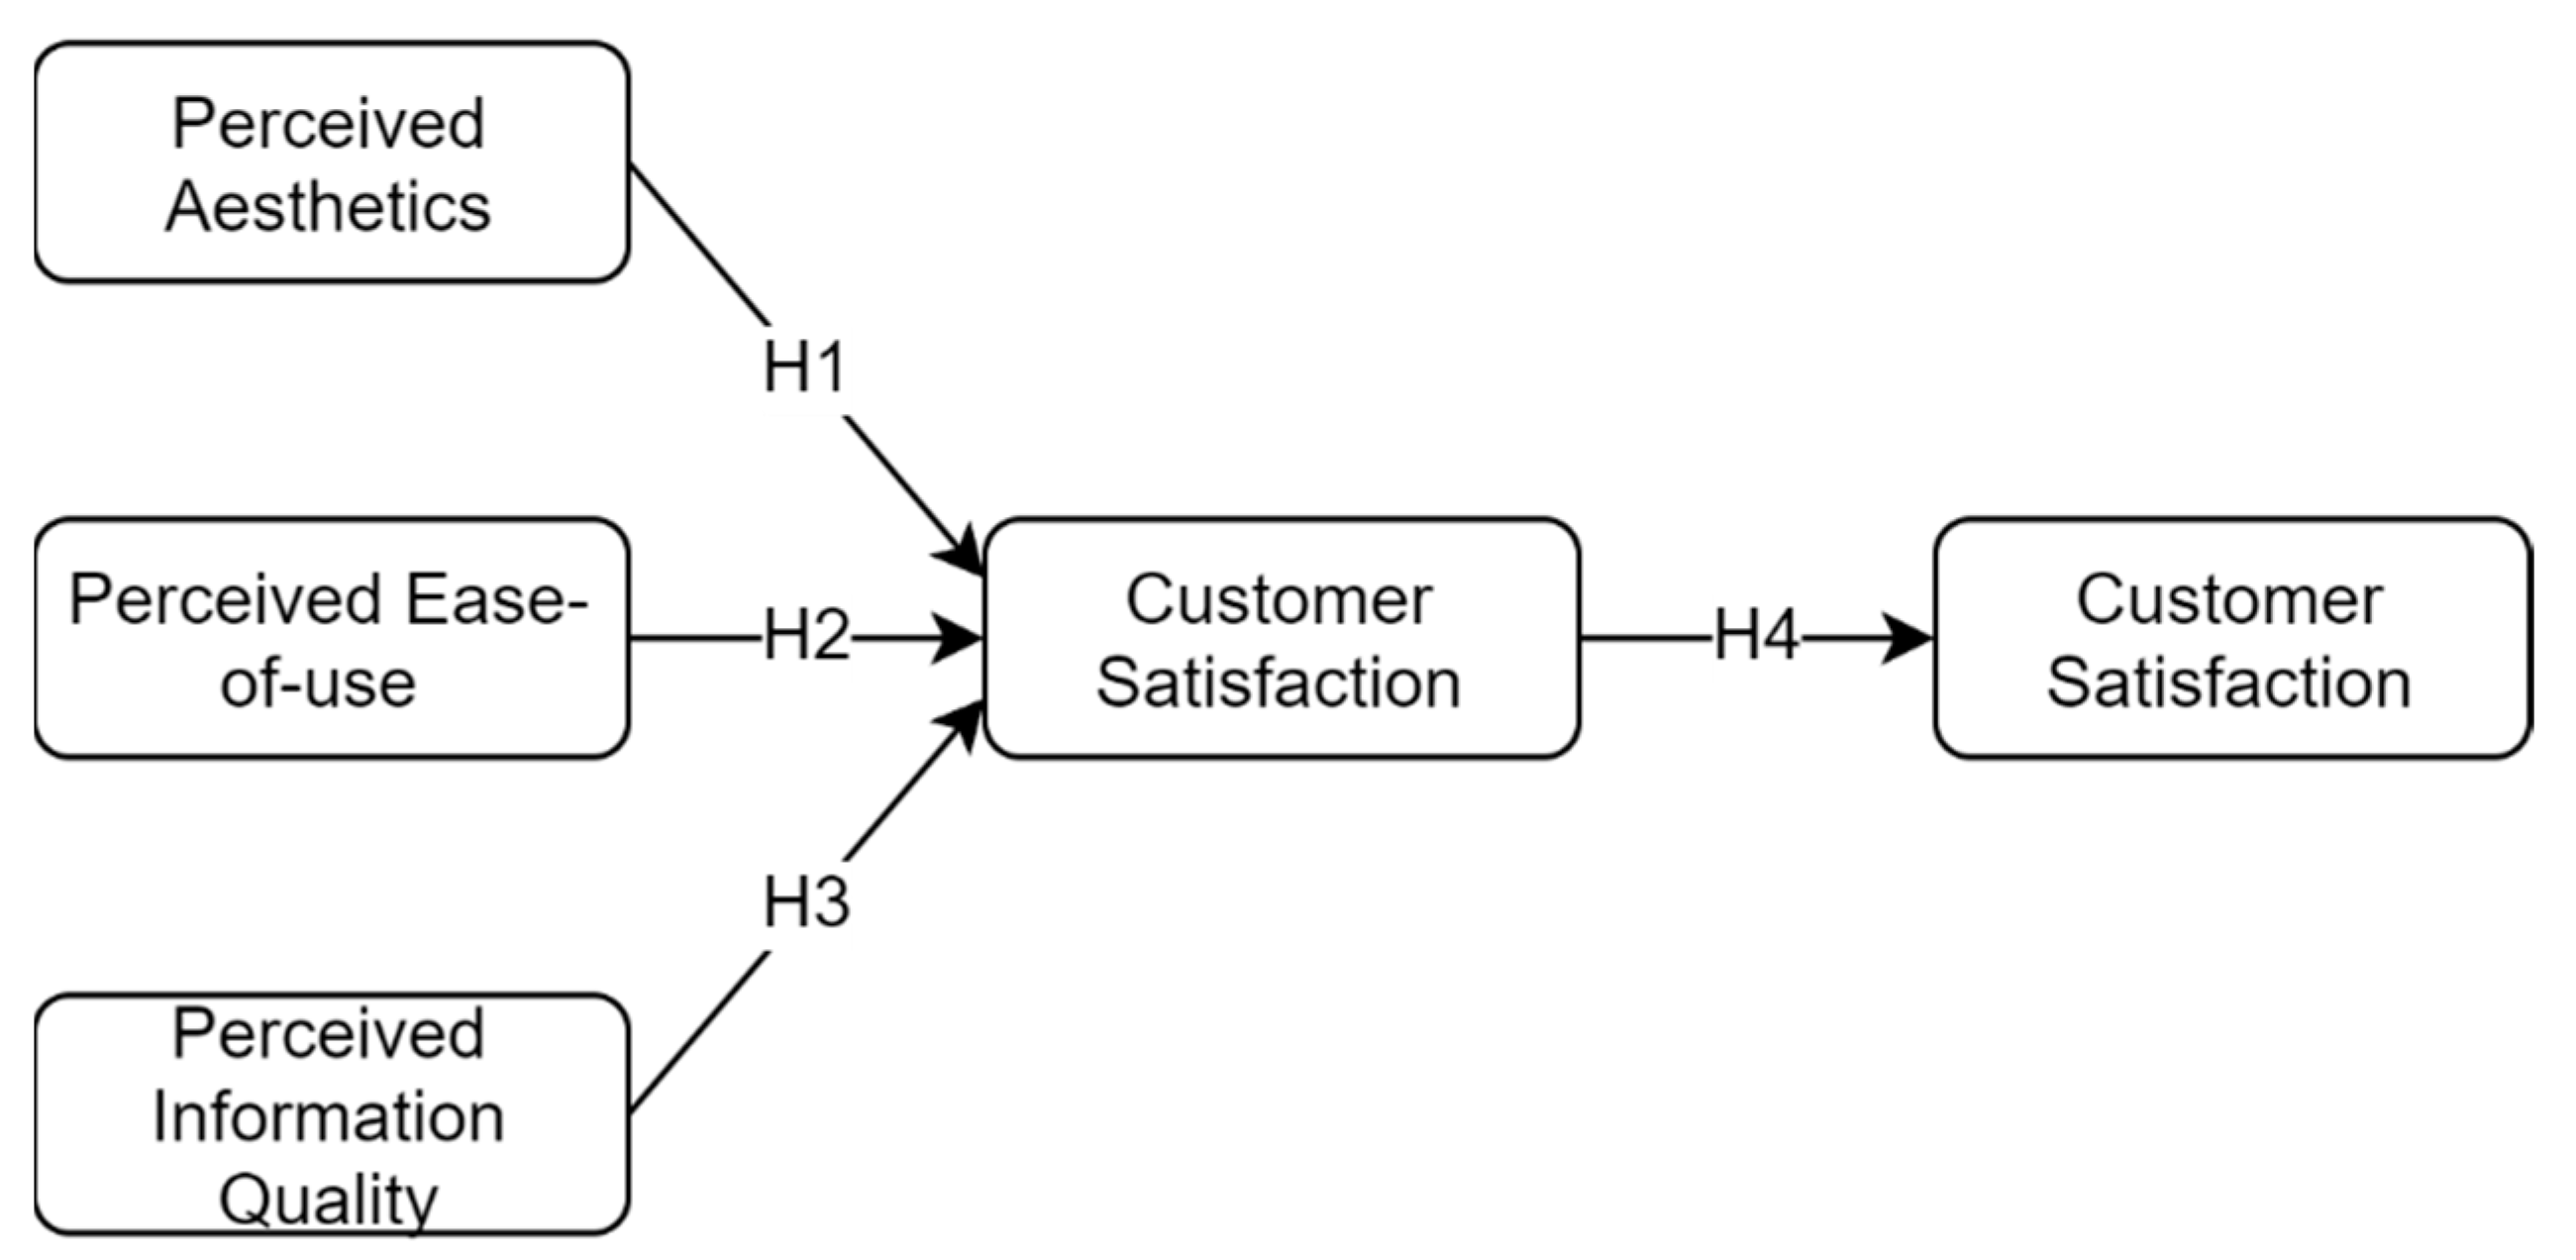
In this paper, a questionnaire survey was used as a research instrument. The questionnaire was constructed in parts. Firstly, the interviewee was invited to visit the virtual interior design platform through the given hyperlink where entry questions illustrated that the interviewee had visited the platform and understood the assumptions they must make before conducting the questionnaire. The assumption of the interviewee was ‘I am looking for an interior design service’. The second section consisted of five variables regarding the hypothesis model suggested above, including (1) perceived platform aesthetics, (2) perceived ease of use, (3) perceived information quality, (4) customer satisfaction, and (5) behavioural intention. Definition and measurement items for all variables are discussed later. The third section contained three reference questions, (1) whether they are currently looking for/interested in an interior service, (2) did they look for/hire an interior design service in the past 12 months, and (3) what channels would they prefer to choose when finding an interior design company. The last section of the questionnaire concerned demographic information.

4.3. Sample Size and Data Collection

An online survey method was used in this research. Using an online survey was more convenient because the interviewee was invited to visit the platform before answering the questions. The survey was launched on various social media platforms, a Facebook page and Instagram, and online forums and discussions. According to Kotrlik et al. [69], a sample size of approximately 120 is suitable for estimating the actual population with a margin of error of 5% and a confidence level of 95%.

4.4. Definition and Measurement of Study Variables

Regarding the hypothesis model suggested in this study, the definition and measurement items for the five variables perceived website aesthetics (PWA), perceived ease of use (PEOU), perceived information quality (PIQ), customer satisfaction (CS), and behavioural intention (BI) were developed based on previous studies and are summarized in Table 1.
In this study, platform marketing aesthetics refers to the degree to which interior design platforms give a good impression by using proper colour, fonts, and images on the platform. A visually attractive platform can influence the customer’s intention. Therefore, when browsing a platform, including an interior design website, its visual appeal attracts internet users. There were a total of 6 measurements item on platform marketing aesthetics. Ease of use can be concentrated into two parts: ease of navigation and finding the information needed. Six measurement items were modified from previous studies. Drawing on previous definitions, information quality was redefined as the extent to which interior design website marketing was regarded as a good source of information. The information provided is accurate, detailed, and not fake in this study. There are 6 measurement items of information quality in interior design companies based on three sources. The definition of customer satisfaction refers to an outcome variable of the interior design platform quality, whether the users are satisfied with the platform to motivate them for behavioural intention such as contacting the company or purchasing the service. The customer satisfaction measurement uses similar questions as Wei et al. and modifies them to fit this study. In this study, the platform’s purpose is to attract customers to purchase services. Therefore, the behavioural intention would be defined as how likely it is that the customer uses the website empowered by the virtual interior design features for the information again and chooses this company for interior design services.
Respondents were asked to rate on a 7-point Likert scale (1 = strongly disagree, 2 = disagree, 3 = slightly, 4 = neutral, 5 = slightly agree, 6 = agree, 7 = strongly agree). The 7-point Likert-type scale is designed to obtain more accurate data, making the data more reliable.

5. Data Analysis on Questionnaire

5.1. Data Analysis Tools

We first used Google Forms to generate and collate the questionnaire online and then used SPSS Statistics 25.0 to analyse descriptive information obtained from the sample and check its reliability. Last, using IBM SPSS AMOS, users can obtain the data to support their research model and theories.

5.2. Reliability and Validity

Reliability and convergent validity were measured via Cronbach’s alpha (α), composite reliability (CR), average variance extracted (AVE), and the standardised factor loading of the measurement items. For the standardised factor loading of each measurement, the acceptance level should be above 0.700 [80]. Cronbach’s alpha (α) is an internal consistency technique to test the consistency of the respondent’s answers to all the items in the measurement in this study. Alpha values should be in the range of 0.7 to 0.8, which is considered as valid, while values above 0.9 reflect exceptional internal consistency [81].
Convergent validity can be measured by composite reliability (CR) and average variance extracted (AVE). The difference between α and CR would be the constraint in loadings. The construct loadings for CR are allowed to vary, while the loadings or weights for Cronbach’s alpha are always constrained to be equal. A value for CR at or above 0.8 is considered acceptable. The average variance extracted (AVE) should exceed 0.5 to be considered acceptable. The criteria of reliability and validity using various approaches are illustrated in Table 2 [80,81].
The formula of CR:
CR = λ i 2 λ i 2 + ϵ i
The formula of AVE:
AVE = Σ i = 1 κ λ i 2 i = 1 κ λ i 2 + i = 1 κ V a r e i
  • k = number of items
  • λi = factor loading of item i
  • 1−λi = variance of the error of item i
Structural equation modelling (SEM) is a statistical methodology widely used to develop and test theories in studies related to human behaviour, marketing, and economics [82]. There are two steps in SEM: examining a measurement model and examining a structural model [83].
In order to determine the measurement model fitness, certain model fit indices were focused on in this project to determine the hypothesis model’s fitness by the degree of data fitness. In this study, the Chi-square statistic (χ2) was used to assess the measurement model fit. However, only assessing χ2 is not adequate for empirical research [84]. Therefore, χ2/df was also considered, and its acceptable value should be below 3 [85] (note: df = degree of freedom). The details are summarized in Table 3.

6. Results

6.1. Descriptive Statistics

The questionnaire was launched from April to May 2020. The duration of collecting data was around one month. In total, 147 responses were collected. After eliminating 27 participants who were not living in Hong Kong, 120 responses were used for further analysis. The valid response rate was around 81.63%. The descriptive statistics is provided in Table 4.
In the third part of the questionnaire, three reference questions were asked. The first two questions were about the current and past status of looking for an interior design company. The results are shown in Table 5.

6.2. Model Validation

In the beginning, we conducted a series of descriptive statistics of measurement items. The results are exhibited in Table 6. Confirmatory factor analysis (CFA) was used to determine the hypothesis model’s fitness by the degree of data fitness. The reliability and convergent validity were examined to determine the validity of the reflective constructs. As mentioned in the last chapter, Cronbach’s alpha (α), composite reliability (CR), average variance extracted (AVE), and the standardised factor loading of the measurement items were utilised to check the data’s reliability and convergent validity.
As represented in Table 7, the measurement model’s CR values varied between 0.804 to 0.937, which exceeded the recommended cut-off at 0.70, while the AVE values exceeded the acceptable level of 0.50 [86]. The CR and AVE values indicated that the measurement model had convergent validity. Cronbach’s alpha (α) in the measurement model ranged from 0.883 to 0.935, much higher than the acceptable level of 0.70 [81]. The data obtained reflected an exceptional internal consistency and were reliable enough. For standardised factor loading, the suggested score should be greater than 0.70, as mentioned in the last chapter [70]. Regarding the results table, only one measurement item had a standardised factor loading below 0.70, PEOU1 (0.683). According to several studies, a standardised factor loading above 0.6 is still acceptable for sample sizes below 200 [80,87]. Therefore, PEOU1 with a standardised factor loading 0.683 was still valid.
The results for the discriminant validity using the HTMT values are illustrated in Table 8. The HTMT criterion for each pair of measured items was determined. Most pairs of constructs were smaller than the HTMT0.85 criterion [88], and a pair of constructs was smaller than the HTMT0.9 criterion [89]. The results indicated that only the HTMT inference indicated a discriminant validity between all construct measures.
After checking the reliability and validity, CFA could then be conducted. CFA was used to test the model fitness of the measurement items. As mentioned in the last chapter, the Chi-square statistic (χ2) was used in CFA, as it was the most appropriate method to measure the model fitness with a sample size of less than 200. CFA was conducted by using IBM SPSS AMOS 25 GRAPHICS. Table 9 shows the result of the CFA of the hypothesis model. The Chi-square mean was 594.318, while the degree of freedom was 220. Therefore, χ2/df could be calculated as 2.701, an acceptable level (<3) [85]. For the p-value, the CFA results showed a model fit of less than 0.001, which indicated that the data were consistent, and a highly significant result could be obtained. In another model, the indices including the CFI, TLI, and SRMR also indicated good statistical fitness. The results were smaller than the target threshold of CFI ≥0.85, TLI ≥ 0.8, and SRMR < 0.5, as suggested in Table 3. Overall, the CFA results indicated that the model presented a good fit.
In order to obtain a higher fitness of the model, modification can be undertaken by using modification indices, which modify the original model by adding free parameters to improve the model fit significantly and reduce the number of parameters without greatly affecting the model fit. It was indicated that there were measurement errors for PWA3 and PWA6; PEOU1 and PEOU2; PEOU2 and PEOU3; PEOU4 and PEOU5; PIQ2 and PIQ4, which should be correlated. Those measurements were developed by previous scholars. As a result, the aforementioned errors of the model can be combined and simplified to prevent overfitting and over-complication.

6.3. Structural Models and Hypothesis Testing

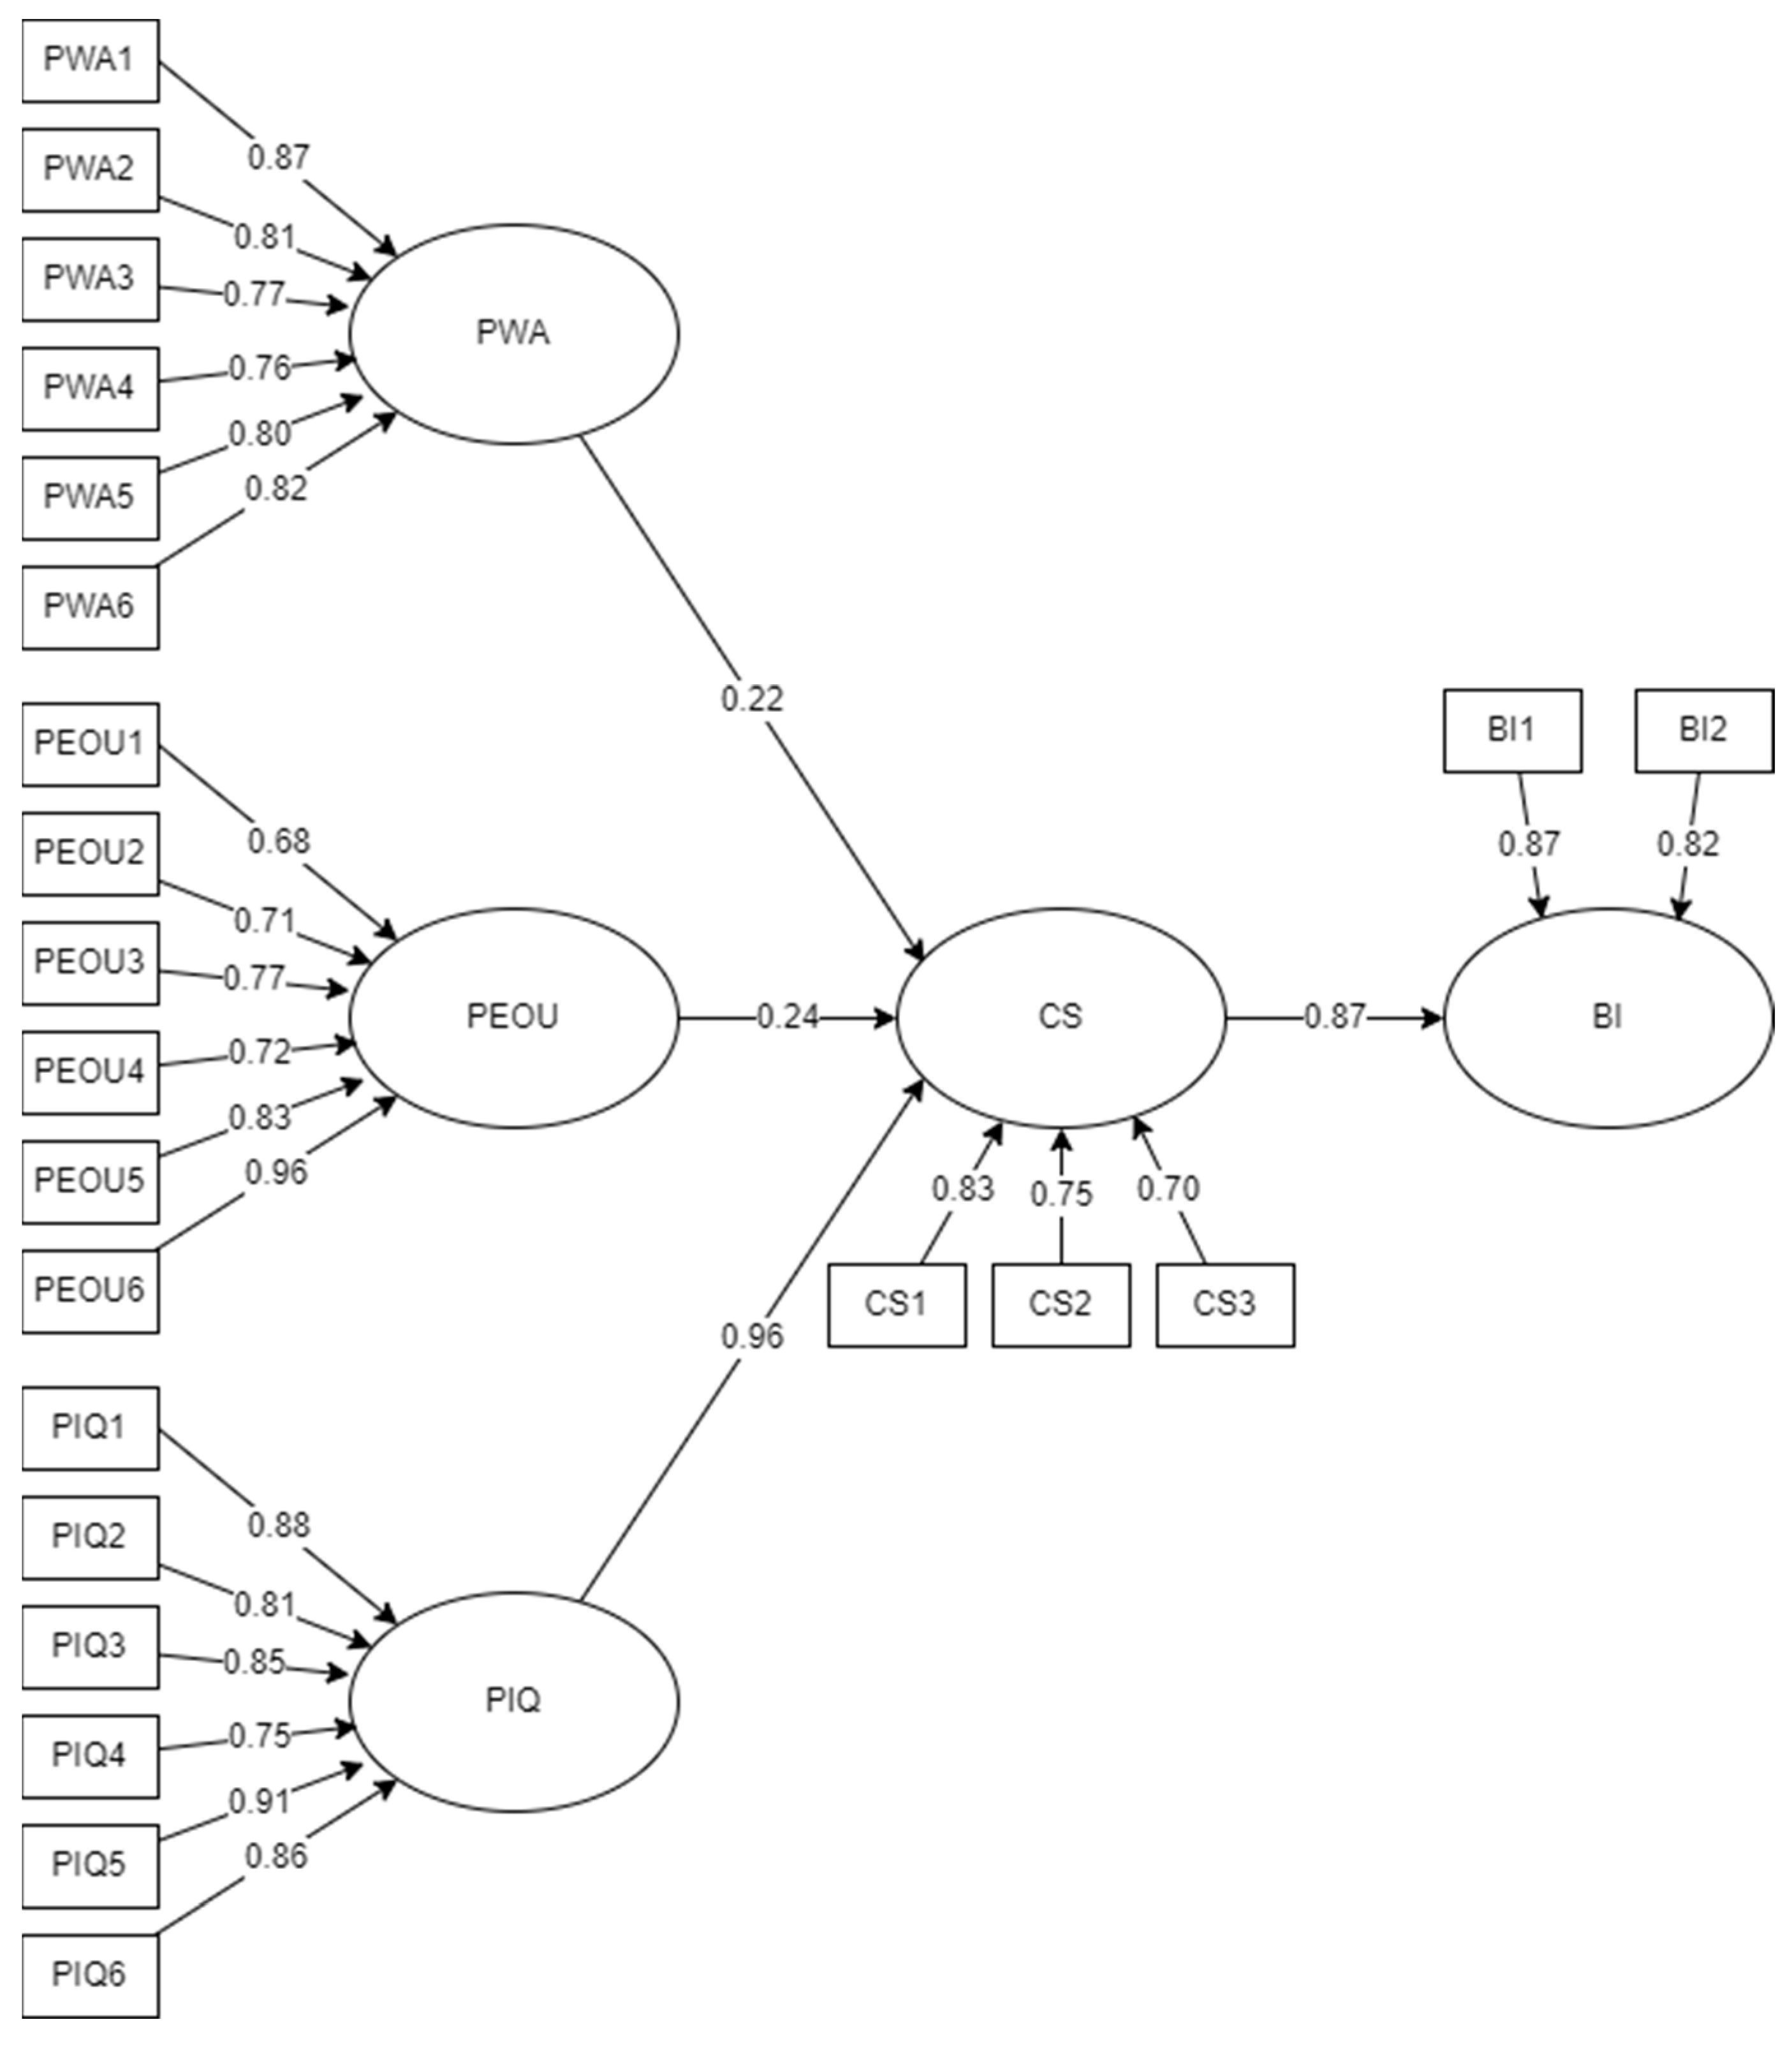
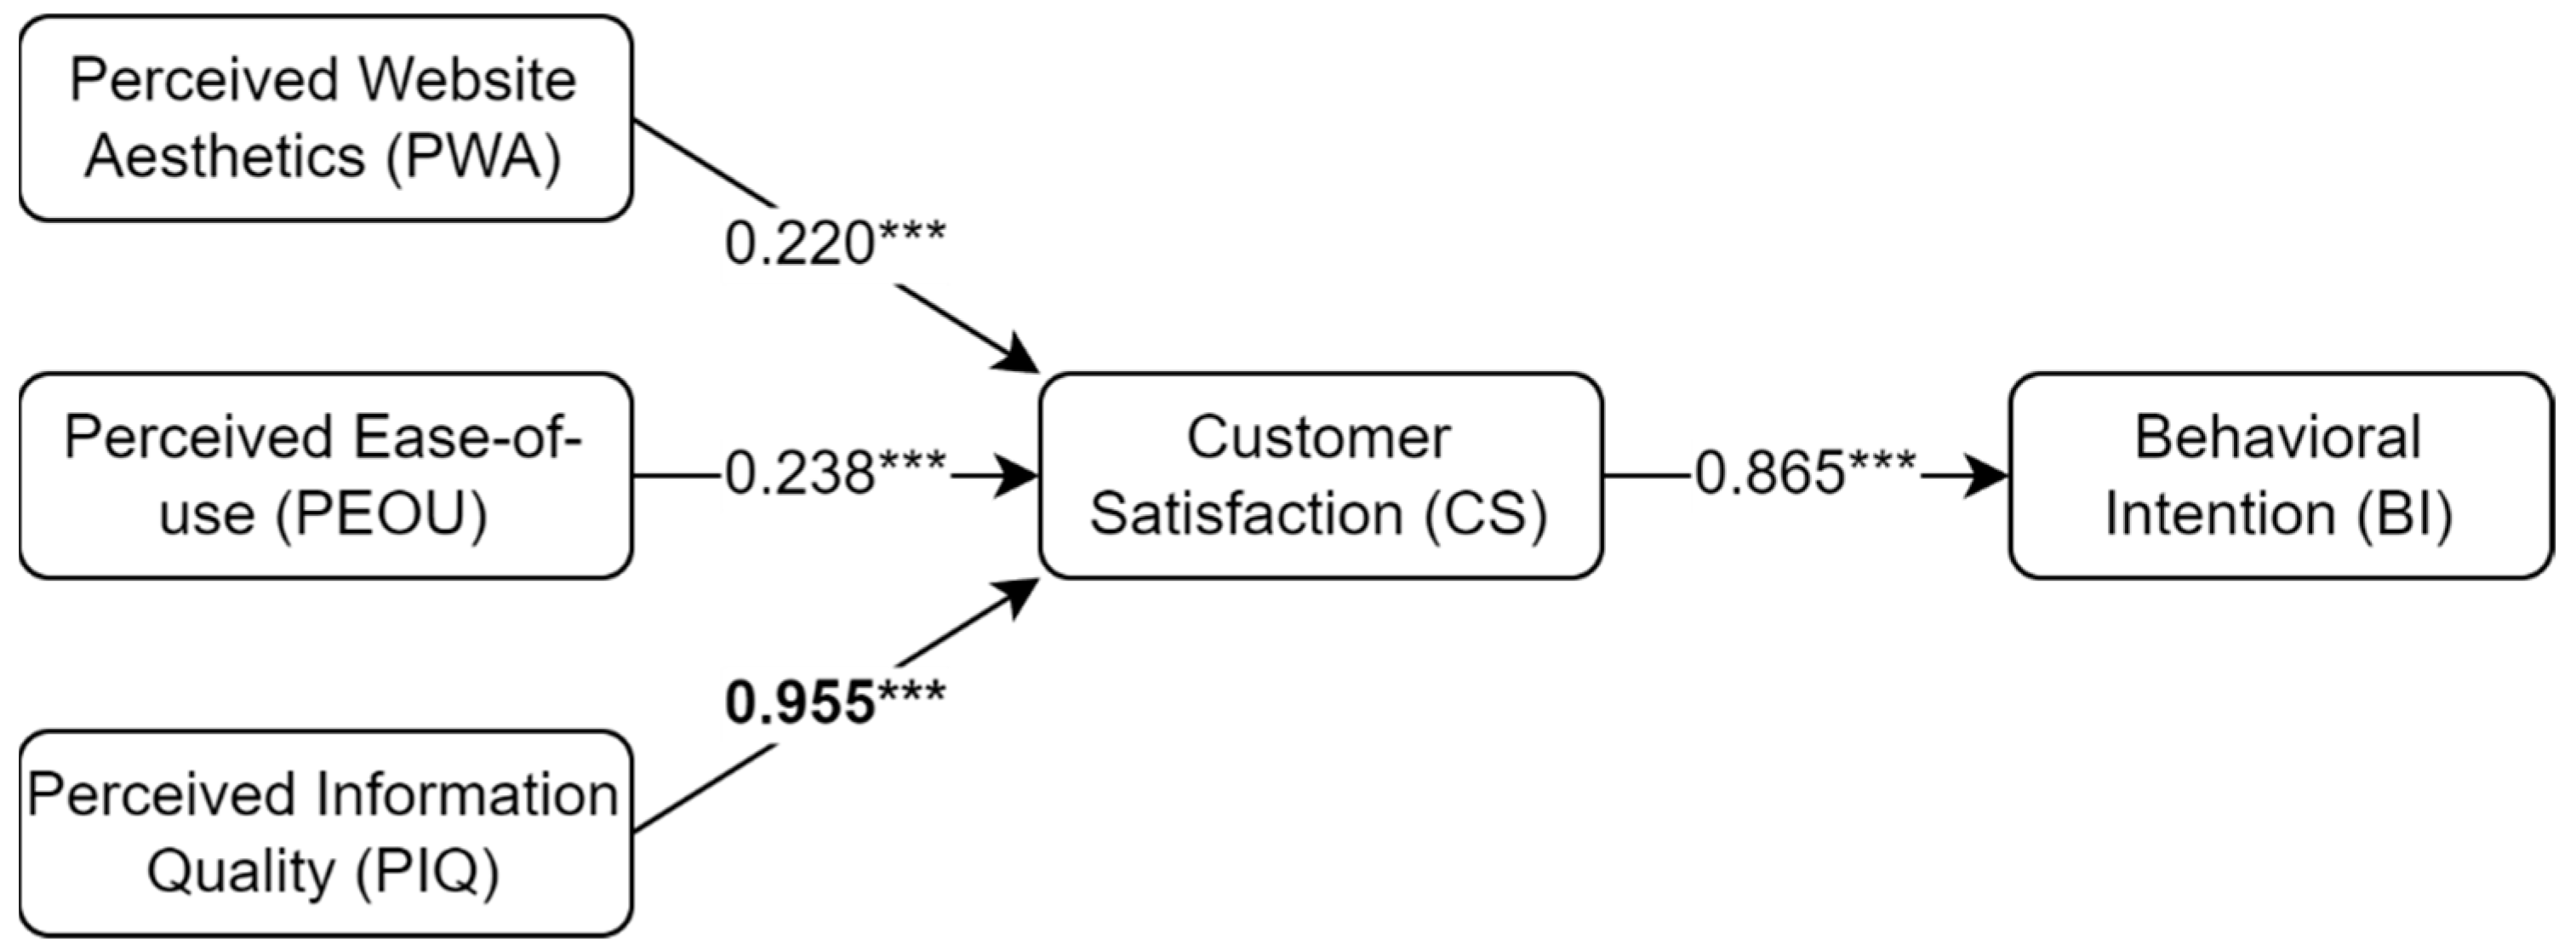
The SEM result is shown in Figure 2. The regression analysis results are summarized in Figure 3 with the p-values and the standardised coefficient (β) of five variables in the hypothesis model. From the path analysis, the p-value of each path indicated that hypotheses H1, H2, H3, and H4 were all accepted from the path analysis. The perceived website aesthetics (H1: β = 0.220, p < 0.001) showed a positive relationship with customer satisfaction. The perceived ease of use (H2: β = 0.238, p < 0.001) indicated a positive relationship with customer satisfaction, while the perceived information quality (H3: β = 0.955, p < 0.001) demonstrated a strictly positive relationship with customer satisfaction. Additionally, the relationship between customer satisfaction and behavioural intention (H4: β = 0.865, p < 0.001) was strongly supported. Table 10 summarizes the hypothesis testing results for the proposed model.

6.4. Performance Evaluation

In order to monitor the result of the marketing campaign used in this study, Google Analytics and Facebook Analytics and Insight were used.
The results generated by Google Analytics from late February to early April 2019 showed that 161 users visited the website, and most (88.2%) were new visitors. The average time for them to stay on the site was around 2 min and 37 s. It also showed that most of the visitors were from Hong Kong, followed by the United States. Website visitors mostly came from organic searches on engines such as Google, followed by social media such as Facebook. Most of the visitors used a mobile device rather than a desktop to browse.
The Facebook page was created early in December 2018, and there were 119 followers in May 2020 on the page. Three posts were promoted via an advertisement for boosting the post. The most viewed post was published on 28 May, which gained 1.7K Facebook users’ views with 158 engagements in total, since there were two promotions made in this post. Another advertisement successfully reached 902 people aged between 25 and 44 years old and received one direct message from a potential customer who enquired about the service.

7. Discussion

SEM has demonstrated in the proposed hypothesis model that perceived website marketing aesthetics, ease of use, and information quality positively influence customer satisfaction from website marketing. The hypothesis path in H3 demonstrated a strictly positive relationship between perceived information quality and customer satisfaction and the highest standardised coefficient beta (β) of 0.955. This indicates that perceived information quality influences customer satisfaction in website marketing through the three suggested factors. Information quality refers to the amount, accuracy, and form of information about the products and services [90]. Information quality attributes can be measured based on the degree to which the website can give up-to-date information, is clearly written and reliable, and whether the description of the company background, service, and design portfolio is in-depth [91]. Therefore, information quality should be focused on and emphasised in digital marketing to increase customer satisfaction and choice intention.
By collecting and compiling the relevant studies, most scholars research the impact of digital marketing on consumers from two aspects. One is the digital environment, specifically through interactions with search engines, online reviews, recommendations, social media, etc. Customers use other devices, such as smartphones, tablets, TV, or wearable devices [92]. De Pelsmacker et al. [93] studied the digital marketing strategies of 132 hotels in Belgium and concluded that digital marketing strategies affect the volume and valence of online reviews, which affects hotel performance. Barcelos et al. [94] examined how companies use the human voice on social media to influence consumers’ purchase intentions. Almeida-Santana et al. [95] put forward that social media marketing significantly impacts travellers’ attitudinal loyalty to a destination. Xu et al. [96] believed that since consumers may prefer tablets for certain browsing and purchasing activities over other devices such as smartphones and PCs, tablet encourage longer browsing sessions and more page views, eliciting consumers to purchase more impulsive products and a wider variety of products as a result of digital marketing.
Our study is based on previous research that used website marketing as a digital environment to analyse the relationship between digital marketing and consumers empirically. However, unlike other studies, we adopt a consumer perspective, which explores the factors that influence digital marketing customer satisfaction. The conclusion is that the information quality of marketing is the most important factor that consumers consider.

8. Conclusions

Identifying the factors influencing customer intention in digital marketing from the customer perspective is unique in the way in which it was conducted during the COVID pandemic. With the enforcement of social distancing and lockdown, customers ramped up online shopping and the use of social media. By examining the factors consumers value most in digital marketing, we have found that the quality of digital marketing information has the most significant impact on consumer intent. With the changing social environment, especially under the influence of the COVID-19 crisis, digital marketing channels have taken priority and are vital to the survival and growth of companies. This study will help companies to improve the precision of marketing in the digital marketing process and reduce marketing costs, as well as attracting and satisfying consumers.
We created a theoretical framework based on the theory of planned behaviour with the factors of aesthetics, ease of use, and information quality of digital marketing. We used website marketing in the interior design industry as a case study to examine the perceived aesthetics, ease of use, and quality in digital marketing that positively impact consumer intention. The result shows that consumers have a stronger concern about the quality of digital marketing. Meanwhile, promoting the website through SEO and advertising on social media can allow us to gain more insights from internet users. The study results have implications for the accuracy and effectiveness of digital marketing in companies.
There are some limitations in this research. First, the sample size could be improved in future studies when the use of the technologies examined in this study is extended. Due to the technologies still being in the infancy stage, there was a limited availability of the sample and accordingly, a total of 120 can be considered high—although it is not an ideal number. On the other hand, the mediating effects of customer satisfaction are not included in the proposed research model. However, the mediating effects are worth studying in order to further determine the underlying effects of IVR on digital marketing satisfaction. Although CFA analysis has indicated that the reliability and validity of the responses are high enough to support the hypothesis, it is not sufficiently persuasive to estimate the results from these respondents representing the actual population. Moreover, we have only used the interior design industry as a case study, which may also influence the results. More digital marketing methods and more industry involvement may produce a more representative result. In addition, it is expensive to employ advertising on social media platforms and SEO planning.
Further development of this study could be found in obtaining a wider spectrum of respondents using the questionnaire. More industries can be used as a reference, and comparisons could show a more significant result. External environmental variables can also be added to the model in further development, such as the EWOM (e-word-of-mouth) factor.

Author Contributions

Conceptualization, Y.M.T. and U.L.H.; methodology, Y.M.T. and U.L.H.; validation, Y.-y.L.; formal analysis, Y.M.T. and U.L.H.; investigation, U.L.H.; data curation, U.L.H.; writing—original draft preparation, Y.M.T. and U.L.H.; writing—review and editing, Y.-y.L.; supervision, Y.M.T.; project administration, Y.M.T. and U.L.H. All authors have read and agreed to the published version of the manuscript.

Funding

The work in this research project was supported by the Funding for Strategic Plan Initiatives to Expand Research Elements in the Undergraduate Curriculum for 2020-22 from the Hong Kong Polytechnic University, Hong Kong (Project Code: SPF20-22/ISE), for the publication of this article.

Institutional Review Board Statement

Not applicable.

Informed Consent Statement

Not applicable.

Data Availability Statement

Not applicable.

Conflicts of Interest

The authors declare no conflict of interest.

References

  1. Herhausen, D.; Dario, M.; Robert, E.M.; Mirella, H.P.K. The digital marketing capabilities gap. Ind. Mark. Manag. 2020, 90, 276–290. [Google Scholar] [CrossRef]
  2. Mckinsey & Co. Digital Marketing Re-creation. 21st Century Bus. Rev. 2021, 1, 110–115. [Google Scholar]
  3. Armitage, J. Strategic Insights. Mark. Insights 2015, 27, 22–23. [Google Scholar]
  4. Tang, Y.M.; Chau, K.Y.; Hong, L.; Ip, Y.T.; Yan, W. Financial innovation in digital payment with WeChat towards electronic business success. J. Theor. Appl. Electron. Commer. Res. 2021, 16, 1844–1861. [Google Scholar] [CrossRef]
  5. Chaffey, D.; Danyl, B. Digital marketing strategy planning template. Smart Insights 2013, 1–14. Available online: https://images.template.net/wp-content/uploads/2016/06/27115818/Digital-Marketing-Strategy-Template.pdf (accessed on 22 March 2023).
  6. Piñeiro-Otero, T.; Martínez-Rolán, X. Understanding Digital Marketing—Basics and Actions. In MBA; Springer: Berlin/Heidelberg, Germany, 2016; pp. 37–74. [Google Scholar]
  7. Calienes, E.; Candy, C.G.; Margaret, P. Inside the mind of the Millennial shopper: Designing retail spaces for a new generation. J. Inter. Des. 2016, 41, 47–67. [Google Scholar] [CrossRef]
  8. Flavian, C.; Ibanez-Sanchez, S.; Orus, C. The impact of virtual, augmented and mixed reality technologies on the customer experience. J. Bus. Res. 2019, 100, 547–560. [Google Scholar] [CrossRef]
  9. Pandey, N.; Preeti, N.; Abhijeet, S.R. Digital marketing for B2B organizations: Structured literature review and future research directions. J. Bus. Ind. Mark. 2020, 35, 1191–1204. [Google Scholar] [CrossRef]
  10. Holliman, G.; Jennifer, R. Business to business digital content marketing: Marketers’ perceptions of best practice. J. Res. Interact. Mark. 2014, 8, 269–293. [Google Scholar] [CrossRef]
  11. Wang, W.Y.C.; Pauleen, D.J.; Zhang, T. How social media applications affect B2B communication and improve business performance in SMEs. Ind. Mark. Manag. 2016, 54, 4–14. [Google Scholar] [CrossRef]
  12. Järvinen, J.; Heikki, K. The use of Web analytics for digital marketing performance measurement. Ind. Mark. Manag. 2015, 50, 117–127. [Google Scholar] [CrossRef]
  13. Tang, Y.M.; Chau, K.Y.; Xu, D.; Liu, X. Consumer perceptions to support IoT based smart parcel locker logistics in China. J. Retail. Consum. Serv. 2021, 62, 102659. [Google Scholar] [CrossRef]
  14. Lacka, E.; Chong, A. Usability perspective on social media sites’ adoption in the B2B context. Ind. Mark. Manag. 2016, 54, 80–91. [Google Scholar] [CrossRef]
  15. Venkatesh, R.; Liju, M.; Tarun, K.S. Imperatives of business models and digital transformation for digital services providers. Int. J. Bus. Data Commun. Netw. (IJBDCN) 2019, 15, 105–124. [Google Scholar] [CrossRef]
  16. Lohse, G.L.; Peter, S. Electronic shopping. Commun. ACM 1998, 41, 81–87. [Google Scholar] [CrossRef]
  17. Ranganathan, C.; Shobha, G. Key dimensions of business-to-consumer websites. Inf. Manag. 2002, 39, 457–465. [Google Scholar] [CrossRef]
  18. Sentosa, I.; Mat, N.K.N. Examining theory of planned behavior (TPB) and technology acceptance model (TAM) in internet purchasing using structural equation modeling. J. Arts Sci. Commer. 2012, 2, 62–77. [Google Scholar]
  19. Ishaq, E.; Bashir, S.; Zakariya, R.; Sarwar, A. Technology acceptance behavior and feedback loop: Exploring reverse causality of TAM in post-COVID-19 scenario. Front. Psychol. 2021, 12, 682507. [Google Scholar] [CrossRef]
  20. Hiltunen, M.; Markku, L.; Jari, L. Mobile User Experience; IT Press: Allentown, PA, USA, 2002. [Google Scholar]
  21. Kwok, C.P.; Tang, Y.M. A fuzzy MCDM approach to support customer-centric innovation in virtual reality (VR) metaverse headset design. Adv. Eng. Inform. 2023, 56, 101910. [Google Scholar] [CrossRef]
  22. LaMarco, N. Consumer Perception Theory. 2018. Available online: https://smallbusiness.chron.com/consumer-perception-theory-40176.html (accessed on 5 November 2018).
  23. Chibok, B.M.; Msheliza, S.K.; Ndubuisi, W.C. An Analysis of Consumer Perceptions and Usage of Mobile Telecommunications Brand in the Maiduguri Township in Nigeria. IOSR J. Bus. Manag. (IOSR-JBM) 2013, 12, 44–48. [Google Scholar]
  24. Xu, Y.; Goedegebuure, R.; Van der, H.B. Customer perception, customer satisfaction, and customer loyalty within Chinese securities business: Towards a mediation model for predicting customer behavior. J. Relatsh. Mark. 2007, 5, 79–104. [Google Scholar] [CrossRef]
  25. Crane, F.G.; Frederick, G.C.; Clarke, T.K. Consumer Behaviour in Canada: Theory and Practice; Dryden Hinsdale USA: Dryden, ON, Canada, 1994. [Google Scholar]
  26. Boksberger, P.E.; Lisa, M. Perceived value: A critical examination of definitions, concepts and measures for the service industry. J. Serv. Mark. 2011, 25, 229–240. [Google Scholar] [CrossRef]
  27. Chan, Y.K.; Tang, Y.M.; Teng, L. A comparative analysis of digital health usage intentions towards the adoption of virtual reality in telerehabilitation. Int. J. Med. Inform. 2023, 174, 105042. [Google Scholar] [CrossRef] [PubMed]
  28. Iglesias, O.; Stefan, M.; Jatinder, J.S.; Vicenta, S. Do customer perceptions of corporate services brand ethicality improve brand equity? Considering the roles of brand heritage, brand image, and recognition benefits. J. Bus. Ethics 2019, 154, 441–459. [Google Scholar] [CrossRef]
  29. Tomič, A.; Mikuláš, Š. “Increasing website traffic of woodworking company using digital marketing methods. Acta Fac. Xylologiae Zvolen Res. Publica Slovaca 2019, 61, 153–161. [Google Scholar]
  30. Anderson, S. SEO Tutorial for Beginners in 2019. 2019. Available online: https://www.hobo-web.co.uk/seo-tutorial/ (accessed on 11 April 2023).
  31. Christopher, M.; Peck, H. Marketing Logistics; Routledge: Oxfordshire, UK, 2012. [Google Scholar]
  32. Wienclaw, R.A. Direct E-Marketing. In Direct E-Marketing-Research Starters Business; EBSCO: Ipswich, MA, USA, 2017; pp. 1–6. [Google Scholar]
  33. Gaikwad, J.; Parikshitkumar, H.K. E-Marketing: A modern approach of business at the door of consumer. Clear Int. J. Res. Commer. Manag. 2016, 7, 56–61. [Google Scholar]
  34. Institute Content Marketing. The 2017 Content Marketing Framework. 2017. Available online: https://contentmarketinginstitute.com/wp-content/uploads/2016/10/CMI_Framework2016-FINAL-REV.pdf (accessed on 20 March 2020).
  35. Felix, R.; Philipp, A.R.; Chris, H. Elements of strategic social media marketing: A holistic framework. J. Bus. Res. 2017, 70, 118–126. [Google Scholar] [CrossRef]
  36. Patrutiu-Baltes, L. Inbound marketing-the most important digital marketing strategy. Bull. Transilv. Univ. Bras. Econ. Sci. 2016, 9, 61. [Google Scholar]
  37. Fishbein, M.; Ajzen, I. Belief, Attitude, Intention, and Behavior: An Introduction to Theory and Research; Addison-Wesley: Boston, MA, USA, 1975. [Google Scholar]
  38. Lau, Y.Y.; Kawasaki, T.; Guan, J.; Not, C. An investigation into the attitude and behaviors of ferry passenger towards general waste management. Ocean Coast. Manag. 2021, 213, 105879. [Google Scholar]
  39. Ajzen, I. The theory of planned behavior. Organ. Behav. Hum. Decis. Process. 1991, 50, 179–211. [Google Scholar] [CrossRef]
  40. Mohr, S.; Kuhl, R. Acceptance of artificial intelligence in German agriculture: An application of the technology acceptance model and the theory of planned behavior. Precis. Agric. 2021, 22, 1816–1844. [Google Scholar] [CrossRef]
  41. Sohn, K.; Kwon, O. Technology acceptance theories and factors influencing artificial intelligence-based intelligent products. Telemat. Inform. 2020, 47, 101324. [Google Scholar] [CrossRef]
  42. Juliana, A.; Pramezwary, D.M.; Lemy, R.; Pramono, A.; Djakasaputra, A.; Purwanto, A. Hotel performance in the digital era: Roles of digital marketing, perceived quality and trust. J. Intell. Manag. Decis. 2022, 1, 36–45. [Google Scholar] [CrossRef]
  43. Fazlollahtabar, H. Intelligent marketing decision model based on customer behavior using integrated possibility theory and K-means algorithm. J. Intell. Manag. Decis. 2022, 1, 88–96. [Google Scholar] [CrossRef]
  44. Zhang, Y.; Su, J.; Guo, H.; Lee, J.Y.; Xiao, Y.; Fu, M. Exploring the influence of customer participation on appreciation of digital affordances and well-being. J. Retail. Consum. Serv. 2022, 67, 103022. [Google Scholar] [CrossRef]
  45. Jylhä, H.; Juho, H. An icon that everyone wants to click: How perceived aesthetic qualities predict app icon successfulness. Int. J. Hum. Comput. Stud. 2019, 130, 73–85. [Google Scholar] [CrossRef]
  46. Alkhalifah, A. Developing mobile commerce website design to enhance users experience. IJCSNS Int. J. Comput. Sci. Netw. Secur. 2017, 17, 65–69. [Google Scholar]
  47. Dou, Q.; Xianjun, S.Z.; Sun, T.F.; Heng, P.A. Webthetics: Quantifying webpage aesthetics with deep learning. Int. J. Hum. Comput. Stud. 2019, 124, 56–66. [Google Scholar] [CrossRef]
  48. King, R.C.; Richard, A.M.; Schilhavy, C.C.; Wynne, W.C. Do customers identify with our website? The effects of website identification on repeat purchase intention. Int. J. Electron. Commer. 2016, 20, 319–354. [Google Scholar] [CrossRef]
  49. Pengnate, S.F.; Rathindra, S. An experimental investigation of the influence of website emotional design features on trust in unfamiliar online vendors. Comput. Hum. Behav. 2017, 67, 49–60. [Google Scholar] [CrossRef]
  50. Aulkemeier, F.; Maria-Eugenia, I.; Jos van, H. An architectural perspective on service adoption: A platform design and the case of pluggable cross-border trade compliance in e-commerce. J. Organ. Comput. Electron. Commer. 2017, 27, 325–341. [Google Scholar] [CrossRef]
  51. Rahman, K.M. A narrative literature review and E-commerce website research. arXiv 2018, arXiv:1806.07833. [Google Scholar] [CrossRef]
  52. Davis, F.D. A Technology Acceptance Model for Empirically Testing New End-user Information Systems: Theory and Results. Ph.D. Thesis, Massachusetts Institute of Technology, Cambridge, MA, USA, 1985. [Google Scholar]
  53. Huang, Y.C.; Li, L.N.; Lee, H.Y.; Browning, M.H.E.M.; Yu, C.P. Surfing in virtual reality: An application of extended technology acceptance model with flow theory. Comput. Hum. Behav. Rep. 2023, 9, 100252. [Google Scholar] [CrossRef]
  54. Chi, O.H.; Chi, C.G.; Gursoy, D.; Nunkoo, R. Customers’ acceptance of artificially intelligent service robots: The influence of trust and culture. Int. J. Inf. Manag. 2023, 70, 102623. [Google Scholar] [CrossRef]
  55. Pino, G.; Cesare, A.; Rajan, N.; De Angelis, M.; Peluso, A.M.; Guido, G. Product touch in the real and digital world: How do consumers react? J. Bus. Res. 2020, 112, 492–501. [Google Scholar] [CrossRef]
  56. Trehan, D.; Rajat, S. Assessing advertisement quality on C2C social commerce platforms: An information quality approach using text mining. Online Inf. Rev. 2021, 45, 45–64. [Google Scholar] [CrossRef]
  57. Yang, Z.; Wang, L.; Tang, H.; Zhang, Y. Electronic word-of-mouth and consumer purchase intentions in social e-commerce. Electron. Commer. Res. Appl. 2020, 41, 100980. [Google Scholar]
  58. Chen, X.; Qian, H.; Robert, M.D. Economic and social satisfaction of buyers on consumer-to-consumer platforms: The role of relational capital. Int. J. Electron. Commer. 2017, 21, 219–248. [Google Scholar] [CrossRef]
  59. Wang, Y.S.; Tseng, T.H.; Wang, W.T.; Shih, Y.W.; Chan, P.Y. Developing and validating a mobile catering app success model. Int. J. Hosp. Manag. 2019, 77, 19–30. [Google Scholar] [CrossRef]
  60. Song, J.; Giovanni, C.; Wang, M.G.; Lu, H. Exploring the influence of system quality, information quality, and external service on BIM user satisfaction. J. Manag. Eng. 2017, 33, 04017036. [Google Scholar] [CrossRef]
  61. Hult, G.; Tomas, M.; Pratyush, N.S.; Morgeson, F.V., III; Zhang, Y. Antecedents and consequences of customer satisfaction: Do they differ across online and offline purchases? J. Retail. 2019, 95, 10–23. [Google Scholar] [CrossRef]
  62. Isfandyari-Moghaddam, A. Customer-centric marketing strategies: Tools for building organizational performance. J. Consum. Mark. 2014, 31, 85–86. [Google Scholar] [CrossRef]
  63. Alalwan, A.A. Mobile food ordering apps: An empirical study of the factors affecting customer e-satisfaction and continued intention to reuse. Int. J. Inf. Manag. 2020, 50, 28–44. [Google Scholar] [CrossRef]
  64. DeLone, W.H.; Ephraim, R.M. The DeLone and McLean model of information systems success: A ten-year update. J. Manag. Inf. Syst. 2003, 19, 9–30. [Google Scholar]
  65. Casaló, L.V.; Carlos, F.; Sergio, I.S. Influencers on Instagram: Antecedents and consequences of opinion leadership. J. Bus. Res. 2018, 117, 510–519. [Google Scholar] [CrossRef]
  66. Liang, R.; Jiao, Z.; Liu, Z. An Empirical Study on the Influencing Factors of Customers’ Acceptance Intention towards Online Behavioral Advertising. Teh. Vjesn. 2020, 27, 1142–1149. [Google Scholar]
  67. Huang, J.; Zhou, L. The dual roles of web personalization on consumer decision quality in online shopping: The perspective of information load. Internet Res. 2019, 29, 1280–1300. [Google Scholar] [CrossRef]
  68. Media, W.L. Digital Marketing for Hong Kong Interior Designers. 2017. Available online: https://www.wlmedia.hk/digital-marketing-for-interior-designers-in-hong-kong/ (accessed on 5 June 2017).
  69. Dillman, D.A. Mail and Internet Surveys: The Tailored Design Method; Wiley: New York, NY, USA, 2007. [Google Scholar]
  70. Jiang, Z.; Wang, W.; Tan, B.C.Y.; Yu, J. The determinants and impacts of aesthetics in users’ first interaction with websites. J. Manag. Inf. Syst. 2016, 33, 229–259. [Google Scholar] [CrossRef]
  71. Sreeram, A.; Kesharwani, A.; Desai, S. Factors affecting satisfaction and loyalty in online grocery shopping: An integrated model. J. Indian Bus. Res. 2017, 9, 107–132. [Google Scholar] [CrossRef]
  72. Hartono, E.; Clyde, W.H. Website visual design qualities: A threefold framework. ACM Trans. Manag. Inf. Syst. (TMIS) 2019, 10, 1–21. [Google Scholar] [CrossRef]
  73. Hou, S.I. Health Literacy Online: A Guide to Writing and Designing Easy-To-Use Health Web Sites; Sage Publications Sage: Los Angeles, CA, USA, 2012. [Google Scholar]
  74. Trusov, M.; Ma, L.; Zainab, J. Crumbs of the cookie: User profiling in customer-base analysis and behavioral targeting. Mark. Sci. 2016, 35, 405–426. [Google Scholar] [CrossRef]
  75. Tsai, S.P. E-loyalty driven by website quality: The case of destination marketing organization websites. J. Organ. Comput. Electron. Commer. 2017, 27, 262–279. [Google Scholar] [CrossRef]
  76. Jiménez-Barreto, J.; Campo-Martínez, S. Destination website quality, users’ attitudes and the willingness to participate in online co-creation experiences. Eur. J. Manag. Bus. Econ. 2018, 27, 26–41. [Google Scholar] [CrossRef]
  77. Krishnamoorthy, D.; Vigram, R.P. A study on website quality and its impact on customer satisfaction with reference to ecommerce companies. J. Contemp. Issues Bus. Gov. 2020, 26, 888–895. [Google Scholar]
  78. Ongsakul, V.; Faizan, A.; Wu, C.; Duan, Y.; Cihan, C.; Ryu, K. Hotel website quality, performance, telepresence and behavioral intentions. Tour. Rev. 2020, 76, 681–700. [Google Scholar] [CrossRef]
  79. Jeon, M.M.; Lee, S.; Jeong, M. e-Social influence and customers’ behavioral intentions on a bed and breakfast website. J. Hosp. Mark. Manag. 2018, 27, 366–385. [Google Scholar] [CrossRef]
  80. Hair, J.F. Multivariate Data Analysis; Pearson Education Limited: London, UK, 2009. [Google Scholar]
  81. Cronbach, L.J. Coefficient alpha and the internal structure of tests. Psychometrika 1951, 16, 297–334. [Google Scholar] [CrossRef]
  82. Anderson, J.R. Skill acquisition: Compilation of weak-method problem situations. Psychol. Rev. 1987, 94, 192. [Google Scholar] [CrossRef]
  83. Byrne, B.M. Structural Equation Modeling with LISREL, PRELIS, and SIMPLIS: Basic Concepts, Applications, and Programming, 1st ed.; Psychology Press: New York, NY, USA, 1998. [Google Scholar]
  84. Byrne, R.M.J. Counterfactual thought. Annu. Rev. Psychol. 2016, 67, 135–157. [Google Scholar] [CrossRef]
  85. Kline, R.B. Principles and Practice of Structural Equation Modeling, 2nd ed.; Guilford Press: New York, NY, USA, 2005. [Google Scholar]
  86. Fornell, C.; David, F.L. Structural Equation Models with Unobservable Variables and Measurement Error: Algebra and Statistics; Sage Publications Sage CA: Los Angeles, CA, USA, 1981. [Google Scholar]
  87. MacCallum, R.C.; Keith, F.W.; Zhang, S.; Hong, S. Sample size in factor analysis. Psychol. Methods 1999, 4, 84. [Google Scholar] [CrossRef]
  88. Kline, R.B. Principles and Practice of Structural Equation Modeling, 3rd ed.; Guilford Press: New York, NY, USA, 2011. [Google Scholar]
  89. Yusoff, A.S.M.; Peng, F.S.; Razak, F.Z.A.; Mustafa, W.A. Discriminant validity assessment of religious teacher acceptance: The use of HTMT criterion. J. Phys. Conf. Ser. 2020, 1529, 042045. [Google Scholar] [CrossRef]
  90. Gao, W.; Li, X. Building presence in an online shopping website: The role of website quality. Behav. Inf. Technol. 2019, 38, 28–41. [Google Scholar] [CrossRef]
  91. Dedeke, A.N. Travel web-site design: Information task-fit, service quality and purchase intention. Tour. Manag. 2016, 54, 541–554. [Google Scholar] [CrossRef]
  92. Kannan, P.K. Digital marketing: A framework, review and research agenda. Int. J. Res. Mark. 2017, 34, 22–45. [Google Scholar] [CrossRef]
  93. De Pelsmacker, P.; Sophie, V.T.; Christian, H. Digital marketing strategies, online reviews and hotel performance. Int. J. Hosp. Manag. 2018, 72, 47–55. [Google Scholar] [CrossRef]
  94. Barcelos, R.; Hübner, D.; Dantas, C.; Sylvain, S. Watch your tone: How a brand’s tone of voice on social media influences consumer responses. J. Interact. Mark. 2018, 41, 60–80. [Google Scholar] [CrossRef]
  95. Almeida-Santana, A.; Moreno-Gil, S. New trends in information search and their influence on destination loyalty: Digital destinations and relationship marketing. J. Destin. Mark. Manag. 2017, 6, 150–161. [Google Scholar] [CrossRef]
  96. Xu, K.; Chan, J.; Ghose, A.; Han, S.P. Battle of the channels: The impact of tablets on digital commerce. Manag. Sci. 2017, 63, 1469–1492. [Google Scholar] [CrossRef]
Figure 1. Adopted framework in this study.
Jtaer 18 00046 g001
Figure 2. SEM result of hypotheses model from IBM SPSS AMOS.
Jtaer 18 00046 g002
Figure 3. SEM result of hypotheses model. Note: *** p < 0.001.
Jtaer 18 00046 g003
Table 1. Measurement of perceived website aesthetics (PWA), perceived ease of use (PEOU), perceived information quality (PIQ), customer satisfaction (CS), and behavioural intention (BI) on an interior design platform empowered by the virtual interior design feature.
LabelScale ItemsReference
PWA1This platform is visually appealing [70,71,72]
PWA2This platform is well organised
PWA3Colour used properly on the platform
PWA4Fonts used properly on the platform
PWA5Multimedia used properly on this platform
PWA6This platform has a clear and simple display
PEOU1This platform is easy to navigate[73,74]
PEOU2This platform has well-arranged categories
PEOU3I can go where I want with a minimum number of clicks
PEOU4This platform is fast loading
PEOU5This platform is not time-consuming
PEOU6This platform is user-friendly
PIQ1This platform provides up-to-date information[75,76]
PIQ2This platform provides clearly written information
PIQ3This platform provides in-depth descriptions (e.g., company background, service, design portfolio)
PIQ4The information is reliable
PIQ5This platform is a good source of information
PIQ6This platform provides information that I want to know
CS1I am satisfied with the quality of this platform[77]
CS2I had a good experience with this platform
CS3I have a good impression of the company after browsing this platform
BI1The probability of me using this platform again is high [78,79]
BI2The likelihood of me choosing this company is high after browsing its platform
Table 2. Reliability and validity with criterion.
Reliability and ValidityAcceptable Levels
Standardised factor loading>0.7
Cronbach’s alpha (α)>0.7
Composite reliability (CR)>0.8
Average variance extracted (AVE)>0.5
Table 3. Suggested target for the model fit indices with criteria.
χ2dfχ2/dfCFITLISRMR
Target <3>=0.85>=0.8<0.5
Table 4. Demographic profile of the respondents.
Demographic Characteristics Sample (n = 120)
n%
Gender
Male5747.5
Female6352.5
Age Group
19 or below54.17
20–295545.8
30–394134.2
40–491411.7
50–5943.33
60 or above10.833
Economic Activity Status
Employed7260
Unemployed21.67
Home-maker97.5
Retired person10.833
Student3630
Education Level
Secondary school or below 2722.5
Associated degree/higher diploma119.17
Bachelor’s degree7562.5
Master’s degree75.83
Other00
Table 5. Respondents’ status on looking for an interior design company.
VariablesSample (n = 120)
n%
Currently looking for/interested in interior design service
Yes5949.2
No6150.8
Looked for/hired an interior design company in the past 12 months
Yes1714.2
No10385.8
Channels(s) for finding an interior design company
Friends’ recommendation9780.8
Social media (e.g., Facebook) 6655
Online forum4134.2
Advertisement3226.7
Web search engine (e.g., Google)7260
Store visit4335.8
Table 6. Descriptive statistics of measurement items.
Measurement ItemMeanS.D.
Perceived Website Aesthetics
PWA15.3371.167
PWA25.5421.012
PWA35.5751.172
PWA45.5091.138
PWA55.4671.173
PWA65.7171.047
Perceived Ease of Use
PEOU15.70.967
PEOU25.61.049
PEOU35.4581.167
PEOU45.3081.327
PEOU55.3421.247
PEOU65.5921.065
Perceived Information Quality
PIQ14.91.293
PIQ25.2421.188
PIQ35.0331.384
PIQ45.1671.064
PIQ55.0331.283
PIQ65.1831.243
Customer Satisfaction
CS15.4251.034
CS25.3751.005
CS35.41.118
Behavioural Intention
BI14.8831.438
BI24.851.47
Table 7. Reliability and convergent validity of measurement items.
Measurement ItemStandardized Factor LoadingαCRAVE
Perceived Website Aesthetics 0.9190.9170.650
PWA10.874
PWA20.808
PWA30.769
PWA40.762
PWA50.797
PWA60.821
Perceived Ease of Use 0.9140.9080.614
PEOU10.683
PEOU20.711
PEOU30.772
PEOU40.718
PEOU50.826
PEOU60.957
Perceived Information Quality 0.9350.9370.713
PIQ10.875
PIQ20.812
PIQ30.851
PIQ40.752
PIQ50.906
PIQ60.863
Customer Satisfaction 0.9050.8040.579
CS10.828
CS20.747
CS30.703
Behavioural Intention 0.8830.8360.718
BI10.872
BI20.822
Note: α = Cronbach’s alpha; CR = composite reliability; AVE = average variance extracted (AVE).
Table 8. The discriminant validity was calculated using the new heterotrait–monotrait (HTMT) ratio.
PEOUPIQCSBI
PEOU0.827
PIQ0.7260.765
CS0.8190.8040.928
BI0.6770.6770.9530.858
Table 9. CFA results on hypothesis model.
χ2dfχ2/dfCFITLISRMR
Measurement Model594.3182202.7010.8550.8340.3798
Table 10. Hypothesis testing result.
HypothesisPathβSign.Result
H1Perceived website aesthetics->
Customer satisfaction
0.220<0.001Accepted
H2Perceived ease-of-use -> Customer satisfaction0.238<0.001Accepted
H3Perceived information quality->
Customer satisfaction
0.955<0.001Accepted
H4Customer satisfaction->
Behavioural intention
0.865<0.001Accepted
Note: β = standardized coefficient; sign. = significant.
Disclaimer/Publisher’s Note: The statements, opinions and data contained in all publications are solely those of the individual author(s) and contributor(s) and not of MDPI and/or the editor(s). MDPI and/or the editor(s) disclaim responsibility for any injury to people or property resulting from any ideas, methods, instructions or products referred to in the content.

