Article

Sentiment and Emotion on Twitter: The Case of the Global Consumer Electronics Industry

by
Claudia Pezoa-Fuentes
1,*,
Danilo García-Rivera
2 and
Sebastián Matamoros-Rojas
2
1
Institute of Administration, Faculty of Economics and Administrative Sciences, Universidad Austral de Chile, Valdivia 5090000, Chile
2
Department of Administration, Universidad Católica del Norte, Angamos 0610, Antofagasta 1240000, Chile
*
Author to whom correspondence should be addressed.
J. Theor. Appl. Electron. Commer. Res. 2023, 18(2), 765-776; https://doi.org/10.3390/jtaer18020039
Submission received: 27 July 2022 / Accepted: 3 March 2023 / Published: 23 March 2023
(This article belongs to the Collection Customer Relationships in Electronic Commerce)

Abstract

:
Sentiment analysis is a new tool on new social media platforms, locations very attractive to the global consumer industry to investigate, due to their relevance and increased consumption in a pandemic. This study aims to determine the predominant sentiment and emotions on Twitter through a sentiment analysis in the consumer electronics industry, according to the top 30 companies of the Consumer Electronic Show 2020, by analyzing 96,000 tweets with a total of 273,221 words. The methodology used is quantitative, of a descriptive type, that integrates the study of emotions and sentiment through a statistical analysis of the tweets with R. The main results identify that the predominant sentiment is of positive assessment and the emotions of anticipation and confidence were the most representative. The contribution of this research is to provide empirical evidence of the global consumer electronics industry for correct decision-making through a data language analysis procedure on Twitter.

1. Introduction

In today’s hyper-connected society, social networks have become indispensable to the lives of millions of people around the world [1]. In companies that are still made up of people, and that play a role within social networks, social networks are a tool that allows them to analyze information published in large quantities, as well as to know from the original source peoples’ opinions and comments about the brand [2,3,4].
Organizations invest in new and innovative analyses that can deliver and analyze more information to improve their sales, and it can be beneficial to include their products in the networks. Sentiment analyses have become key tools for social networks since they allow companies to obtain a general perspective on different topics. Thus, companies worldwide have made part of their improvement in the extraction and analysis of data from their social networks [5,6].
Currently, there are several different social networks (Facebook, Instagram, LinkedIn, Twitter, WhatsApp, Snapchat); however, Twitter has achieved exponential growth in different industries since its appearance after 2006 [7]. There is a lack of sentiment analysis studies with greater depth on Twitter, meaning that companies are missing the representative and diverse input of the public opinion of its users [5]. Thus, there is an opportunity to delve into this new, attractive, and little-explored subject.
Therefore, this paper aims to determine the predominant sentiment and emotions through a sentiment analysis in the global consumer electronics industry on Twitter. Providing empirical evidence on the subject will guide decision-makers, future researchers, digital developers, computer scientists, and programmers.
The work was organized into sections. In Section 2 a literature review is conducted, where social networks, Twitter, and sentiment analysis are explored in more depth. Section 3 describes the separate methods in the sample and in the instrument. Section 4 presents the results through tables and graphs obtained from the analysis. Finally, Section 5 corresponds to the discussion, conclusions, and future lines of research.

2. Review of Literature

2.1. Social Networks

Social media is structured as a group of Internet-based applications that allow for the creation and exchange of content between users of the same applications [8]. Social networks are defined as a space for social disclosure in which a personal worldview is expressed, reflecting personalities, ideologies, and experiences [9].
In addition, they provide a useful and effective service for companies, optimizing communication with their customers, where they interact, advertise, or speak directly, obtaining direct opinions of their products or services. Therefore, organizations can understand the thinking of their clients, enhancing their strategies to generate advantages for the company [10,11]. Companies need social networks to be part of their strategies [12], since these can serve as a source of individual analysis of interests and the effects of personal life, through a large amount of data on many individuals [13].

Twitter

Twitter is one of the most important social networking platforms in the last decade worldwide, created in 2006 as a microblogging platform. As of 2021, it allows instant messages to be shared with a maximum of 280 characters, with the possibility of sharing photos, videos, and links [14].
With the existence of internet and mobile internet, the use of microblogs has increased [15]. Moreover, these platforms attract a large number of users because of the large amount of content that can be found and how quickly a common topic can go viral.
Twitter, as the largest microblogging platform, has attracted the attention of companies from different industries interested in exposing their product to many users quickly and efficiently [16]. That is why Twitter is the ideal tool for conducting sentiment analysis, because of to the large amount of information that can be found in tweets issued by the companies, as well as the tweets issued by the customers of the companies.
One way to access the information provided by Twitter is the use of APIs (application programming interfaces). Using the search API that allows us to collect data in real-time, you can obtain the historical tweets of an account. At the same time, there are other types of API that are paid, with which more information can be obtained, but according to the authors [17], most APIs used in research are free, since using paid APIs becomes too expensive for researchers.

2.2. Sentiment Analysis

According to [18], sentiment analysis is known as “opinion mining” or “artificial intelligence”, where the use of natural language processing is alluded to. Thus, the use of data mining to extract sentiment in different areas can be highlighted, as in the case of this research, and it will be used in the context of Twitter microblogs.
Sentiment analysis is an area of research that provides various natural language processing techniques, it quantifies an opinion or a comment. In the case of this research, it is possible to quantify sentiments, whether they are positive or negative, and emotions, whether they are disgust, joy, fear, surprise, sadness, confidence, anger, or anticipation [10]. According to [19], the common use of sentiment analysis has different purposes such as distinguishing objective from subjective propositions, qualifying positive and negative texts, determining the source of different opinions expressed in a document, creating applications that include mining of data to summarize the opinion of consumers and politicians, and business and government intelligence. Ref. [20] indicates that “sentiment analysis tries to find out the polarity of the subjective text, that is, how much of the given textual data is positive, and how much is negative” (p. 577).
On the other hand, ref. [21] shows that sentiment analysis is comprised of the automatic identification of the sentiment expressed in a text, so it can apply the same analysis in different areas, such as monitoring sentiments, or to a product, movies, politicians, or companies. The authors also point out that in recent decades usage of microblogging platforms such as Twitter has increased considerably, generating interest in analyzing the sentiment of brief texts in various areas such as commerce, health, military intelligence, and natural disaster management.
Thus, sentiment analysis in microblogs helps companies to collect better feedback on the products they offer to their customers, allowing them to improve the quality of products offered in the future by developing better products to suit their customers’ tastes [6].

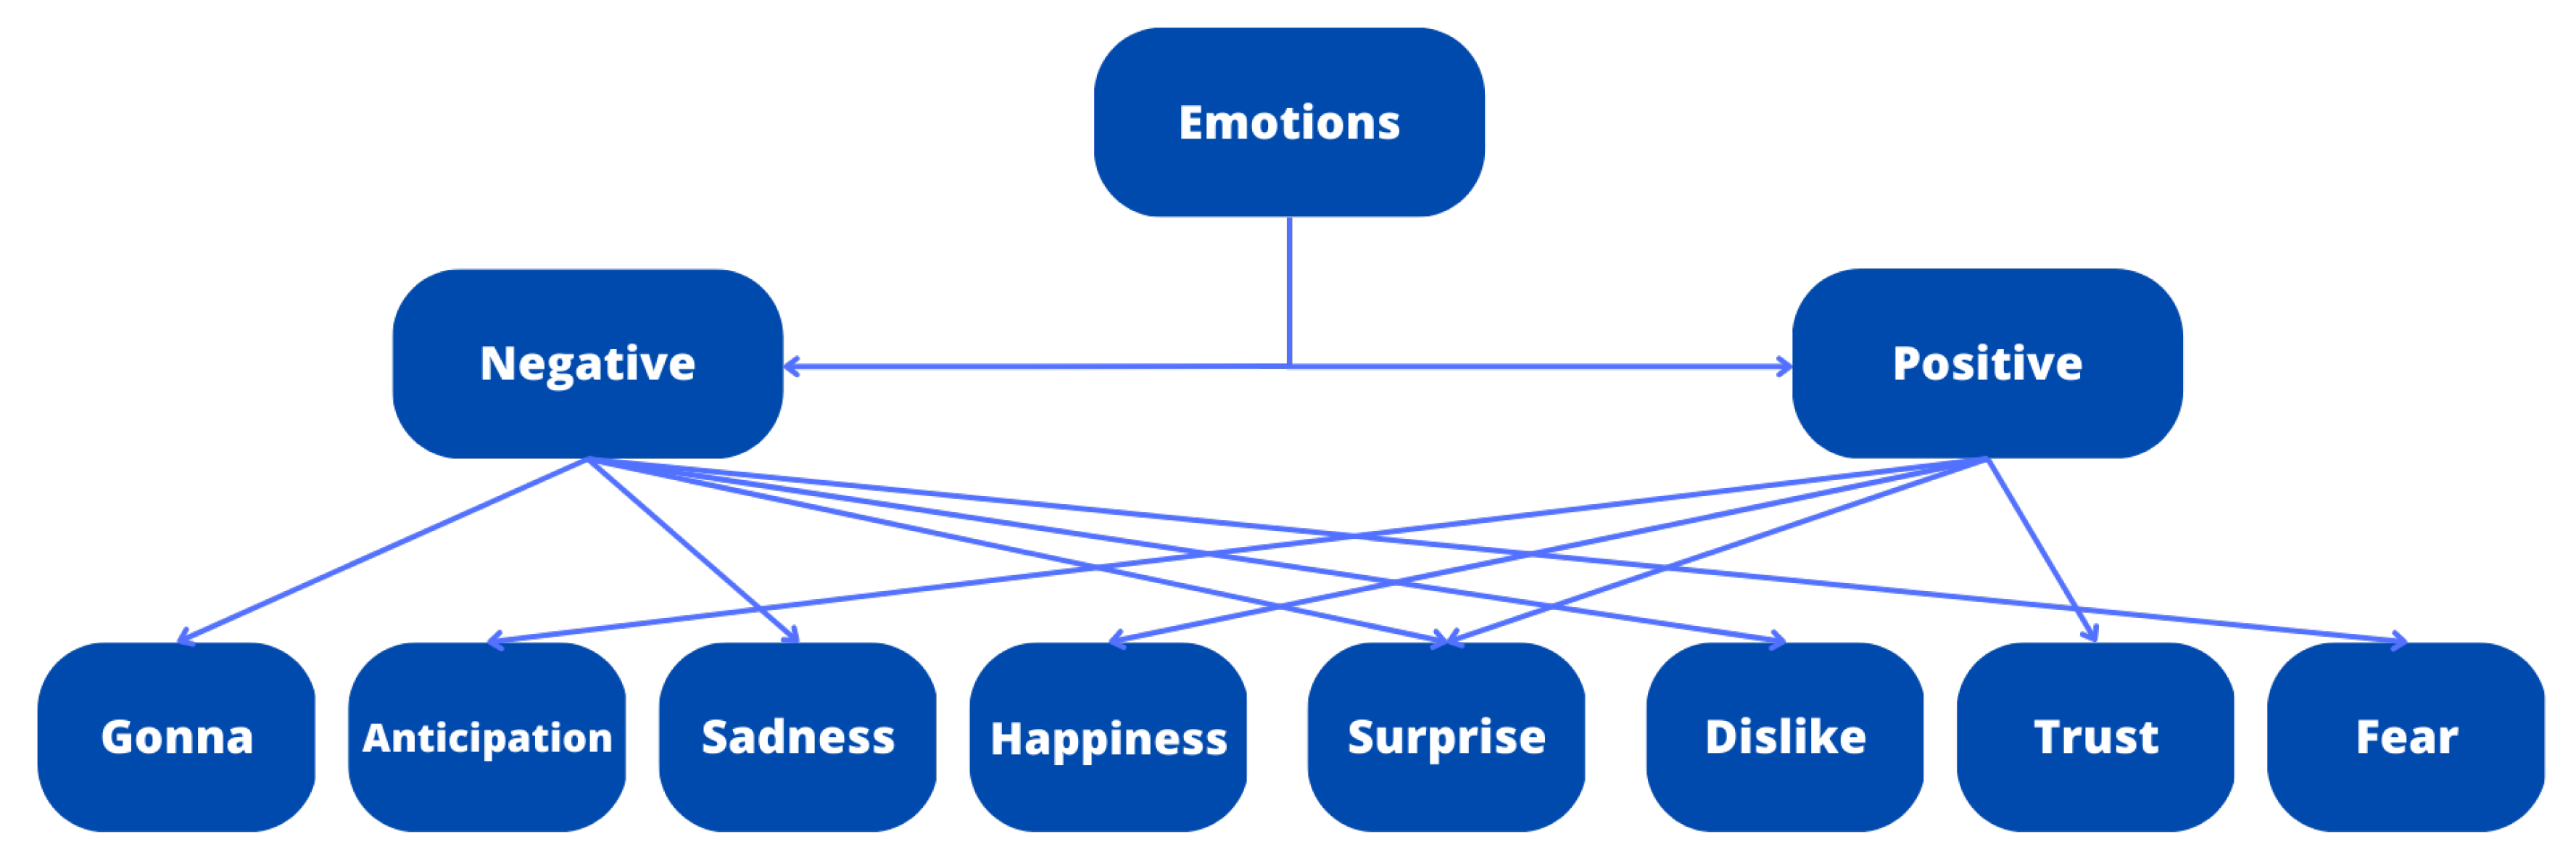
Sentiment Analysis Emotions

When performing the sentiment analysis, it provides separate data sets for sentiments that are negative and positive, and at the same time it separates these two data sets into anger, anticipation, sadness, joy, surprise, disappointment, trust, and fear. Each word of each tweet is separated into one or more of these emotions, thus generating a score for each of these, which is what ends up being a positive or negative sentiment.
A theoretical model to separate each of the emotions into negative and positive was proposed by [22], but they did not include certain emotions that were included in our study, such as anticipation. The proposed model is presented below in Figure 1.

3. Methodology

To the goal of this study was to determine the predominant sentiment and the most repetitive emotion through a sentiment analysis of the consumer electronics industry on Twitter. This research was developed through analysis with a quantitative, descriptive statistical approach, through Twitter API and R software. The period used for data extraction was from the week of 21 to 27 September 2020. From this, 3200 tweets were extracted per company, which would be approximately 96,000 total tweets. For all these tweets, the sentiment analysis managed to analyze 273,221 words in total.

Data

The industry investigated was consumer electronics, which encompasses many companies related to technological innovations worldwide [23]. From this industry, a sample was obtained comprising 30 companies selected from CES 2020, an event where the most important organizations in the world in the technological field were presented.
The 30 selected companies (Appendix A) were included in the R software, where the data were extracted using the verified accounts of each of these companies. Selected accounts were LG Electronics @LGUS, Huawei @Huawei, Samsung Electronics @Samsung, Sony @Sony, Xiaomi @Xiaomi, Motorola @Moto, HP @HP, ASUS @ASUS, Nokia @nokia, Microsoft @Microsoft, Dell @Dell, Lenovo @Lenovo, Intel @intel, Google @Google, AMD @AMD, Amazon @amazon, NVIDIA @nvidia, Logitech @logitech, Canon USA Corp. @canonusa, TCL USA @TCL_USA, Toshiba @toshibausa, OnePlus @oneplus, Philips @philips, Nintendo of America @nintendoamerica, NikonUSA @nikonusa, Bose @bose, Kodak @kodak, Panasonic Corp. @panasonic, Hitachi @hitachiglobal, and Pebble @pebble.
For the extraction of information from the research, different scripts were used to divide it into 4 parts, starting with the packages used in the R studio software (version), then the scripts that allow access to Twitter information through its free APIs, the extraction script of the tweets, ending with the scripts that allow the text to end up being analyzed by the software using the lexicon of emotions and sentiment created by the National Research Council Canada (NRC), which is available in 40 languages, so it can be used in other studies.
The packages mentioned above are described below. The first package is in Figure 2.
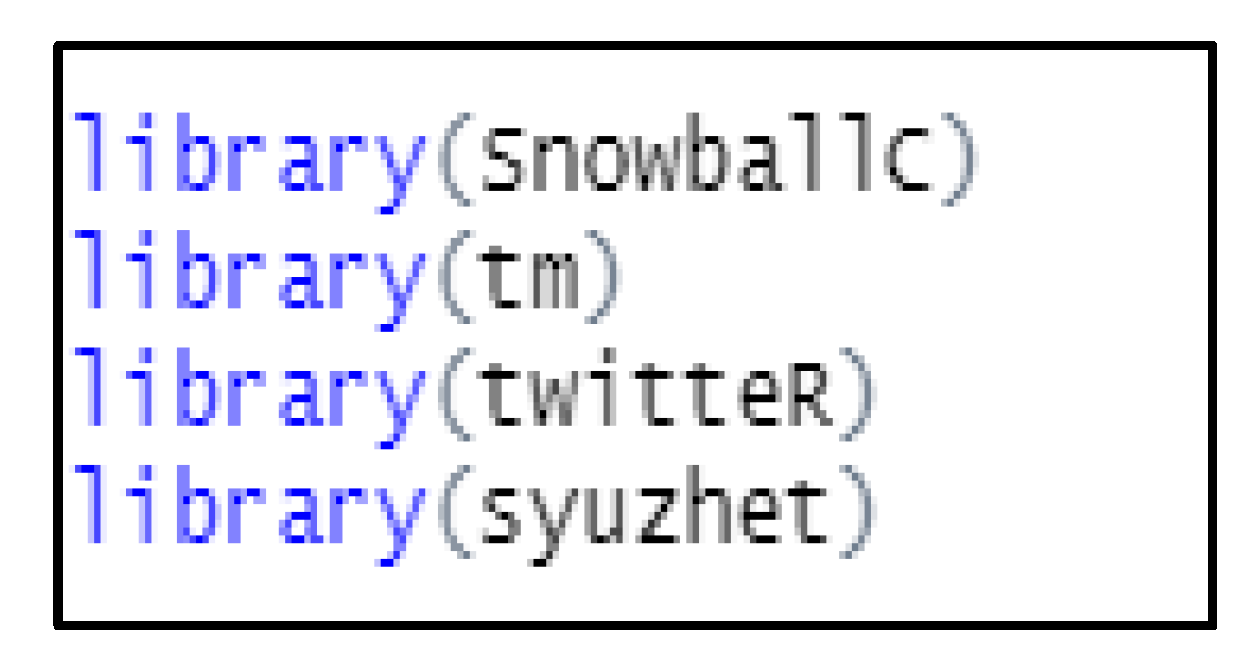
  • SnowballC created by Milan Bouchet-Valat (2020) aims to extract the words and analyze the text, it should be noted that this package includes different types of functions to use.
  • The tm package (text mining package) is another tool used for data mining, similar to SnowballC, it includes different types of functions to use.
  • The TwitterR package helps us to find all the information of a twitter user, such as the users, tweets, time of the tweet, and how many liked tweets. Similar to the previous packages, this one has its own functions to use.
  • The Syuzhet package is responsible for extracting the sentiments and emotions from the text filtered by the previous packages.
It should be noted that these packages have been essential to carry out this research and to obtain the results thereof, since each one fulfilled the function described above, greatly helping the ability to solve the objective of the research. (See in Figure 3).
The objective of this function is to access the information necessary for this research (in Figure 4), such as the tweets of each selected company, the tweets, URL, and unique ID number of the tweet, through the API provided by Twitter.
This function is the tool for extracting the tweets emitted by a Twitter account (in Figure 5). For example, the Samsung Company can extract a maximum of 3200 tweets since it is the maximum allowed by the API that Twitter gives us, since it is a search API.
After extracting the tweets, the function line n.tweet allows us to make sure we know the length of the tweets, that is, how many tweets were extracted from the @Samsung account. It should be noted that it will only show the number of tweets extracted, not the detailed tweets.
These lines of functions allow us to transform the information previously extracted into a spreadsheet with the tweets where we can find:
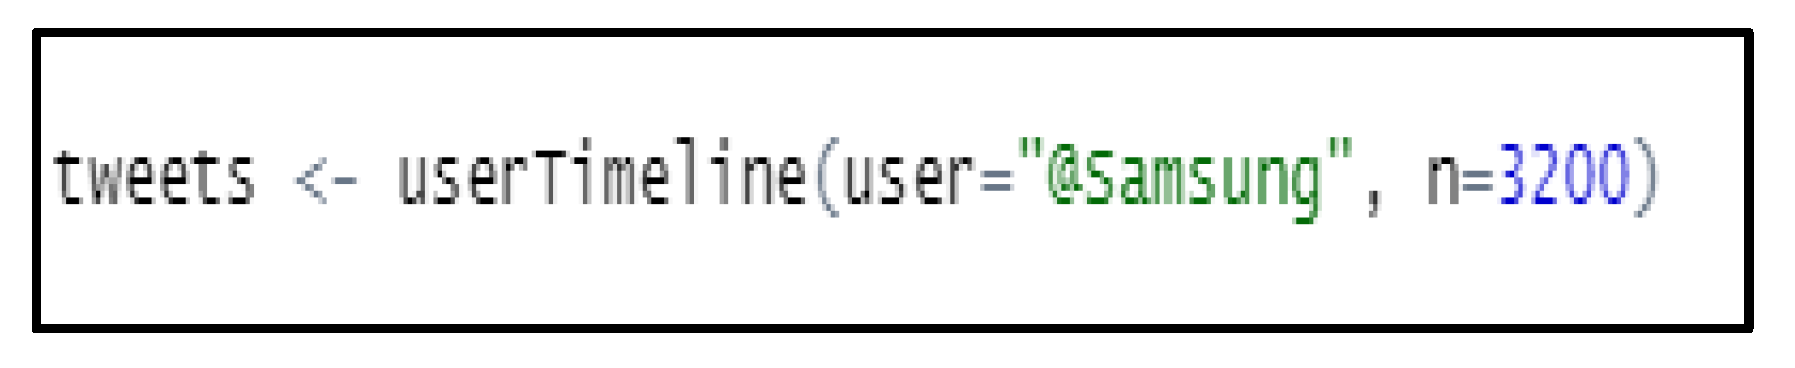
  • The text in the original tweet issued by the company.
  • If the company has favored its own tweet.
  • How many favorites that a particular tweet has had.
  • The exact date the tweet was created, which gives us information not only about the date the tweet was issued but also about the time it was issued.
  • The ID of the tweet, since each tweet has a unique ID, which consists only of numbers. (in Figure 5, Figure 6, Figure 7 and Figure 8).
In these lines of functions, we find different important factors for the investigation. In the first 6 lines, we find the cleaning functions for the tweets, that is, all punctuation marks, numbers, links, emoticons are eliminated. Once the tweet has been filtered and cleaned, the function for sentiment analysis is implemented, using get_nrc_ sentiment, analyzing each word of the tweets and classifying them according to the criteria of the nrc lexicon, and creating a data frame showing the eight sentiments and the positive and negative polarities, as can be seen in the following Figure 9.
As can be seen in Figure 9, in the first tweet, the lexicon rates three words with the following emotions: anticipation, joy, and surprise, and at the same time, those three words are rated according to their polarity, where the lexicon rates all three as positive words. Then, in the function line, we find the cbind code, that allows us to calculate the total sum of the sentiments and emotions found in the data frame of the tweets as seen in Table 1.

4. Research Findings

The following section is about the results of the research and contains a summary of the sentiment and eight emotions of all companies analyzed. In the following table xx, the total results of the investigation are presented, showing each of the emotions in color and classifying each of the companies on the “X” axis and the number of words analyzed in each of the companies on the “Y” axis.
Figure 10 shows the major companies with the number of words analyzed, for example Amazon, Logitech, Lenovo, and Nintendo equaling or exceeding 8000 words analyzed. As a first global analysis, it was observed that the most notable emotions are confidence, joy, and anticipation. To have more clarity on this, it was necessary to do a more in-depth analysis of tables.
Figure 11 presented a total summary of positive and negative sentiments, which are composed as a score based on the eight sentiments. With (Figure 10), it was observed that clearly, the predominant sentiment in each of the companies was positive, where the main companies above the 4000 score were Amazon and Huawei.
Figure 12 presented a summary of the number of words related to the eight different emotions in the research. The graph allows us to determine that the emotions that accumulated the greatest number of words were anticipation, joy, and trust.
Finally, from the results section, two figures related to emotions and companies were presented. First, a figure with eight different tables, each corresponding to an emotion. Each of these tables ranks the top five companies that had the most words based on sentiment.
Thus, the first table in Figure 12 was related to anger, where no company exceeded the amount of 1000 words and the company that had the highest amount was Nintendo, with 8.05% of the words related to anger.
Then, there was anticipation, where an increase in the number of words was observed, confirming the information obtained in Figure 10. In this table, the company that stood out the most in terms of the number of words was Amazon with 6.36% and followed by Nintendo with 5.17% related to anticipation.
The next emotion was disgust, this emotion had the lowest number of words compared to the other sentiments. In this emotion, the LGUS Company stood out with 12.9% of words related to disgust.
Then, fear was presented; two companies stood out for fear: Logitech and Nintendo, obtaining 7.93% and 7.61% of the words, respectively. It should be noted that Nintendo was already presented as one of the companies with the highest amount of anger and now in this case of fear as well.
The following table corresponds to the emotion of happiness, where, by a vast majority, the company that had the highest number of words was Amazon, with 10.15% of the total number of words. Similar to Nintendo in the previous situation, Amazon repeats in an emotion, but in this case with anticipation.
Then, the emotion of sadness was also presented, where the Logitech company stands out with 10.16% words related to sadness. This is also mentioned for the second time, since it also had the highest number of words relating to fear.
The next emotion was surprise, where the Amazon Company stood out for the third time with 7.34% of the words, and closely following this, Nintendo presented with 6.4% of words related to surprise.
And finally, there was the emotion of confidence, this being one of the emotions where more words were accumulated, with most companies contributing over 8000 words each. The company that accumulated the most words was LGUS, with 6.92% of words related to emotions.
As the last section of the results, an analysis of network graphics related to emotions and companies was carried out Figure 13. This exposed the top eight companies with the highest number of followers, how the words published in their tweets were classified, and which emotion they corresponded to.
Therefore, Figure 13 begins with the Google chart where the most prominent emotion was confidence. This was followed by Nintendo, where the most prominent emotion was anticipation. Then, Microsoft follows, with the most prominent emotion being trust. Then, Huawei follows, where the emotion of trust was highlighted. Intel followed next, where the most prominent emotion was trust. Then, Sony follows, with the most prominent emotion being anticipation. Next, Amazon followed, where the most prominent emotion was happiness. Finally, there was Xiaomi, where the most prominent emotion was anticipation.
With this, it was possible to determine that there was a clear trend between the major companies and the emotions that the analysis showed, since there was a constant repetition of the confidence and anticipation emotions.

5. Discussion

Social networks, in general, are products that help reinforce positive and/or negative habits, since many of these platforms facilitate users to live experiences, generate self-reflection, growth, and new learning, and more importantly, increase their degree of happiness [24]. Based on the above and the study carried out, the analyzed industry had a positive assessment, so that should lead to reinforcing these same types of habits. However, we cannot affirm that the publications made in the tweets of the different companies in the industry increase happiness thanks to a reinforcement of positive habits.
However, the foregoing does not remove the great importance of analyzing the sentiments and emotions of the publications (or in this case tweets) of users in different social networks, since thanks to these comments, it has sometimes been possible to predict the market for values [25]. Similarly, it has been suggested that Twitter mood predicts the stock market [26,27,28,29].
For this reason, companies must also pay special attention to the comments they make on their accounts and see what impact they generate.

6. Conclusions

In this study, the objective was to determine the predominant sentiment and prevailing emotions through a sentiment analysis of the consumer electronics industry on Twitter. It analyzed 96,000 tweets with a total of 273,221 words.
The main results of the sentiment and emotion analysis for this research identified that positive valuation predominates, and emotions such as anticipation and confidence were the most representative in this study.
This study provides strategic information about the feelings and emotions perceived in the global consumer electronics industry [30], which helps firms to make the right decisions to enhance customer attraction and loyalty strategies, using accessible, technological, and current tools such as the Twitter data language procedure. Proposed future lines of research are linked to the analysis of other social networks and economic activity, as well as carrying out the analysis with other software such as Python.

Author Contributions

Conceptualization, C.P.-F., D.G.-R. and S.M.-R.; methodology, D.G.-R., S.M.-R. and C.P.-F.; software, D.G.-R. and S.M.-R.; validation, C.P.-F., D.G.-R. and S.M.-R.; investigation, D.G.-R., S.M.-R. and C.P.-F.; data curation, D.G.-R. and S.M.-R.; writing—original draft preparation, D.G.-R., S.M.-R. and C.P.-F.; writing—review and editing, C.P.-F. supervision, C.P.-F. All authors have read and agreed to the published version of the manuscript.

Funding

This research received no external funding.

Institutional Review Board Statement

Not applicable.

Informed Consent Statement

Not applicable, works with secondary statistical data.

Data Availability Statement

Works with secondary statistical data.

Acknowledgments

The authors thank to the two anonymous referees for its suggestions that improve the work.

Conflicts of Interest

The authors declare no conflict of interest.

Appendix A

Name of the CompaniesName in Twitter
LG Electronics@LGUS
Huawei@Huawei
Samsung Electronics@Samsung
Sony@Sony
Xiaomi@Xiaomi
Motorola@Moto
HP@HP
ASUS@ASUS
Nokia@nokia
Microsoft@Microsoft
Dell@Dell
Lenovo@Lenovo
Intel@intel
Google@Google
AMD@AMD
Amazon@amazon
NVIDIA@nvidia
Logitech@logitech
Canon USA Corp.@canonusa
TCL USA@TCL_USA
Toshiba@toshibausa
OnePlus@oneplus
Philips@philips
Nintendo of America@nintendoamerica
NikonUSA@nikonusa
Bose@bose
Kodak@kodak
Panasonic Corp.@panasonic
Hitachi@hitachiglobal
Pebble@pebble
Source: Own elaboration.

References

  1. Marolt, M.; Zimmermann, H.D.; Žnidaršič, A.; Pucihar, A. Exploring social customer relationship management adoption in micro, small and medium-sized enterprises. J. Theor. Appl. Electron. Commer. Res. 2020, 15, 38–58. [Google Scholar] [CrossRef] [Green Version]
  2. Sanz, L. Análisis de redes sociales: O cómo representar las estructuras sociales subyacentes. Networks 2003, 7, 21–29. [Google Scholar]
  3. Obar, J.A.; Wildman, S.S. Social media definition and the governance challenge: An introduction to the special issue. Telecommun. Policy 2015, 39, 745–750. [Google Scholar] [CrossRef]
  4. Hossain, M.A.; Kim, M. A Comprehensive Study on Social Commerce in Social Networking Sites. SAGE Open 2020, 10. [Google Scholar] [CrossRef]
  5. Sánchez, R. Análisis de Sentimientos con Twitter: Turismo y Política Electoral. 2019, p. 96. Available online: https://idus.us.es/bitstream/handle/11441/90023/S%C3%A1nchez%20del%20Hoyo%20Rafael%20TFG.pdf (accessed on 1 February 2023).
  6. Zhang, Q.; Zhang, Z.; Yang, M.; Zhu, L. Exploring Coevolution of Emotional Contagion and Behavior for Microblog Sentiment Analysis: A Deep Learning Architecture. Complexity 2021, 2021, 6630811. [Google Scholar] [CrossRef]
  7. Egaña, F.; Pezoa-Fuentes, C.; Roco, L. The Use of Digital Social Networks and Engagement in Chilean Wine Industry. J. Theor. Appl. Electron. Commer. Res. 2021, 16, 1248–1265. [Google Scholar] [CrossRef]
  8. Kalia, G. A research paper on social media: An innovative educational tool. Issues Ideas Educ. 2013, 1, 43–50. [Google Scholar] [CrossRef]
  9. González, S.C.; Maroto, J.L.S.F. Selfies, young people and sexuality in instagram: Self—Representation on image format. Pixel-Bit. Pixel-Bit, Rev. Medios y Educ. 2018, 52, 167–181. [Google Scholar] [CrossRef]
  10. Sarlan, A.; Nadam, C.; Basri, S. Twitter sentiment analysis. In Proceedings of the 6th International Conference on Information Technology and Multimedia at UNITEN: Cultivating Creativity and Enabling Technology Through the Internet of Things, ICIMU 2014, Putrajaya, Malaysia, 18–20 November 2014; Volume 2015, pp. 212–216. [Google Scholar] [CrossRef]
  11. Kujur, F.; Singh, S. Visual communication and consumer-brand relationship on social networking sites-uses & gratifications theory perspective. J. Theor. Appl. Electron. Commer. Res. 2020, 15, 30–47. [Google Scholar]
  12. Dasilva, J.P.; Genaut Arratibel, A.; Ayerdi, K.M.; Galdospin, T.M.; Castillo, Í.M.; Mardaras, L.I.; Santamarina, D.R. Las empresas en Facebook y Twitter. Situación actual y estrategias comunicativas. Rev. Lat. Común. Soc. 2013, 68, 20–30. [Google Scholar] [CrossRef] [Green Version]
  13. Batool, R.; Khattak, A.M.; Maqbool, J.; Lee, S. Precise tweet classification and sentiment analysis. In Proceedings of the 2013 IEEE/ACIS 12th International Conference on Computer and Information Science (ICIS), Niigata, Japan, 16–20 June 2013; pp. 461–466. [Google Scholar]
  14. Zhang, M.; Jansen, B.J.; Chowdhury, A. Business engagement on Twitter: A path analysis. Electron. Mark. 2011, 21, 161–175. [Google Scholar] [CrossRef]
  15. Gao, J.; Zhang, C.; Xu, Y.; Luo, M.; Niu, Z. Hybrid microblog recommendation with heterogeneous features using deep neural network. Exp. Syst. Appl. 2021, 167, 114191. [Google Scholar] [CrossRef]
  16. Jansen, B.J.; Zhang, M.; Sobel, K.; Chowdury, A. Twitter power: Tweets as electronic word of mouth. J. Am. Soc. Inf. Sci. Technol. 2009, 60, 2169–2188. [Google Scholar] [CrossRef]
  17. Campan, A.; Atnafu, T.; Truta, T.M.; Nolan, J. Is Data Collection through Twitter Streaming API Useful for Academic Research? In Proceedings of the 2018 IEEE International Conference on Big Data (Big Data), Seattle, WA, USA, 10–13 December 2018; Volume 2019, pp. 3638–3643. [Google Scholar] [CrossRef]
  18. Alsaeedi, A.; Khan, M.Z. A study on sentiment analysis techniques of Twitter data. Int. J. Adv. Comput. Sci. Appl. 2019, 10, 361–374. [Google Scholar] [CrossRef] [Green Version]
  19. Pang, B.; Lee, L. Opinion mining and sentiment análisis. Comput. Linguist. 2009, 35, 311–312. [Google Scholar]
  20. Priyavrat; Sharma, N. Sentiment Analysis using tidytext package in R. In Proceedings of the ICSCCC 2018—1st International Conference on Secure Cyber Computing and Communications, Jalandhar, India, 15–17 December 2018; pp. 577–580. [Google Scholar] [CrossRef]
  21. Kiritchenko, S.; Zhu, X.; Cherry, C.; Mohammad, S. NRC-Canada-2014: Detecting aspects and sentiment in customer reviews. In Proceedings of the 8th International Workshop on Semantic Evaluation (SemEval 2014), Dublin, Ireland, 23–24 August 2014; pp. 437–442. [Google Scholar]
  22. Roberts, K.; Roach, M.A.; Johnson, J.; Guthrie, J.; Harabagiu, S.M. EmpaTweet: Annotating and Detecting Emotions on Twitter. Lrec 2012, 12, 3806–3813. [Google Scholar]
  23. Janse, B.; Schuur, P.; de Brito, M.P. A reverse logistics diagnostic tool: The case of the consumer electronics industry. Int. J. Adv. Manuf. Technol. 2010, 47, 495–513. [Google Scholar] [CrossRef]
  24. Vizcaino-Verdu, A.; Aguaded, I. Análisis de sentimiento en Instagram: Polaridad y subjetividad de cuentas infantiles. ZER-Rev. Estudios Común. 2020, 25, 213–229. [Google Scholar] [CrossRef]
  25. Bollen, J.; Mao, H.; Zeng, X. Twitter mood predicts the stock market. J. Comput. Sci. 2011, 2, 1–8. [Google Scholar] [CrossRef] [Green Version]
  26. Obaidi, M.; Klünder, J. Development and application of sentiment analysis tools in software engineering: A systematic literature review. Eval. Assess. Softw. Eng. 2021, 80–89. [Google Scholar] [CrossRef]
  27. Hajiali, M. Big data and sentiment analysis: A comprehensive and systematic literature review. Concurr. Comput. Pract. Exp. 2020, 32, e5671. [Google Scholar] [CrossRef]
  28. Kumar, A.; Jaiswal, A. Systematic literature review of sentiment analysis on Twitter using soft computing techniques. Concurr. Comput. Pract. Exp. 2020, 32, e5107. [Google Scholar] [CrossRef]
  29. Jain, P.K.; Pamula, R.; Srivastava, G. A systematic literature review on machine learning applications for consumer sentiment analysis using online reviews. Comput. Sci. Rev. 2021, 41, 100413. [Google Scholar] [CrossRef]
  30. Garcia-Rivera, D.; Matamoros-Rojas, S.; Pezoa-Fuentes, C.; Veas-González, I.; Vidal-Silva, C. Engagement on Twitter, a Closer Look from the Consumer Electronics Industry. J. Theor. Appl. Electron. Commer. Res. 2022, 17, 558–570. [Google Scholar] [CrossRef]
Figure 1. Emotions based on [22]. Source: our elaboration based on [22].
Jtaer 18 00039 g001
Figure 2. Function 01.
Jtaer 18 00039 g002
Figure 3. Function 02.
Jtaer 18 00039 g003
Figure 4. Function 03.
Jtaer 18 00039 g004
Figure 5. Function 04.
Jtaer 18 00039 g005
Figure 6. Function 05.
Jtaer 18 00039 g006
Figure 7. Emotions.
Figure 7. Emotions.
Jtaer 18 00039 g007
Figure 8. Example analysis of emotions.
Jtaer 18 00039 g008
Figure 9. Companies and emotions.
Jtaer 18 00039 g009
Figure 10. Positive and negative.
Jtaer 18 00039 g010
Figure 11. Summary emotions.
Jtaer 18 00039 g011
Figure 12. Emotion per company by number of followers.
Jtaer 18 00039 g012
Figure 13. Emotions by companies (2).
Jtaer 18 00039 g013
Table 1. Emotions grouping of the lexicon.
EmotionTotal
Anger Anticipation117
Disgust796
Fear62
Joy225
Sadness523
Surprise119
Trust226
Negative817
Positive209
1738
Disclaimer/Publisher’s Note: The statements, opinions and data contained in all publications are solely those of the individual author(s) and contributor(s) and not of MDPI and/or the editor(s). MDPI and/or the editor(s) disclaim responsibility for any injury to people or property resulting from any ideas, methods, instructions or products referred to in the content.

