Article

Rural E-Customers’ Preferences for Last Mile Delivery and Products Purchased via the Internet before and after the COVID-19 Pandemic

by
Małgorzata Markowska
1,
Jakub Marcinkowski
2,*,
Maja Kiba-Janiak
2 and
Danuta Strahl
3
1
Department of Regional Economy, Wroclaw University of Economics and Business, Komandorska 118/120, 53-345 Wroclaw, Poland
2
Department of Strategic Management and Logistics, Wroclaw University of Economics and Business, Komandorska 118/120, 53-345 Wroclaw, Poland
3
Department of Management, WSB University, Cieplaka 1C, 41-300 Dabrowa Gornicza, Poland
*
Author to whom correspondence should be addressed.
J. Theor. Appl. Electron. Commer. Res. 2023, 18(1), 597-614; https://doi.org/10.3390/jtaer18010030
Submission received: 27 November 2022 / Revised: 8 March 2023 / Accepted: 9 March 2023 / Published: 11 March 2023

Abstract

:
The purpose of this paper is to assess the impact of the COVID-19 pandemic on rural e-customers’ preferences in terms of last mile delivery and products purchased via the Internet. This paper is based on the theory of last mile delivery (with a strong focus on the methods of delivery) and customers’ preferences. It combines both theories to fulfil the paper’s goal. In the paper, the literature review and multivariate data analysis of rural e-customers in Poland were used. The hypothesis states that there is a requirement for different last mile delivery solutions in rural areas than in urban areas in Poland. The research was carried out on a sample of 1071 adult Poles, who are residents of rural areas, using the standardized and structured computer-assisted interview (CAWI). The authors used the chi-square independence test, the Student t-test, one-way analysis of variance (ANOVA), regression models, and logistic models. The research shows that more than 60% of respondents living in rural areas order goods purchased online with a home delivery method and that online shopping preferences’ changes are not so significant after the occurrence of COVID-19. Both before and after the pandemic, rural e-customers made online purchases most often 2–3 times a month. Nevertheless, some differences in the preferences of rural e-customers in terms of last mile delivery and purchasing preference can be seen considering their age, gender, or family size. The survey found that smaller families were more likely to choose free home delivery with a free return after the pandemic. The research presented in this paper provides essential information for courier companies, stores, and online platforms alike. Knowledge of preferences and their changes after the occurrence of COVID-19 can support the reorganization of last mile delivery to meet the needs of e-customers and to adapt to the increasing demands for sustainable transportation.

1. Introduction

1.1. E-Commerce Market and the COVID-19 Pandemic

The e-commerce market faced fast-growth since the beginning of the COVID-19 pandemic [1]. Such a situation shifts e-customers behaviour which results in the necessity of structural changes in various last mile delivery stakeholders. Those changes were only enhanced by the pandemic—the constant tendency of the increased deliveries in the e-commerce market was a result of the congestion, air pollution, noise, and challenges in ensuring the quality of life [2]. Currently, e-customers, both in cities and rural areas, started to make online purchases more frequently. E-shops and CEP companies (courier, express, and parcel) modified their business models offering a wider range of products available to buy via the Internet and a diversified method of delivery based on the e-customers’ expectations. It is all the more justified due to the value of the e-commerce market increase that makes Poland the third top European country in terms of online purchases increase since the beginning of the COVID-19 pandemic [3].
The literature faces a huge increase in publications focusing on last mile deliveries in cities [4,5,6,7,8,9,10]. However, there is less research focusing on rural last mile deliveries [11,12,13,14,15]. The rural logistics perspective on the last mile delivery in the e-commerce market can be treated as “planning, implementing, coordinating, and controlling processes in rural areas related to the last mile delivery of goods purchased online” [11]. COVID-19 has exacerbated the spatial exclusion of people living in rural areas, and thus, has led to greater interest in online shopping among this social group, and has influenced changes in their preferences for choosing the delivery method for goods purchased online. Nonetheless, there is no doubt that the e-commerce market is influenced by the COVID-19 pandemic [1].

1.2. Rural Areas

The definition of rural areas came from the Polish Statistical Office [16], and is based on the territorial division of the country using identifiers of the National Official Register of the Territorial Division of the Country (TERYT). Therefore, rural areas are areas beyond the administrative borders of cities, which consist of rural communes and rural parts of urban-rural communes. Rural areas cover 93% of Poland’s area and are inhabited by 40% of the population (as of 2020). In those areas, there is a higher percentage of the pre-working age population, thus, rural inhabitants are younger than the urban population in Poland (median age 39.8 vs. 42.8). The economically active population is over half of the people aged 15 years and older. There is also a higher employment rate than in urban areas (54.5% vs. 54.2%) and an unemployment rate in the pre-COVID era (3.3% vs. 3.1%). Most people in rural areas work in companies in the production sector, every third in the services sector, while agriculture has lower shares. Interestingly, the available income per capita in rural areas increased in the last 10 years of over 25%, but it is still lower than in urban areas of Poland. There is also a difference in the Gini coefficient (0.310 vs. 0.301). In Polish rural areas, there are disproportions in access to services and infrastructure in comparison to urban areas, e.g., access to a mobile network is a bit lower (97.6% vs. 98.3%). There is also an underdeveloped manner of public services (e.g., education and health) and private investments (more data and information regarding the state of the Polish rural areas in [16]). All of the above constitutes an interesting field of research composed of various gaps.

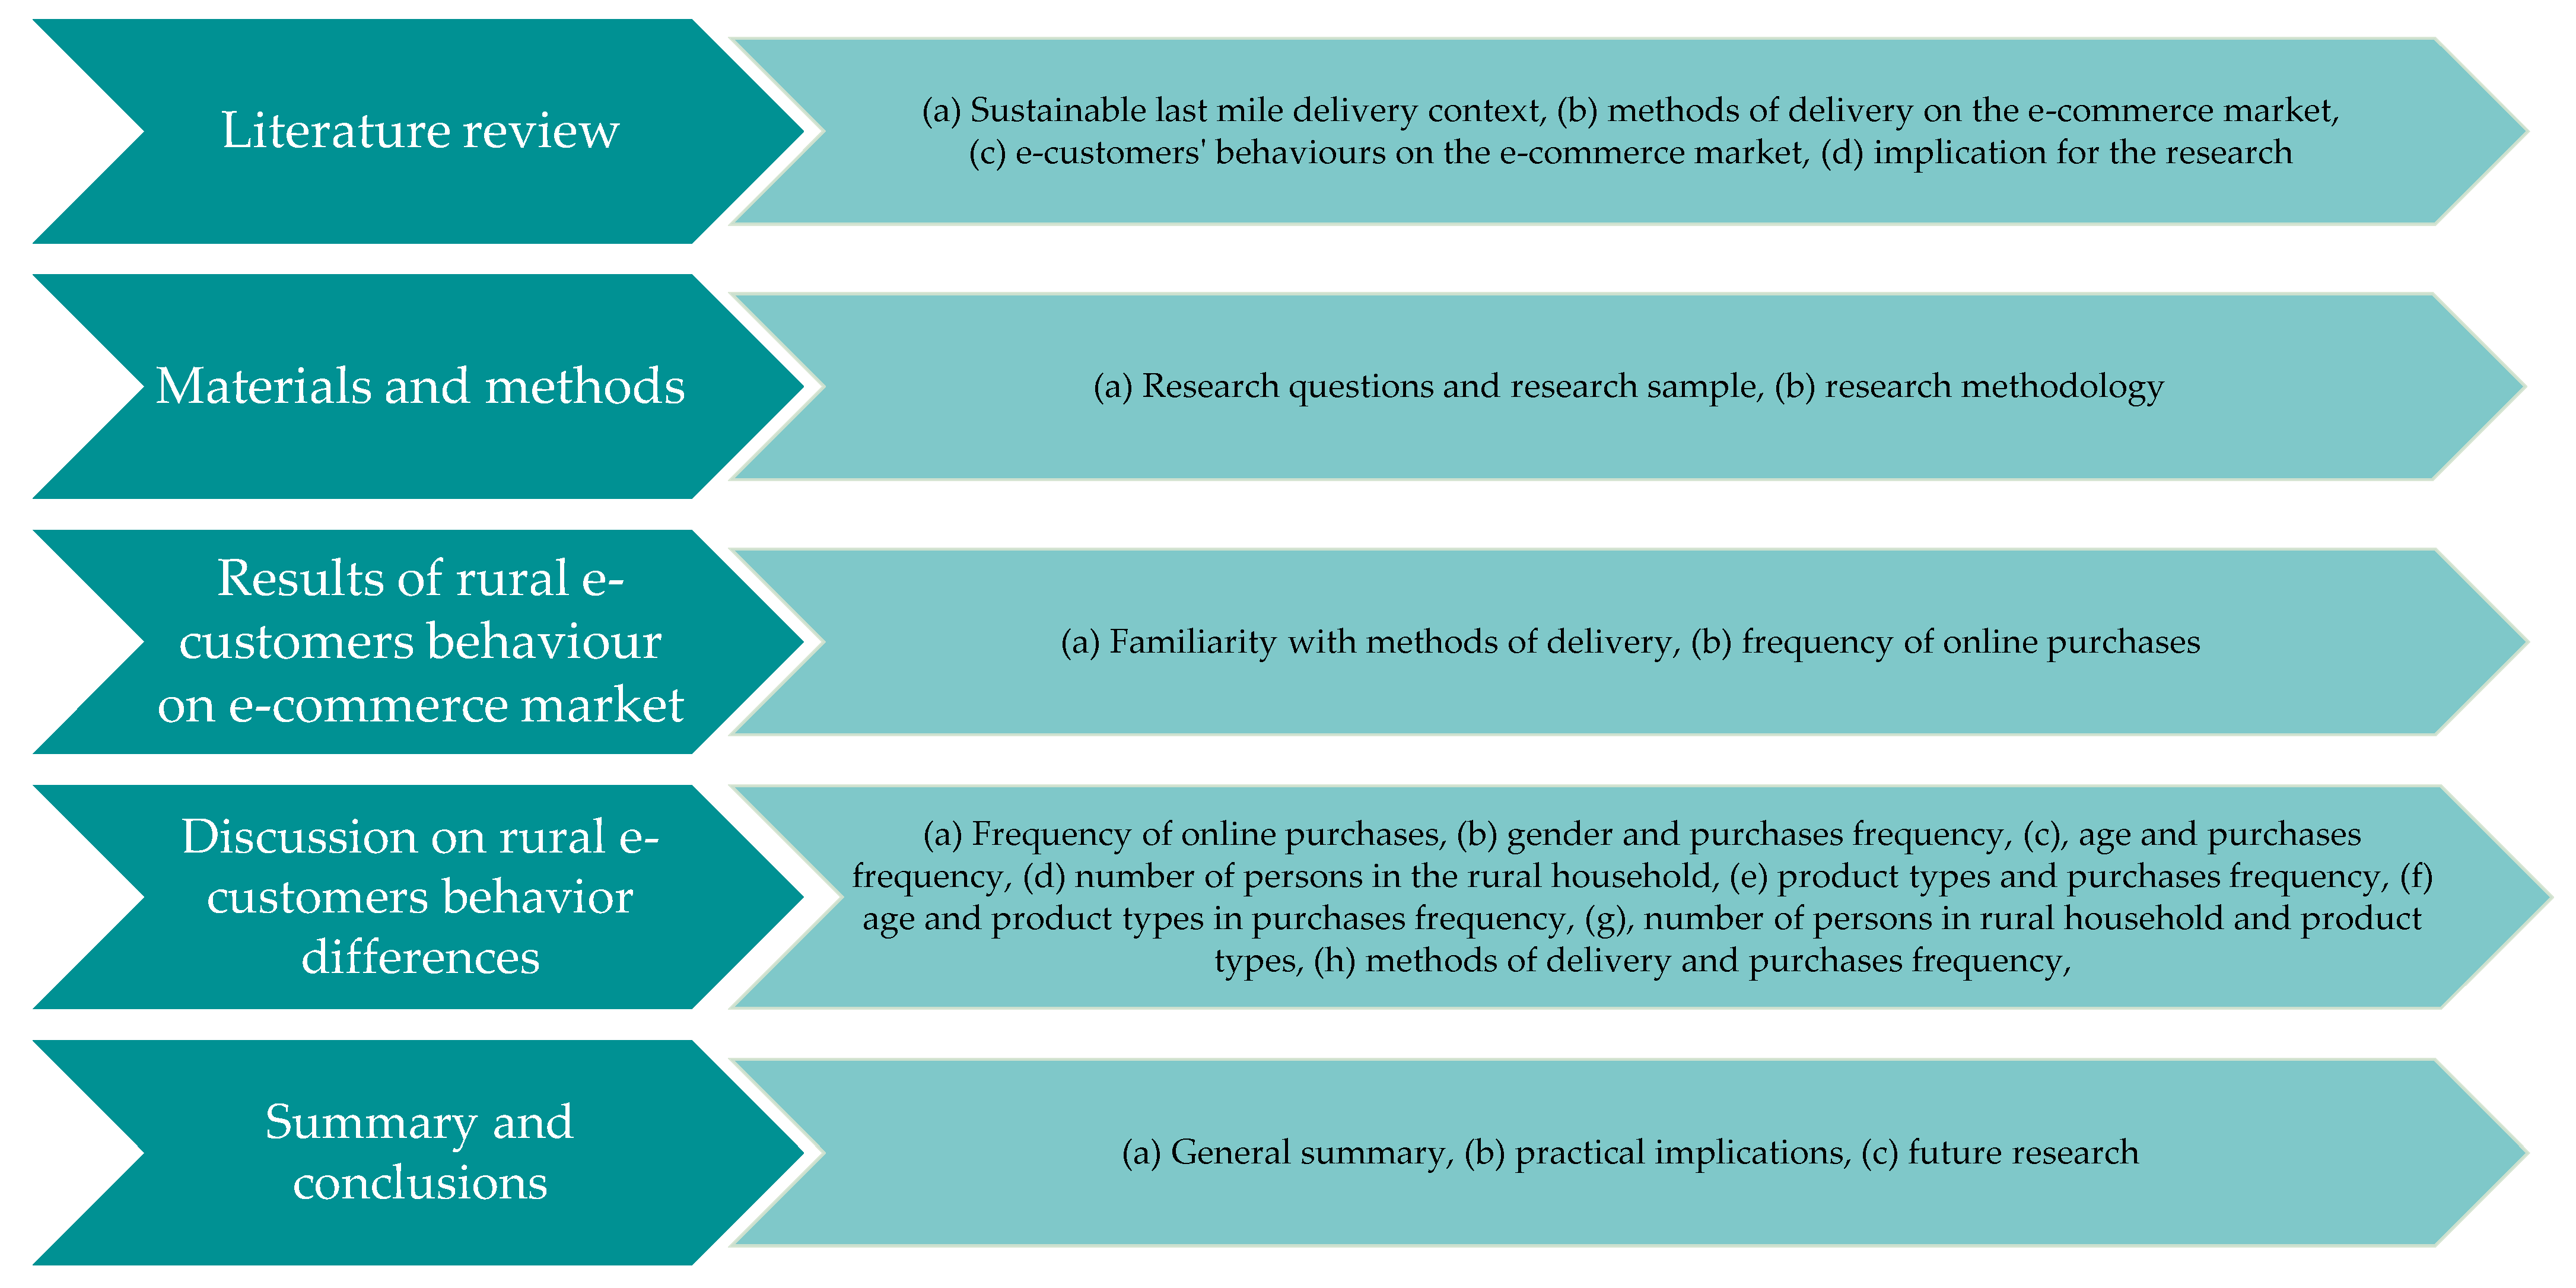
1.3. Research Aim and Procedure

Therefore, this paper fulfils a research gap, which is the lack of identified preferences of spatially excluded e-customers living in rural areas in terms of their choice of method of delivery for goods purchased online.
The research aims to assess the impact of the COVID-19 pandemic on rural e-customers’ preferences in terms of last mile delivery and products purchased via the Internet. The authors developed three research questions: (a) what are the preferences of rural e-customers concerning online purchases (types of products)? (b) what are the choices of the methods of delivery of purchased products? and (c) what are changes in the frequency of purchases? The above-mentioned questions tend to narrow the research aim and fulfil the research gap. They will help understand how online purchases have changed among rural e-customers after the onset of COVID-19, and what method of delivery is preferable for online purchases in rural areas. Finally, it will allow for the defining of the managerial implications of the existing last mile delivery preferences of rural e-customers (see research methodology in Figure 1). Therefore, the authors of the paper formulate the following hypothesis: there is a requirement for different last mile delivery solutions in rural areas than in urban areas in Poland.
In the paper, the literature review and multivariate data analysis of rural e-customers in Poland were used. The research was carried out on a sample of 1071 adult Poles, residents of rural areas, using the standardized and structured computer-assisted interview (CAWI) in April 2022. The authors used the chi-square independence test, the Student t-test, one-way analysis of variance (ANOVA), regression models, and logistic models.
The remaining part of the paper is structured as follows: the second section contains a literature review, the third one material and methods, then results, discussion, and finally, summary with conclusions.

2. Literature Review

2.1. Sustainable Last Mile Delivery Context

For the past few years last mile delivery issues in the e-commerce market have become increasingly important [9,17], especially due to its focus on the sustainable context that in cities concerns the “planning, implementing, coordinating, and controlling of processes on urbanized areas related to the last mile delivery of goods purchased online with the accompanying information, to reduce costs, reduce environmental degradation and increase road safety, obtained as a result of a compromise developed among the diverse preferences of stakeholders” [5]. Due to increasing online shopping and changing expectations of e-customers [18], courier companies face many challenges. This requires courier companies to be aware of customers’ last mile delivery and purchasing preferences to fulfil their needs. This issue became even more important after COVID-19 occurred. Since that time, a wide range of disruptions for supply chains, including last mile delivery, had been seen in the demand and supply sides [19,20,21,22]. Discussion on methods of delivery during the COVID-19 pandemic is visible in the subject literature. It is mainly due to the huge increase in online purchases as a result of the mobility restrictions (no possibility to go to the physical store) implemented during lockdowns. Thus, people’s preferences focused on staying home rather than going to physical stores [23], which makes a substantial change in urban mobility [24].

2.2. Methods of Delivery in the E-Commerce Market

Methods of delivery can be grouped into two main categories: home deliveries and out-of-home deliveries. Home delivery, also called door-to-door delivery, requires e-customers to be present at the place of the delivery [25], such as at home, workplace, or neighbour’s home [25,26]. Such deliveries are preferable in rural areas as a result of the well-operating structure of logistics service providers [27]. On contrary, out-of-home delivery is defined as a shipment to a convenient place of delivery for the e-customer [25], such as a parcel locker [17,28], home parcel drop box [8], drop off point [25,29], or click and collect [30,31]. Parcel lockers are very popular in Poland, and, what is interesting cognitively, could lower delivery costs in both urban and rural areas [15]. More in-depth categories of methods of delivery for rural e-customers in Poland have been presented by Markowska and Marcinkowski [11], who distinguished three methods within home deliveries (by courier, by the post office, and free home delivery with the possibility of free return), and four methods within out-of-home deliveries (parcel locker, pickup at the post office, click and collect, and kiosk/shop or other pickup point). Nonetheless, there is a different perspective on the sustainability of delivery methods in rural and urban areas. While parcel lockers are treated as sustainable in cities [25], in rural areas, it can be home deliveries, which is a result of the lower density of collection points (and parcel lockers) and a higher percentage of dedicated trips required by rural inhabitants. Such a situation increases the external costs of transport for rural e-customers. Especially when low-density levels, demographics, and socioeconomic dimensions impose challenges in last mile delivery [14].
The existing research in the subject literature suggests a difference in the preferred method of delivery in pre-pandemic and after COVID-19 periods. In the pre-pandemic period, innovative solutions in the method of delivery focused on parcel lockers and crowdsourcing logistics [32]. Nonetheless, several innovative solutions in last mile delivery have been implemented as a consequence of the COVID-19 pandemic, e.g., the so-called mobile warehouse that is seen as an effective solution to last mile delivery challenges during the pandemic [33]. Such a mobile warehouse could be treated as a mobile hub or parcel locker located in a place of increased demand for deliveries.

2.3. E-Customers’ Behaviours in the E-Commerce Market

The COVID-19 pandemic resulted in a change in e-customers’ behaviours, e.g., increased online shopping is visible through doubled parcels delivered in the case of Madrid, Spain [24]. The wide impact of the pandemic on the economy forced stakeholders of the last mile delivery to implement alternative (and innovational) solutions. Most of all, last mile deliveries in the e-commerce market started to be contactless and safe for e-customers. Introducing a mobile application to pick up packages in parcel lockers is a solution that increased the security of e-customers [34]. The implementation of autonomous delivery robots increased both safety and improved low-carbon logistics [35]. Artificial intelligence can enhance supply chain resilience in ensuring last mile delivery while the other four areas refer to transparency, personalized solutions, minimizing the impact of disruptions, and facilitation of agile strategies [36]. Nonetheless, robotic automation is important since the beginning of the COVID-19 pandemic due to contactless deliveries and flexibility [37]. On the other hand, crowd shipping gained popularity by fulfilling heterogenous delivery requests—“occasional drivers with destinations far from the depot reduce the cost by over 30%, while occasional drivers with destinations that are near the depot reduce the cost by 20%” [23].
The literature distinguishes a few impactful criteria for e-commerce since the beginning of the COVID-19 pandemic, which are delivery time, order fulfilment, the convenience of payment, and real-time tracking [38]. Accordingly, analyses focus on changes in the different types of products ordered via the Internet. Such an analysis can be focused on, e.g., the impact of e-groceries increase on the environment. One research indicated that e-customers react differently to various alternative grocery shopping channels and delivery preferences such as self-delivery, home delivery, or click and collect [39]. Management innovation has become an important link in the context of the role and the place of e-customers in last mile deliveries [40].

2.4. Implication for the Research

The state-of-the-art informs that there are different perspectives on the last mile deliveries in urban and rural areas. However, they are both similarly founded on the same categories of methods of delivery and the COVID-19 impact, there are different motives for choosing a particular method. It is a result of the spatial exclusion of rural e-customers, different socioeconomic perspectives, and local infrastructure investments. Serving rural markets efficiently requires some solutions in the field of frequency of deliveries, supporting out-of-home methods of delivery, payment options, outsourcing, flexibility with stakeholders’ relations, and focus on the individual rural e-customer [14]. Meeting their needs and reviving infrastructure construction is also suggested by [40]. However, among the most impactful criteria since the onset of COVID-19 are delivery time, order fulfilment, payment method, and real-time tracking [38].
The research in the paper was undertaken based on the above-mentioned literature review on three levels: (a) preferences of rural e-customers, (b) methods of delivery, and (c) frequency of purchases. Those levels are addressed with the three research questions presented in the introduction section.

3. Material and Method

3.1. Research Questions and Sample

The research aims at assessing the impact of the COVID-19 pandemic on rural e-customers’ preferences in terms of last mile delivery and products purchased via the Internet. The authors developed three research questions: (a) what are the preferences of rural e-customers concerning online purchases (types of products)? (b) what are the choices of the methods of delivery of purchased products? and (c) what are changes in the frequency of purchases? The research was carried out as part of a project in which a group of researchers cooperated with, among others, the Wroclaw University of Economics and Business, Copenhagen Business School, and other members of the European consortium (educational and research institutions from Poland, Sweden, Germany, Italy, Spain, Czech Republic, Denmark, and Norway). Residents of rural areas in Poland were asked about previous experiences related to online shopping (before the COVID-19 pandemic) and changes in their preferences since the pandemic occurred. Respondents were asked about choices regarding the methods of delivery of products purchased online and the types of products they buy via the Internet. The research was carried out on a sample of 1071 adult Poles, residents of rural areas, using the standardized and structured computer-assisted interview (CAWI) method in April 2022.
When selecting respondents for the study, quota selection was applied to the stratum. Such a method of selecting units for the study allows for a quasi-representative sample. During the study, the place of residence (a village located in one of the 16 provinces in Poland), and their gender and age were controlled. The structure of the sample in terms of these three selection criteria corresponds to the structure of the population.
The inhabitants of Lubuskie (2.3% of all), Opolskie and Podlaskie (3.1% each), Zachodniopomorskie (3.2%), and Warmińsko-Mazurskie (3.8%) provinces had the smallest share in the sample, while the largest, with more than 10% inhabitants had Wielkopolskie (10.6%), Małopolskie (11.3%), and Mazowieckie (12.5%) provinces.
During the assessment of the changes in the preferences of rural e-customers, as to the choice of the method of delivery and the products purchased online before and after the COVID-19 pandemic, the following statistical features were used:
  • gender: in the study group there were 528 men and 543 women,
  • age: age groups (18–24, 25–34, 35–44, 45–54, 55–64, and 65 years old) as a continuous variable (number). Most people are in the groups 35–44 years old and 65 years old and older (nearly 20% each), and the average age of the respondents is 46.2 years,
  • education level, according to the following variants: lack of formal education, upper primary school, high school, bachelor’s degree, master’s degree, professional title, engineer, a doctoral degree, other. More than half of the respondents were graduates of secondary schools,
  • number of persons in the rural household: 1, 2, 3, 4, 5, 6, 7, 8, and 9. More than twenty per cent of households were two-(27.4%), three-(23.0%), and four-person (23.3%),
  • the population in the place of residence: <500, <1000, <2000, <3000, <5000, and <20,000. A total of 75% of the respondents lived in rural areas of up to 3000 inhabitants,
  • the number of neighbours living within a radius of 150 m in the following classes: less than 7, 7–10, 11–20, and 21–99, and more than 100. A total of 34.6% were respondents indicating that 21–99 people were living within a radius of 150 m.
The research aims identified at the beginning of the section tend to identify factors relevant to the examined attitudes of rural e-customers as to the choice of the method of delivery, the change in the frequency of online purchases, and the type of products purchased via the Internet before and after the COVID-19 pandemic. A comprehensive description of the research sample was presented in [11].

3.2. Research Methodology

Respondents’ answers to the presented-above questions were coded as dummy variables. In the case of answering the question about the use of different ways of picking up the parcel when out-of-home delivery is conducted, only those respondents who previously declared that they knew about the existence of a given method of delivery were considered, hence in the tables illustrating the results, the total number of observations does not have to be the same. The basic significance level was alpha = 0.05; however, significant variables at the level of alpha = 0.1 were also qualified for the initial list of explanatory variables in the models.
In the identification of relationships between qualitative variables, the chi-square independence test was used. If, for the approach using all variants of qualitative variables, at least poor statistical significance was obtained (0.05 < p < 0.1), the appropriate percentages in the contingency table were analysed, and certain variants (classes) were combined. In the case of comparing two groups in terms of a quantitative feature (they were usually created based on selecting/not selecting a given response option by the respondent), the Student t-test for two average values was applied, using a separate variance estimation for both groups. For these data, a large sample size allowed us to use the properties of the robustness of this test to possible deviations of the distribution of the examined features from the normal one.
Regarding the comparison of the means calculated for at least three groups, a one-way analysis of variance (ANOVA) was used. With overall significance, an attempt was also made to combine the classes of the grouping variable with similar mean values. The strength and direction of the relationship between quantitative variables were assessed by the coefficient of linear correlation and testing for its significance. Regression models were built for factors demonstrating statistical significance. Logistic regression for explanatory dummy variables and linear regression for quantitative variables.

4. Results of Rural E-Customers’ Behaviour on the E-Commerce Market

4.1. Familiarity with Methods of Delivery

Rural e-customers’ answers to questions about methods of delivery were used as variables characterizing the attitudes related to online purchases, i.e., the choice of the type of products and the method of delivery in the period before and after the COVID-19 pandemic occurred (in brackets the percentages are given—the first counted from the total number of respondents, and the second from those who know the number of indications):
  • home delivery: courier directly to home/work (known—92.1/used—94.7),
  • home delivery: by post office directly to home/work (known—70.9/used—83.1),
  • out-of-home delivery: pickup in a parcel locker (known—84.4/used–89.2),
  • out-of-home delivery: pickup at the post office (known—63.8/used—63.7),
  • out-of-home delivery: pick up in the store where the online purchase was made (click and collect) (known—46.5/used—53.4),
  • out-of-home delivery: pickup at a kiosk/shop or another collection point (known—50.8/used—64.0),
  • home delivery: free home delivery with free return option (known—51.7/used—61.0).

4.2. Frequency of Online Purchases

The frequency of purchases made by rural e-customers in the period before and after the COVID-19 pandemic occurred was also assessed (see Table 1).
The decrease in the percentage of respondents declaring a given frequency of purchases was noted in the indications of those who very rarely, rarely, and sometimes ordered products via the Internet. On the other hand, the increase among those who bought often and very often before the pandemic is noticeable. Consequently, changes in the share of online purchases carried out by the rural e-customers in the specific types of products in the period before and after the COVID-19 pandemic occurred were also examined (see Table 2).
In each type of product, the most indications concerned answer “no change,” from 61.2% for clothing to 78.1% for agricultural products. However, the total percentage of indications increased (a little, increased, and significantly increased) for each type of product in the following levels:
  • entertainment—17.9%,
  • clothing—27.6%,
  • furniture—12.5%,
  • free time—20.9%,
  • everyday products—23.3%,
  • RTV/household appliances—18.4%,
  • food products—15.8%,
  • garden articles—19.8%,
  • agricultural products—10.0%.
The research also assessed the change in the choice of the method of delivery of products purchased via the Internet by rural e-customers after the COVID-19 pandemic occurred (see Table 3). The same frequency of using particular methods of delivery since the beginning of the COVID-19 pandemic as before is indicated by the largest number of respondents. This ranges from 41.5% (pickup at a kiosk/shop or other pickup points) to 68.6% for courier delivery directly to home/work. One in four rural e-customers indicates more frequent use of personal pickup in a parcel locker since the pandemic occurred. This method of delivery minimized (or eliminated) the possibility of personal contact with the courier or e-shop worker, but also allowed them to “break” the rules of isolation (rural e-customer could get out of their homes to pick up the parcel by themselves).
In Appendix A and the interpretation of the results, attention was paid to factors indicating a statistically significant differentiating impact.

5. Analysis of Rural E-Customers’ Behaviour Differences before and after the COVID-19 Pandemic

5.1. Frequency of Online Purchases

The conducted research shows that both before and after the COVID-19 pandemic occurred, the surveyed rural e-customers made purchases via the Internet most often 2–3 times a month; it was 45.8% and 44.0%, respectively. Overall, the majority of respondents did not change the frequency of purchases (750/1071 or 70.0%). The fact that they make purchases less frequently during the COVID-19 pandemic than before the pandemic occurred was indicated by 65 respondents (6.1%), while more often was indicated by 256 respondents (23.9%). Nonetheless, some changes are visible. Every third rural e-customer who purchased products online once a month increased the frequency to 2–3 times a month, and every fifth of those who bought 2–3 times a month during the pandemic increased their purchases to 1–2 times a week. However, it was much less intense to reduce the frequency of purchases, for example, from 1–2 times a week to 2–3 times a month—13.8% (see Table 1 and Table 4). In Table 4, the frequency of purchases is numbered below the main diagonal (those marked in green).

5.2. Gender and Purchases Frequency

In addition to the declarations on the frequency of purchases, changes in buying products via the Internet were also considered, and divided into three categories: less often, no change, and more often. It turned out that 28% of the surveyed women from rural areas increased the frequency of online purchases since the pandemic began, while in the case of the surveyed men, it was only 19.5% (p = 0.0038)—see Table 5.

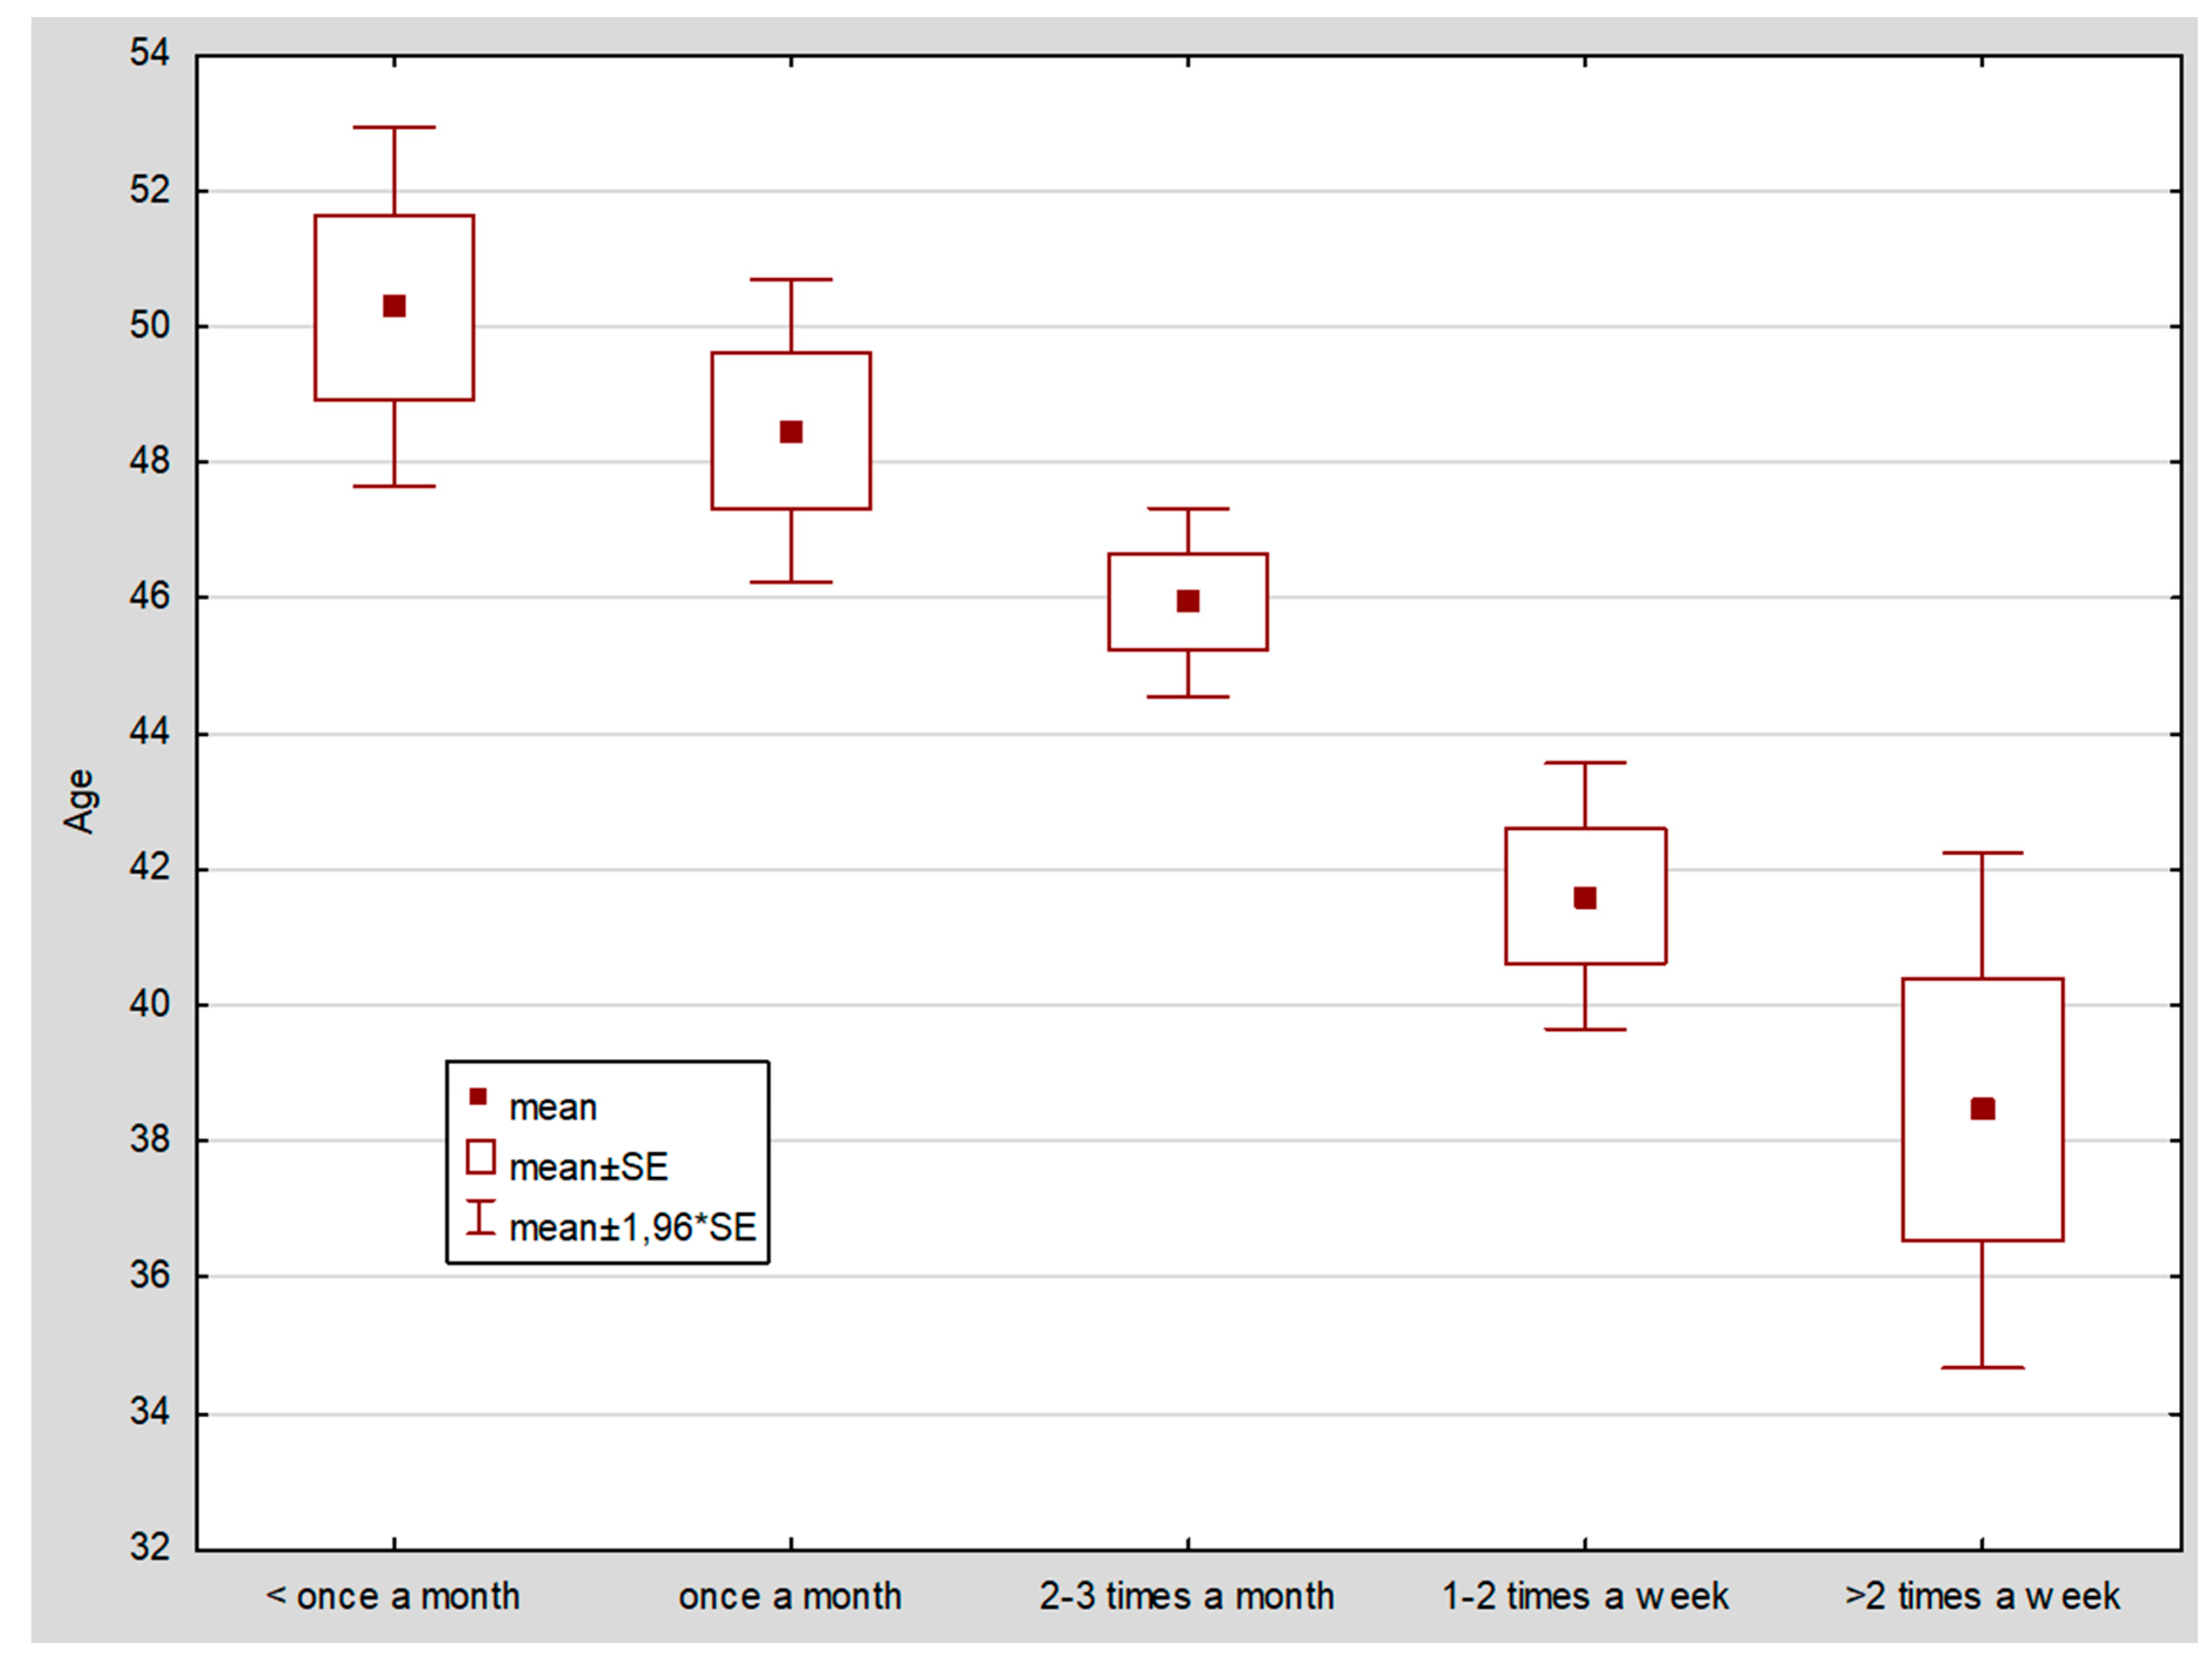
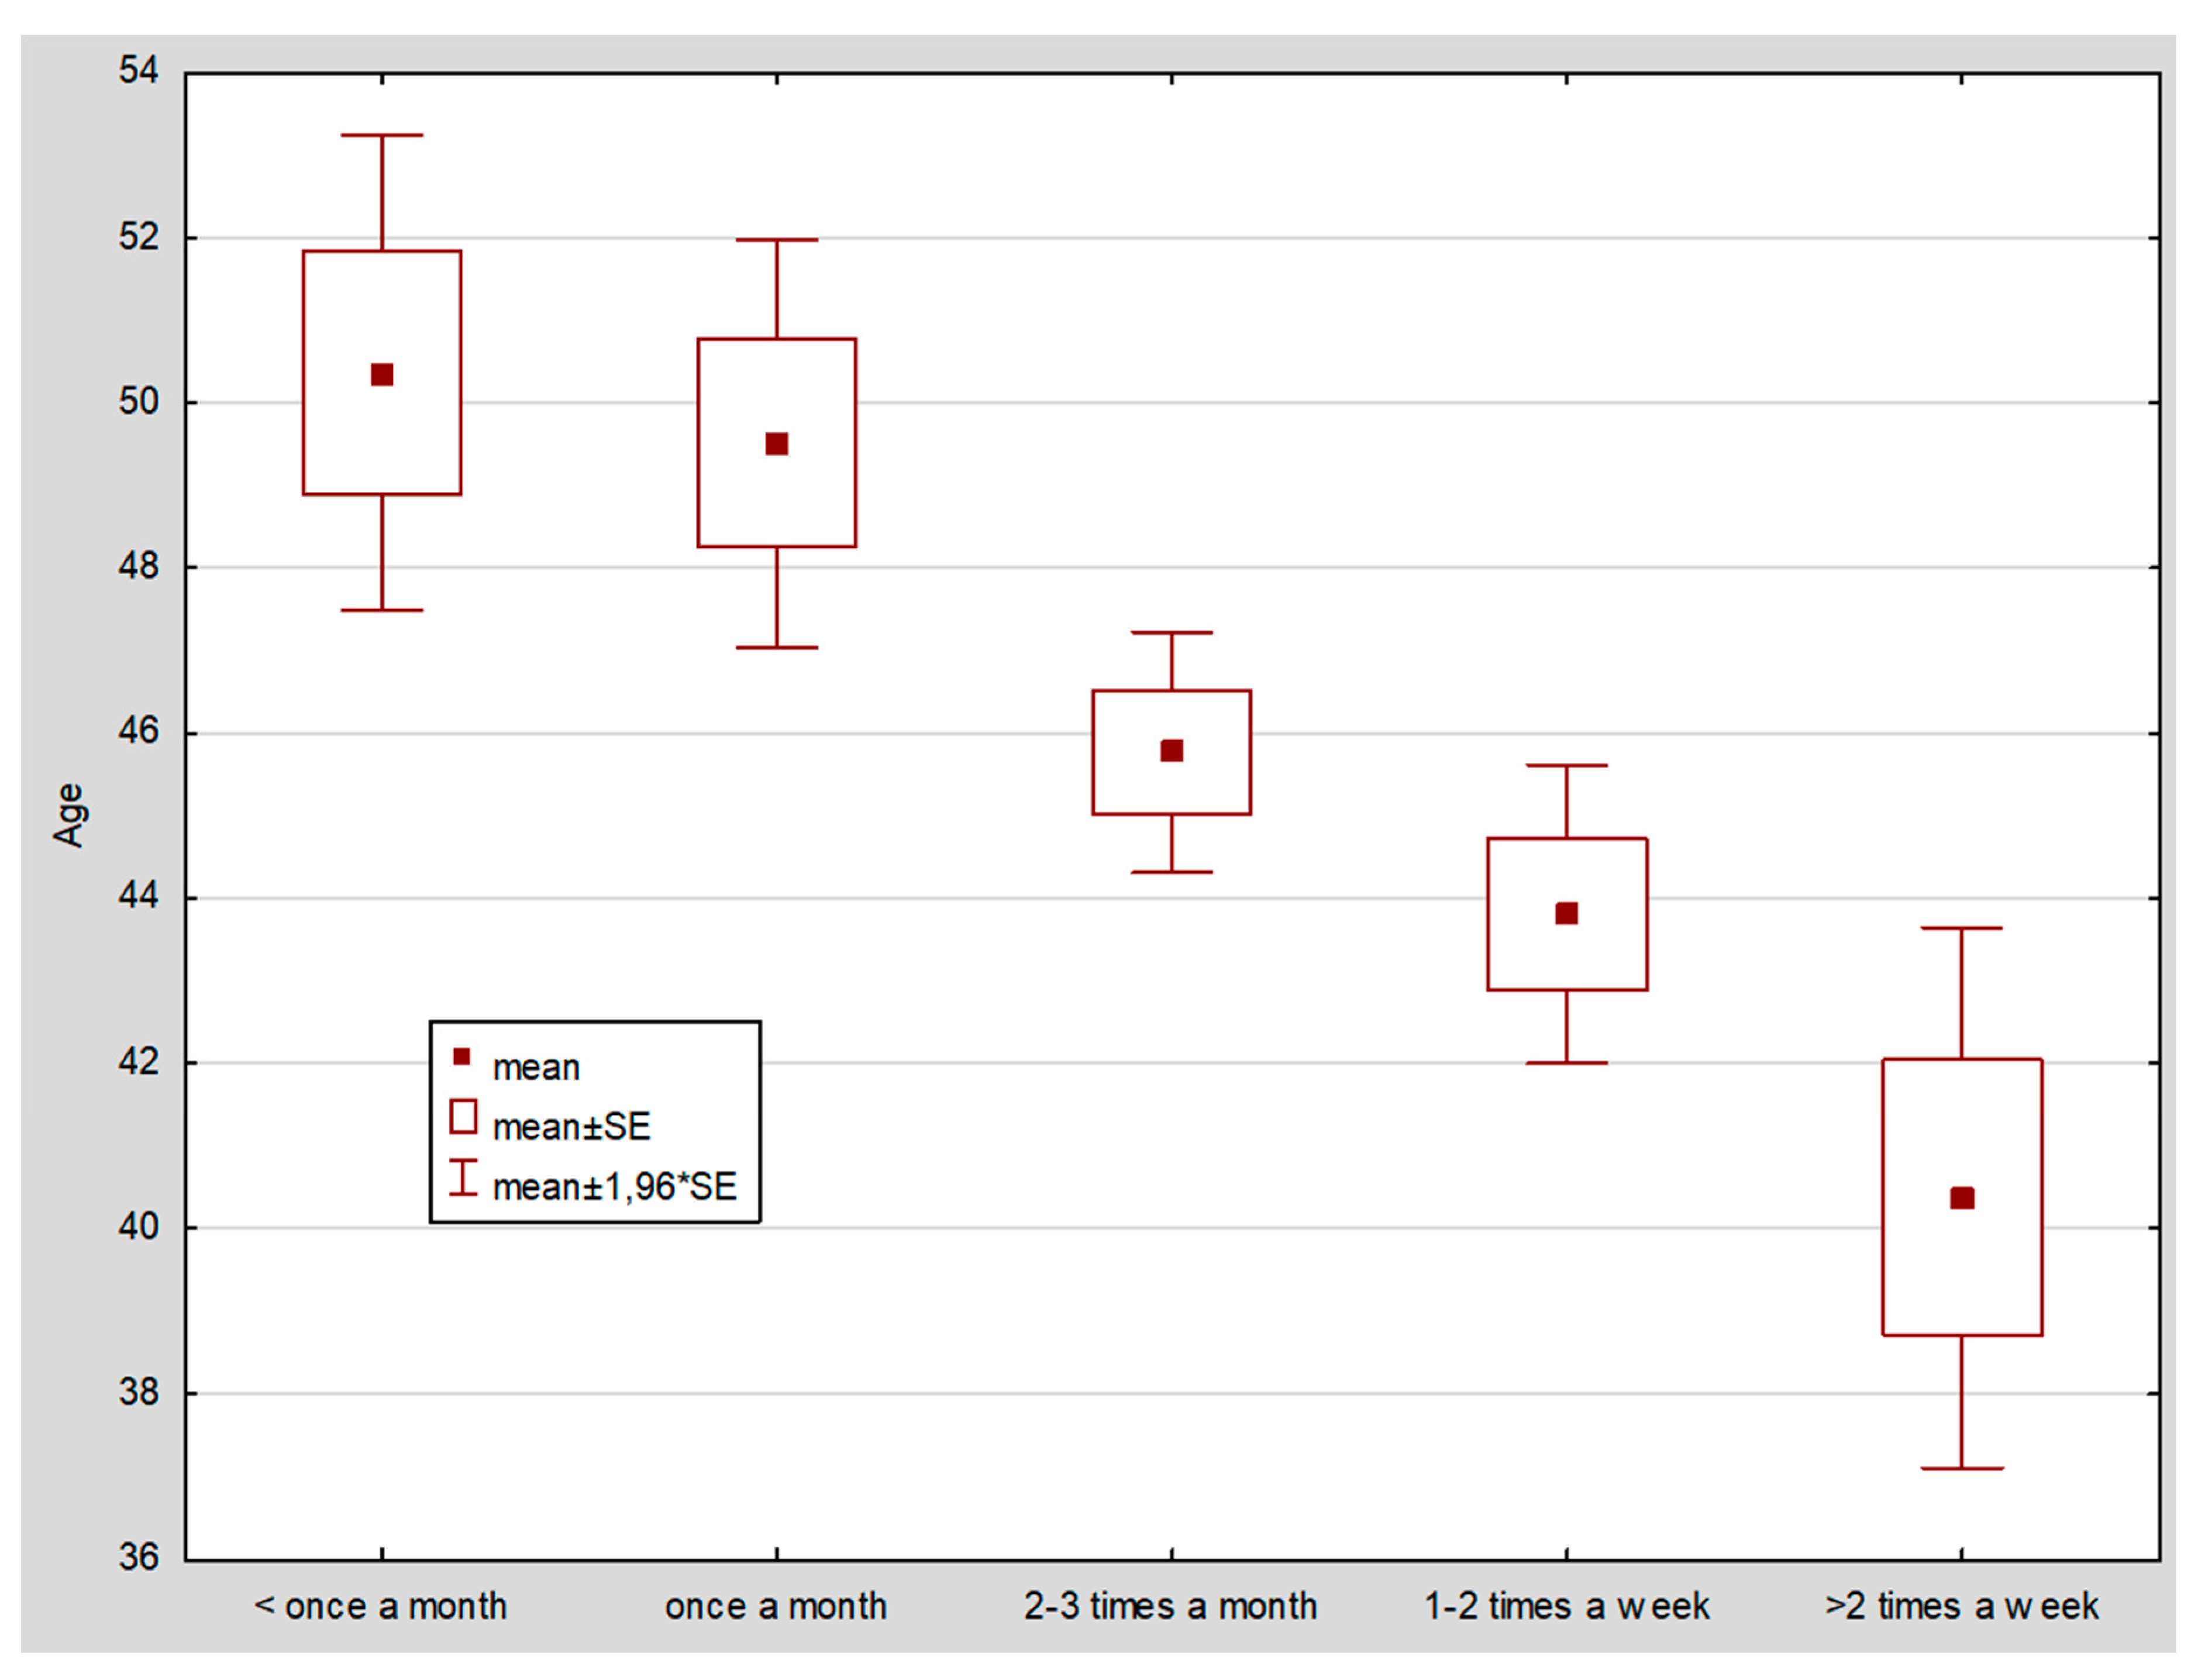
5.3. Age and Purchases Frequency

The frequency of purchases both before and after the COVID-19 pandemic occurred showed a clear dependence on age. Younger rural e-customers people prefer to do shopping online more often than older generations (see Figure 2 and Figure 3, age is a continuous variable).
It is worth noting that the change in the frequency of purchases via the Internet was not significant (p = 0.0939), although less frequent online shopping was declared by rural e-customers on average 4–5 years younger than those who did not change the frequency or increased it (average age approx. 42 years).

5.4. Number of Persons in the Rural Household

The number of persons in the rural household was another factor, which was related to the frequency of purchases both before and after the COVID-19 pandemic occurred. The pandemic did not cause a change in this frequency. The least frequent option (“less than once a month”) was chosen by rural e-customers from households with an average of 3 people, 1–3 times a month from rural households with an average of 3.2 people, and more often from households with 3.6 people. It is worth noticing that the impact of the level of education of people from rural areas on the change in the frequency of online purchases has not been demonstrated. The research also found no relation between the frequency of purchases in any system (before—during—the change) with the number of rural inhabitants in the place of residence and the number of neighbours living within a radius of 150 m.

5.5. Product Types and Purchases Frequency

The next step of the analysis presents the results of the assessment of changes in the frequency of online purchases of rural e-customers based on the types of purchased products. Thus, the relationship between the gender of rural inhabitants and the increase in the frequency of online purchases was found concerning clothing (female 33.9%, male 21.4%, with p = 0.0000), and everyday products (female 27.8%, male 18.6%, with p = 0.0016). The relationship between age and the change in the frequency of online purchases was assessed both in terms of age as a variable categorized in age groups, and when treating age as a continuous variable. The results of both approaches were consistent and indicated that rural e-customers who declared an increase in the frequency of online shopping were on average younger than rural e-customers who declared a reduction in the frequency or no changes in the frequency of shopping via the Internet (see Table 6).

5.6. Age and Product Types in Purchases Frequency

The research shows that only purchases of products related to gardening are not related to age. In the survey, the variable “education level” had many categories, which made interpretation difficult, and therefore, it was decided to group these categories into three newly created groups: primary (the Polish primary and upper primary school), secondary (the Polish high school), and higher (bachelor’s and master’s degrees, doctoral degree, other professional titles) (see Table 7).

5.7. Number of Persons in Rural Households and Product Types

A statistically significant relationship between education level and changes in the frequency of online purchases of selected types of products was observed for the following groups: entertainment, clothing, furniture, everyday products, and RTV/AGD appliances. For the number of persons in the rural household, a relationship was observed with an increase in online purchases in the range of six types of products (see Table 8).
In all these cases, the average number of persons in rural households who increased the frequency of online purchases was higher than in the others. The number of rural inhabitants in the place of residence indicated that the increase in the frequency of clothing purchased online occurred more often in rural areas with more than 500 inhabitants (31.1% vs. 22.5%, p = 0.0218), and for food products with more than 1000 inhabitants (20.7% vs. 13.3%, p = 0.0094). When purchasing gardening products, the rural population limit is shifted to 2000 (26.5% vs. 18.6%, p = 0.0413). The relationships described here are confirmed in the logistic regression, but due to the interdependence, not all variables relevant to the single-factor analysis are included in the multifactor regression models (see Appendix A).

5.8. Methods of Delivery and Purchases Frequency

In the next question of the survey, respondents from rural areas were asked to evaluate the change in the frequency of using various methods of delivery of products purchased via the Internet. Respondents had as many as six options to choose from:
  • more often,
  • less often,
  • I did not use it before, but I started when COVID-19 occurred,
  • I did not use it before and since COVID-19 occurred,
  • the same frequency,
  • I have used it before and do not use it since COVID-19 occurred.
Possible variants of the answer are difficult to assign any reasonable monotonic order, which significantly hinders the interpretation. Most rural inhabitants (68.6%) used the method of delivery by courier to home/work just as often before and after the COVID-19 pandemic occurred. Females (11.2%) declared more frequent use of this method before the pandemic than males (7.8%). On the other hand, after the COVID-19 pandemic occurred, males more often began to use this method of delivery (6.8% vs. 3.5%). Younger rural e-customers dominate both in the category of the beginning of the use of couriers to home/work during the pandemic (average 34 years) and in the category of stopping (average 37 years). Older rural inhabitants used the courier’s delivery more often or the same as before the pandemic (the average age was 39.5 and 47.6, respectively). A similar dependence on age can also be seen concerning deliveries by post office directly to home/work. Its services were stopped by the youngest rural respondents (36.4), and more often or the same before and during the pandemic by older respondents from rural areas (averages of 49.7 and 47.5 years, respectively).
Interestingly, rural inhabitants with the lowest average age stopped using parcel lockers after the COVID-19 pandemic occurred (35.8). Parcel lockers were used by people with higher education more often or at the same level. One in four rural respondents could not pick up the parcel at the post office during the pandemic (it might be a result of lockdowns). Once again, the lowest average age was in the group of people who stopped using this method of delivery (40.2%). Rural inhabitants with higher education pick up parcels at the post office just as often or less during the pandemic. Regarding picking up the parcel from the seller, there was no relationship between age and the choice of the answer to this question. A total of 37.2% of females did not use this delivery method before the pandemic and since it occurred, among males, it was 29%. The same or less frequent use was made of people with higher education. Picking up the parcel at a kiosk/shop or other pickup point was observed in a group of relatively younger respondents from rural areas (the average age is 40.2 years). Finally, free home delivery with the possibility of free return was more often used by people with a small number of neighbours after the COVID-19 pandemic occurred.

6. Summary and Conclusions

6.1. General Summary

The study found that changes in online purchases among rural e-customers after the onset of COVID-19 are not so significant. Interestingly, both before and after the pandemic, the number of people in a household, the level of education of those ordering goods online, and the number of rural residents in the place of residence did not have much influence on the frequency of purchase. Both before and after the pandemic, rural e-customers made online purchases most often 2–3 times a month. The frequency of purchases during this period increased among those who previously bought online 2–3 times a week or more often, and decreased among those who infrequently bought once a month and less often. Among those living in rural areas, which increased their online shopping frequency after the pandemic, nearly 30% were women, and about 20% were men. With a post-pandemic increase in online shopping frequency, younger people around the age of 40 increased. The following are the products for which demand increased after the pandemic’s onset: clothing, everyday products, and free time services. The research shows that the increase in the frequency of online clothing purchases occurred in rural areas with more than 500 inhabitants, and for food products in rural areas with more than 1000 inhabitants.
The increased frequency of online purchases is creating challenges for last mile logistics. Studies show that transportation costs at the last mile of the supply chain are very high [38], and account for about 41% of total costs in the supply chain [1]. Therefore, knowing the preferences of rural e-customers allows courier companies to adapt to the needs of e-customers on the one hand and optimize costs in the last mile area on the other. The research shows that more than 60% of respondents living in rural areas order goods purchased online with a home delivery method. For this group of e-customers, the delivery method for goods purchased online remained the same after the pandemic.
In contrast, about 7% of respondents began ordering products to pick up points from the seller during COVID-19, and 8% of e-customers to designated pickup points. At the same time, about 22% of those surveyed after the pandemic began to opt more often for parcel locker deliveries. Interestingly, rural e-customers with the lowest average age stopped choosing parcel lockers as a delivery method, in contrast to those with higher education, who, after the COVID-19 outbreak, found this delivery method to be the most secure. Differences can also be seen in the choice of delivery location by family size. The survey found that smaller families were more likely to choose free home delivery with a free return after the pandemic.

6.2. Practical Implications

The research presented in this paper can be a valuable information source for courier companies, online stores, and e-platforms. Information on the preferences of rural residents shopping online is particularly important knowledge for courier companies. Rural areas, due to their greater dispersion and lower population density, represent a significant challenge for this stakeholder group to both reduce costs and meet increasing environmental requirements. Increasingly, there is talk of the need to apply sustainability concepts to the implementation of activities in the area of last mile supply [41,42,43,44], as part of the 2030 Agenda for Sustainable Development [45]. This requires courier companies to be aware of e-customers’ last mile delivery preferences to be able to take steps to implement equalised delivery of goods purchased online. Knowledge of preferences and their changes after the occurrence of COVID-19 can support the reorganization of last mile delivery to meet the needs of e-customers on the one hand and to adapt to the increasing demands for sustainable transportation on the other. In the case of e-shops and online platforms, knowledge of the preferences of rural e-customers is important from the perspective of the choice of types of goods and their frequency of purchase. These groups of stakeholders can adjust their offer to the e-customers’ preferences from the rural areas.

6.3. Future Research

In further research, the authors intend to conduct in-depth studies with various stakeholder groups of last mile delivery in rural areas. Especially valuable will be a set of focus groups conducted with courier companies, e-platforms, and e-customers. The purpose of these focus groups will be to identify factors that could lead the different stakeholder groups to change their last mile delivery preferences to more sustainable ones. The focus groups will enable to create the discussion between stakeholders and, thanks to it, develop the most desired actions for the stakeholders’ preferences and changes toward sustainability in terms of last mile delivery.

Author Contributions

Conceptualization, M.M., J.M. and M.K.-J.; methodology, M.M., J.M. and D.S.; software, M.M. and D.S.; validation, M.M., J.M. and M.K.-J.; formal analysis, M.M. and D.S.; investigation, M.M., J.M. and M.K.-J.; resources, M.M., J.M. and M.K.-J.; data curation, M.M. and D.S.; writing—original draft preparation, M.M., J.M., M.K.-J. and D.S.; writing—review and editing, J.M.; visualization, M.M., J.M. and D.S.; supervision, M.M., J.M. and M.K.-J.; project administration, M.K.-J.; funding acquisition, M.M., J.M. and M.K.-J. All authors have read and agreed to the published version of the manuscript.

Funding

The project is financed by the Ministry of Education and Science in Poland under the program “Regional Initiative of Excellence” 2019–2022, project number 015/RID/2018/19, total funding amount 10 721 040,00 PLN.

Institutional Review Board Statement

Not applicable.

Informed Consent Statement

Not applicable.

Data Availability Statement

The data presented in this study are available on request from the corresponding author.

Conflicts of Interest

The authors declare no conflict of interest. The funders had no role in the design of the study; in the collection, analyses, or interpretation of data; in the writing of the manuscript; or in the decision to publish the results.

Appendix A

Table A1. Logistic regression for “increase” for groups of products purchased online (own elaboration).
Entertainment
VariableValueOne-variable regressionFinal multiple regression
Odds ratiop-valueOdds ratiop-value
Age18–24
25–44
45+
4.449
2.186
1.000
0.0000
0.0000
-
4.449
2.186
1.000
0.0000
0.0000
-
Agecontinuous0.9690.0000--
EducationPrimary
Secondary or higher
1.000
1.446
-
0.2337
--
Household sizediscrete1.1840.0016--
Clothing
VariableValueOne-variable regressionFinal Multiple regression
Odds ratiop-valueOdds ratiop-value
GenderFemale
Male
1.882
1.000
0.0000
-
1.961
1.000
0.0000
-
Age18–24
25–44
45+
1.915
1.531
1.000
0.0051
0.0035
-
--
Agecontinuous0.9830.00010.9780.0000
EducationPrimary
Secondary or higher
1.000
2.026
-
0.0125
--
Household sizediscrete1.1550.0020--
Population<500
>500
1.000
1.551
-
0.0070
1.000
1.760
-
0.0007
Furniture
VariableValueOne-variable regressionFinal Multiple regression
Odds ratiop-valueOdds ratiop-value
Age18–44
45+
2.743
1.000
0.0000
-
2.858
1.000
0.0000
-
Agecontinuous0.9680.0000--
EducationPrimary
Secondary or higher
1.000
2.276
-
0.0571
1.000
2.514
-
0.0344
Household sizediscrete1.2320.0006--
Free time
VariableValueOne-variable regressionFinal Multiple regression
Odds ratiop-valueOdds ratiop-value
Age18-34
35-64
65+
4.603
2.354
1.000
0.0000
0.0011
-
--
Agecontinuous0.9680.00000.9680.0000
Household sizediscrete1.1810.0011--
Everyday
VariableValueOne-variable regressionFinal Multiple regression
Odds ratiop-valueOdds ratiop-value
GenderFemale
Male
1.690
1.000
0.0004
-
1.701
1.000
0.0004
-
Age18-34
35-64
65+
2.005
1.244
1.000
0.0017
0.2944
-
1.594
1.000
1.000
0.003
-
-
Agecontinuous0.9840.0005--
EducationPrimary
Secondary
Higher
1.000
1.876
2.308
-
0.0460
0.0086
1.000
1.000
1.401
-
-
0.0241
Household sizediscrete1.1880.00041.1600.0038
RTV/AGD
VariableValueOne-variable regressionFinal Multiple regression
Odds ratiop-valueOdds ratiop-value
Agecontinuous0.9840.0011--
EducationPrimary
Secondary
Higher
1.000
1.628
2.120
-
0.1517
0.0279
1.000
1.000
1.395
-
-
0.0383
Food
VariableValueOne-variable regressionFinal Multiple regression
Odds ratiop-valueOdds ratiop-value
Agecontinuous0.9910.07510.9890.0442
Population<1000
>1000
1.000
1.697
-
0.0024
1.000
1.752
-
0.0014
Gardening
VariableValueOne-variable regressionFinal Multiple regression
Odds ratiop-valueOdds ratiop-value
EducationPrimary
Secondary or higher
1.000
1.629
-
0.1137
--
Population<2000
>2000
1.000
1.505
-
0.0171
1.000
1.505
-
0.0171
Agriculture
VariableValueOne-variable regressionFinal Multiple regression
Odds ratiop-valueOdds ratiop-value
AgeContinuous0.9820.0068--
EducationPrimary
Secondary or higher
1.000
1.245
-
0.5703
--
Household sizediscrete1.2370.00141.2370.0014

References

  1. Chevalier, S. Development of E-Commerce Shares Pre and Post COVID-19; Statista: Hamburg, Germany, 2021. [Google Scholar]
  2. Rizet, C.; Cornélis, E.; Browne, M.; Léonardi, J. GHG Emissions of Supply Chains from Different Retail Systems in Europe. Procedia—Soc. Behav. Sci. 2010, 2, 6154–6164. [Google Scholar] [CrossRef]
  3. Tighe, D. E-Commerce Increase Due to COVID-19 in Europe 2020–2021; Statista: Hamburg, Germany, 2022. [Google Scholar]
  4. Kiba-Janiak, M.; Cheba, K.; Witkowski, J.; Jagoda, A.; Skowrońska, A.; Kołakowski, T.; Baraniecka, A.; Marcinkowski, J.; Mucowska, M. Sustainable City Logistics of Last-Mile Delivery and Returns on the E-Commerce Market. Various Groups of Stakeholders’ Perspectives—Aims and Scope of the Project. ACC J. 2022, 28, 44–53. [Google Scholar] [CrossRef]
  5. Kiba-Janiak, M.; Marcinkowski, J.; Jagoda, A.; Skowrońska, A. Sustainable Last Mile Delivery on E-Commerce Market in Cities from the Perspective of Various Stakeholders. Literature Review. Sustain. Cities Soc. 2021, 71, 102984. [Google Scholar] [CrossRef]
  6. Gatta, V.; Marcucci, E.; Nigro, M.; Patella, S.M.; Serafini, S. Public Transport-Based Crowdshipping for Sustainable City Logistics: Assessing Economic and Environmental Impacts. Sustainability 2019, 11, 145. [Google Scholar] [CrossRef] [Green Version]
  7. Comi, A. A Modelling Framework to Forecast Urban Goods Flows. Res. Transp. Econ. 2020, 80, 100827. [Google Scholar] [CrossRef]
  8. Iwan, S.; Kijewska, K.; Lemke, J. Analysis of Parcel Lockers’ Efficiency as the Last Mile Delivery Solution—The Results of the Research in Poland. Transp. Res. Procedia 2016, 12, 644–655. [Google Scholar] [CrossRef] [Green Version]
  9. Allen, J.; Piecyk, M.; Piotrowska, M.; McLeod, F.; Cherrett, T.; Ghali, K.; Nguyen, T.; Bektas, T.; Bates, O.; Friday, A.; et al. Understanding the Impact of E-Commerce on Last-Mile Light Goods Vehicle Activity in Urban Areas: The Case of London. Transp. Res. D Transp. Env. 2018, 61, 325–338. [Google Scholar] [CrossRef] [Green Version]
  10. Bjørgen, A.; Bjerkan, K.Y.; Hjelkrem, O.A. E-Groceries: Sustainable Last Mile Distribution in City Planning. Res. Transp. Econ. 2019, 87, 100805. [Google Scholar] [CrossRef]
  11. Markowska, M.; Marcinkowski, J. Rural E-Customers’ Preferences for Last Mile Delivery: Evidence from Poland. Energies 2022, 15, 8351. [Google Scholar] [CrossRef]
  12. Gundu, T. Smart Locker System Acceptance for Rural Last-Mile Delivery. In Proceedings of the 2020 2nd International Multidisciplinary Information Technology and Engineering Conference, IMITEC, Virtual, 25–27 November 2020. [Google Scholar]
  13. Jiang, X.; Wang, H.; Guo, X.; Gong, X. Using the FAHP, ISM, and MICMAC Approaches to Study the Sustainability Influencing Factors of the Last Mile Delivery of Rural e-Commerce Logistics. Sustainability 2019, 11, 3937. [Google Scholar] [CrossRef] [Green Version]
  14. Sousa, R.; Horta, C.; Ribeiro, R.; Rabinovich, E. How to Serve Online Consumers in Rural Markets: Evidence-Based Recommendations. Bus. Horiz. 2020, 63, 351–362. [Google Scholar] [CrossRef]
  15. Seghezzi, A.; Siragusa, C.; Mangiaracina, R. Parcel Lockers vs. Home Delivery: A Model to Compare Last-Mile Delivery Cost in Urban and Rural Areas. Int. J. Phys. Distrib. Logist. Manag. 2022, 52, 213–237. [Google Scholar] [CrossRef]
  16. Morze, M. (Ed.) Rural Areas in Poland in 2020; Statistics Poland: Olsztyn, Poland, 2022.
  17. Morganti, E.; Seidel, S.; Blanquart, C.; Dablanc, L.; Lenz, B. The Impact of E-Commerce on Final Deliveries: Alternative Parcel Delivery Services in France and Germany. Transp. Res. Procedia 2014, 4, 178–190. [Google Scholar] [CrossRef] [Green Version]
  18. Abyre, A.; Jibraili, Z.; Anouar, H. COVID-19: Performance of E-Commerce in Morocco; Springer: Berlin/Heidelberg, Germany, 2021; pp. 1270–1281. [Google Scholar]
  19. Loske, D. The Impact of COVID-19 on Transport Volume and Freight Capacity Dynamics: An Empirical Analysis in German Food Retail Logistics. Transp. Res. Interdiscip. Perspect. 2020, 6, 100165. [Google Scholar] [CrossRef]
  20. Queiroz, M.M.; Ivanov, D.; Dolgui, A.; Fosso Wamba, S. Impacts of Epidemic Outbreaks on Supply Chains: Mapping a Research Agenda amid the COVID-19 Pandemic through a Structured Literature Review. Ann. Oper. Res. 2020, 319, 1159–1196. [Google Scholar] [CrossRef] [PubMed]
  21. Ivanov, D. Viable Supply Chain Model: Integrating Agility, Resilience and Sustainability Perspectives—Lessons from and Thinking beyond the COVID-19 Pandemic. Ann. Oper. Res. 2020, 319, 1411–1431. [Google Scholar] [CrossRef] [PubMed]
  22. Choi, T.-M. Innovative “Bring-Service-Near-Your-Home” Operations under Corona-Virus (COVID-19/SARS-CoV-2) Outbreak: Can Logistics Become the Messiah? Transp. Res. E Logist. Transp. Rev. 2020, 140, 101961. [Google Scholar] [CrossRef] [PubMed]
  23. Torres, F.; Gendreau, M.; Rei, W. Crowdshipping: An Open VRP Variant with Stochastic Destinations. Transp. Res. Part. C Emerg. Technol. 2022, 140, 103677. [Google Scholar] [CrossRef]
  24. Villa, R.; Monzón, A. Mobility Restrictions and E-Commerce: Holistic Balance in Madrid Centre during COVID-19 Lockdown. Economies 2021, 9, 57. [Google Scholar] [CrossRef]
  25. Kawa, A. Out-of-Home Delivery as a Solution of the Last Mile Problem in E-Commerce. In Smart and Sustainable Supply Chain and Logistics—Trends, Challenges, Methods and Best Practices; Tsai, K.-M., Golinska-Dawson, P., Kosacka-Olejnik, M., Eds.; Springer: Cham, Switzerland, 2020; pp. 25–40. [Google Scholar]
  26. Tadić, S.; Veljović, M. Home Delivery: A Framework For Structuring. Int. J. Traffic Transp. Eng. 2021, 11, 30–74. [Google Scholar] [CrossRef]
  27. Mommens, K.; Buldeo Rai, H.; van Lier, T.; Macharis, C. Delivery to Homes or Collection Points? A Sustainability Analysis for Urban, Urbanised and Rural Areas in Belgium. J. Transp. Geogr. 2021, 94, 103095. [Google Scholar] [CrossRef]
  28. Prandtstetter, M.; Seragiotto, C.; Braith, J.; Eitler, S.; Ennser, B.; Hauger, G.; Hohenecker, N.; Schodl, R.; Steinbauer, M. On the Impact of Open Parcel Lockers on Traffic. Sustainability 2021, 13, 755. [Google Scholar] [CrossRef]
  29. Boysen, N.; Schwerdfeger, S.; Weidinger, F. Scheduling Last-Mile Deliveries with Truck-Based Autonomous Robots. Eur. J. Oper. Res. 2018, 271, 1085–1099. [Google Scholar] [CrossRef]
  30. Jara, M.; Vyt, D.; Mevel, O.; Morvan, T.; Morvan, N. Measuring Customers Benefits of Click and Collect. J. Serv. Mark. 2018, 32, 430–442. [Google Scholar] [CrossRef]
  31. Melkonyan, A.; Gruchmann, T.; Lohmar, F.; Kamath, V.; Spinler, S. Sustainability Assessment of Last-Mile Logistics and Distribution Strategies: The Case of Local Food Networks. Int. J. Prod. Econ. 2020, 228, 107746. [Google Scholar] [CrossRef]
  32. Mangiaracina, R.; Perego, A.; Seghezzi, A.; Tumino, A. Innovative Solutions to Increase Last-Mile Delivery Efficiency in B2C e-Commerce: A Literature Review. Int. J. Phys. Distrib. Logist. Manag. 2019, 49, 901–920. [Google Scholar] [CrossRef] [Green Version]
  33. Srivatsa Srinivas, S.; Marathe, R.R. Moving towards “Mobile Warehouse”: Last-Mile Logistics during COVID-19 and Beyond. Transp. Res. Interdiscip. Perspect. 2021, 10, 100339. [Google Scholar] [CrossRef]
  34. Sułkowski, Ł.; Kolasińska-Morawska, K.; Brzozowska, M.; Morawski, P.; Schroeder, T. Last Mile Logistics Innovations in the Courier-Express-Parcel Sector Due to the COVID-19 Pandemic. Sustainability 2022, 14, 8207. [Google Scholar] [CrossRef]
  35. Pani, A.; Mishra, S.; Golias, M.; Figliozzi, M. Evaluating Public Acceptance of Autonomous Delivery Robots during COVID-19 Pandemic. Transp. Res. D Transp. Environ. 2020, 89, 102600. [Google Scholar] [CrossRef]
  36. Modgil, S.; Singh, R.K.; Hannibal, C. Artificial Intelligence for Supply Chain Resilience: Learning from COVID-19. Int. J. Logist. Manag. 2022, 33, 1246–1268. [Google Scholar] [CrossRef]
  37. Chen, C.; Demir, E.; Huang, Y.; Qiu, R. The Adoption of Self-Driving Delivery Robots in Last Mile Logistics. Transp. Res. E Logist. Transp. Rev. 2021, 146, 102214. [Google Scholar] [CrossRef] [PubMed]
  38. Wang, C.-N.; Nguyen, N.-A.-T.; Dang, T.-T.; Hsu, H.-P. Evaluating Sustainable Last-Mile Delivery (LMD) in B2C E-Commerce Using Two-Stage Fuzzy MCDM Approach: A Case Study from Vietnam. IEEE Access 2021, 9, 146050–146067. [Google Scholar] [CrossRef]
  39. Maltese, I.; Le Pira, M.; Marcucci, E.; Gatta, V.; Evangelinos, C. Grocery or @grocery: A Stated Preference Investigation in Rome and Milan. Res. Transp. Econ. 2021, 87, 101096. [Google Scholar] [CrossRef]
  40. Cho, Y.; Xue, L.; Huang, S.-R.; Yang, Z.-P. Construction and Application of Customer Satisfaction Model with TheService Quality of Last-Mile Delivery in Rural Areas. WSEAS Trans. Bus. Econ. 2021, 18, 703–711. [Google Scholar] [CrossRef]
  41. Murphy, A.J. Grounding the Virtual: The Material Effects of Electronic Grocery Shopping. Geoforum 2007, 38, 941–953. [Google Scholar] [CrossRef]
  42. Liu, X.; Zhang, S.; Lin, Y.; Xie, Y. Enhancing the Health and Sustainability of E-Commerce Ecosystem by Bringing Manufacturers Online: Evidence from Tao-Factory. In Proceedings of the of PICMET ’16: Technology Management for Social Innovation, Honolulu, HI, USA, 4–8 September 2016; pp. 815–823. [Google Scholar]
  43. Delgado-de Miguel, J.-F.; Buil-López Menchero, T.; Esteban-Navarro, M.-Á.; García-Madurga, M.-Á. Proximity Trade and Urban Sustainability: Small Retailers’ Expectations Towards Local Online Marketplaces. Sustainability 2019, 11, 7199. [Google Scholar] [CrossRef] [Green Version]
  44. Buldeo Rai, H.; Verlinde, S.; Macharis, C. City Logistics in an Omnichannel Environment. The Case of Brussels. Case Stud. Transp. Policy 2019, 7, 310–317. [Google Scholar] [CrossRef]
  45. United Nations. Agenda for Sustainable Development; United Nations: San Francisco, CA, USA, 2015. [Google Scholar]
Figure 1. Research methodology (own elaboration).
Jtaer 18 00030 g001
Figure 2. Age vs. purchase frequency before the COVID-19 pandemic (p = 0.0000) Source: own elaboration.
Jtaer 18 00030 g002
Figure 3. Age vs. purchase frequency during the COVID-19 pandemic (p = 0.0000) Source: own elaboration.
Jtaer 18 00030 g003
Table 1. Buying frequency before and during the COVID-19 pandemic (own elaboration).
OptionsOnline Purchases Frequency
Before COVID-19After COVID-19
n%n%
Very rare (less than once a month)169(15.8)133(12.4)
Rare (once a month)212(19.8)172(16.1)
Sometimes (2–3 times a month)490(45.8)471(44.0)
Often (1–2 times a week)152(14.2)226(21.1)
Very often (more than two times a week)48(4.5)69(6.4)
Table 2. Changes in online purchase frequency before and during the COVID-19 pandemic (own elaboration).
Share of Online PurchasesEntertainment (e.g., Electronic, Games)ClothingFurnitureFree Time (e.g., Hobby, Sport)Everyday Products (e.g., Cosmetics)RTV/AGD AppliancesFood ProductsGarden ArticlesAgricultural Products
Significant decreasen493559413642484460
%(4.6)(3.3)(5.5)(3.8)(3.4)(3.9)(4.5)(4.1)(5.6)
Decreasen383333272432183231
%(3.5)(3.1)(3.1)(2.5)(2.2)(3.0)(1.7)(3.0)(2.9)
Little decreasen445148604242514037
%(4.1)(4.8)(4.5)(5.6)(3.9)(3.9)(4.8)(3.7)(3.5)
No changen748655797720720758785744836
%(69.8)(61.2)(74.4)(67.2)(67.2)(70.8)(73.3)(69.5)(78.1)
Little increasen13519410215216113912415873
%(12.6)(18.1)(9.5)(14.2)(15.0)(13.0)(11.6)(14.8)(6.8)
Increasen397018516742323722
%(3.6)(6.5)(1.7)(4.8)(6.3)(3.9)(3.0)(3.5)(2.1)
Significant increasen183314202116131612
%(1.7)(3.1)(1.3)(1.9)(2.0)(1.5)(1.2)(1.5)(1.1)
Table 3. Changes in the method of delivery of online purchases in rural areas during the COVID-19 pandemic (own elaboration).
OptionsCourier Directly to Home/Work (HD *)By Post Office Directly to Home/Work (HD *)Pickup in a Parcel Locker (OOH *)Pickup at the Post Office (OOH *)Pickup from the Seller (Click and Collect) (OOH *))Pickup at a Kiosk/Shop or Other Pickup Points (OOH *)Free Home Delivery with the Possibility of Free Return (HD *)
I use more frequently than before the COVID-19 pandemic occurredn1026924231263271
%(9.5)(6.4)(22.6)(2.9)(2.4)(3.0)(6.6)
I use less frequently than before the COVID-19 pandemic occurredn921214213810611358
%(8.6)(11.3)(3.9)(12.9)(9.9)(10.6)(5.4)
I did not use before the COVID-19 pandemic occurred, I started using since COVID-19 pandemic occurredn54455154799067
%(5.0)(4.2)(4.8)(5.0)(7.4)(8.4)(6.3)
I did not use before the COVID-19 pandemic occurred, I did not start using since the COVID-19 pandemic occurredn65101133267355357251
%(6.1)(9.4)(12.4)(24.9)(33.1)(33.3)(23.4)
I use with the same frequencyn735708569522461444596
%(68.6)(66.1)(53.1)(48.7)(43.0)(41.5)(55.6)
I used before the COVID-19 pandemic occurred, I did not use since the COVID-19 pandemic occurredn23273459443528
%(2.1)(2.5)(3.2)(5.5)(4.1)(3.3)(2.6)
* Attention: HD means home delivery, and OOH means out-of-home delivery.
Table 4. Changes in online purchases of rural e-customers before and during the COVID-19 pandemic (p = 0.0000) (own elaboration).
Purchase FrequencyDuring COVID-19 PandemicRow Totals
<Less than Once a MonthOnce a Month2–3 Times a Month1–2 Times a Week>2 Times a Week
Before COVID-19 pandemic<less than once a month120
(71.0%) *
28
(16.6%)
16
(9.5%)
4
(2.4%)
1
(0.6%)
169
once a month9
(4.3%)
121
(57.1%)
71
(33.5%)
8
(3.8%)
3
(1.4%)
212
2–3 times a month2
(0.4%)
17
(3.5%)
361
(73.7%)
100
(20.4%)
10
(2.0%)
490
1–2 times a week2
(1.3%)
6
(3.9%)
21
(13.8%)
108
(71.1%)
15
(9.9%)
152
>2 times a week0
(0.0%)
0
(0.0%)
2
(4.2%)
6
(12.5%)
40
(83.3%)
48
Column totals133172471226691071
* Attention: row percentages in brackets. The orange color informs about the second (and third) best option in the frequency of purchases in each row.
Table 5. Changes in rural e-customers’ gender and changes in purchase frequency during the COVID-19 pandemic (own elaboration).
VariableVariantChange in Purchases Frequencyp-Value
Less than OftenNo ChangeMore Often
GenderFemale
Male
31 (5.7%)
34 (6.4%)
359 (66.1%)
391 (74.1%)
153 (28.2%)
103 (19.5%)
0.0038
Table 6. Relation between the age of rural e-customers and the frequency of online purchases before and during the COVID-19 pandemic (own elaboration).
Product TypesDecreaseNo ChangeIncreasep
n x ¯ Sn x ¯ Sn x ¯ S
Entertainment13150.214.974847.115.719239.916.10.0000
Clothing11948.817.265547.115.629743.115.70.0002
Furniture14048.416.079746.915.813439.414.80.0000
Free time12849.116.372047.615.622340.015.30.0000
Everyday10248.416.172046.915.724943.116.00.0014
RTV/AGD11648.815.575846.616.019742.815.60.0017
Food11748.516.678546.315.916944.215.60.0730
Gardening11647.816.074445.915.921146.316.00.5111
Agricultural12847.716.283646.515.910742.215.30.0174
Table 7. Relation between the education level of rural e-customers and the frequency of online purchases before and during the COVID-19 pandemic (own elaboration).
Product TypesEducation LevelDecreaseNo ChangeIncreasep
NumberPer CentNumberPer CentNumberPer Cent
EntertainmentPrimary
Secondary
Higher
20
70
37
(20.8)
(12.8)
(8.9)
63
375
304
(65.6)
(68.7)
(72.7)
13
101
77
(13.5)
(18.5)
(18.4)
0.0231
ClothingPrimary
Secondary
Higher
18
58
42
(18.7)
(10.6)
(10.1)
62
338
248
(64.6)
(61.9)
(59.3)
16
150
128
(16.7)
(27.5)
(30.6)
0.0227
FurniturePrimary
Secondary
Higher
25
72
41
(26.0)
(13.2)
(9.8)
65
409
315
(67.7)
(74.9)
(75.4)
6
65
62
(6.3)
(11.9)
(14.8)
0.0006
Free timePrimary
Secondary
Higher
17
67
42
(17.7)
(12.3)
(10.0)
63
367
282
(65.6)
(67.2)
(67.5)
16
112
94
(16.7)
(20.5)
(22.5)
0.2719
EverydayPrimary
Secondary
Higher
17
49
33
(17.7)
(9.0)
(7.9)
66
373
274
(68.8)
(68.3)
(65.5)
13
124
111
(13.5)
(22.7)
(26.6)
0.0088
RTV/AGDPrimary
Secondary
Higher
16
63
35
(16.6)
(11.5)
(8.4)
69
388
293
(71.9)
(71.1)
(70.1)
11
95
90
(11.5)
(17.4)
(21.5)
0.0298
FoodPrimary
Secondary
Higher
13
58
45
(13.5)
(10.6)
(10.8)
65
415
297
(67.7)
(76.0)
(71.0)
18
73
76
(18.8)
(13.4)
(18.2)
0.2032
GardeningPrimary
Secondary
Higher
18
55
40
(18.8)
(10.1)
(9.6)
65
377
296
(67.7)
(69.0)
(70.8)
13
114
82
(13.5)
(20.9)
(19.6)
0.0888
AgriculturalPrimary
Secondary
Higher
21
61
44
(21.9)
(11.2)
(10.5)
67
428
333
(69.8)
(78.4)
(79.7)
8
57
41
(8.3)
(10.4)
(9.8)
0.0670
Table 8. Relation between the number of persons in the rural household and the frequency of online purchases before and during the COVID-19 pandemic (own elaboration).
Product TypesDecreaseNo ChangeIncreasep
n x ¯ Sn x ¯ Sn x ¯ S
Entertainment1312.981.457483.221.431923.551.460.0013
Clothing1193.031.416553.181.442973.471.430.0045
Furniture1403.041.477973.221.411343.651.530.0010
Free time1283.081.527203.191.422233.531.450.0032
Everyday1022.911.347203.201.422493.531.520.0003
RTV/AGD1163.021.447583.251.441973.361.460.1313
Food1173.331.477853.241.431693.331.470.5828
Gardening1163.031.377443.261.452113.331.450.2026
Agricultural1282.981.468363.231.401073.671.440.0009
Disclaimer/Publisher’s Note: The statements, opinions and data contained in all publications are solely those of the individual author(s) and contributor(s) and not of MDPI and/or the editor(s). MDPI and/or the editor(s) disclaim responsibility for any injury to people or property resulting from any ideas, methods, instructions or products referred to in the content.

