Article

‘Stimuli Are All Around’—The Influence of Offline and Online Servicescapes in Customer Satisfaction and Repurchase Intention

by
Artha Sejati Ananda
1,*,
Hanny Hanny
1,
Ángel Hernández-García
2 and
Prita Prasetya
3
1
Management Department, BINUS Business School Master Program, Bina Nusantara University, Jakarta 11480, Indonesia
2
Departamento de Ingeniería de Organización, Administración de Empresas y Estadística, Universidad Politécnica de Madrid, 28040 Madrid, Spain
3
School of Business and Economics, Universitas Prasetiya Mulya, Jakarta 12430, Indonesia
*
Author to whom correspondence should be addressed.
J. Theor. Appl. Electron. Commer. Res. 2023, 18(1), 524-547; https://doi.org/10.3390/jtaer18010027
Submission received: 17 December 2022 / Revised: 26 February 2023 / Accepted: 7 March 2023 / Published: 10 March 2023
(This article belongs to the Special Issue Multi-Channel Retail and Its Applications in the Future of E-Commerce)

Abstract

:
In the last decade, multichannel retailing has grown at a significant rate, especially in emerging markets such as Indonesia, where retailers have embraced multichannel marketing to heighten the customer shopping experience. Improved servicescape—the environment where services are provided and where interaction with customers occurs—may help enhance the customer experience. While the role of servicescapes has been analyzed in online or offline contexts previously, this research adopts a multichannel view and pioneers the investigation of the interplay of offline and online (mobile app) servicescapes and their effect on customer satisfaction, as antecedents of repurchase intention, among three types of Indonesian retailers. The study analyzes data from N = 171 Indonesian multichannel customers who have shopped in physical stores and via the store’s mobile app. The results show that ambient conditions are the strongest predictor of perceived quality of offline servicescape, whereas store layout and functionality are the strongest predictor of perceived quality of online servicescape. Both online and physical perceived quality of servicescapes predict customer satisfaction, with the latter having a stronger effect on satisfaction. The study offers practical recommendations for retailers seeking to improve loyalty and customer retention.

1. Introduction

Internet and digital technologies have tremendously transformed the retailing landscape over the last few decades, and the dominance of online channels in many sectors is now apparent. Many traditional brick-and-mortar retailers are becoming multichannel retailers by adding online stores [1]. While analysts had anticipated the end of physical retail stores, the recent trend shows that physical stores have not faded away and are attracting attention again [2]. Big e-commerce players who were formerly pure online, such as Alibaba, Amazon, or Zalando, are opening offline stores or physical pick-up points to find new channels for growth and to allow customer physical interaction [1,3]. This phenomenon has led many retailers to adopt multi-channel strategies [4].
A similar phenomenon is seen in Indonesia, one of the largest emerging markets in the world. Over the past decade, e-commerce in Indonesia has grown at a faster rate and it has begun to disrupt traditional business retailers, forcing them to adapt [5]. The rise of e-commerce in Indonesia is strongly affected by the increasing penetration of Internet users [6]. Data from the Indonesia Internet Service Provider Association [7] show that 64.8 percent of total Indonesian population is connected to the internet, accounting for 171 million users. There are currently 370.1 million cellular mobile connections in Indonesia (133% of total Indonesian population) [8]. To cope with this digitalization, the chairman of Indonesian Retail Merchant Association (Aprindo) stated that about 95 percent of its members have embraced technology and have incorporated online systems into their businesses [9]. Big retail players in Indonesia, such as grocery retailers (e.g., Hypermart, Indomaret, and Alfamart), home appliance retailers (e.g., Informa and Ace Hardware), fashion retailers (e.g., Matahari Department Store), and electronic retailers (e.g., Electronic City and Erafone) have built their own online stores to improve the customer online shopping experience [10,11,12]. The opposite is also true: some big e-commerce marketplaces, such as Tokopedia, JD.ID, and Berrybenka, are now expanding their market in offline sectors [13]. Therefore, traditional retailers should also start to integrate their offline and online channels, while strengthening their physical stores [14].
Unlike online retailers, multichannel retailers can create consumer satisfaction and loyalty through the interplay between offline and online behaviors [15]. Moreover, successful retailers are those who deliberately cultivate customer satisfaction and loyalty. Customer satisfaction is defined as the customer’s evaluation of the fulfillment of their expectations of the product or service given [16] and is a critical factor of repurchase intention [17]. Consumers who have purchased from the same company appear to become loyal customers, and repurchase intention is highly correlated with customer loyalty [18]. Loyalty is a very important asset for companies, and it is estimated that increasing retention rates by 5 percent could lead to increased benefits in the range of 25–95 percent [18].
The retail industry is also one of the largest service industries [19]. Provision of excellent servicescape to customers is one of the approaches for retailers to achieve competitive advantage and gain customer satisfaction [19,20]. Servicescape refers to the environments where the services are provided and where the company and customer interact [21]. Servicescape is found to have influence on customer perceived value from a service offered by the firm and it also influences future purchasing and consumption behaviors [22]. The three aspects of servicescape proposed by [21] are the following: ambient conditions; spatial layout and functionality; and signs, symbols, and artifacts. These three dimensions have been found to positively influence customer satisfaction and purchase intention [19,21,22,23,24]. In addition, this research draws from [25,26] and adds social factors to enrich the servicescape dimensions.
The concept of servicescape has also been extended to the online environment, referred to as online, cyber, e-, or digital servicescape [27]. Online servicescape is therefore the application of the idea of servicescape to the online environment [28]. The online servicescape has been considered as antecedent to customer satisfaction [18], loyalty [29], purchase intention [30], and trust [27]. The online servicescape include the following three dimensions: aesthetic appeal, spatial and layout functionality, and financial security [27,28,29,30]. Analogously to the physical counterpart, social presence, or the customer’s perception of human presence and warmth on the e-commerce site, represents the social factor in the online servicescape [31].
In multichannel retailing, customers expect every channel to have at least the same level of service. Maintaining the same quality of service in the different channels can be difficult for retailers to enforce. Retailers still struggle to effectively satisfy customers in each channel. Thus, the challenge for retailers is to satisfy the consumer’s demand and to optimize the performance of each channel [1]. In Indonesia, many conventional retailers that later incorporate online stores in their businesses are new to multichannel strategy and are striving to develop the strategy that enables them to satisfy and increase multichannel customer satisfaction and repurchase intention to develop loyalty [32].
Multichannel customers are of particular interest for retailers, as they spend 20–30 percent more than single-channel customers on average [33,34]. However, there is limited academic knowledge to offer guidance for multichannel practitioners and, more particularly, on frameworks that integrate the online and offline environments. Further, research generally investigates offline and online servicescape settings separately ([18,19,30,35,36], among others). This study aims to address this gap within the Indonesian retail setting context and proposes that the perceived quality of online (mobile) and offline servicescapes are fundamental antecedents of customer satisfaction, which in turns affects repurchase intention.
The empirical study tests these relationships using cases of three types of Indonesian retailers from industries that are undergoing transformation from traditional brick-and-mortar store to multichannel retailing in the Indonesian market: fashion and beauty, home furniture and appliances, and household grocery and personal care.
Therefore, the contribution and novelty of our research is fourfold. First, we investigate the combined antecedents of perceived quality of servicescapes in online and offline contexts, and how the interplay of online and offline servicescapes affect global customer satisfaction and repurchase intention. Second, research on servicescapes has mostly covered developed countries, e.g., [20,23,25]; however, the geographical context of the study is an emerging market (Indonesia). Third, research on servicescapes has generally focused on tourism and hospitality, e.g., [20,25,28], or on retailers for which aesthetic elements are of capital relevance, such as furniture and fashion, e.g., [29,37]; our study analyzes three different retailing industries that include both functional and aesthetic components in their products. Fourth, and finally, while previous studies consider the retailer’s webstore as the central piece of the online servicescape, our research acknowledges the shift in consumer behaviors towards mobile devices for online shopping, e.g., [27,29] and considers the store’s mobile application as the main element of the online servicescape.
The rest of this document is structured as follows. Section 2 elaborates the literature review and theoretical background from a servicescape perspective. Section 3 lays out the research design and methodology. Section 4 describes the main results of the analysis. Section 5 discusses the findings of the research. Section 6 draws the main conclusions, implications for theory and practice, and limitations of the study.

2. Theoretical Framework

2.1. Servicescape as Antecedent of Customer Satisfaction

Academic research has found many different antecedents of customer satisfaction and repurchase intention in retailing, and traditional retailers are still emphasizing the 4Ps of the marketing mix to increase customer satisfaction [38]. However, and to stay competitive in the market, retailers have started to improve and to differentiate the service quality provided to their customers [19,20,38]. The major characteristic of services is intangibility. One of the operational measures of service quality is servicescape [21,36]. Servicescape refers to the customer’s perception about the service offered, as a result of physical dimensions of service such as ambient conditions, space, and symbols [21]. Later studies on servicescape extended the concept to the online environment [18,27,29,30].
However, a holistic view that integrates the offline and online servicescape dimensions as predictors of repurchase intention and customer satisfaction is generally missing, as prior research separates offline and online servicescapes (e.g., [18,19,30,35,36]). Ref. [39] pioneered the study of both offline and online (web) service environment’s impact on brand equity perceptions of United States’ retailers, based on [40]’s typology of service environments. However, the empirical evidence on the relationship between the servicescape dimensions and customer satisfaction, as well as repurchase intention, remains unexplored, particularly in emerging markets. To address this gap, the following subsections present the main concepts related to offline and online servicescapes, perceived quality of servicescapes, satisfaction, and repurchase intention, and builds the research model based on evidence from prior literature on the topic.

2.2. Offline Servicescape

Servicescape is “the environment in which the service is assembled and in which the seller and customer interact, combined with tangible commodities that facilitate performance or communication of the service” [41] (p. 36). Ref. [40] further posits that the service environment consists of three unique dimensions: ambient factors, design factors, and social factors, and [21] identifies three distinct environmental dimensions of the servicescape where service is crated and delivered: (1) ambient conditions; (2) space/function; and (3) signs, symbols, and artifacts. Based on the above, the offline servicescape constructs in this research consist of the following four dimensions: ambient conditions; layout and functionality; signs, symbols and artifacts; and social factors.

2.2.1. Ambient Conditions (AC)

Ambient conditions are categorized as temperature, noise, music, lighting, odor, and air quality [20]. Ambient conditions have been used extensively as antecedents of servicescape quality [19,35,42]. Performance of ambient conditions in a store is found to play a significant factor in driving customer positive response and increase the intention to repurchase or spread positive word-of-mouth [43]. Hence, this study hypothesizes that:
H1. 
Ambient conditions have a positive relationship with the perceived quality of offline servicescape of a retail store.

2.2.2. Offline Layout and Functionality (LFF)

Layout and functionality refer to the arrangement of equipment and furnishing, and their ability to accommodate customer needs [21]. Proper arrangement of layout and functionality of equipment may make it easier and faster for customers to search for products they desire [36]. In addition, the layout should be arranged in such a manner that it allows the customer to have spacious movement. Poor spatial layout arrangement may inhibit customer movement, and subsequently lead to customer dissatisfaction with the service. Layout and accessibility have been found to positively influence perceived quality of servicescape in leisure settings [23,42]. Thus, this study posits that:
H2. 
Layout and functionality have a positive relationship with the perceived quality of offline servicescape of a retail store.

2.2.3. Signs, Symbols, and Artifacts (SSA)

Signs, symbols, and artifacts can be represented by the architectural and interior design, usage of symbols, signs, directions, and material quality [44]. Therefore, it comprises both explicit (e.g., signage) and implicit (e.g., quality of materials, artwork, and decoration) signals [21]. They are the most significant element influencing customer pleasure in restaurant settings [44]. Ref. [45] also points out that good decoration of an exhibition may lead to customer satisfaction and the willingness of the customer to stay longer. Hence, in a retail store study setting, this study postulates that:
H3. 
Signs, symbols, and artifacts have a positive relationship with the perceived quality of offline servicescape of a retail store.

2.2.4. Social Factors (SF)

Social factors in servicescape encompass both employees and customers characteristics, as well as their interactions, playing an important role in generating customer satisfaction, perceived value, and loyalty [25]. Retail store managers should carefully manage the built environment in the social dimension because incompetent and unfriendly salespersons are a source of customer irritation when shopping in a store [19]. The study then posits that:
H4. 
Social factors have a positive relationship with the perceived quality of offline servicescape of a retail store.

2.3. Online Servicescape

An online servicescape is defined as the online environmental factors that influence online service quality [27]. Based on prior research, the online servicescape in this research consists of aesthetic appeal, layout functionality, financial security, and social presence [26,27,28,29,30].

2.3.1. Aesthetic Appeal (AA)

Aesthetic appeal may be considered a surrogate of [21]’s ambient conditions in online contexts [27,29,30]. The website’s aesthetic appeal and design are one of the most important elements in online servicescapes [27]. Aesthetic appeal is defined by [27] in the following three subdimensions: visual appeal, design originality, and entertainment value. Ref. [27] finds that aesthetic appeal is the strongest factor in driving customer trust towards online shopping experience. Hence, the following hypothesis is posited:
H5. 
Aesthetic appeal has a positive relationship with perceived quality of online servicescape of an online retail store.

2.3.2. Online Layout and Functionality (LFL)

Layout and functionality in online context are still in line with [21]’s second servicescape dimension. Online layout refers to the design, configuration, structure, and adaptability of a website (or mobile application), while functionality refers to the extent to which those objects support the service objectives [27]. Ref. [30] identifies three subdimensions of layout and functionality (usability, relevance of information, and customization) and finds that layout and functionality are the most important elements for heavy internet users to shop online. Hence, we propose:
H6. 
Layout and functionality have a positive relationship with the perceived quality of online servicescape of an online retail store.

2.3.3. Financial Security (FS)

Financial security replaces [21]’s signs, symbols, and artifacts in the online environment, given its higher relevance in this context [27,29,30]. Ref. [30] identifies two subdimensions of financial security (ease of payment and perceived security) and finds that the higher the perceived security on a website, the higher the customer satisfaction and trust when purchasing in an online store. Hence, this research hypothesizes that:
H7. 
Financial security has a positive relationship with the perceived quality of online servicescape of an online retail store.

2.3.4. Social Presence (SP)

According to [46], social presence in e-commerce websites can be represented by avatars, online helpdesk or online communities. Customers’ warm feelings may be developed by providing two-way communication, forum, chat rooms or virtual agents, and social presence in a website has a positive influence on customer’s pleasure emotion and satisfaction [18]. Hence, we propose the following:
H8. 
Social presence has a positive relationship with the perceived quality of online servicescape of an online retail store.

2.4. Perceived Quality of Offline (PQF) and Online (PQL) Servicescape

Perceived quality of the servicescape can be defined as the customer’s perception of the built environment’s (offline or online) excellence or superiority. Interest in the quality of servicescapes has grown dramatically in the e-commerce era because retailers face the added task of providing high quality service across both offline and online media to stay competitive [39]. When customers perceive that the service quality is above their expectations, they tend to be more satisfied [47].
Perceived servicescape quality has a positive influence on customer satisfaction [23]. Ref. [42] further finds that each element of the servicescape entails a different level of customer perceived quality, which further influences their satisfaction level. Hence, we propose the following:
H9. 
The perceived quality of offline servicescape has a positive relationship with customer satisfaction with multichannel retailers.
H10. 
The perceived quality of online servicescape has a positive relationship with customer satisfaction with multichannel retailers.

2.5. Satisfaction (SA) and Repurchase Intention (RI)

Satisfaction is the consumer’s evaluation of the fulfillment of their expectation of the service or product offered [16]. According to [48], customer satisfaction refers to the customer’s contentment level as a result of the ability of the service to fulfill the customer’s expectation. Customer satisfaction is commonly used as an antecedent of repurchase intention [49,50,51]. Repurchase intention is defined as the customers’ willingness to buy again a product (goods/service) from the same company, based on their current experience [48]. Repurchase intention may also be seen as the intention of customers to purchase again the product/service given by the provider in the future [52]. Satisfied customers are willing to pay and purchase more in the future than dissatisfied customers [53], and customer satisfaction leads to an increase in purchase volume and firm profitability [54]. In online contexts, customer satisfaction also influences repurchase intention [55,56,57]. Hence, this research hypothesizes that:
H11. 
Satisfaction has a positive relationship with customer repurchase intention of multichannel retailers.
The theoretical framework is summarized by Figure 1.

3. Research Design and Methodology

3.1. Sampling and Data Collection Method

The empirical testing of the model involves a quantitative study, where the unit of analysis is the individual multichannel retail consumer. The sample population includes Indonesian multichannel retail consumers. The research uses non-probability sampling, a sampling procedure which does not give all the individuals in the population equal chances to be selected [58]. In particular, the research uses convenience sampling. The sample comprises individuals who are consumers of retail brands that employ multichannel strategies (brick-and-mortar and mobile application) and have shopped in both their offline and online app stores. For the online channel, we observe the consumers who shop through mobile apps considering the high penetration of mobile phones in Indonesia [8]. The brands used in this study are ‘Matahari Department Store’ and its ‘Matahari mobile application’ (fashion), ‘Hypermart’ and its ‘Hypermart mobile application’, ‘Indomaret’ and its ‘Klik Indomaret mobile application’ (grocery and personal care), ‘Ace hardware’ and its ‘Ruparupa mobile application’ (home appliances). These sectors were selected because they are among the top ten best-selling online product categories in Indonesia [59]. The company selection is based on [60], which lists the Indonesian top performer brands in each category.
Self-administered questionnaires were used as the primary source of data collection. There were four sets of questionnaires, each set was for each retailer’s (Matahari, Hypermart, Indomaret, and Ace Hardware) customers. In order to be eligible to fill in one set of questionnaires, each respondent had to have purchased from the respective retailer’s offline (brick-and-mortar) and mobile application store at least once within the last one year. The questionnaires were delivered conveniently using a snowballing approach through Google Forms and were distributed via several online communication means, such as WhatsApp, Facebook, and email.
The minimum sample required was estimated by the ‘ten times the larger number of inner model paths’ rule of thumb in partial least squares structural equation modeling (PLS-SEM) [61]. Hence, the minimum sample was set to 40 (10 times 4, see Figure 1). There were 288 eligible respondents. The data from 288 respondents were further cleaned up to remove responses with straight-line responses to ensure data quality [62]. The result of the data cleaning produced 171 usable data points. This number of samples is above the minimum required for PLS-SEM analysis. PLS-SEM method has prediction-orientation capability, and the previous literature has long suggested that the method can be applied when the sample size is relatively small [63]. The demographics of the sample are shown in Table 1.
From Table 1, 65 percent of the respondents are male. Most respondents range from 20 to 39 years old (88 percent in total). More than half of the sample is married (51 percent) and around 55 percent of the respondents live in Kalimantan, but mostly all live in big cities in Indonesia. Private employees comprise most of the sample (68 percent) and more than half of respondents (56 percent) have an income of less than IDR 5 million per month. The characteristics of our sample are in line with the profile of Indonesian multichannel shoppers.

3.2. Measurement Instrument

Offline servicescape variables were measured according to the physical store condition and are based on indicators from [19,42,64]; ambient condition and offline layout were modeled as composite in mode B, whereas online servicescape variables were measured based on the online store performance (mobile application in this case) and draw on [18]’s and [29]’s scales; online layout was modeled as composite in mode B as well. Indicators of perceived quality of online and offline servicescapes were measured using [24]’s scales, and satisfaction and repurchase intention were measured by using indicators from [65]. The operational definitions and indicators are detailed in Table A1 in Appendix A.

3.3. Data Analysis

The data collected in this research were analyzed using PLS-SEM with Smart PLS version 3.3.1. PLS-SEM has several advantages, such as working for both theory development and prediction, with unusual or non-normal data, smaller sample sizes, highly complex models, and composites, formative, or reflective constructs [61]. This research is an exploratory study where there has not been a theory integrating online and offline servicescape dimensions in the prediction of customer satisfaction. Thus, PLS-SEM is adequate for the research’s objective. As additional manipulation check, and to discard the effect of the specific store, we observed the differences between item indicators across the four retailers included in the study; from our initial analysis using one-way analysis of variance, we found statistically significant differences across most indicators between Ace Hardware and the rest of retailers. Particularly, all values were slightly higher in the case of Ace Hardware; while the other three retailers are originally from Indonesia, Ace Hardware is a joint venture based on the United States, and therefore the cultural focus on satisfaction, superior service and carefully crafted shopping experiences might be the cause of these differences. Accordingly, we included PLS multigroup analysis (PLS-MGA) as part of the research method.

4. Research Results

4.1. Validity and Reliability Measurement Result

The questionnaire items were tested against internal reliability and convergent validity. According to [61], the items pass convergent validity if the outer loadings are higher than 0.7 and if the average variance explained (AVE) of the construct is higher than 0.5. Discriminant validity was also checked to ensure that the constructs were significantly different from one another. One of the methods to examine the discriminant validity is the Fornell–Larcker criterion [66], where the AVE of each construct should be greater than the squared correlations of with other constructs. A new criterion to check discriminant validity is the heterotrait-monotrait ratio of correlations (HTMT). HTMT has two advantages over the Fornell–Larcker criterion: higher sensitivity and better specificity [67]. The maximum threshold for HTMT is 0.9 [67]. Because we found values close to 0.9, we also further investigated discriminant validity by observation of HTMT2 (a recent and improved version of HTMT) values with statistical inference [68] using the cSEM package in R. The analysis returned HTMT2 values lower than 0.9 and in all cases the upper bound of the 90% bootstrap confidence interval (alpha = 0.050) did not include 1, which suggests that the correlation between latent variables is significantly different from 1 and discriminant validity can be established.
After an initial analysis of the complete model, we observed collinearity issues between some constructs due to high correlation among specific indicators. Based on the result of this initial analysis, we initiated an item depuration process. The rationale for item depuration sought to preserve content validity of the constructs. First, for offline layout and functionality, we removed the item from [42] and retained only the two items from [19]; for signs, symbols, and artifacts, we retained only the items referring to implicit signs, consistent with the definition and operationalization in [44,64]. For social factors, we retained only two items (“The sales associates are welcoming” and “The sales associates are competent”); this decision is not in line with [19], where items referring to competency and presentability of sales associates were deleted, and may be related to specific cultural differences between the context of the original study (Belgium) and ours. For aesthetic appeal, we only retained the two items referring to purely aesthetic aspects of the application, based on the observation of low loadings of the remaining items in [29]. In the case of online layout and functionality, the analysis showed clear differences related to the multidimensionality of the construct, which includes aspects related to usability, relevance of information, customization, and interactivity; after a critical analysis of the results of [30], we focused on aspects related to usability. A similar reasoning was followed for the depuration of items related to ease of payment in financial security, which led to retain the only two items related to perceived security in [29]. In social presence, we removed one item (“The mobile application has human warmth”), a decision consistent with the low factorial loading of the item in [69]. Finally, we chose to retain a single indicator in ambient conditions, satisfaction, perceived quality of online servicescape and perceived quality of offline servicescape; in the case of the former two, the decision was made for simplicity, after observing that we arrived to similar results using the composite formulation and the single-item formulation, with composite formulation causing discriminant validity issues; in the case of the latter two, the decision was made to focus on measurement of performance, rather than expectations or normative standards included in [23].
The final analysis of the outer model yields AVE of all items that are higher than 0.5. The composite reliability and Cronbach’s alpha of each item are also higher than the recommended thresholds of 0.7 and 0.6, respectively. Table 2 summarizes the internal reliability and convergent validity analyses. Table 3, Table 4 and Table 5 summarize the discriminant analysis test using the Fornell–Larcker, HTMT and HTMT2 criteria, respectively, all of which confirm discriminant validity of the model. Additionally, we checked for common method variance using ex-post analysis; following [70], if all VIFs resulting from a full collinearity test are lower than 3.3, the model can be considered free of common method bias, even though the threshold could be somewhat higher when factor-based algorithms are used. In our case, we found two values slightly over the 3.3 threshold (ambient condition, at 3.647, and online layout and functionalities, at 3.616); while, upon these results, we cannot discard the effect of common method bias, the values are close enough to the threshold to assume that collinearity is likely not a critical issue in the structural model.

4.2. Structural Model Analysis

After completing the reliability and validity tests, the structural model was assessed using a bootstrapping procedure. All research hypotheses were supported by the analysis. The result of the hypothesis testing is presented in Table 6. Both perceived quality of offline servicescape and perceived quality of online servicescape have positive relationships with satisfaction, and satisfaction has a positive relationship with repurchase intention.
The explained variances (R2) of perceived quality of offline and online servicescapes are 0.829 and 0.759, respectively. As the R2 values are higher than 0.75, they imply substantial or strong level of predictive accuracy [71]. The R-squared values of satisfaction and repurchase intention are 0.654 and 0.721, respectively. As the R2 values are higher than 0.5, they imply moderate level of predictive accuracy [71]. Table 7 summarizes the R-squared values of the inner model.
As mentioned in Section 3.3, we performed a PLS-MGA to check for differences across retailers, focusing on the two groups where differences across indicators had been observed (Ace Hardware, N = 85; the other three retailers, N = 86). The analysis found significant differences only in the financial security → perceived quality on online servicescape relationship (β = 0.561, Ace Hardware; β = 0.121, rest of retailers; both significant at p < 0.05); the explanation for this difference may be found in the fact that Ace Hardware offers the largest array of payment providers and options.

5. Discussion

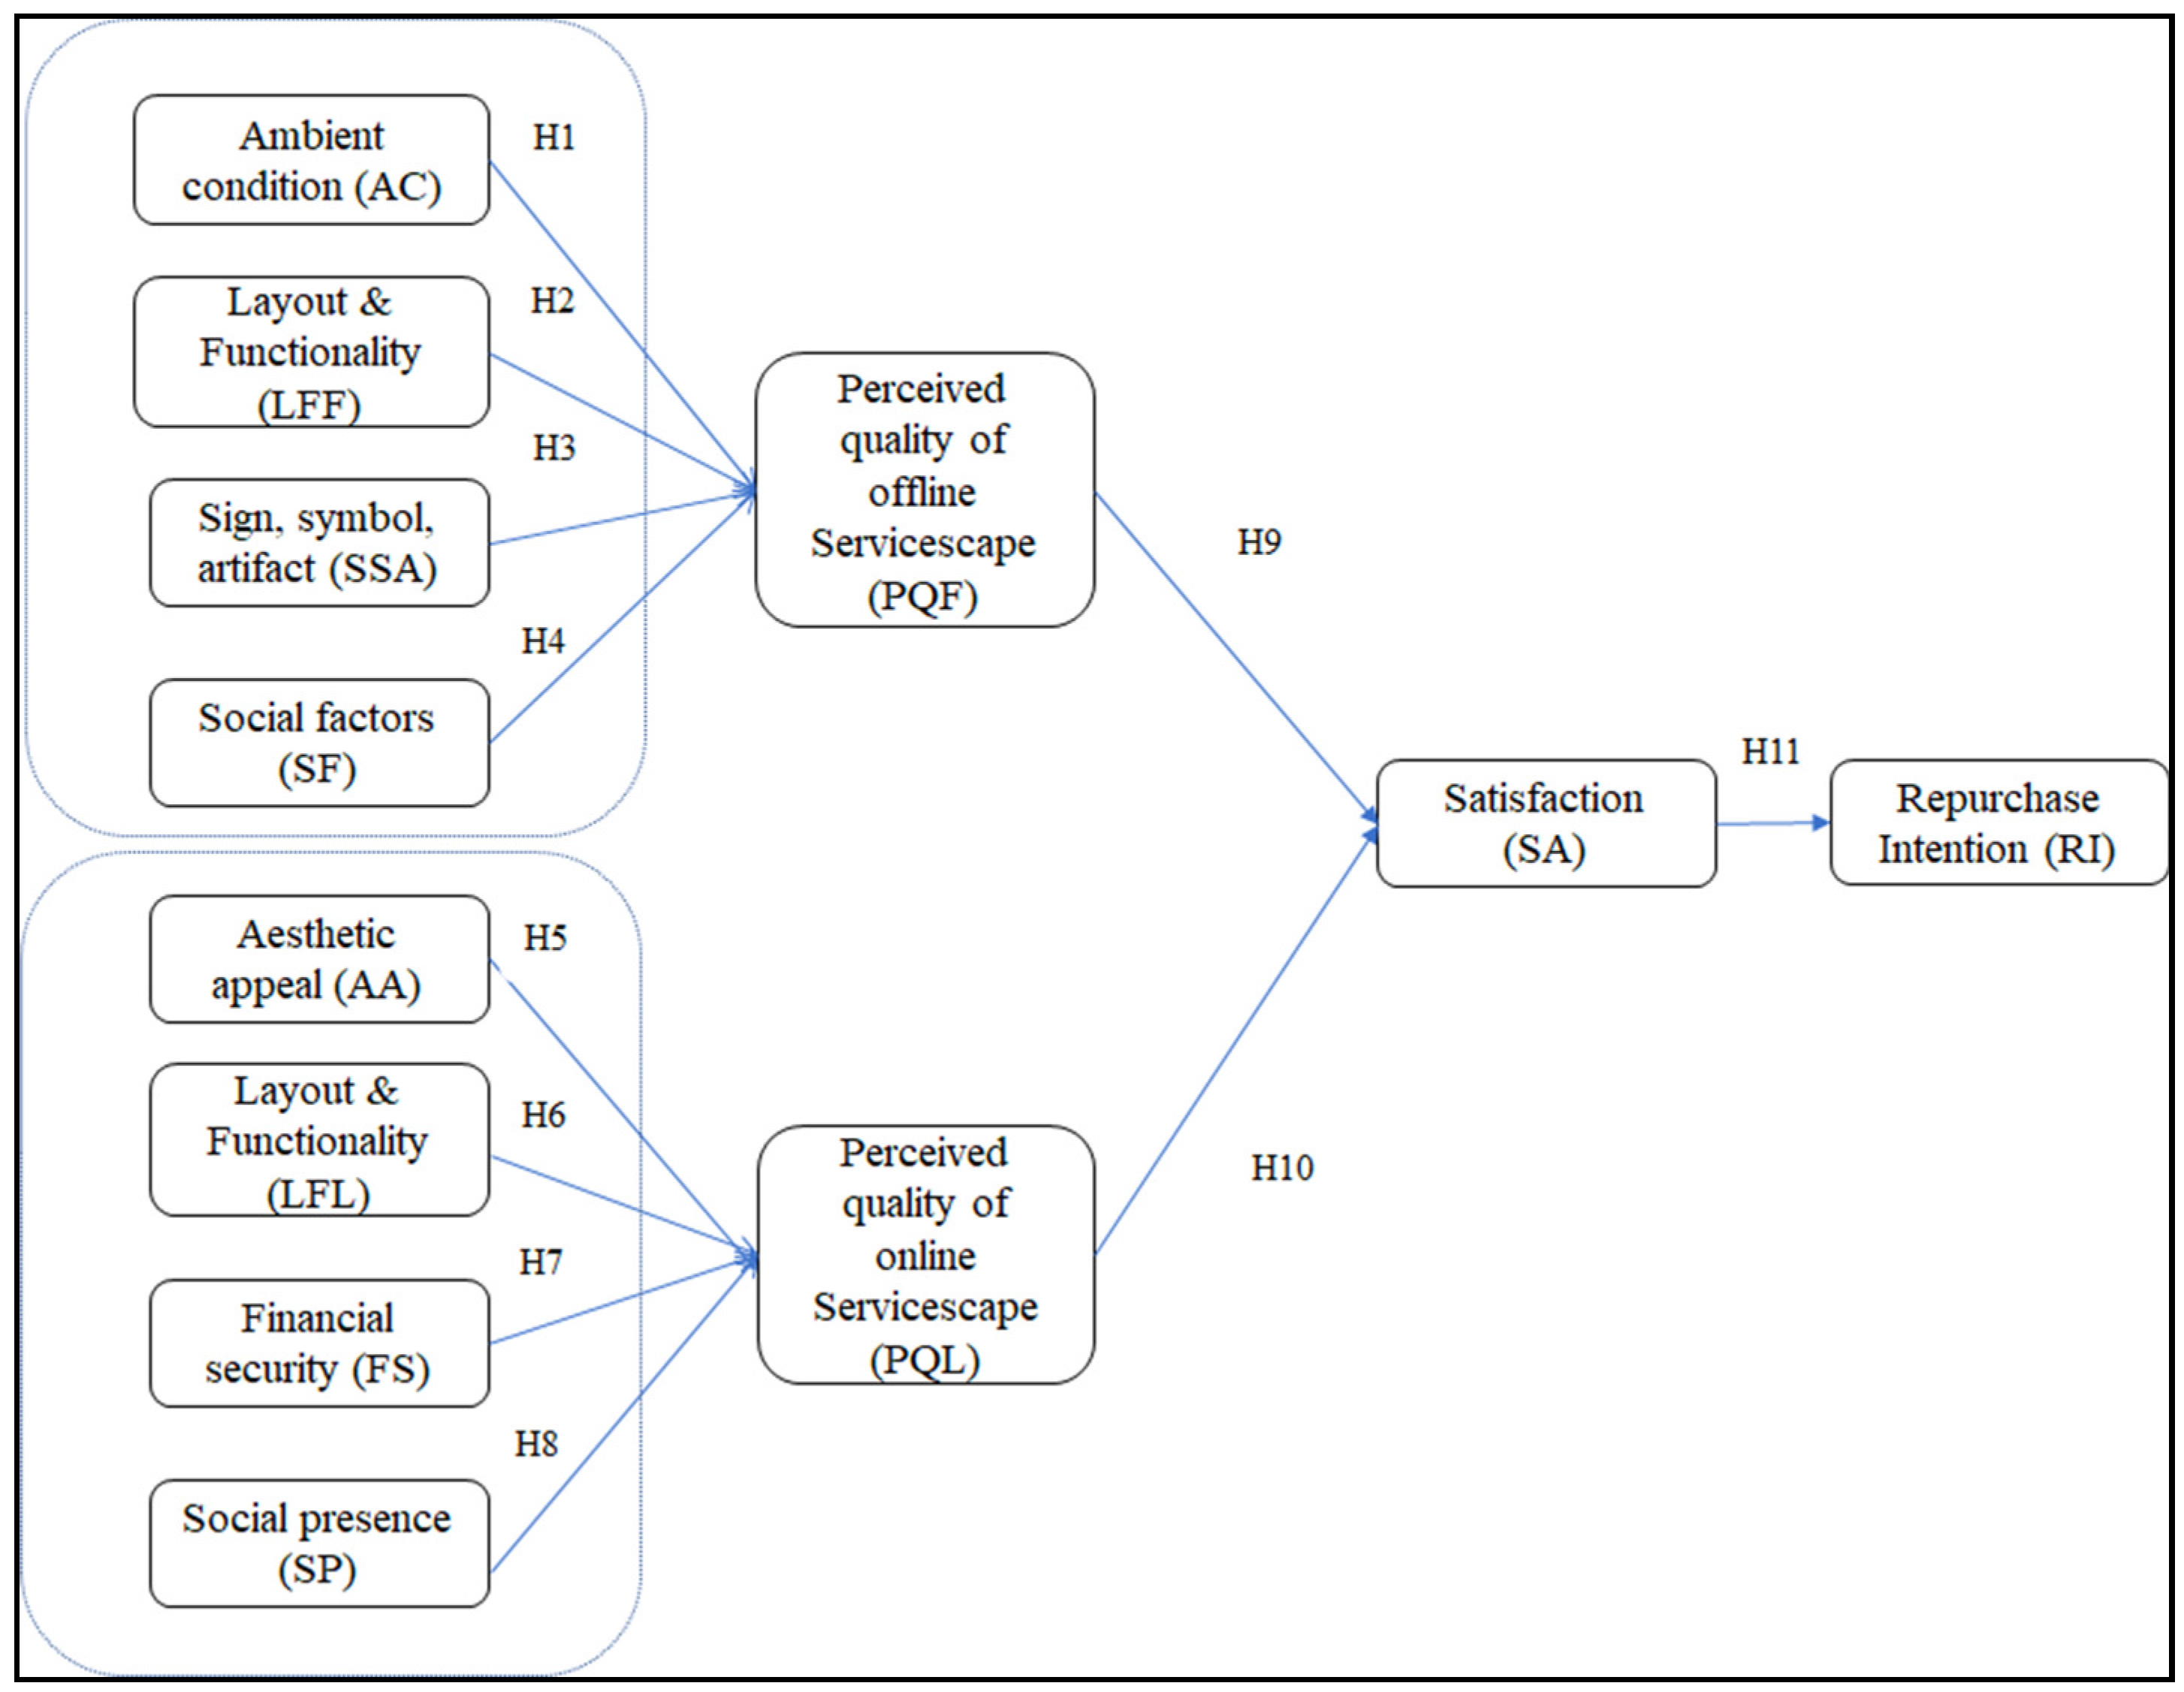
All the research hypotheses were supported by the analysis. Regarding H1 (ambient conditions have a positive relationship with the perceived quality of offline servicescape of a retail store). The results suggest that ambient conditions are the most important element in providing service excellence in an offline retail store. The results support [44]’s finding that ambient conditions, such as air quality, music, odor, lighting, and overall ambient conditions influence emotional state both arousal and pleasure when they visit a restaurant that may be extrapolated to wider retailing contexts. This result is also in line with [36] and suggests that competitive advantage can be achieved by providing and maintaining a good store environment using elements such as scent, lighting, music, and air quality.
The analysis supports H2 (i.e., layout and functionality have a positive relationship with the perceived quality of offline servicescape of a retail store). This finding complements previous studies (e.g., [23,72]), which also support the relationship. According to [73], grocery shoppers can be sensitive about the layout of the store, in addition to odor and noise. Further, [74] also finds that appealing exhibition dimension of a furnishing store’s image is significantly related to the layout of the store.
H3 (signs, symbols and artifacts have a positive relationship with the perceived quality of offline servicescape of a retail store) was supported, in line with [23,44,64]. Signs, symbols and artifacts are represented by the store architectural design, interior design, and the presence of signages. The service environment is the first component of the service experienced by the customer as they enter a retail store, and it is at that point where customers are likely to start creating expectations about the quality of service the company may provide [36]. Good store architectural and interior design enhances the customer impression level towards the stores. In addition, sufficient, clear, and easy to understand signage facilitates customer’s completion of their purchasing activities [64]. About fifty percent of the respondents declared that they were Ace Hardware customers, and product display and store design are key elements of visual merchandising on this home appliances retailer [74]. In addition, about sixty percent of the respondents are male shoppers, who are task-focused shoppers and prefer shopping at the store where they can find what they like easily [75].
The findings support H4 (i.e., social factors have a positive relationship with the perceived quality of offline servicescape of a retail store). This finding is in line with results of [18], who state that the presence of unfriendly and incompetent salespeople is a source of irritation for both hedonic and utilitarian customers. Although [73,76] argue that nowadays people live in a context where demand for social proximity has decreased and that people today are more informed and know more precisely what they want prior their shopping on a store, apparently retail customers in an emerging market such as Indonesia may still tend to look for salespersons in the store if they need information. As such, they are looking especially for welcoming and competent salespeople [19,77]. In other words, consumers like to feel welcome when they enter the store and expect sales associates to solve any issues rapidly and effectively. As mentioned earlier, the different emerging conceptualization of this variable when compared to [19], might indicate differences about how social factors are considered across cultures.
In the online (mobile app) context, the analysis supports H5 (aesthetic appeal has a positive relationship with the perceived quality of online servicescape of an online retail store). This finding may be explained by the demographic characteristics of the respondents: about 66 percent of them are home appliance and clothing customers, and the visual presentation of home décor and apparel products is an important factor to affect customer purchasing decisions [78,79]. This finding complements [80], which states that aesthetic appeal has the biggest effect on consumer responses and suggests that more attractive look-and-feel helps customers better enjoy the online shopping climate. Therefore, professional designers, software architects, and user-experience engineers need to emphasize their mobile application visual appeal and maximize the effectiveness of its usage. Badly built websites (or mobile applications, in this case), with long loading times, may lead to unfavorable expectations of consumers and losing interest or terminating the process altogether [81]. Appropriate design of mobile applications in which retail-related goods and services are sold or provided can be a powerful tool for enhancing performance, customer loyalty, and competitive advantage [82].
The results also support H6, and therefore layout and functionality have a positive relationship with the perceived quality of online servicescape of an online retail store. These measurements include settings for the layout, structure, navigation, and adaptability of the mobile application. The layout is known as the overall website—or mobile phone application—design, structure, and adjustment [27]. Several studies show that online layout and functionality have a significant relationship with purchase intention in online shopping [30], attitude towards the website [83], trust on the website [27], and perceived e-shopping value [29]. In this research, online layout and functionality is associated with usability, and easy and intuitive logical navigation. Layout and functionality of the mobile apps of the retailers turn out to be the most significant elements in providing excellent online service quality as perceived by the Indonesian consumers, implying the relevance of the mobile app to be used for information search by the customers. Ease of navigation is related to finding the product consumer needs fast and being aware of where and when users are in the online platform [84]. Simple navigation allows users to stay longer on the online platform and help to decrease bounce rates; it also helps customers to explore the online platform and to know more about the retailer’s products or services, giving them trust in the retailer brand [85].
The analysis supports H7 (i.e., financial security has a positive relationship with the perceived quality of online servicescape of an online retail store). Previous studies [27,29,30,86] highlight the importance of financial security in driving customer trust, perceived value, loyalty, and attitude towards an e-commerce site. Although many Indonesian consumers nowadays do not seem to be concerned about companies collecting their personal information while using the internet, and although Indonesian customers perceive that convenience and pleasure are more important than online platform security [87,88], it seems that a larger part of Indonesian online consumers still find that online financial security is important. For instance, [89] reports that convenience and security of e-commerce transactions are still becoming an issue for Indonesian e-tailing consumers.
The results show that social presence has a positive relationship with the perceived quality of the online servicescape of an online retail store, in support of H8, which confirms the findings of [18,39]. Social presence is the perceived salience of other people in contact or the impression that individuals communicate with real people, and it has a significant effect on building trust in the virtual world [88]. Social presence can be infused in a virtual world—or a mobile application—by providing socially rich descriptions and pictures, an avatar or a live chat with the customer service representative. Online chat is seen as a cost-effective way of serving consumers, as it enables consumers to check for service-related information and to contact a sales representative who can answer their questions [90]. The social presence decreases the perceived social gap between buyers and sellers and makes it easier for them to develop a trustworthy relationship [91]. The company-consumer relationship can also be assessed through the elements of personalization and responsiveness on a website. These elements concern the retailer’s sensitivity to customer needs, and the degree to which the retailer enables customers to personalize their shopping experience [37]. For millennials (88 percent of the respondents), personalization and relevance are key factors in deciding on their online purchase [92].
The perceived quality of offline servicescape has a positive relationship with customer satisfaction of a multichannel retail brand, and therefore H9 is supported. This result confirms the positive impact of servicescape on customer satisfaction and service quality perceptions from prior research [19,23,42,44,77,93]. In this study of Indonesian retailers, the dimensions of offline servicescape that most influence customer satisfaction are ambient conditions and signs, symbols, and artifacts, the former with higher effect than the latter. Details and signs should be designed in such a way as to increase consumer awareness and understanding of the facility [93].
H10 (the perceived quality of online servicescape has a positive relationship with customer satisfaction with multichannel retailing brands) is also supported, complementing [19,28]. Ref. [28] finds that e-servicescape dimension has a strong influence on the customer’s trust of a website. Enhancing the e-servicescape aspect would increase the consumer satisfaction of an online shop, increase the likelihood of repeated transactions, and generate positive word-of-mouth about the online store [30]. In this study, the most prominent element of online servicescape affecting perceive quality is layout and functionality, followed by financial security and the aesthetic appeal.
Finally, satisfaction has a positive relationship with customer repurchase intention in multichannel retailers, in support of H11. Satisfaction as predictor of repurchase intention has been broadly analyzed and a strong correlation between them has been established previously [52,54,56,57]. High levels of satisfaction with the service increase customers’ desire to buy and can further inspire customers to continue the transaction with the retailers and recommend it to other customers [52]. Repurchase intention is beneficial to a company as it has a strong relationship with customer loyalty [19]. Loyal customers spend more, buy more regularly, have more motivation to pursue information, are more immune to promotions from rivals, and are more likely to spread positive word-of-mouth [19].

6. Conclusions

The findings of this research provide evidence that complement previous scholarly works and present new insights that may be of interest for researchers and practitioners in retailing. The results can contribute to retailing strategy development considering the ever inclination of consumers to shop online since the COVID-19 pandemic [94] and toward the omnichannel model in which the total integration of various channels, media, and platform shape the service interface and creates a seamless experience for the consumers [4,95].

6.1. Theoretical Implications

The research findings suggest that ambient conditions, signs, symbols and artifacts, social factors, and layout and functionality, and have a positive relationship with the perceived quality of offline servicescape. The result confirms prior research in different traditional (offline) retail settings (e.g., [19,23,29,39]). This study gives evidence that the ambient conditions of a brick-and-mortar store (i.e., the consumer’s perception that the overall ambient condition in the store makes it comfortable for them to stay inside) has the greatest impact on the perceived quality of servicescape and suggests that retailer’s attention should be directed at enhancing shopping experience through careful design and attention to details. As [37] finds, improved ambient conditions of furniture retailers are important to trigger positive cognitive and emotional responses in consumers. Because our research study focuses on retailers that mostly sell goods, further research on wider retail sectors—such as pure services (e.g., banking, hospitality)—and different demographic characteristics, needs to be conducted to confirm the relevance of ambient conditions in the perceived quality of the offline servicescape in the services industry.
On the other hand, the perceived quality of online servicescape is positively influenced by online layout and functionality, financial security, aesthetic appeal, and social presence. The analysis seems to confirm that the findings of previous research that focuses on the retailer’s webstore can be of direct application in mobile contexts, too. Layout and functionality of the retailers’ mobile apps turned out to be the most relevant variable affecting the perceived quality of online servicescape. This finding may be explained by Leung et al.’s [96] finding that, in the context of physical exhibitions moving to the online world, non-art exhibition visitors put high emphasis on the online layout and functionality because they focus on informative issues. That is, shoppers value highly the provision of information within the app. This setting of [96] is on par with this research in the sense that all the retailers in this research are traditional brick-and-mortar retailers that are expanding to the online channel and that they sell mostly functional goods (i.e., non-art products).
Customer satisfaction is influenced positively by both perceived quality of offline and online servicescapes. Customer satisfaction with the offline and online environments also serves as a strong predictor of repurchase intention. Hence, perceived quality of offline and online servicescapes have indirect effect on repurchase intention, via customer satisfaction. In addition, this research shows that perceived quality of the offline servicescape has more significant impact on customer satisfaction than that of the online servicescape. This is an important finding because it suggests that, despite the increase in online channel utilization, the offline dimension of servicescape is still proven to be relevant, important, and significant in increasing service quality, leading to customer satisfaction and repurchase intention. This finding is one novel theoretical contribution of this research because previous studies in multichannel retailing did not reveal the different potential impact of offline and online servicescapes on customer satisfaction.
The results of this research complement recent scholarly works on multichannel retailing from a service quality perspective. While the conceptual framework of this study is based on grounded theory on servicescapes, recent research offers other approaches, such as those based on social influence theory [97] or cognitive and affective customer experience [98]. For instance, [97] conclude that multichannel customers tend to continually adjust their choices regarding retailer and the respective channel when making purchases, implying that multichannel retailers need to adopt strategies relating to customers’ changing behavior to maintain the same service quality level in each channel, and [98] find that cognitive customer experience and affective customer experience influence repurchase intention, with the stronger effect coming from affective customer experience. Our research, combined with the results of these studies, suggests the importance of strategically planning the service environment of retailing in order to attract and maintain multichannel customers.

6.2. Managerial Implications

One of the approaches to achieve competitive advantage in multichannel retailing is by providing excellent service quality [20]. The results of the study provide valuable insight about which elements should multichannel retailing practitioners focus on to better tailor their marketing strategies and improve service quality. From the findings of this research, all the online and offline servicescape dimensions seem to play, to a greater or lesser extent, a significant positive role in affecting the consumers’ perceived quality, which may further result in positive satisfaction with the retailer and, ultimately, trigger customer’s repurchase intention. Perceived quality of offline servicescape emerges as a stronger predictor of satisfaction than perceived quality of online servicescape. Therefore, the presence of the online store or mobile app should not replace the physical store’s operation. Physical retail stores are still appealing; thus, retail store managers need to provide competitive advantage from the servicescape perspective to attract their customers. Multichannel retailers cannot abandon physical stores, and instead they should combine them with their online stores [2]. The future of retail is ‘phygital’, a model in which physical and digital environment are integrated to offer a seamless experience to customers. Complete e-commerce adoption does not mean that one hundred percent of transactions must occur in the online channels. The physical store is not going to disappear, but its role is vastly changing [99].
In this research, perceived quality of offline servicescape is strongly influenced by ambient conditions, followed by signs, symbols, and artifacts, social factors, and by the layout and functionality. Ambient conditions of the physical stores can be improved by simply ensuring that the lighting is adequate [100], providing good air quality marked by convenient temperature and humidity [101], ensuring good smell inside the store, and the provision of adequate music [102]. Comfortable store ambience can provide enjoyable experiential value [103]. Regarding signs, symbols, and artifacts, retailers could enhance the physical store design by either simple or advanced means. For example, simple improvement includes the redesign the signage in an attractive way, repainting the store environment with calm, relaxing or playful colors (depending on the type of retailer), revamping product presentation, and adding themes or pictures in the stores. Advanced improvement can be achieved by using technology stimuli, such as installing self-checkout machines combined with sensor fusion and deep learning to track the product taken or returned into the shelves to create a unique shopping experience, such as the ones seen in Amazon Go stores [104]. Architectural interior design is suggested to use specific element that characterizes the brand image of the retailer [37]. Regarding social presence, retailers should train and improve the skills of employees and sales associates, taking care of their physical appearance and fostering behaviors that live up to the expectations of customers [77], especially regarding their ability to provide a warm welcome and a competent service, including knowledge about the products and problem-solving abilities. To improve layout and functionality, retailers can develop engineered layouts, such as the one used by the furniture retailer IKEA, which provides one-way directional layout plus an interactive dimension [105]; other solutions include the provision of in-store tablets or computers to facilitate product information search, or other in-store technologies such as virtual fitting rooms, augmented reality, digital signals, in-store ordering, and automatic checkout [106].
Online servicescape elements can also improve customer satisfaction. Online layout and functionality are the most important elements of a mobile app’s servicescape, followed by financial security, aesthetic appeal, and social presence. Retailers can improve the online layout and functionality by first enhancing the adequacy of keywords with the product catalogue to improve search results, enriching product information, or simplifying the mobile application navigation; in short, by creating user-friendly applications [19,32]. Retailers should also maintain the mobile application and support continuous improvement and compatibility with latest mobile phone software updates to prevent or correct bugs [107]; that is, abandoning mobile app support is a luxury they cannot afford. To improve mobile application aesthetic appeal, companies need to invest on the mobile application design by employing professional designers, software architects, user experience experts, and engineers to maximize the software visual appeal, effectiveness, and to provide faster loading times [80]. As for social presence, the improvement can be achieved by enabling customer–company interaction through personalization or online live chat with customer service representatives, providing 24/7 online and responsive chat box, incorporating product suggestion functionality enabled by artificial intelligence, and providing product pictures with human touch [18,29,108].
Going further, it is worth to note that retailers, even in emerging markets such as Indonesia, should look forward to omnichannel marketing. In the future, retailers must adopt practices that offer the best virtual and real-life purchasing experiences. As such, retailers can consider using technologies that have tools that function as ‘click-and-collect’, ‘ordering in-store’, ‘delivering to home’, ‘order online, return to store’, and other combinations of online and traditional retail activities that make the shopping process easy and enjoyable [106].

6.3. Limitations and Future Avenues of Research

This research has limitations that open future avenues of research. First, the retail brands in this research are all from consumer goods dominated sectors. Wider industry sectors (e.g., energy, finance, telco, etc.) can be studied in the future to confirm whether the results of this research are sector specific. Second, the research considers customer satisfaction and repurchase intention as the outcomes of the perceived servicescape quality. Customer loyalty is also an important indicator that leads to higher customer retention rate [18]. While the relationship between repurchase intention and loyalty has been long established, future research could investigate customer loyalty as the outcome of perceived quality of combined offline and online servicescapes. Third, in this study, social factors of the offline and online servicescape dimension cover only the sales personnel; that is, they cover only elements on the company side; future research could incorporate other customers in both offline and online environments as contributors to social factors [19,109]. Fourth, the study observes the impact of multichannel strategy on customer behavior; future research might complement our results by investigating the impact of this strategy on the retailers’ business processes. Fifth, the retailers in this research are traditional brick-and-mortar companies that extend their operations to the online context; this shortcoming could be addressed by investigating how online-based retailers that begin to open brick-and-mortar stores [3] conduct their multichannel strategy and analyze the impact on customer behavior in a similar way to that in this study. Sixth, and final, we observed the following two threats to external validity of our research: on the one hand, and although the sample size in this research meets the minimum requirement for data analysis, a larger-scale analysis is deemed necessary to ensure generalizability of the results from this study; second, the results were mostly consistent across sectors, but we found slight differences as a result of the PLS-MGA analysis, which suggested that characteristics of the retailer, such as its country of origin, may play a role in how the quality of a servicescape is perceived; therefore, our findings should be confirmed by additional research covering other retailers in similar sectors.

Author Contributions

Conceptualization, A.S.A. and H.H.; methodology, A.S.A., Á.H.-G. and H.H.; software, A.S.A., Á.H.-G. and H.H.; validation, A.S.A., Á.H.-G. and H.H.; formal analysis, A.S.A., H.H., Á.H.-G. and P.P.; investigation, A.S.A. and H.H.; resources, H.H.; data curation, A.S.A. and H.H.; writing—original draft preparation, A.S.A. and H.H.; writing—review and editing, A.S.A., Á.H.-G. and P.P.; visualization, H.H.; supervision, A.S.A.; project administration, A.S.A. and P.P. All authors have read and agreed to the published version of the manuscript.

Funding

This research received no external funding.

Institutional Review Board Statement

Not applicable.

Informed Consent Statement

Not applicable.

Data Availability Statement

The data presented in this study are available upon request to the corresponding author.

Conflicts of Interest

The authors declare no conflict of interest.

Appendix A

Table A1. Measurement instrument All items were measured using seven-point Likert-type scales that were anchored by 1 = strongly disagree, 2 = disagree, 3 = slightly disagree, 4 = neutral, 5 = slightly agree, 6 = agree, and 7 = strongly agree. In light gray, items removed in the final analysis.
VariableOperational DefinitionIndicatorsReference
Ambient Condition (AC)Background conditions that exist below the level of immediate customer awareness [46]AC1 The temperature in the store is comfortable[42]
AC2 The air quality in the store is good
AC3 The background music/sound in the store is appropriate
AC4 The odor in the store is pleasant
AC5 The lighting in the store is adequate
AC6 Overall, the ambient condition in the store makes it comfortable to stay inside
Offline Layout and Functionality (LFF)The arrangement of furniture and equipment to fulfill customer’s enjoyment [72]LFF1 It is easy to find product in the stores[19,42]
LFF2 It is easy to find ways in the stores
LFF3 Overall layout of the stores make me easy to move around
Sign, Symbol, Artefact (SSA)Architectural design, interior design, décor, quality of materials, signage, etc. of thephysical environment [64] SSA1 Architectural style of the stores is attractive [42]
SSA2 Interior décor of the stores is visually appealing
SSA3 There is sufficient signage in the stores*
SSA4 The signage in the stores is large enough to be seen
SSA5 The signage in the facility is easy to be understood
Social Factors (SF)The presence of service personnel in the service environment [19].SF1 The sales associates are responsive[69]
SF2 The sales associates are polite
SF3 The sales associates are welcoming
SF4 The sales associates are competent
SF5 The sales associates are presentable
Aesthetic Appeal (AA)Ambient condition in online context where the customers found the website attractive or alluring [27]AA1 The way the mobile application displays its products is attractive[29]
AA2 I like the way the mobile application looks
AA3 The mobile application is adventurous
AA4 I think the mobile application is very entertaining
AA5 The enthusiasm of the mobile application is catching, it picks me up
Online Layout and Functionality (LFL)Website usability, information relevance, ability of customization and interactivity [27]LFL1 This mobile application is easily navigated[29]
LFL2 Navigation through the mobile application is intuitively logical
LFL3 The mobile application is easy to use
LFN4 The mobile application is user friendly
LFL5 Technical details about products can be easily accessed in the mobile application
LFL6 The mobile application is tailored towards me
LFL7 I feel that it is a very engaging mobile application
Financial Security (FS)The condition where online customers feel safe and secure to perform transaction on website [27]FS1Paying for goods through the mobile application is straightforward[29]
FS2 Paying for goods through the mobile application involves entering a lot of details
FS3 When buying from this mobile application, I am reassured by the security procedures
FS4 Overall, this mobile application seems security conscious
Social Presence (SP)The feeling of human warmth presence on the website [69]SP1I feel a sense of human contact via the mobile application[18]
SP2 The mobile application has human warmth
SP3 The mobile application has personalness
SP4 The mobile application has human sensitivity
Perceived Quality of Offline Servicescape (PQF)The customer perception towards the built environment (offline or online) excellence or superiority [23]PQF1 The overall quality of the offline store is great[23]
PQF2 The overall quality of the offline store is much better than expected
PQF3 The overall quality of the offline store is just what it should be
Perceived Quality of Online Servicescape (PQL)PQL1 The overall quality of the mobile application is great[23]
PQL2 The overall quality of the mobile application is much better than expected
PQL3 The overall quality of the mobile application is just what it should be
Satisfaction (SA)Evaluation towards the fulfillment of customer expectation from the goods/service purchased [16]SA1 I like to purchase products from this retailer[65]
SA2 I am pleased with the experience of purchasing products from this retailer
SA3 I think purchasing products from this retailer is a good idea
SA4 Overall, I am satisfied with the experience of purchasing products from this retailer
Repurchase Intention (RI)The intention of customer to purchase again the product from the retailer in the future [52]RI1 If I could, I would continue purchase product from this retailer[65]
RI2 It is likely that I will continue purchasing products from this retailer in the future
RI3 I intend to continue purchasing products from this retailer in the future

References

  1. Bressolles, G.; Lang, G. KPIs for performance measurement of e-fulfillment systems in multi-channel retailing: An exploratory study. Int. J. Retail Distrib. Manag. 2020, 48, 35–52. [Google Scholar] [CrossRef]
  2. Liu, H.; Lobschat, L.; Verhoef, P.C. Multichannel retailing: A review and research agenda. Found. Trends Mark. 2018, 121, 1–79. [Google Scholar] [CrossRef]
  3. CBInsights. Amazon and Alibaba Have Already Conquered Online Retail. Now They’re Coming for Offline. 2018. Available online: https://www.cbinsights.com/research/amazon-alibaba-physical-retail/ (accessed on 1 December 2020).
  4. Thaichon, P.; Phau, I.; Weaven, S. Moving from multi-channel to omni-channel retailing: Special issue introduction. J. Retail. Consum. Serv. 2020, 65, 102311. [Google Scholar] [CrossRef]
  5. Das, K.; Gryseels, M.; Sudhir, P.; Tan, K.T. Unlocking Indonesia’s Digital Opportunity. 2016. Available online: https://www.mckinsey.com/~/media/McKinsey/Locations/Asia/Indonesia/Our%20Insights/Unlocking%20Indonesias%20digital%20opportunity/Unlocking_Indonesias_digital_opportunity.ashx (accessed on 30 January 2021).
  6. Rastogi, V. Indonesia’s E-Commerce Sector—Market Potential and Challenges. 2019. Available online: https://www.aseanbriefing.com/news/indonesias-e-commerce-sector-market-potential-challenges/ (accessed on 11 January 2020).
  7. APJII. Penetrasi dan Profil Perilaku Pengguna Internet Indonesia. 2018. Available online: https://www.apjii.or.id/content/read/39/342/Hasil-Survei-Penetrasi-dan-Perilaku-Pengguna-Internet-Indonesia-2017 (accessed on 30 January 2021).
  8. We Are Social. The Changing World of Digital in 2023. 2023. Available online: https://wearesocial.com/uk/blog/2023/01/the-changing-world-of-digital-in-2023 (accessed on 20 February 2023).
  9. Aprindo. Bersaing di Era Digital, Hampir Seluruh Ritel Beralih ke Toko Online. 2019. Available online: https://www.aprindo.id/bersaing-di-era-digital-hampir-seluruh-ritel-beralih-ke-toko-online/ (accessed on 30 December 2019).
  10. Ryza, P. Alfamaret-Indomaret Competition Goes Online. 2015. Available online: https://dailysocial.id/post/alfamart-indomaret-competition-goes-online (accessed on 30 January 2022).
  11. Fajrina, H.N. Matahari Department Store Buka ‘Cabang’ Toko Online. 2016. Available online: https://www.cnnindonesia.com/teknologi/20161109144701-185-171475/matahari-department-store-buka-cabang-toko-online (accessed on 1 February 2022).
  12. Ningrum, D.A. 80 Persen dari Gerai Hypermart Buka Penjualan Online. 2017. Available online: https://www.merdeka.com/uang/80-persen-dari-gerai-hypermart-buka-penjualan-online.html (accessed on 1 February 2022).
  13. Farras, B. Ini Alasan Peritel Online Buka Toko Offline, Apa Kurang Puas? 2019. Available online: https://www.cnbcindonesia.com/tech/20190403095052-37-64461/ini-alasan-peritel-online-buka-toko-offline-apa-kurang-puas (accessed on 1 June 2020).
  14. Indonesia Investment. Battle of the Retailers: Department Stores vs E-Commerce Platforms. 2017. Available online: https://www.indonesia-investments.com/business/business-columns/battle-of-the-retailers-department-stores-vs-e-commerce-platforms/item8315 (accessed on 1 October 2019).
  15. Frasquet, M.; Descals, A.; Ruiz-Molina, M. Understanding loyalty in multichannel retailing: The role of brand trust and brand attachment. Int. J. Retail Distrib. Manag. 2017, 45, 608–625. [Google Scholar] [CrossRef]
  16. Oliver, R.L. A cognitive model of the antecedents and consequences of satisfaction decisions. J. Mark. Res. 1980, 17, 460–469. [Google Scholar] [CrossRef]
  17. Ali, A.; Bhasin, J. Understanding customer repurchase intention in e-commerce: Role of perceived price, delivery quality, and perceived value. Jindal J. Bus. Res. 2019, 8, 142–157. [Google Scholar] [CrossRef]
  18. Lee, C.; Eze, U.; Ndubisi, N. Analyzing key determinants of online repurchase intentions. Asia Pacific J. Mark. Logist. 2011, 23, 200–221. [Google Scholar]
  19. Demoulin, N.; Willems, K. Servicescape irritants and customer satisfaction: The moderating role of shopping motives and involvement. J. Bus. Res. 2019, 104, 295–306. [Google Scholar] [CrossRef]
  20. Voon, B.H. Role of service environment for restaurants: The youth customers’ perspective. Procedia Soc. Behav. Sci. 2012, 38, 388–395. [Google Scholar] [CrossRef] [Green Version]
  21. Bitner, M.J. Servicescape: The impact of physical surroundings on customers and employees. J. Mark. 1992, 56, 57–71. [Google Scholar] [CrossRef]
  22. Fernandes, T.; Neves, S. The role of servicescape as a driver of customer value in experience-centric service organizations: The Dragon Football Stadium case. J. Strateg. Mark. 2014, 22, 548–560. [Google Scholar] [CrossRef] [Green Version]
  23. Wakefield, K.; Blodgett, J. The effect of the servicescape on customers’ behavioral intentions in leisure service settings. J. Serv. Mark. 1996, 10, 45–61. [Google Scholar] [CrossRef]
  24. Miles, P.; Miles, G.; Cannon, A. Linking servicescape to customer satisfaction: Exploring the role of competitive strategy. Int. J. Oper. Prod. Manag. 2012, 32, 772–795. [Google Scholar] [CrossRef]
  25. Andrés, B.T.; Cervera-Taulet, A.; Calderón García, H. Social servicescape effects on post-consumption behavior: The moderating effect of positive emotions in opera-goers. J. Serv. Theor. 2016, 26, 590–615. [Google Scholar]
  26. Rosenbaum, M.; Massiah, C. An expanded servicescape perspective. J. Serv. Manag. 2011, 22, 471–490. [Google Scholar] [CrossRef]
  27. Harris, L.; Goode, M. Online servicescapes, trust, and purchase intentions. J. Serv. Mark. 2010, 24, 230–243. [Google Scholar] [CrossRef]
  28. Huang, D.; Li, Z.; Mou, J.; Li, X. Effects of flow on young Chinese consumers’ purchase intention: A study of e-servicescape in hotel booking context. Inf. Technol. Tour. 2017, 17, 203–228. [Google Scholar] [CrossRef]
  29. Tankovic, A.; Benazic, D. The perception of e-servicescape and its influence on perceived e-shopping value and customer loyalty. Online Inf. Rev. 2018, 42, 1124–1145. [Google Scholar] [CrossRef]
  30. Teng, H.; Ni, J.; Chen, H. Relationship between e-servicescape and purchase intention among heavy and light internet users. Internet Res. 2018, 28, 333–350. [Google Scholar] [CrossRef]
  31. Hassanein, K.; Head, M. The impact of infusing social presence in the web interface: An investigation across different products. Int. J. Electron. Commer. 2006, 10, 31–55. [Google Scholar] [CrossRef]
  32. Anindita, K. 7 Tantangan Besar dalam Industry Retail dan Solusi untuk Menghadapinya. 2020. Available online: https://www.hashmicro.com/id/blog/6-tantangan-besar-dalam-industri-retail/ (accessed on 1 December 2021).
  33. Neslin, S.A.; Grewal, D.; Leghorn, R.; Shankar, V.; Teerling, M.L.; Thomas, J.S.; Verhoef, P.C. Challenges and opportunities in multichannel customer management. J. Serv. Res. 2006, 9, 95–112. [Google Scholar] [CrossRef]
  34. Lynch, S.; Barnes, L. Omnichannel fashion retailing: Examining the customer decision-making journey. J. Fash. Mark. Manag. 2020, 24, 471–493. [Google Scholar] [CrossRef]
  35. Harris, L.; Ezeh, C. Servicescape and loyalty intentions: An empirical investigation. Eur. J. Mark. 2008, 42, 390–422. [Google Scholar] [CrossRef]
  36. Hooper, D.; Coughlan, J.; Mullen, M.R. The servicescape as an antecedent of service quality and behavioral intentions. J. Serv. Manag. 2013, 27, 271–280. [Google Scholar] [CrossRef] [Green Version]
  37. Colombo, B.; Laddaga, S.; Antonietti, A. Psychology and design. The influence of the environment’s representation over emotion and cognition. An ET study on Ikea design. Procedia Manuf. 2015, 3, 2259–2266. [Google Scholar] [CrossRef] [Green Version]
  38. Bouzaabia, O.; Riel, A.; Semeijn, J. Managing in-store logistics: A fresh perspective on retail store. J. Serv. Manag. 2013, 24, 112–129. [Google Scholar] [CrossRef] [Green Version]
  39. White, R.; Joseph-Mathews, S.; Voorhees, C. The effects of service on multichannel retailers’ brand equity. J. Serv. Mark. 2013, 27, 259–270. [Google Scholar] [CrossRef]
  40. Baker, J. The role of the environment in marketing services: The consumer perspective. In The Services Challenge: Integrating for Competitive Advantage; Czepiel, J.A., Congram, C.A., Shanahan, J., Eds.; American Marketing Association: Chicago, IL, USA, 1987; pp. 79–84. [Google Scholar]
  41. Booms, B.H.; Bitner, M.J. Marketing strategies and organization structures for service firms. In Marketing of Services; Donnelly, J.H., George, W.R., Eds.; American Marketing Association: Chicago, IL, USA, 1981; pp. 47–51. [Google Scholar]
  42. Siu, N.Y.M.; Wan, P.Y.K.; Dong, P. The impact of the servicescape on the desire to stay in convention and exhibition centers: The case of Macao. Int. J. Hosp. Manag. 2012, 31, 236–246. [Google Scholar] [CrossRef]
  43. Han, H.; Kiattipoom, K. Traveler loyalty and its antecedents in the hotel industry: Impact of continuance commitment. Int. J. Contemp. Hosp. Manag. 2019, 31, 474–495. [Google Scholar] [CrossRef]
  44. Ellen, T.; Zhang, R. Measuring the effect of company restaurant servicescape on patrons’ emotional states and behavioral intentions. J. Foodserv. Bus. Res. 2014, 17, 85–102. [Google Scholar] [CrossRef]
  45. Rashid, N.M.; Ma’amor, H.; Ariffin, N.; Achim, N. Servicescape: Understanding how physical dimensions influence exhibitors satisfaction in convention centre. Procedia Soc. Behav. Sci. 2015, 211, 776–782. [Google Scholar] [CrossRef] [Green Version]
  46. Lee, S.A.; Jeong, M. Effects of e-servicescape on consumers’ flow experiences. J. Hosp. Tourism Tech. 2012, 3, 47–59. [Google Scholar] [CrossRef]
  47. Li, Y.; Shang, H. Service quality, perceived value, and citizens’ continuous-use intention regarding e-government: Empirical evidence from China. Inf. Manag. 2020, 57, 103197. [Google Scholar] [CrossRef]
  48. Hellier, P.; Geursen, G.; Carr, R.; Rickard, J. Customer repurchase intention: A general structural equation model. Eur. J. Mark. 2003, 37, 1762–1800. [Google Scholar] [CrossRef] [Green Version]
  49. Adekunle, S.; Ejechi, J. Modelling repurchase intention among smartphones users in Nigeria. J. Model. Manag. 2017, 13, 794–814. [Google Scholar] [CrossRef]
  50. Srivastava, K.; Sharma, N.K. Service Quality, Corporate Brand Image, and Switching Behavior: The Mediating Role of Customer Satisfaction and Repurchase Intention. Serv. Mark. Q. 2013, 34, 274–291. [Google Scholar] [CrossRef]
  51. Oyedele, A.; Saldivar, R.; Hernandez, M.; Goenner, E. Modeling satisfaction and repurchase intentions of mobile smart wristbands: The role of social mindfulness and perceived value. Young Consum. 2018, 19, 237–250. [Google Scholar] [CrossRef]
  52. Khan, S.A.; Liang, Y.; Shahzad, S. An empirical study of perceived factors affecting customer satisfaction to re-purchase intention in online stores in China. J. Serv. Sci. Manag. 2015, 8, 291. [Google Scholar] [CrossRef] [Green Version]
  53. Lin, C.; Lekhawipat, W. Factors affecting online repurchase intention. Ind. Manag. Data Syst. 2014, 114, 597–611. [Google Scholar] [CrossRef]
  54. Lin, I. Effects of visual servicescape aesthetics comprehension and appreciation on consumer experience. J. Serv. Mark. 2016, 30, 692–712. [Google Scholar] [CrossRef]
  55. Chiu, W.; Cho, H. E-commerce brand: The effect of perceived brand leadership on consumers’ satisfaction and repurchase intention on e-commerce websites. Asia Pacific J. Mark. Logist. 2019, 33, 1339–1362. [Google Scholar] [CrossRef]
  56. Dholakia, R.R.; Zhao, M. Effects of online store attributes on customer satisfaction and repurchase intentions. Int. J. Retail Distrib. Manag. 2010, 38, 482–496. [Google Scholar] [CrossRef]
  57. Trivedi, S.; Yadav, M. Predicting online repurchase intentions with e-satisfaction as mediator: A study on Gen Y. VINE J. Inf. Knowl. Manag. Syst. 2018, 48, 427–447. [Google Scholar] [CrossRef]
  58. Kothari, C.R. Research Methodology: Methods & Techniques, 2nd ed.; New Age International Ltd.: New Delhi, India, 2004. [Google Scholar]
  59. Sirclo. 8 Produk Jualan Online Terlaris di Marketplace, apa Saja? 2021. Available online: https://www.sirclo.com/blog/6-kategori-produk-yang-laris-dijual-di-marketplace-apa-saja/ (accessed on 11 January 2022).
  60. Top Brand Index. Top Brand Index Fase 2 2019. 2019. Available online: https://www.topbrand-award.com/top-brand-index/?tbi_year=2019 (accessed on 1 March 2021).
  61. Hair, J.F.; Sarstedt, M.; Hopkins, L.; Kuppelwieser, V.G. Partial least squares structural equation modeling (PLS-SEM): An emerging tool in business research. Eur. Bus. Rev. 2014, 26, 106–121. [Google Scholar] [CrossRef]
  62. Vanette, D. Survey Straightlining: What Is It? How Can It Hurt You? And how to protect against it. 2018. Available online: https://www.qualtrics.com/blog/straightlining-what-is-it-how-can-it-hurt-you-and-how-to-protect-against-it/ (accessed on 1 June 2021).
  63. Rigdon, E.E.; Sarstedt, M.; Ringle, C.M. On comparing results from CB-SEM and PLS-SEM: Five perspectives and five recommendations. Mark. ZFP J. Res. Manag. 2017, 39, 4–16. [Google Scholar] [CrossRef]
  64. Shashikala, R.; Suresh, A.M. Impact of servicescape on customer perceived value in fine dining restaurants. Amity Bus. Rev. 2018, 19, 33–46. [Google Scholar]
  65. Fang, Y.; Chiu, C.; Wang, E. Understanding customers’ satisfaction and repurchase intentions: An integration of IS success model, trust, and justice. Internet Res. 2011, 21, 479–503. [Google Scholar] [CrossRef]
  66. Fornell, C.; Larcker, D.F. Evaluating structural equation models with unobservable variables and measurement error. J. Mark. Res. 1981, 18, 39–50. [Google Scholar] [CrossRef]
  67. Henseler, J.; Ringle, C.M.; Sarstedt, M. A new criterion for assessing discriminant validity in variance-based structural equation modeling. J. Acad. Mark. Sci. 2015, 43, 115–135. [Google Scholar] [CrossRef] [Green Version]
  68. Roemer, E.; Schuberth, F.; Henseler, J. HTMT2—An improved criterion for assessing discriminant validity in structural equation modeling. Indust. Manag. Data Sys. 2021, 121, 2637–2650. [Google Scholar] [CrossRef]
  69. Gefen, D.; Straub, D. Managing user trust in B2C e-services. e-Service 2003, 2, 7–24. [Google Scholar] [CrossRef]
  70. Kock, N. Common method bias in PLS-SEM: A full collinearity assessment approach. Int. J. e-Collab. 2015, 11, 1–10. [Google Scholar] [CrossRef] [Green Version]
  71. Hair, J.F.; Hult, G.T.M.; Ringle, C.; Sarstedt, M. A Primer on Partial Least Squares Structural Equation Modeling (PLS-SEM), 2nd ed.; Sage Publications: Thousand Oaks, CA, USA, 2016. [Google Scholar]
  72. Nisco, D.A.; Warnaby, G. Shopping in downtown: The effect of urban environment on service quality perception and behavioural intentions. Int. J. Retail Distrib. Manag. 2013, 41, 654–670. [Google Scholar] [CrossRef]
  73. Ferrera, O. The Customers’ Perception of Servicescape’s Influence on Their Behaviours, in the Food Retail Industry. Doctoral Dissertation, Dublin Business School, Dublin, Ireland, January 2015. [Google Scholar]
  74. Seock, Y.; Lee, Y.E. Understanding the Importance of Visual Merchandising on Store Image and Shopper Behaviours in Home Furnishings Retail Setting. Eur. J. Bus. Manag. 2013, 5, 174–187. [Google Scholar]
  75. Chea, P. Gender Differences in the Fashion Consumption and Store Characteristic in Swedish Stores. Master’s Thesis, Högskolan I Borås, Borås, Sweden, 2011. [Google Scholar]
  76. Marr, B. Sales People: Do We No Longer Need Them? 2014. Available online: https://www.linkedin.com/pulse/20140715063118-64875646-sales-people-do-we-no-longer-need-them/ (accessed on 8 June 2020).
  77. Hanks, L.; Line, N. The restaurant social servicescape: Establishing a nomological framework. Int. J. Hosp. Manag. 2018, 74, 13–21. [Google Scholar] [CrossRef]
  78. Dongre, S.; Dube, S.; Patil, P. Home décor shopping using augmented Reality. Int.J. Comput. Sci. Eng. 2016, 5, 15–22. [Google Scholar]
  79. Khakimdjanova, L.; Park, J. Online visual merchandising practice of apparel e-merchants. J. Retail. Consum. Serv. 2005, 12, 307–318. [Google Scholar] [CrossRef]
  80. Wu, W.Y.; Quyen, P.T.P.; Rivas, A.A.A. How e-servicescapes affect customer online shopping intention: The moderating effects of gender and online purchasing experience. Inf. Syst. e-Bus. Manag. 2016, 15, 689–715. [Google Scholar] [CrossRef]
  81. Ramayah, T.; Ignatius, J. Impact of perceived usefulness, perceived ease of use and perceived enjoyment on intention to shop online. ICFAI J. Syst. Manag. 2005, 3, 36–51. [Google Scholar]
  82. Sahoo, D.S.; Illai, S. Role of mobile banking servicescape on customer attitude and engagement: An empirical investigation in India. Int. J. Bank Mark. 2017, 35, 1115–1132. [Google Scholar] [CrossRef]
  83. Hopkins, C.D.; Grove, S.J.; Raymond, M.A.; LaForge, M.C. Designing the e-servicescape: Implications for online retailers. J. Internet Commer. 2009, 8, 23–43. [Google Scholar] [CrossRef]
  84. Roy, M.-C.; Dewit, O.; Aubert, B. The impact of interface usability on trust in Web retailers. Internet Res. 2001, 11, 388–398. [Google Scholar]
  85. Kathurwar, S. Why Is Navigation Important for Your Business Website. 2018. Available online: https://customerthink.com/why-is-navigation-important-for-your-business-website/ (accessed on 1 February 2020).
  86. Föllmer, M. The Sociology of Individuality and the History of Urban Society. 2019. Available online: https://www.cambridge.org/core/journals/urban-history/article/sociology-of-individuality-and-the-history-of-urban-society/379A2EBB1BFE4A8F3D71A62DB78E0770 (accessed on 2 January 2022).
  87. Yu, S. Does fear of victimization deter online shopping? J. Financ. Crime 2018, 25, 770–783. [Google Scholar] [CrossRef]
  88. Rahman, A. Toward a comprehensive conceptualization of digital divide and its impact on e-government system success. In E-Services Adoption: Processes by Firms in Developing Nations; Advances in Business Marketing and Purchasing; Emerald Group Publishing Limited: Bingley, UK, 2015; Volume 23A, pp. 291–488. [Google Scholar]
  89. Hartati, E.R. Keamanan dan Kenyamanan Transaksi E-Commerce Harus Jadi Perhatian Khusus. 2022. Available online: https://investor.id/business/311624/keamanan-dan-kenyamanan-transaksi-ecommerce-harus-jadi-perhatian-khusus (accessed on 21 February 2023).
  90. Koponen, J.P.; Rytsy, S. Social presence and e-commerce B2B chat functions. Eur. J. Mark. 2020, 54, 1205–1224. [Google Scholar] [CrossRef]
  91. Fan, J.; Zhou, W.; Yang, X.; Li, B.; Xiang, Y. Impact of social support and presence on swift guanxi and trust in social commerce. Ind. Manag. Data Syst. 2019, 119, 2033–2054. [Google Scholar] [CrossRef]
  92. Woo, A. Understanding the Research on Millennial Shopping Behaviors. 2018. Available online: https://www.forbes.com/sites/forbesagencycouncil/2018/06/04/understanding-the-research-on-millennial-shopping-behaviors/#323fafbb5f7a (accessed on 4 March 2020).
  93. Park, K.; Park, J.W. The effects of the servicescape of airport transfer amenities on the behavioral intentions of transfer passengers: A case study on Incheon International Airport. J. Air Transp. Manag. 2018, 72, 68–76. [Google Scholar] [CrossRef]
  94. UNCTAD. COVID-19 Has Changed Online Shopping Forever, Survey Shows. 2020. Available online: https://unctad.org/news/covid-19-has-changed-online-shopping-forever-survey-shows (accessed on 15 December 2021).
  95. Acquila-Natale, E.; Chaparro-Peláez, J. The long road to omni-channel retailing: An assessment of channel integration levels across fashion and apparel retailers. Eur. J. Int. Manag. 2020, 14, 999–1023. [Google Scholar] [CrossRef]
  96. Leung, W.K.; Ho, G.; Leung, R. Adaptation of the e-servicescape model to the online exhibition industry. Consum. Behav. Tourism Hosp 2023. ahead-of-print. [Google Scholar] [CrossRef]
  97. Patten, E.; Ozuem, W.; Howell, K. Service quality in multichannel fashion retailing: An exploratory study. Inf. Technol. People 2020, 33, 1327–1356. [Google Scholar] [CrossRef]
  98. Sombultawee, K.; Tansakul, T. The customer experience in Thailand’s multichannel retail environments. Asia-Pac. J. Bus. Admin. 2023, 15, 117–138. [Google Scholar] [CrossRef]
  99. PWC. Rethinking Retail: The Role of the Physical Store. 2018. Available online: https://www.pwc.be/en/documents/20180627-rethinking-retail.pdf (accessed on 1 July 2020).
  100. Cicenaite, E.; Maciejewska, M. The Role of the Perceived Servicescape in a Supermarket: The Case of ICA MAXI Jönköping, Sweden. Master’s Thesis, Jönköping University, Jönköping, Sweden, 2012. [Google Scholar]
  101. Lam, S.Y. The effects of store environment on shopping behaviors: A critical review. Adv. Consum. Res. 2001, 28, 190–197. [Google Scholar]
  102. Hussain, R.; Ali, M. Effect of store atmosphere on consumer purchase intention. Int. J. Mark. Stud. 2015, 7, 35–43. [Google Scholar]
  103. Sharmelly, R.; Klarin, A. Customer value creation for the emerging market middle class: Perspectives from case studies in India. J. Risk Financ. Manag. 2021, 14, 455. [Google Scholar] [CrossRef]
  104. Polacco, A.; Backes, K. The Amazon Go Concept: Implications, Applications, and Sustainability. J. Bus. Manag. 2018, 24, 80–93. [Google Scholar]
  105. Lindqvist, U. The cultural archive of the IKEA store. Space Cult. 2009, 12, 43–62. [Google Scholar] [CrossRef] [Green Version]
  106. Mosquera, A.; Olarte-Pascual, C.; Juaneda Ayensa, E.; Sierra Murillo, Y. The role of technology in an omnichannel physical store: Assessing the moderating effect of gender. Spanish J. Mark. ESIC 2018, 22, 63–82. [Google Scholar] [CrossRef] [Green Version]
  107. McIlroy, S.; Ali, N.; Hassan, A.E. Fresh apps: An empirical study of frequently-updated mobile apps in the Google play store. Empir. Softw. Eng. 2016, 21, 1346–1370. [Google Scholar] [CrossRef]
  108. Trivedi, J.P.; Trivedi, H. Investigating the factors that make a fashion app successful: The moderating role of personalization. J. Internet Commer. 2018, 17, 170–187. [Google Scholar] [CrossRef]
  109. Lu, B.; Fan, W.; Zhou, M. Social presence, trust, and social commerce purchase intention: An empirical research. Comput. Hum. Behav. 2016, 56, 225–237. [Google Scholar] [CrossRef] [Green Version]
Figure 1. Research Theoretical Framework.
Jtaer 18 00027 g001
Table 1. Respondent demographics.
Demography CharacteristicCategoryTotal
N%
GenderMale11265%
Female5935%
Age<2063.5%
20–299153%
30–396035%
40–49138%
≥5010.5%
Marital statusUnmarried8349%
Married8851%
City of residenceBogor21%
Balikpapan4225%
Bandung42%
Banjarmasin2615%
Bekasi42%
Denpasar32%
Depok64%
Jakarta2917%
Makassar11%
Malang11%
Medan42%
Padang21%
Palembang42%
Pangkal Pinang11%
Pekanbaru11%
Pontianak116%
Samarinda159%
Semarang32%
Surabaya74%
Tangerang53%
OccupationCivil employee74%
Private employee11668%
Entrepreneur2313%
Students53%
Unemployed85%
Others127%
Income (per-month)Less than IDR 5M9556%
More than IDR 5M7644%
No. of respondents from retailersAce Hardware/Ruparupa8550%
Matahari2816%
Hypermart3319%
Indomaret2515%
Table 2. Convergent validity and reliability test result.
VariableItemLoadingAVEComposite ReliabilityCronbach’s Alpha
ACAC61.0001.0001.0001.000
LFFLFF10.9560.8930.9440.882
LFF20.934
SSASSA10.9800.9620.9810.960
SSA20.982
SFSF30.9590.9270.9620.922
SF40.967
PQFPQF11.0001.0001.0001.000
AAAA10.9640.9290.9630.923
AA20.963
LFLLFL10.9790.9240.9611.000
LFL20.944
FSFS30.9440.8850.9390.870
FS40.938
SPSP10.9380.8940.9620.941
SP20.957
SP40.942
PQLPQL11.0001.0001.0001.000
SASA41.0001.0001.0001.000
RIRI10.9330.8730.9540.927
RI20.955
RI30.914
Table 3. Discriminant Validity Test Results (Fornell-Larcker criterion).
AAACFSLFFLFLPQFPQLRISASFSPSSA
AA0.964
AC0.7151.000
FS0.6800.6930.941
LFF0.7240.7600.6450.945
LFL0.7910.7550.7170.7480.961
PQF0.7400.8680.7260.7780.7231.000
PQL0.7710.6710.7580.6830.8120.7191.000
RI0.7280.7550.6920.7350.7270.7550.7420.934
SA0.6800.7910.6820.6830.7480.7750.7190.8491.000
SF0.7140.7920.6750.7240.7440.7990.6780.7680.7260.963
SP0.6560.6210.7010.5920.7340.6530.7430.7010.6560.5940.946
SSA0.7430.7470.6670.7260.6500.8050.6830.7360.7070.7120.6910.981
Table 4. HTMT Discriminant Validity Test Result.
AAACFSLFFLFLPQFPQLRISASFSPSSA
AA
AC0.744
FS0.7570.743
LFF0.8080.8110.740
LFL0.8630.7950.8000.833
PQF0.7700.8680.7780.8280.761
PQL0.8030.6710.8130.7320.8430.719
RI0.7880.7840.7710.8160.7940.7850.772
SA0.7080.7910.7310.7310.7880.7750.7190.881
SF0.7740.8240.7530.8030.8140.8320.7050.8310.756
SP0.7040.6410.7750.6520.7780.6740.7630.7510.6750.638
SSA0.7890.7620.7290.7920.6870.8210.6970.7810.7210.7570.726
Table 5. HTMT2 Discriminant Validity Test Result (lower diagonal: HTMT2 value; upper diagonal: upper bound of the 90% confidence interval).
AAACFSLFFLFLPQFPQLRISASFSPSSA
AA1.0000.8230.8490.8890.9260.8400.8590.8480.7930.8550.7780.863
AC0.7441.0000.8300.8970.8550.9070.7410.8350.8570.8820.7040.832
FS0.7570.7431.0000.8620.8960.8490.8680.8410.8110.8340.8650.810
LFF0.8080.8110.7401.0000.8980.9000.8070.8780.8120.8860.7410.872
LFL0.8630.7950.8000.8331.0000.8230.8880.8400.8550.8780.8510.777
PQF0.7700.8680.7780.8280.7611.0000.7800.8400.8340.8830.7420.875
PQL0.8030.6710.8130.7320.8430.7191.0000.8280.7800.7870.8220.764
RI0.7880.7840.7710.8160.7940.7850.7721.0000.9260.8770.8080.838
SA0.7080.7910.7310.7310.7880.7750.7190.8811.0000.8260.7400.815
SF0.7740.8240.7530.8030.8140.8320.7050.8310.7561.0000.7090.844
SP0.7040.6410.7750.6520.7780.6740.7630.7510.6750.6381.0000.789
SSA0.7890.7620.7290.7920.6870.8210.6970.7810.7210.7570.7261.000
Table 6. Hypothesis Testing Result.
HypothesisPathPath Coef. (β)t-Statisticp-Value95% CISupported
H1AC → PQF0.4375.5040.000[0.274,0.588]Yes
H2LFF → PQF0.1321.7520.040[0.013,0.311]Yes
H3SSA → PQF0.2593.2130.000[0.078,0.393]Yes
H4SF → PQF0.1732.4580.007[0.047,0.326]Yes
H5AA → PQL0.2343.0040.001[0.070,0.374]Yes
H6LFL → PQL0.3153.5130.000[0.147,0.502]Yes
H7FS → PQL0.2422.9920.001[0.095,0.412]Yes
H8SP → PQL0.1892.5240.006[0.034,0.328]Yes
H9PQF → SA0.5346.5230.000[0.362,0.685]Yes
H10PQL → SA0.3354.1580.000[0.184,0.502]Yes
H11SA → RI0.84930.3280.000[0.795,0.905]Yes
Table 7. Inner Model Evaluation Result.
R SquareR Square Adjusted
Perceived quality of offline servicescape0.8290.825
Perceived quality of online servicescape0.7590.754
Satisfaction0.6540.650
Repurchase Intention0.7210.720
Disclaimer/Publisher’s Note: The statements, opinions and data contained in all publications are solely those of the individual author(s) and contributor(s) and not of MDPI and/or the editor(s). MDPI and/or the editor(s) disclaim responsibility for any injury to people or property resulting from any ideas, methods, instructions or products referred to in the content.

