Article

The Voice from Users of Running Applications: An Analysis of Online Reviews Using Leximancer

1
Exercise Rehabilitation Convergence Institute, Gachon University, Incheon 21936, Republic of Korea
2
Lee Shau Kee School of Business and Administration, Hong Kong Metropolitan University, Hong Kong, China
3
College of Education and Human Development, Texas A&M University—Corpus Christi, Corpus Christi, TX 78412, USA
*
Author to whom correspondence should be addressed.
J. Theor. Appl. Electron. Commer. Res. 2023, 18(1), 173-186; https://doi.org/10.3390/jtaer18010010
Submission received: 27 September 2022 / Revised: 16 January 2023 / Accepted: 16 January 2023 / Published: 18 January 2023
(This article belongs to the Collection The Connected Consumer)

Abstract

:
This study aimed to examine users’ experiences of using running applications. A total of 20,243 online reviews posted by running-application users were collected from the Google Play Store. The data were analyzed using Leximancer to conduct the qualitative content analysis. The software identified six themes of running-app users’ experiences: “app”, “use”, “track”, “free”, “ads”, and “support”. Moreover, the results showed that users were generally positive toward the usefulness of running applications’ functions. The findings of this study help designers better understand running-application users’ experience and improve running applications’ features in order to optimize users’ exercise experience.

1. Introduction

1.1. Research Background

Recently, smartphones have become a necessity for many consumers as they have been used in all areas of their daily lives, such as media, entertainment, education, and exercise [1,2]. With the rapid development of smartphone-related technologies, many activities have become possible. For example, consumers use global positioning system (GPS) functions to navigate, play games using augmented-reality technology, measure sleep quality through sensors, and so forth. Moreover, the shutdown caused by COVID-19 stimulated the demand for different mobile applications [3,4]. As the mobile-application ecosystem has developed over the past decade, the offline-oriented industrial structure has been reorganized into mobile applications to collect information and improve productivity. Global Market Insights [5] expects the global digital-healthcare market to reach USD 86.4 billion in 2018 and grow by 29.6% annually, forming a market of more than USD 504.4 billion by 2025. In particular, mobile healthcare (mHealth), a healthcare market using mobile devices, is expected to grow at an annual growth rate of 38.8% from 2019 to 2025, surpassing the overall digital-healthcare-market growth rate. The mobile-application market is expected to generate USD 935 billion in revenue, including payments and paid downloads, in 2023, while the global mHealth market size is estimated to reach USD 310 billion by 2027 [6]. Mobile-healthcare applications support disease prevention, treatment, and health management by converging IT technologies with existing healthcare-management technologies. For instance, Apple Health, Samsung Health, and Google Fit are healthcare applications that track and manage sleep patterns, exercise records, and calorie intake. Mobile applications for health purposes provide telemedicine services based on patient monitoring and disease detection, and even digital treatments offer advanced medical services, including treatment [7,8].
As such, global sports brands also launch their exercise applications, providing various benefits by combining them with multiple events when using exercise applications. In particular, running is a sports event covered by many applications, with Adidas’ Runtastic having more than 50 million downloads, Nike’s Nike Run Club having more than 10 million downloads, and Asics’ Runkeeper having more than 10 million downloads. As such, these running applications are relatively popular and widely used by consumers. However, in general, the vast majority of applications have issues regarding continued usage and retention rate. About 25% of the applications are used only once after being downloaded [9,10]. Nearly half of customers report that they would delete an application if they found a single bug [11]. As such, easy installation and simple accessibility through application markets, which are strengths of applications, reduce reuse through easy deletion and removal. Although previous studies have examined the usability of fitness applications, application developers are working on various ways to induce continued usage [12,13,14].
However, despite the importance of understanding app-user experiences to enhance the retention rate, most studies have focused on what influences users’ adoption of mobile applications using some well-known, researcher-driven theoretical frameworks, such as the technology acceptance model (Davis [15], TAM) and unified theory of acceptance and use of technology (Venkatesh et al. [16], UTAUT). While these theoretical frameworks provide a well-versed perspective on mobile-application users’ behaviors, especially regarding the adoption behavior of mobile applications, this researcher-driven approach may unintentionally overvalue the salience of some attributes or determinants [17]. At the same time, it may neglect potentially meaningful predictors [18,19]. Given that application users have changed their role from passive consumers to active ‘prosumers’ and creators, it became imperative to identify what are more relevant attributes and elements for application users using user-generated content (UGC) from a market- or data-driven approach [18]. In doing so, the current study may fill a gap in the literature on what influences running-app users’ experiences and continued use.

1.2. Relevant Literature and Research Gap

The development of Internet technology in the Web 2.0 era has made it easy for individuals to communicate in both directions with large amounts of information. In other words, the role of Internet users has changed not only to consume but to produce and spread information [20]. Liu [21] stated that user-generated content (UGC) is also a creative work published on websites where anyone can access information for public purposes, even more potent than marketer-created content (MGC) as part of big data. UGC unbiasedly provides real consumer input and insights from an insider’s perspective [22,23]. UGC allows customers to embrace specific products better than MGC. Of the various UGC, online reviews have been widely utilized to understand various consumer attitudes and behavior, such as preferences, satisfaction, and recommendation in diverse settings.
One of the most significant disadvantages users perceive in purchasing mobile applications is that they have no choice but to use limited information in acquiring goods [24,25]. As a result, online consumers have begun to refer to other people’s opinions and experiences, such as online user reviews, which are most easily accessible on distribution channels. Research on online user reviews using the text-mining approach has continuously attempted to understand users’ experience and intention to use [26,27]. With more than 20 years of online distribution channels and explosive growth, online user reviews are also increasing. The importance of content analysis and opinion mining on consumers is growing. In particular, in the mobile-application field, users choose applications to download based on reviews or evaluations from other users rather than using all applications when dozens of mobile applications are pouring in a day. In this increasingly advanced application industry, consumer reviews are emphasized.
As previously mentioned, text mining has been a useful tool for information extraction and classification in various fields when analyzing consumer reviewers. For example, Ban and Kim [28] used online reviews from Skytrax, a U.K.-based consultancy for airline reviews and ranking. They found a set of six evaluation factors, including seat comfort, staff, food and beverage, entertainment, ground service, and value for money, to be the most critical attributes that influence customer satisfaction and recommendation in the context of the top 10 airlines (i.e., full-service airlines) [28]. In the context of Chinese online teaching platforms, Chen et al. [29] evaluated five platforms using crawled data of online users and found the seven most influencing factors that affect user experiences, such as platform privacy, platform design environment, platform functionality, and network technology environment. Similarly, using a text-mining approach, Shankar et al. [30] found that privacy and security, navigation, customer support, convenience, and efficiency are the critical success factors of a sustainable mobile-banking application. In a wearable-device context, Zhou and Zhou [31] conducted a sentiment analysis of elderly wearable-device users by analyzing review comments from Taobao, a Chinese online-shopping platform, and found such negative keywords as “battery”, “voice (sound volume, noise, and voice recognition)” and “function”, emerged to be critical factors to which wearable-device manufacturers need to pay attention.
Overall, the above-mentioned studies [28,30,31] illustrated the utility of text mining or sentiment analysis using online user comments, especially in an era of e-commerce and social media, because text mining, as a data-driven approach, allows us to explore unbiased and deeper consumer responses [19,32], consequently complementing traditional researcher-driven approaches. However, despite the running applications’ potential contributions to building a better brand community of sports brands and enhancing users’ health [33], consumer experience toward mobile applications, especially running applications, has been under-explored. In this study, we want to extract key elements of users’ interest in running applications currently in circulation by analyzing reviews from real users who perform the exercise using running applications.

1.3. Research Goals and Questions

Therefore, this study aims to identify users’ experience with running applications and enhance user satisfaction as users observe and study real users through text mining and network analysis of application-review data from the Google Play Store. The findings of the current study would be helpful to mobile-application developers and sports brands in meeting consumer expectations, developing marketing strategies, and enhancing user experience. This study is guided by the following research questions.
Research Questions:
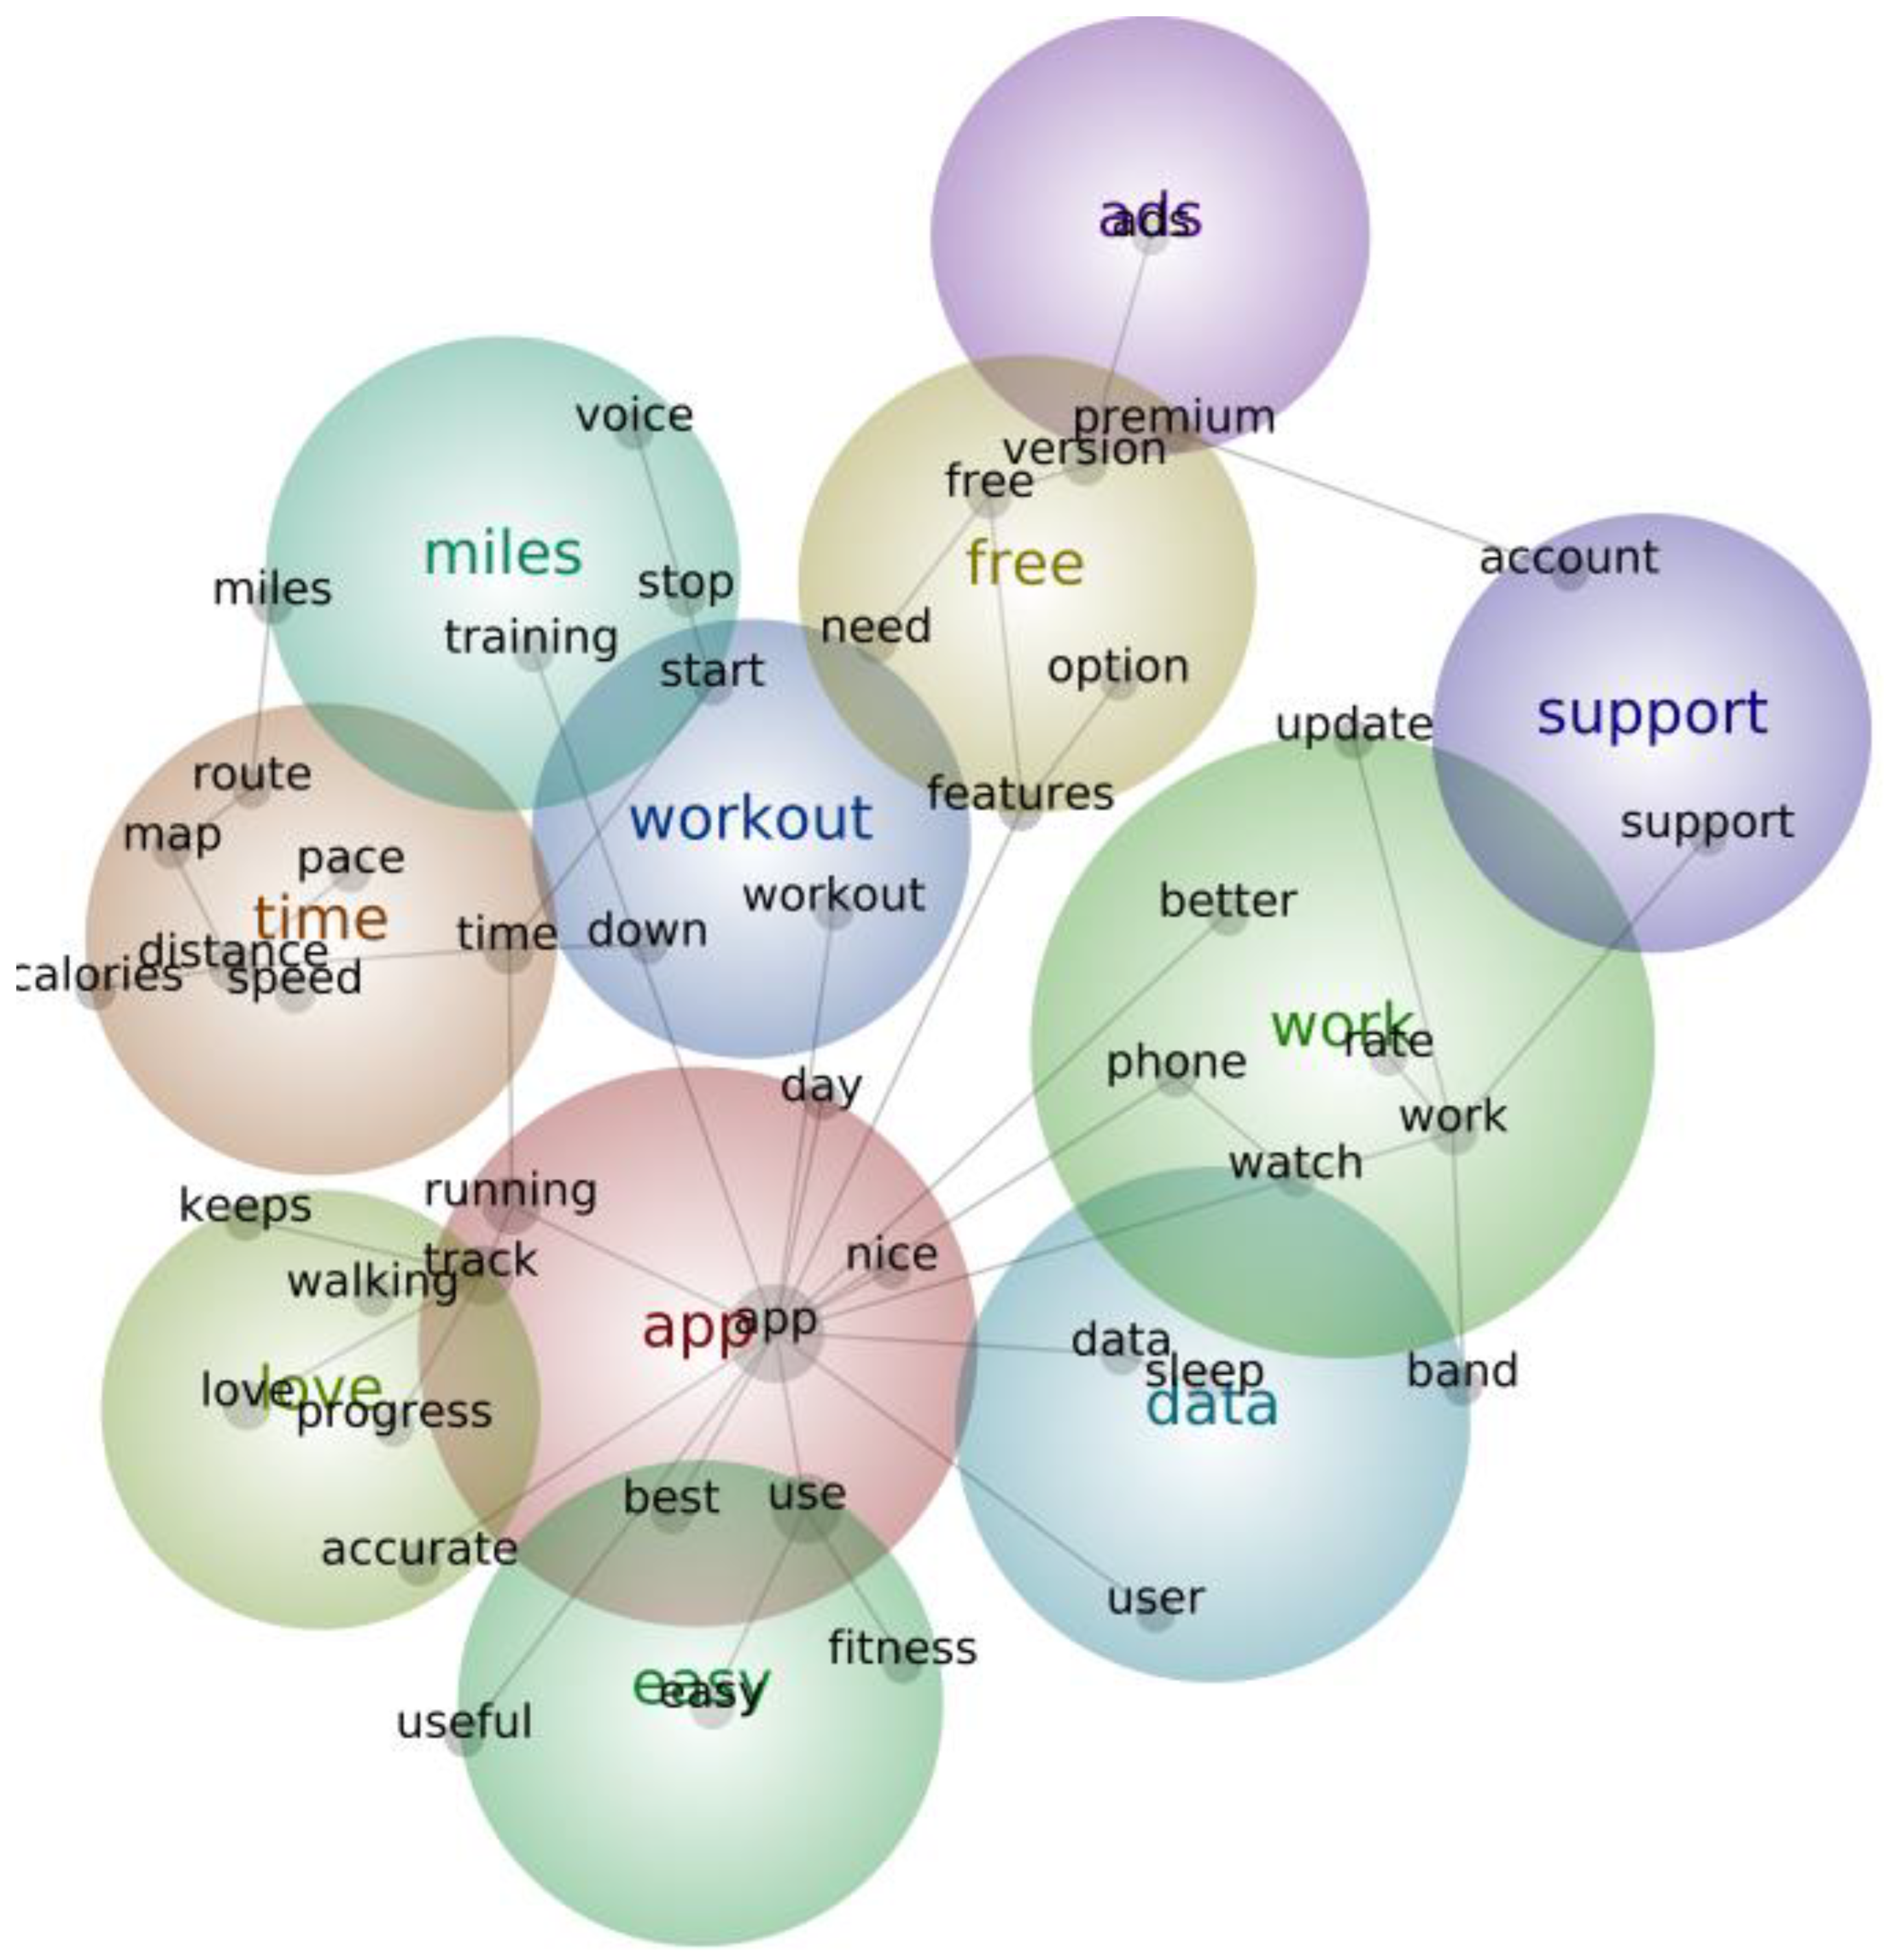
  • Which key concepts/topics (themes) are evident in UGC about running applications?
  • What thematic patterns are found in UGC about running applications?
  • Do the key concepts/topics (themes) differ by sentiment valence (i.e., positive or negative)?

2. Methodology

2.1. Data Source and Collection

In this study, users’ reviews were collected from the Google Play Store to investigate their opinions on using running applications. The Google Play Store was selected as the data source as it had much more applications, downloads, and updates than other application markets (e.g., Apple’s App Store, Samsung’s Galaxy Store, and Amazon’s App Store) [6,34]. Moreover, the large volume of reviews can generate reliable results and in-depth opinions from users’ perspectives. Running applications with at least 1 million downloads were selected for this study, including Nike Run Club, Runtastic, Zeopoxa, Mifit, Runkeeper, and Sports Tracker. Review data were collected by the software program BeautifulSoup of Python. As a result, a total of 20,243 reviews were collected for further analysis using Leximancer (version 4.0).

2.2. Data Analysis through Leximancer

Recently, various studies have utilized different text-mining programs to explore consumers’ experiences and opinions [35,36,37,38,39]. This study conducted data analysis by Leximancer (version 4.0), a computer-assisted qualitative data analysis (CAQDA) software. Leximancer was chosen for this study for three reasons. First, Leximancer can efficiently analyze large volumes and immediately identify concepts and themes of textual data like other CAQDA software (e.g., NVivo). Second, Leximancer does not have pre-existing assumptions about the meaning of the works, reducing the probability of researchers’ subjective bias. Third, Leximancer operates with minimal manual intervention from researchers, offering an alternative way of looking at data and reducing the impact of manual coding [40]. Therefore, Leximancer has been regarded as a useful tool for analyzing consumers’ experiences in different disciplines [20,41,42] as it addresses some common issues of qualitative research, such as subjective coding, questionable inter-coder reliability, and disputable interpretations [20].
Moreover, a large number of reviews (N = 20,243) were deemed appropriate for Leximancer analysis for this study [43]. Leximancer combines qualitative and quantitative techniques to comprehensively explore natural-language textual data, such as reviews and interview transcripts [44]. Specifically, Leximancer processes natural language based on Bayesian theory [44,45]. Leximancer provides statistical analysis and visualization of electronically written documents through text analysis, such as semantic and rational information [46]. As shown in Figure 1, there are three levels of the extraction process: words, concepts, and themes. Leximancer starts by semantically extracting the text (i.e., words) to create a ranked list of terms (i.e., concepts). As a next step, Leximancer groups essential concepts at the higher levels (themes) based on the frequency occurrence of the concepts [44,46,47,48]. Leximancer provides a hot map that visually shows the main concepts contained within the text data and information about how frequently it co-occurred. The relative position and size distance of concepts depend on the strength of the semantics and the connection between concepts. The essential themes are shown as bright circles, and the frequency of the concepts is implied from the circle sizes [47].
In addition, sentiment analysis was further conducted to better understand running-application users’ positive and negative sentiments. Sentiment analysis has been useful in exploring consumers’ opinions and evaluations of product features [49,50]. The function of Sentiment Lens in Leximancer was performed to generate insight into concepts contributing to positive and negative emotions in users’ online reviews of running applications. Sentiment Lens can identify relevant sentiment terms consistently while processing and help increase the accuracy of sentiment analysis [51]. Moreover, Leximancer calculates the prominence score using Bayesian statistics. The prominence score indicates the probability of a concept being mentioned in a favorable and unfavorable context. In particular, a prominence score higher than 1.0 means that the co-occurrence occurs more frequently than by chance, and a prominence score higher than 3.0 indicates that the concepts are unique and essential characteristics [51,52].

3. Results and Findings

The Leximancer program initially extracted forty-eight concepts from 20,243 reviews of Google Play Store. A stemming algorithm was further employed to identify the headword for initial thesaurus items, and then the concept list was generated. However, only some concepts that appear in the results are meaningful for further analysis [48]. Leximancer produces “The co-occurrence frequency” and “meaning of concepts” through text analysis, and the significant results derived from the analysis were analyzed [53]. Consequently, unnecessary concepts for solving research problems were eliminated under the researcher’s judgment [44]. This study did not consider simple brand names (e.g., Samsung, Apple) as meaningful concepts in analyzing users’ experience of running applications. In addition, unnecessary concepts of application usage period were excluded from the analysis (e.g., during, weeks), removed descriptive words related to other wearable devices (e.g., band, watch). Finally, 48 concepts remained for further analysis (see Table 1).

3.1. Users’ Overall Experiences of Running Applications

The concept map created by Leximancer showed that the theme map consisted of 48 concepts (shown as small gray nodes) that were grouped into eleven dominant themes. Figure 2 indicates six major themes in the running-application experiences, (1) app, (2) use, (3) track, (4) free, (5) ads, (6) support. “App” was a dominant theme and was closely related to many factors such as positive experiences, usefulness, and main functions such as running and tracking. It is because users of the running application judge that the primary function of the perceived application is a track function, especially in sleep and exercise tracking. For example, one of the reviewers mentioned:
“I use this to track my running daily. It is accurate and reliable. I enjoy the interface, it is intuitive and easy to use. I also enjoy the challenges that it affords occasionally. I have never paid for the premium service though. I would definitely recommend that someone who is interested in running”
The user knowledge level influences the usage of running applications for exercise purposes [54]. According to Rapp and Cena [55], general users prefer a large amount of information, accuracy, and serendipity to ease of use or wearability. This is due to the lack of knowledge to use applications to achieve sports objectives. This tracking-function experience often leads to positive user experiences such as usefulness which was evident from another key concept revealed by the Leximancer analysis.
“this app is really useful for my daily tracking! I’m using a mi band 4 and I’m using this app to track my every exercise and it did pretty well! it also lets me customize my wallpaper for the mi band and it gave me a very wide variety of choices! Overall it’s an amazing app!”
This may be related to the desired level of application users to obtain information and the function of running the application. Many studies have reported that consumers use communication technology to obtain and search for information [56,57]. When the diet/fitness application provides information on the time, intensity, degree, and frequency of exercise, the function of the mobile application is perceived to be useful [32]. As reported in several studies, information quality is critical when potential customers evaluate the value and usefulness of review data and recommendation comments provided online [58,59]. As a result, many companies manage their product or service evaluations online. Still, in a rich information resource environment, consumers can easily obtain the necessary information about the products and services they want [60]. In this environment, consumers’ excessive exposure to unreliable, controversial, or inaccurate information can disrupt the acceptance of the information itself. Accordingly, one reviewer mentioned the following:
“This app really became my drive force since I come to know it, it shows all of my running informations, advises what am suppose to do right, what am doing wrong, there are a group of people out there who have the same objective as mine hence no boredom.”
In addition to the main functional aspects of the application, the functions provided free-of-charge in the running application appear to affect consumers’ acceptance of the application as “free” emerged as a critical theme in this study. Apple App Store and Google Play Store accommodate billing applications such as free, paid, and freemium applications. Freemium applications can be considered free applications with in-app purchases because it is provided as free-of-charge applications but require money for additional features. Most fitness applications currently available in the App Store are freemium applications, except those released by sports brands. Therefore, many factors must be considered in mounting payment elements in fitness applications. Rizaldi and Saraswati [61] argued that application users make payment decisions when they perceive eight factors: performance value, value for money, emotional value, social value, confirmation, app rating, free alternatives to paid applications, and habit. In particular, many sports brands provide free applications in the fitness-application area, so it is challenging to induce in-app payments.
Moreover, when consumers are highly satisfied with the functions of running applications, cannibalization occurs for the paid version. Therefore, the payment model of fitness applications should precisely adjust the balance between consumers’ needs and willingness to pay. For free, reviewers mentioned as follows:
“Have been using for 6 years without a problem. Includes a lot of features for free that other apps charhe for. Tried other trackers but I keep coming back to this one.”
“What is the benefits of premium members if everything gets free later was a premium member no benefit at all. All new additions become free later. Just wait a while. And you will get it free”
In order to maximize profitability, applications provide not only various functions for a fee but also offer in-app advertisements. Even though numerous advertisements are provided through applications, the application users tend to overlook in-app ads and perceive tiredness from frequent advertising exposure [62,63]. Therefore, the frequent appearance of ads in running applications still emerged as one of the superior experiences for users. For example, reviewers mentioned that:
“GPS is just OK. Was trying free version to decide if I wanted to purchase but too many ads and requests to sign in etc has put me off”
“Works alright for what it’s supposed to, thankfully they updated it so the ads that use to take up half the screen aren’t showing anymore (I uninstalled after that! And only redownload after I saw they removed them) there does need to be a option to control music playback like Spotify”
“good app that I’ve used for years, but the number of ads has slowly been creeping up full screen ads. Timeline ads. Stupid notifications! Definitely force close when your job finished”
The result found that application users demand localized and immediate support and fast support. Many applications are trying to increase usage for users around the world. The globalization of software is divided into internalization and localization stages. Internalization can be defined as developing and designing systems to support other languages and regions. Localization is defined as the process of converting internationally sized software to suit a particular country, region, or culture by adding region-specific functions [64]. Most localized software only applies translation or time, date, currency, weights, and measurements. Additionally, integrity, interface layout, content, and language accuracy must also satisfy the needs of local users [65]. This study showed that application providers should respond quickly to consumers with localized technical support.
“No Fahrenheit support. Sleep data collection and analysis not as good as Fitbit. Very good battery management. Some nice features in the app are removed in the latest app version.”
“I reported a bug almost 2 month ago. Since then nobody answered, I updated the app to the latest version, but the bug still remains. I am disappointed in the app support.”

3.2. Sentiment Analysis Results

The sentiment analysis results indicate that running-application users were overwhelmingly positive about many aspects of their experience (Table 2). It is noteworthy that the analysis based on the reviews of running-application users showed that accurate, easy, helpful, and friendly as positive keywords except for emotional adjectives.
On the other hand, negative words derived from the sentimental analysis included problem, annoying, bad, and wrong. For example, a reviewer made the following positive and negative comments.
“I am very fond of this app and is regularly using the same. Accurate measurement, good statistics and easy to use. However, ads are a bit irritating and in the starting it always gives a msg that GPS signal is lost.”
“It’s an excellent product though but there is a problem with the connectivity and accuracy level. I was told it doesn’t record while in a moving vehicle but that’s not true. Pls work on it.”

4. Discussion

Limited studies have explored users’ experiences of running applications by using a text-mining approach. Therefore, this study examined running-application users’ reviews on the Google Play Store by using the CAQDA software Leximancer. This research points to the applicability of visual and textual analytic methods, which can be tied to decision making in the context of online customer reviews. As the quantity of textual data in online reviews is increasing, online review analysis and its outcomes can provide insights to find new ways of managing and analyzing experience-based text data in running-application research. Quantitative and qualitative aspects of online reviews of running applications also contribute to helping running-application companies understand users’ preferences, strengths/weaknesses, newly required functions, and dimensions of fitness applications to increase users’ satisfaction. This study provides evidence on what factors users who use fitness applications for running activities are actually demanding.
The Leximancer analysis found that their experiences were built on three significant themes, “app”, “use”, “track”, “free”, “ads”, and “support”, which are mainly relevant to the core and peripheral elements of running applications [66,67,68,69]. Particularly, the themes “app” and “use” were linked with users’ perceptions of usefulness and easiness, consistent with previous studies [70,71,72,73,74], suggesting that usefulness and easiness are commonly used evaluation criteria for a fitness application reviewed by users. Moreover, intuitive navigation and a smart set of features will need to be provided to enhance the application user’s ease of use. For example, a user may be able to satisfy various user needs by customizing their interface. Support for application users also allows users to recognize usefulness, as suggested in Leximancer’s concept map. For example, if the offline mode also allows users to access application features, users will be able to perceive usefulness. In addition, accurate tracking was identified as a critical feature of running applications, which is in accordance with previous studies [75,76].
Moreover, in addition to the utilitarian factors of running applications (i.e., “app”, “use”, and “track”), the monetary aspect (i.e., “free”) was found to be essential. It indicates that users are sensitive to the monetary aspect of running applications. Previous studies emphasized that users’ perceptions of price value are critical antecedents of their experience and behaviors when using fitness and health applications [77,78,79]. Furthermore, users perceive the profitability of running applications (i.e., “ads”) when using running apps. In general, there are four types of advertisements embedded in an app: intermediate advertisements before and after application activities, click-to-expand ads, out-of-app ads, and on-screen ads displayed along with the screen’s contents [80]. Lamond [81] reported that 50% of application users deleted their application after their mobile-advertising experience, which led to a large decrease in users. Inappropriate ad integration could also increase the difficulty of ensuring app reliability [82,83,84,85]. Therefore, when providing ads to users in running applications, determining the type of ads, location of ads, and frequency of ads is a crucial factor in determining the user’s intention to continue using them. In addition, perceived support from running applications is critical for users. It indicates the importance of “after-installation” support for users. When users face difficulties in running applications, the availability of different types of support is important for users’ experiences.
Finally, the sentiment analysis uncovered positive and negative experiences of running applications. It was found that users’ positive and negative experiences were mainly from the functions of running applications. For example, many factors relevant to application quality, including accuracy, ease of use, and helpfulness, are critical to contributing to users’ positive and negative experiences [85,86]. In addition, advertisements in the running applications were found to be related to users’ negative experience, indicating that users are annoyed by frequent advertisements when using running applications.

4.1. Theoretical Implications

The findings of the current study provide theoretical contributions to the extant literature by using a data-driven approach to exploring the voice of running-application users. In previous studies on sports or running applications, research primarily used quantitative questionnaires to explore consumers’ experience of using running applications [33,67]. This study provides an alternative approach to understanding users’ experiences of running applications.
Moreover, this study identifies different aspects of users’ experiences. In addition to users’ utilitarian perceptions (e.g., perceived ease of use and perceived usefulness) which were mainly identified by previous studies, this study discovers monetary-element (i.e., free functions) perceptions that are not relevant to functions (i.e., advertisement and support). It suggests the importance of these elements to users’ experience of using running applications. The findings of this study offer a more comprehensive view of users’ experiences and perceptions of running applications.

4.2. Practical Implications

The findings of this study also provide various practical implications. For marketers and developers, the theme and text characteristics revealed in this study will help running-application developers understand users’ experiences, making it more convenient and useful for users to use the application. This will help developers add the functions users require to running applications in the future or install paid functions and advertisements to improve profitability. Various consumer community channels have recently emerged, raising consumer voices in different application stores (e.g., the Apple App Store and Google Play Store). Therefore, developers should pay attention to positive/negative evaluations of consumers’ running applications. The efforts to understand users’ experiences can help developers and marketers efficiently develop useful features and promotion strategies. In addition, this study identified some non-utilitarian elements (e.g., support). Therefore, developers and marketers should pay more attention to various means of support even after the installation of running applications.

4.3. Limitations and Future Research Direction

Before generalizing this study, the following points should be noted. In this study, the accuracy and reliability of the review cannot be accurately measured because the fitness-app users were not asked about their user experience. Corporate marketing reviews can manipulate positive online reviews, or competitors can fabricate negative reviews. Therefore, in future research, an analysis of consumer requirements reflecting the reliability of users should be conducted. It is important to point out that this study examined reviews in only one application environment. In this study, since data were collected only in the Google App Store, the results of this study cannot be extended and applied in other application execution environments. Future research will derive more diverse variables if application-user reviews are collected in Android and IOS environments. It will also be possible to collect data from various datasets, such as blogs, application users’ communities, and websites.
Moreover, it should be noted that demographic information is not available in the raw data. Therefore, the demographic differences (e.g., gender and age) in reviews were not explored in this study. Future studies may take demographic information into consideration when collecting UGC data and explore potential differences between demographic variables. Furthermore, the primary purpose of this study was to identify key concepts and thematic patterns in UGC about running applications. As such, this study did not investigate the differences in user experiences among running applications.
Finally, there is a limitation in this study in that only the user’s review data were used as analysis data. This can collect user experiences, but there is a gap between the actual development environment and technology. Accordingly, other qualitative research methods, such as Delphi, focus group interviews, and open questionnaires, could fill the gap with users, application developers, and marketing managers.

5. Conclusions

To explore the users’ authentic voice of using running applications, this study collected online reviews created by users (i.e., UGC) and further analyzed the data using the CAQDA software Leximancer. This study identifies various themes which are important for users’ experiences. In particular, utilitarian factors (i.e., functions, ease of use, and usefulness) are shown to be critical in contributing to users’ overall positive and negative experiences. Moreover, some non-utilitarian factors are found to be significant to users’ experience. In particular, monetary aspects and support are essential elements for users’ positive experiences, while frequent advertisements in running applications lead to negative emotions and undermine users’ experiences. This study provides an alternative approach to exploring users’ experience of running applications and offers practical implications for application designers.

Author Contributions

Conceptualization, H.B. and W.C.; methodology, H.B.; validation, W.C. and D.W.; formal analysis, H.B.; investigation, H.B.; data curation, H.B.; writing—original draft preparation, W.C. and D.W.; writing—review and editing, W.C. and D.W.; visualization, H.B.; supervision, W.C. and D.W.; project administration, H.B.; funding acquisition, H.B. All authors have read and agreed to the published version of the manuscript.

Funding

This work was supported by the National Research Foundation of Korea (NRF-2021S1A5C2A02089245).

Institutional Review Board Statement

Not applicable.

Informed Consent Statement

Not applicable.

Data Availability Statement

Not applicable.

Conflicts of Interest

The authors declare no conflict of interest.

References

  1. Persaud, A.; Azhar, I. Innovative mobile marketing via smartphones: Are consumers ready? Mark. Intell. Plan. 2012, 22, 418–443. [Google Scholar] [CrossRef]
  2. Vintilă, M.; Tudorel, O.I.; Goian, C.; Bărbat, C. Determining the structure of smartphone addiction scale: A bifactor model analysis. Curr. Psychol. 2021, 40, 1107–1114. [Google Scholar] [CrossRef]
  3. Martin, M.R.; Melnyk, J.; Zimmerman, R. Fitness Apps: Motivating Students to Move. J. Phys. Educ. Recreat. Danc. 2015, 86, 50–54. [Google Scholar] [CrossRef]
  4. Smith, A.C.; Skinner, J. Sport management and COVID-19: Trends and legacies. Eur. Sport Manag. Q. 2022, 22, 1–10. [Google Scholar] [CrossRef]
  5. Global Market Insights Inc. Worldwide Digital Health Market to Hit $504.4 Billion by 2025. Available online: https://www.prnewswire.com/news-releases/worldwide-digital-health-market-to-hit-504-4-billion-by-2025-global-market-insights-inc-300807027.html (accessed on 5 November 2022).
  6. Statista. Revenue of Mobile Apps Worldwide 2017–2025, by Segment. Available online: https://www.statista.com/statistics/269025/worldwide-mobile-app-revenue-forecast/ (accessed on 12 December 2022).
  7. Chiuchisan, I.; Costin, H.N.; Geman, O. Adopting the Internet of Things technologies in health care systems. In Proceedings of the 2014 International Conference and Exposition on Electrical and Power Engineering (EPE), Iasi, Romania, 16–18 October 2014; pp. 532–535. [Google Scholar]
  8. Kim, S.; Kim, S. User preference for an IoT healthcare application for lifestyle disease management. Telecommun. Policy 2018, 42, 304–314. [Google Scholar] [CrossRef]
  9. Grennan, T. App user retention: Less than 25% of new app users return the day after first use. 2016. Available online: https://www.braze.com/resources/articles/app-customer-retention-spring-2016-report (accessed on 12 November 2022).
  10. Kamboj, S.; Rana, S.; Drave, V.A. Factors driving consumer engagement and intentions with gamification of mobile apps. J. Electron. Commer. Organ. (JECO) 2020, 18, 17–35. [Google Scholar] [CrossRef]
  11. SmartBear. 2014 State of Mobile: Sofware Industry Survey Final Report. Available online: https://www2.smartbear.com/rs/smartbear/images/SmartBear-2014-Software-Industry-Survey-Testing.pdf (accessed on 23 November 2022).
  12. Angosto, S.; García-Fernández, J.; Valantine, I.; Grimaldi-Puyana, M. The Intention to Use Fitness and Physical Activity Apps: A Systematic Review. Sustainability 2020, 12, 6641. [Google Scholar] [CrossRef]
  13. Li, J.; Liu, X.; Ma, L.; Zhang, W. Users’ intention to continue using social fitness-tracking apps: Expectation confirmation theory and social comparison theory perspective. Inf. Health Soc. Care 2019, 44, 298–312. [Google Scholar] [CrossRef]
  14. Oyibo, K.; Vassileva, J. Persuasive Features that Drive the Adoption of a Fitness Application and the Moderating Effect of Age and Gender. Multimodal Technol. Interact. 2020, 4, 17. [Google Scholar] [CrossRef]
  15. Davis, F.D. Perceived usefulness, perceived ease of use, and user acceptance of information technology. MIS Quart. 1989, 13, 319–340. [Google Scholar] [CrossRef]
  16. Venkatesh, V.; Thong, J.Y.; Xu, X. Consumer acceptance and use of information technology: Extending the unified theory of acceptance and use of technology. MIS Quart. 2012, 36, 157–178. [Google Scholar] [CrossRef] [Green Version]
  17. Anastasiei, B.; Dospinescu, N.; Dospinescu, O. The Impact of Social Media Peer Communication on Customer Behaviour—Evidence from Romania; Wydawnictwo Uniwersytetu Ekonomicznego We Wrocławiu: Wrocław, Poland, 2022. [Google Scholar]
  18. Tkaczynski, A.; Rundle-Thiele, S.R.; Cretchley, J. A vacationer-driven approach to understand destination image: A Leximancer study. J. Vacat. Mark. 2015, 21, 151–162. [Google Scholar] [CrossRef] [Green Version]
  19. McCaig, D.; Bhatia, S.; Elliott, M.T.; Walasek, L.; Meyer, C. Text-mining as a methodology to assess eating disorder-relevant factors: Comparing mentions of fitness tracking technology across online communities. Int. J. Eat. Disord. 2018, 51, 647–655. [Google Scholar] [CrossRef] [PubMed] [Green Version]
  20. Chiu, W.; Bae, J.-S.; Won, D. The experience of watching baseball games in Korea: An analysis of user-generated content on social media using Leximancer. J. Sport Tour. 2017, 21, 33–47. [Google Scholar] [CrossRef] [Green Version]
  21. Liu, X. Analyzing the impact of user-generated content on B2B Firms’ stock performance: Big data analysis with machine learning methods. Ind. Mark. Manag. 2020, 86, 30–39. [Google Scholar] [CrossRef]
  22. Barreda, A.; Bilgihan, A. An analysis of user-generated content for hotel experiences. J. Hosp. Tour. Technol. 2013, 4, 263–280. [Google Scholar] [CrossRef]
  23. Ukpabi, D.C.; Karjaluoto, H. What drives travelers’ adoption of user-generated content? A literature review. Tour. Manag. Perspect. 2018, 28, 251–273. [Google Scholar] [CrossRef]
  24. Kim, J.-H.; Byeon, H.-S.; Lee, S.-H. Enhancement of User Understanding and Service Value Using Online Reviews. J. Inf. Syst. 2011, 20, 21–36. [Google Scholar] [CrossRef] [Green Version]
  25. Ho, M.H.-W.; Chung, H.F. Customer engagement, customer equity and repurchase intention in mobile apps. J. Bus. Res. 2020, 121, 13–21. [Google Scholar] [CrossRef]
  26. Dave, K.; Lawrence, S.; Pennock, D.M. Mining the peanut gallery: Opinion extraction and semantic classification of product reviews. In Proceedings of the 12th International Conference on World Wide Web, Budapest, Hungary, 20–24 May 2003; pp. 519–528. [Google Scholar]
  27. Zarindast, A.; Sharma, A.; Wood, J. Application of text mining in smart lighting literature-an analysis of existing literature and a research agenda. Int. J. Inf. Manag. Data Insights 2021, 1, 100032. [Google Scholar] [CrossRef]
  28. Ban, H.-J.; Kim, H.-S. Understanding customer experience and satisfaction through airline passengers’ online review. Sustainability 2019, 11, 4066. [Google Scholar] [CrossRef] [Green Version]
  29. Chen, T.; Peng, L.; Jing, B.; Wu, C.; Yang, J.; Cong, G. The impact of the COVID-19 pandemic on user experience with online education platforms in China. Sustainability 2020, 12, 7329. [Google Scholar] [CrossRef]
  30. Shankar, A.; Tiwari, A.K.; Gupta, M. Sustainable mobile banking application: A text mining approach to explore critical success factors. J. Enterp. Inf. Manag. 2021, 35, 414–428. [Google Scholar] [CrossRef]
  31. Zhou, J.; Zhou, M. Sentiment Analysis of Elderly Wearable Device Users Based on Text Mining. In Advances in Usability, User Experience, Wearable and Assistive Technology; AHFE 2021; Ahram, T.Z., Falcão, C.S., Eds.; Lecture Notes in Networks and Systems; Springer: Berlin, Germany, 2021; Volume 275, pp. 360–365. [Google Scholar] [CrossRef]
  32. Shankar, A.; Behl, A. How to enhance consumer experience over mobile wallet: A data-driven approach. J. Strateg. Mark. 2021, 1–18. [Google Scholar] [CrossRef]
  33. Won, D.; Chiu, W.; Byun, H. Factors influencing consumer use of a sport-branded app: The technology acceptance model integrating app quality and perceived enjoyment. Asia Pac. J. Mark. Logist. 2022; ahead-of-print. [Google Scholar]
  34. Chan, S. Global App Revenue Grew 32% Year-over-Year in Q3 2020 to More Than $29 Billion. Available online: https://sensortower.com/blog/app-revenue-and-downloads-q3-2020 (accessed on 5 November 2022).
  35. Pejić Bach, M.; Krstić, Ž.; Seljan, S.; Turulja, L. Text mining for big data analysis in financial sector: A literature review. Sustainability 2019, 11, 1277. [Google Scholar] [CrossRef] [Green Version]
  36. Ćurlin, T. Twitter usage in tourism: Literature review. Bus. Syst. Res. 2019, 10, 102–119. [Google Scholar] [CrossRef] [Green Version]
  37. Rodrigues, H.; Brochado, A.; Troilo, M.; Mohsin, A. Mirror, mirror on the wall, who’s the fairest of them all? A critical content analysis on medical tourism. Tour. Manag. Perspect. 2017, 24, 16–25. [Google Scholar] [CrossRef]
  38. Chiu, W.; Fan, T.C.M.; Nam, S.-B.; Sun, P.-H. Knowledge mapping and sustainable development of eSports research: A bibliometric and visualized analysis. Sustainability 2021, 13, 10354. [Google Scholar] [CrossRef]
  39. Alonso, M.A.; Vilares, D.; Gómez-Rodríguez, C.; Vilares, J. Sentiment Analysis for Fake News Detection. Electronics 2021, 10, 1348. [Google Scholar] [CrossRef]
  40. Sotiriadou, P.; Brouwers, J.; Le, T.-A. Choosing a qualitative data analysis tool: A comparison of NVivo and Leximancer. Ann. Leis. Res. 2014, 17, 218–234. [Google Scholar] [CrossRef] [Green Version]
  41. Chiu, W.; Cho, H. Mapping aboriginal tourism experiences in Taiwan: A case of the Formosan Aboriginal Culture Village. J. Vacat. Mark. 2021, 27, 17–31. [Google Scholar] [CrossRef]
  42. Chiu, W.; Leng, H.K. Let’s go cycling: An analysis of tourists’ experience on online user-generated content. Int. J. Tour. Cities 2017, 3, 30–42. [Google Scholar] [CrossRef]
  43. Pearce, P.L.; Wu, M.-Y. Tourists’ evaluation of a romantic themed attraction: Expressive and instrumental issues. J. Travel Res. 2016, 55, 220–232. [Google Scholar] [CrossRef]
  44. Smith, A.E.; Humphreys, M.S. Evaluation of unsupervised semantic mapping of natural language with Leximancer concept mapping. Behav. Res. Methods 2006, 38, 262–279. [Google Scholar] [CrossRef] [PubMed] [Green Version]
  45. Kadriu, A.; Abazi, L. A comparison of algorithms for text classification of Albanian news articles. In Proceedings of the ENTRENOVA - ENTerprise REsearch InNOVAtion Conference, Dubrovnik, Croatia, 7–9 September 2017; 3, pp. 62–68. [Google Scholar]
  46. Watson, M.; Smith, A.; Watter, S. Leximancer concept mapping of patient case studies. In Proceedings of the International Conference on Knowledge-Based and Intelligent Information and Engineering Systems, Melbourne, Australia, 14–16 September 2005; pp. 1232–1238. [Google Scholar]
  47. Angus, D.; Rintel, S.; Wiles, J. Making sense of big text: A visual-first approach for analysing text data using Leximancer and Discursis. Int. J. Soc. Res. Methodol. 2013, 16, 261–267. [Google Scholar] [CrossRef]
  48. Crofts, K.; Bisman, J. Interrogating accountability: An illustration of the use of Leximancer software for qualitative data analysis. Qual. Res. Account. Manag. 2010, 7, 180–207. [Google Scholar] [CrossRef]
  49. Dang, C.N.; Moreno-García, M.N.; Prieta, F.D.l. An Approach to Integrating Sentiment Analysis into Recommender Systems. Sensors 2021, 21, 5666. [Google Scholar] [CrossRef]
  50. Kauffmann, E.; Peral, J.; Gil, D.; Ferrández, A.; Sellers, R.; Mora, H. Managing marketing decision-making with sentiment analysis: An evaluation of the main product features using text data mining. Sustainability 2019, 11, 4235. [Google Scholar] [CrossRef] [Green Version]
  51. Leximancer. Leximancer User Guide. Available online: https://doc.leximancer.com/doc/LeximancerManual.pdf (accessed on 12 November 2022).
  52. Wilk, V.; Soutar, G.N.; Harrigan, P. Tackling social media data analysis. Qual. Mark. Res. Int. J. 2019, 22, 94–113. [Google Scholar] [CrossRef]
  53. Wu, M.-Y.; Wall, G.; Pearce, P.L. Shopping experiences: International tourists in Beijing’s Silk Market. Tour. Manag. 2014, 41, 96–106. [Google Scholar] [CrossRef]
  54. Rapp, A.; Tirabeni, L. Self-tracking while doing sport: Comfort, motivation, attention and lifestyle of athletes using personal informatics tools. Int. J. Hum.-Comput. Stud. 2020, 140, 102434. [Google Scholar] [CrossRef]
  55. Rapp, A.; Cena, F. Personal informatics for everyday life: How users without prior self-tracking experience engage with personal data. Int. J. Hum.-Comput. Stud. 2016, 94, 1–17. [Google Scholar] [CrossRef]
  56. Park, N.; Kee, K.F.; Valenzuela, S. Being immersed in social networking environment: Facebook groups, uses and gratifications, and social outcomes. Cyberpsychol. Behav. 2009, 12, 729–733. [Google Scholar] [CrossRef] [Green Version]
  57. Kim, B.; Yoo, M.; Yang, W. Online engagement among restaurant customers: The importance of enhancing flow for social media users. J. Hosp. Tour. Res. 2020, 44, 252–277. [Google Scholar] [CrossRef]
  58. Lemire, M.; Paré, G.; Sicotte, C.; Harvey, C. Determinants of Internet use as a preferred source of information on personal health. Int. J. Med. Inf. 2008, 77, 723–734. [Google Scholar] [CrossRef] [PubMed]
  59. Chuan-Chuan Lin, J.; Lu, H. Towards an understanding of the behavioural intention to use a web site. Int. J. Inf. Manag. 2000, 20, 197–208. [Google Scholar] [CrossRef]
  60. Cline, R.J.; Haynes, K.M. Consumer health information seeking on the Internet: The state of the art. Health Educ. Res. 2001, 16, 671–692. [Google Scholar] [CrossRef] [PubMed] [Green Version]
  61. Rizaldi, D.P.; Saraswati, T.G. A Factor Analysis of Consumer Purchase Decison of Paid Games Application in the Appstore of Iphone. Eproceedings Manag. 2019, 6, 3838–3844. [Google Scholar]
  62. Hoffman, D.L.; Novak, T.P. Marketing in hypermedia computer-mediated environments: Conceptual foundations. J. Mark. 1996, 60, 50–68. [Google Scholar] [CrossRef]
  63. Razzouk, N.; Seitz, V.A. Banner advertising and consumer recall: An empirical study. J. Promot. Manag. 2002, 9, 71–80. [Google Scholar] [CrossRef]
  64. Cavalleri, N. Localization testing is more than testing the translation. Test. Exp. 2014, 27. [Google Scholar]
  65. Abufardeh, S.; Magel, K. Software internationalization: Testing methods for bidirectional software. In Proceedings of the 2009 Fifth International Joint Conference on INC, IMS and IDC, Seoul, Republic of Korea, 25–27 August 2009; pp. 226–231. [Google Scholar]
  66. Beldad, A.D.; Hegner, S.M. Expanding the Technology Acceptance Model with the Inclusion of Trust, Social Influence, and Health Valuation to Determine the Predictors of German Users’ Willingness to Continue using a Fitness App: A Structural Equation Modeling Approach. Int. J. Hum.-Comput. Interact. 2018, 34, 882–893. [Google Scholar] [CrossRef] [Green Version]
  67. Byun, H.; Chiu, W.; Bae, J.-s. Exploring the adoption of sports brand apps: An application of the modified technology acceptance model. Int. J. Asian Bus. Inf. Manag. 2018, 9, 52–65. [Google Scholar] [CrossRef]
  68. Lee, H.E.; Cho, J. What motivates users to continue using diet and fitness apps? Application of the uses and gratifications approach. Health Commun. 2017, 32, 1445–1453. [Google Scholar] [CrossRef]
  69. Ohk, K.; Park, S.-B.; Hong, J.-W. The influence of perceived usefulness, perceived ease of use, interactivity, and ease of navigation on satisfaction in mobile application. Adv. Sci. Technol. Lett. 2015, 84, 88–92. [Google Scholar]
  70. Lee, S.; Kim, S.; Wang, S. Motivation factors influencing intention of mobile sports apps use by applying the unified theory of acceptance and use of technology (UTAUT). Int. J. Appl. Sport. Sci. (IJASS) 2017, 29, 115–127. [Google Scholar] [CrossRef]
  71. Mbete, G.S.; Tanamal, R. Effect of Easiness, Service Quality, Price, Trust of Quality of Information, and Brand Image of Consumer Purchase Decision on Shopee Online Purchase. J. Inform. Univ. Pamulang 2020, 5, 100. [Google Scholar] [CrossRef]
  72. McLean, G.; Osei-Frimpong, K.; Al-Nabhani, K.; Marriott, H. Examining consumer attitudes towards retailers’m-commerce mobile applications–An initial adoption vs. continuous use perspective. J. Bus. Res. 2020, 106, 139–157. [Google Scholar] [CrossRef]
  73. Cho, H.; Chi, C.; Chiu, W. Understanding sustained usage of health and fitness apps: Incorporating the technology acceptance model with the investment model. Technol. Soc. 2020, 63, 101429. [Google Scholar] [CrossRef]
  74. Chiu, W.; Oh, G.-E.G.; Cho, H. Factors influencing consumers’ adoption of wearable technology: A systematic review and meta-analysis. Int. J. Inf. Technol. Decis. Mak. 2021, 20, 933–958. [Google Scholar] [CrossRef]
  75. Pobiruchin, M.; Suleder, J.; Zowalla, R.; Wiesner, M. Accuracy and adoption of wearable technology used by active citizens: A marathon event field study. JMIR Mhealth Uhealth 2017, 5, e6395. [Google Scholar] [CrossRef] [PubMed] [Green Version]
  76. Konharn, K.; Eungpinichpong, W.; Promdee, K.; Sangpara, P.; Nongharnpitak, S.; Malila, W.; Karawa, J. Validity and reliability of smartphone applications for the assessment of walking and running in normal-weight and overweight/obese young adults. J. Phys. Act. Health 2016, 13, 1333–1340. [Google Scholar] [CrossRef] [PubMed]
  77. Yuan, S.; Ma, W.; Kanthawala, S.; Peng, W. Keep using my health apps: Discover users’ perception of health and fitness apps with the UTAUT2 model. Telemed. E-Health 2015, 21, 735–741. [Google Scholar] [CrossRef]
  78. Higgins, J.P. Smartphone Applications for Patients’ Health and Fitness. Am. J. Med. 2016, 129, 11–19. [Google Scholar] [CrossRef] [Green Version]
  79. Gowin, M.; Cheney, M.; Gwin, S.; Franklin Wann, T. Health and fitness app use in college students: A qualitative study. Am. J. Health Educ. 2015, 46, 223–230. [Google Scholar] [CrossRef]
  80. Bhave, K.; Jain, V.; Roy, S. Understanding the orientation of gen Y toward mobile applications and in-app advertising in India. Int. J. Mob. Mark. 2013, 8, 62–74. [Google Scholar]
  81. Lamond, N. Why Do People Uninstall Apps? Available online: https://www.phonenomena.com.au/blog/2015/10/14/why-do-people-uninstall-apps/ (accessed on 12 November 2022).
  82. Backes, M.; Bugiel, S.; Derr, E. Reliable third-party library detection in android and its security applications. In Proceedings of the 2016 ACM SIGSAC Conference on Computer and Communications Security, Vienna, Austria, 24–28 October 2016; pp. 356–367. [Google Scholar]
  83. Chen, X.; Zhao, Y.; Cui, Z.; Meng, G.; Liu, Y.; Wang, Z. Large-scale empirical studies on effort-aware security vulnerability prediction methods. IEEE Trans. Reliab. 2019, 69, 70–87. [Google Scholar] [CrossRef]
  84. Tao, G.; Zheng, Z.; Guo, Z.; Lyu, M.R. MalPat: Mining patterns of malicious and benign Android apps via permission-related APIs. IEEE Trans. Reliab. 2017, 67, 355–369. [Google Scholar] [CrossRef]
  85. Chiu, W.; Cho, H.; Chi Christina, G. Consumers’ continuance intention to use fitness and health apps: An integration of the expectation–confirmation model and investment model. Inf. Technol. People 2021, 34, 978–998. [Google Scholar] [CrossRef]
  86. Chiu, W.; Cho, H. The role of technology readiness in individuals’ intention to use health and fitness applications: A comparison between users and non-users. Asia Pac. J. Mark. Logist. 2021, 33, 807–825. [Google Scholar] [CrossRef]
Figure 1. The extraction process of Leximancer analysis (Adopted from Crofts and Bisman 2010).
Jtaer 18 00010 g001
Figure 2. Theme map of users’ reviews of running applications.
Jtaer 18 00010 g002
Table 1. Leximancer concept frequencies.
ConceptFrequencies%ConceptFrequencies%
app10852100training4634
use459742keeps4584
track299628walking4564
running289627progress4484
love178016nice4484
work172116update4444
time163715speed4324
distance141713voice4174
accurate10079pace4124
free10009start4014
easy9709user3653
features9669rate3443
version9279stop3433
need7867ads3243
best7407map3133
phone6326route3073
miles5855watch3013
useful5555day2963
data5515option2803
better5495band2793
workout5245support2682
fitness4895sleep2502
calories4814down2242
premium4634account1922
Table 2. Sentiment analysis results.
Positive TermsScoreNegative TermsScore
great11.93problem8.29
good11.79annoying7.82
accurate10.61bad7.7
easy10.55wrong7.54
best10.24disappointed7.47
nice9.66frustrating7.11
awesome9.21slow7.01
helpful9.11poor6.83
friendly8.81worst6.67
excellent8.61difficult6.55
happy8.55failed6.45
reliable8.41worse6.36
accuracy8.39terrible6.34
fantastic8.29fault6.29
performance8.09complicated6.27
fast7.67shame5.93
wonderful7.53trouble5.93
satisfied7.53negative5.85
convenient7.03sad5.66
impressed7lack5.61
quick6.94horrible5.61
user6.88unreliable5.61
effective6.76rubbish5.55
stable6.69crap5.49
Disclaimer/Publisher’s Note: The statements, opinions and data contained in all publications are solely those of the individual author(s) and contributor(s) and not of MDPI and/or the editor(s). MDPI and/or the editor(s) disclaim responsibility for any injury to people or property resulting from any ideas, methods, instructions or products referred to in the content.

